
Quality Evaluation of the Traditional Chinese Medicine Moutan Cortex Based on UPLC Fingerprinting and Chemometrics Analysis

Abstract
:1. Introduction
2. Materials and Methods
2.1. Plant Materials and Reagents
2.2. Sample Preparation
2.3. UPLC Analysis
2.4. Data Analysis
3. Results and Discussion
3.1. Optimum Conditions for UPLC Analysis
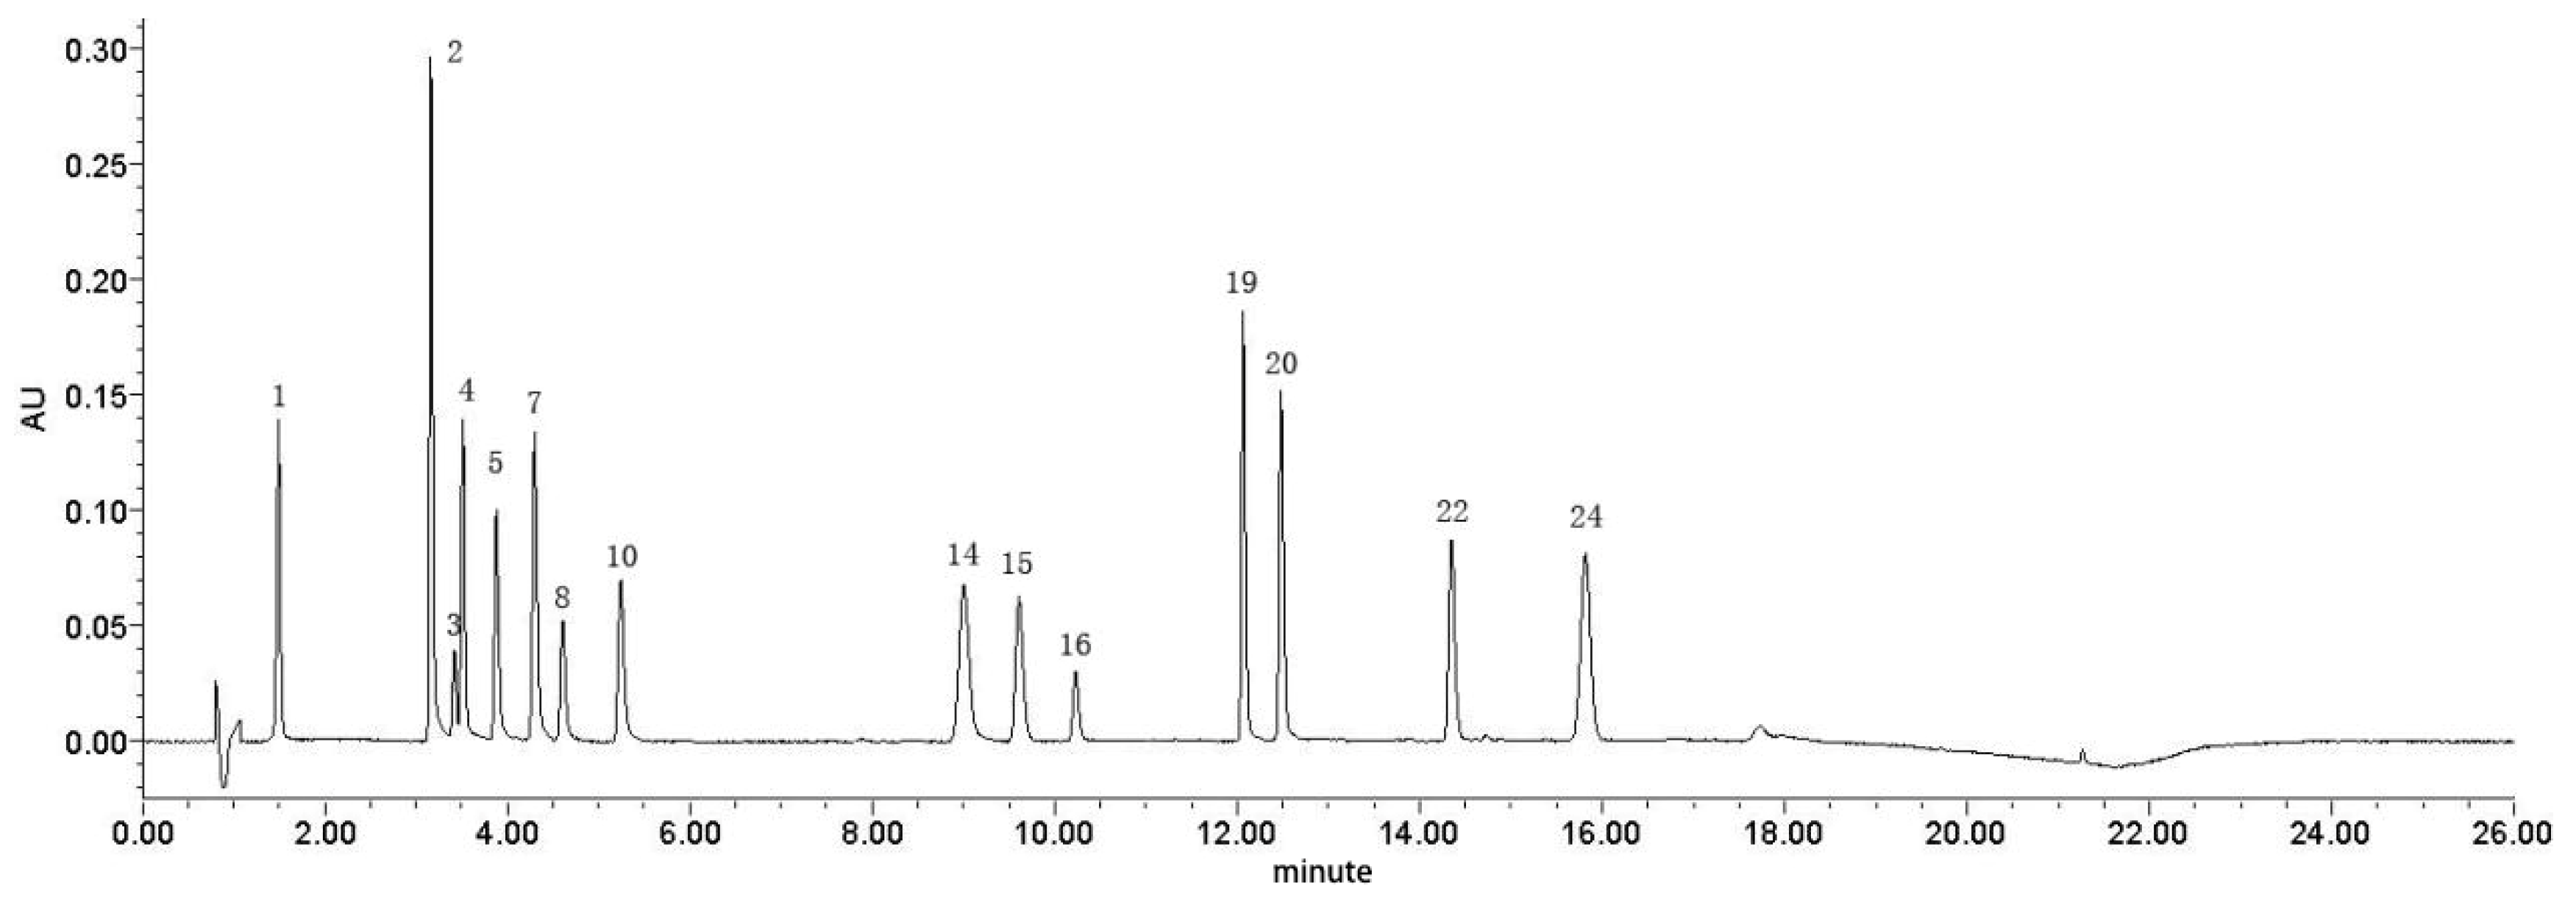
3.2. Establishing a UPLC Fingerprint of Moutan Cortex
3.3. Relative Retention Times and Relative Peak Areas
3.4. Similarity Analysis
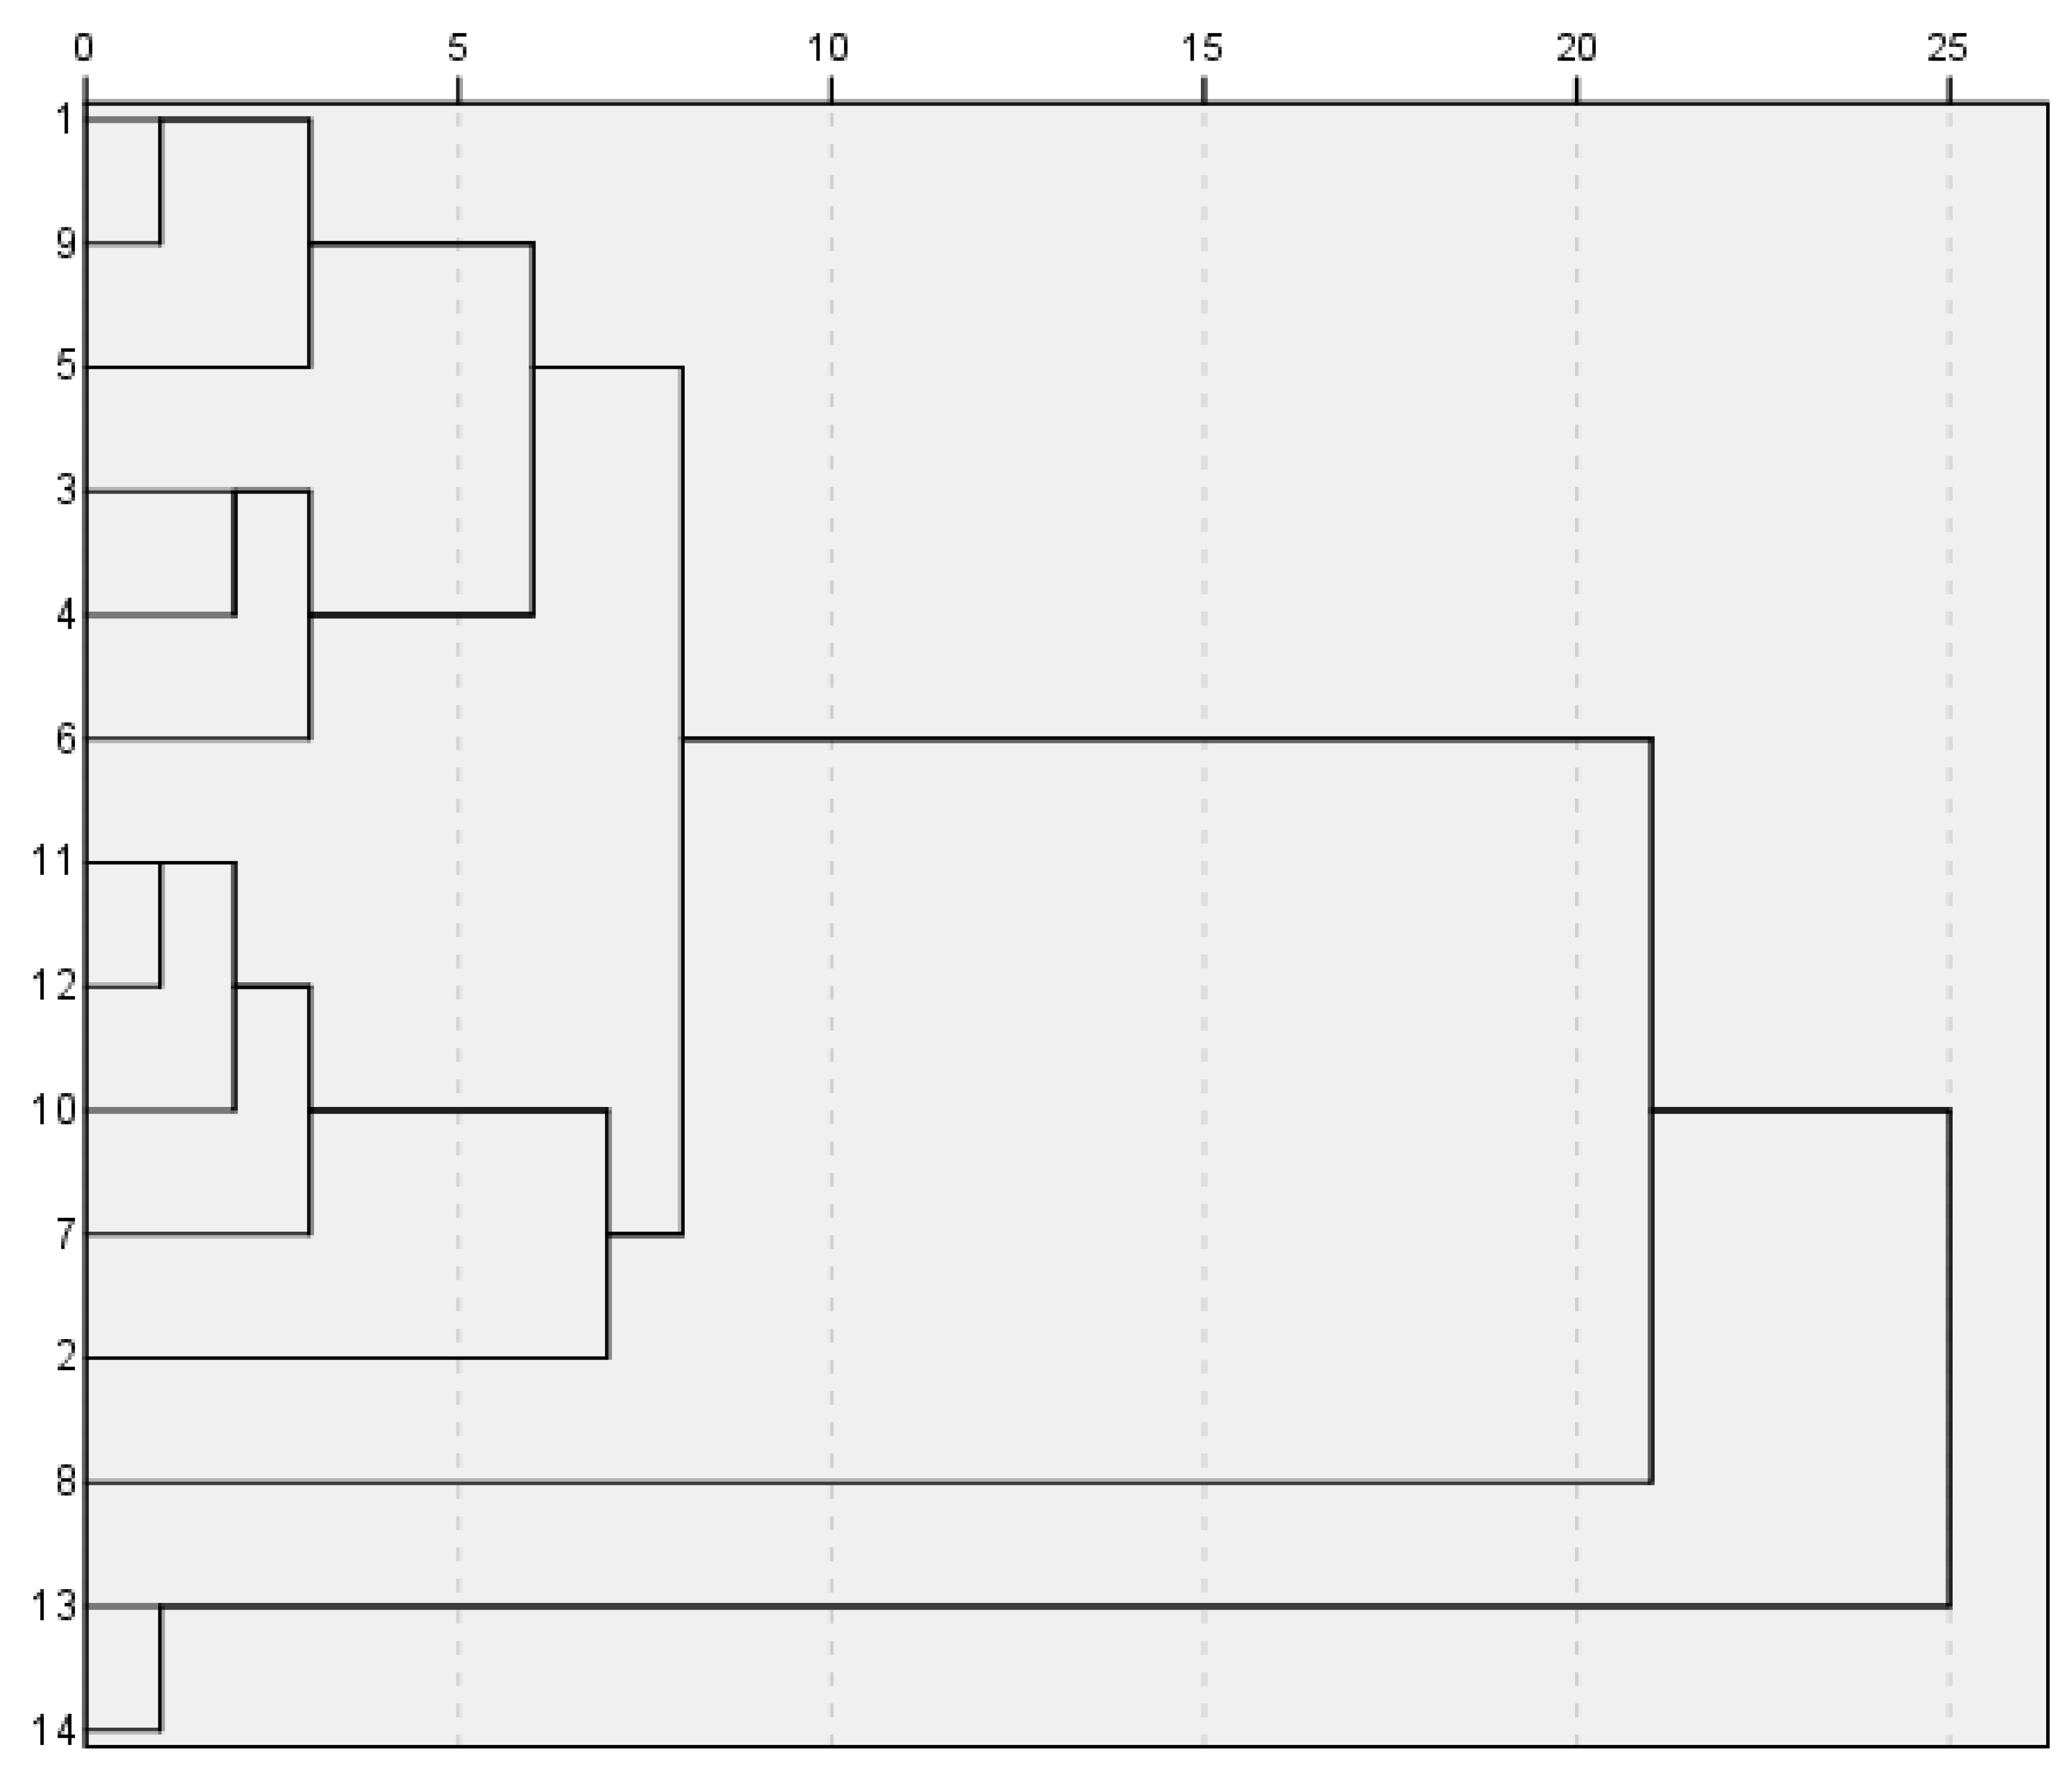
3.5. CA
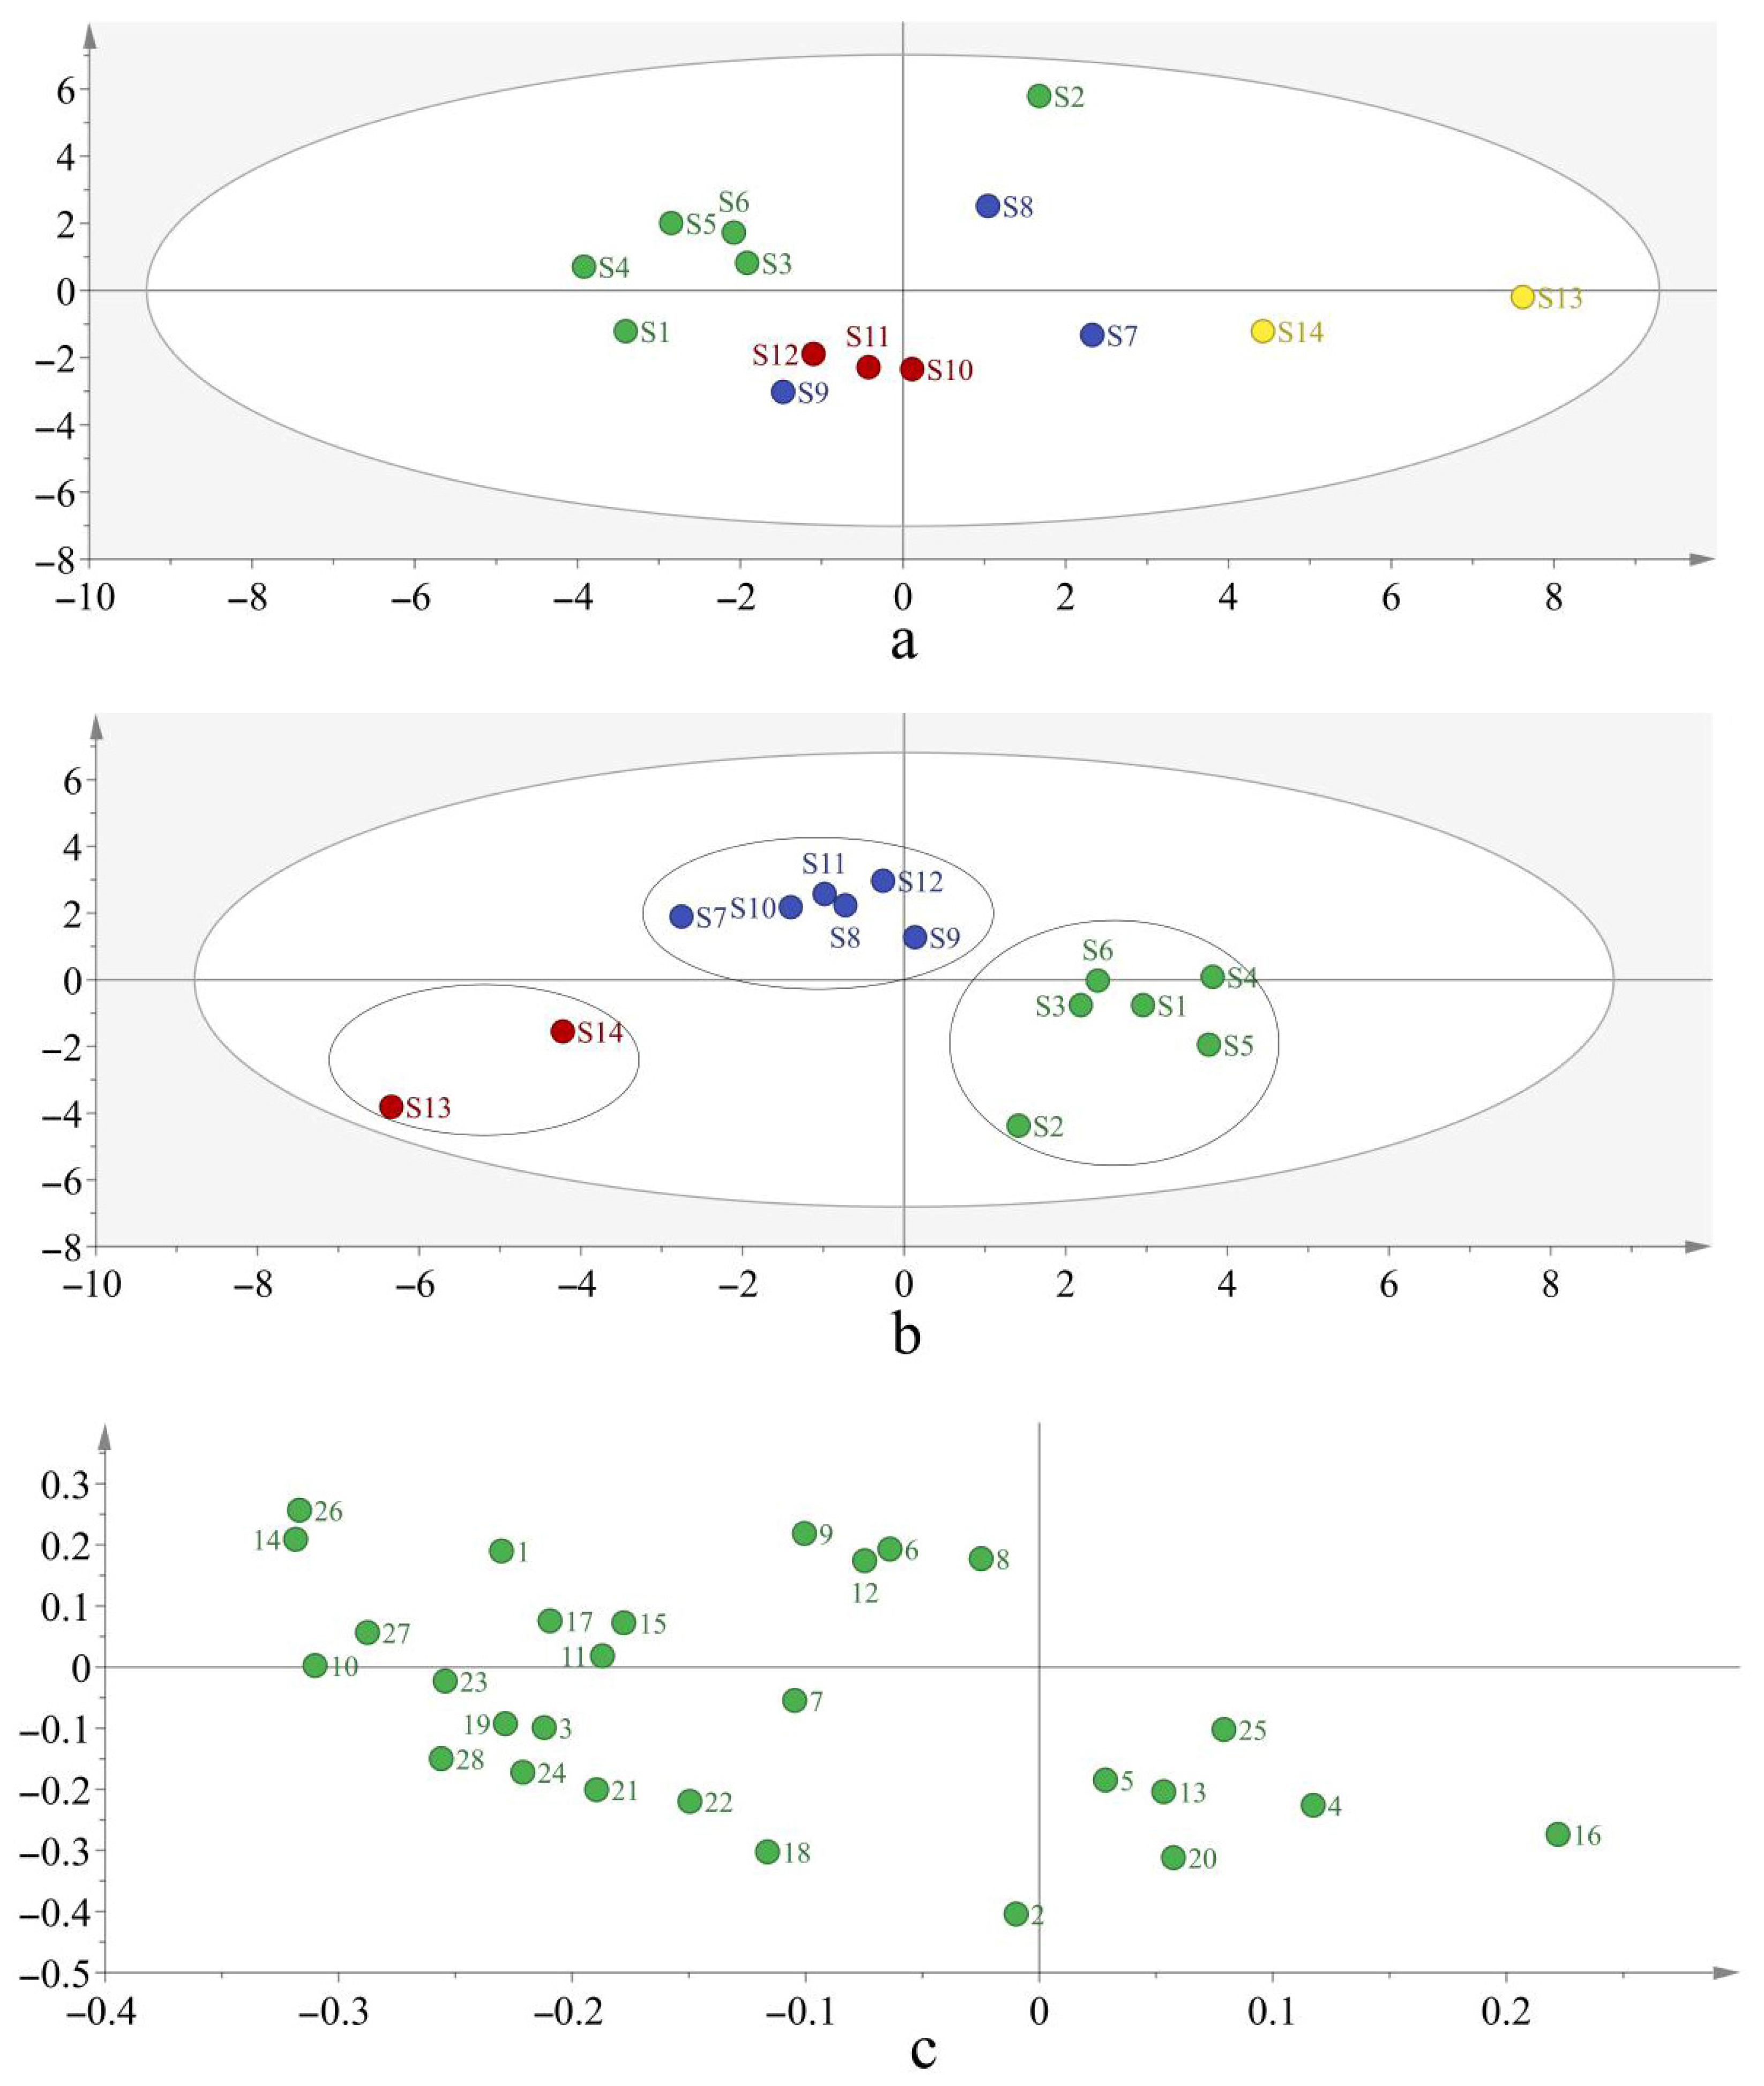
3.6. PCA and PLS-DA
3.7. Identification of Chemical Composition
3.8. Method Validation
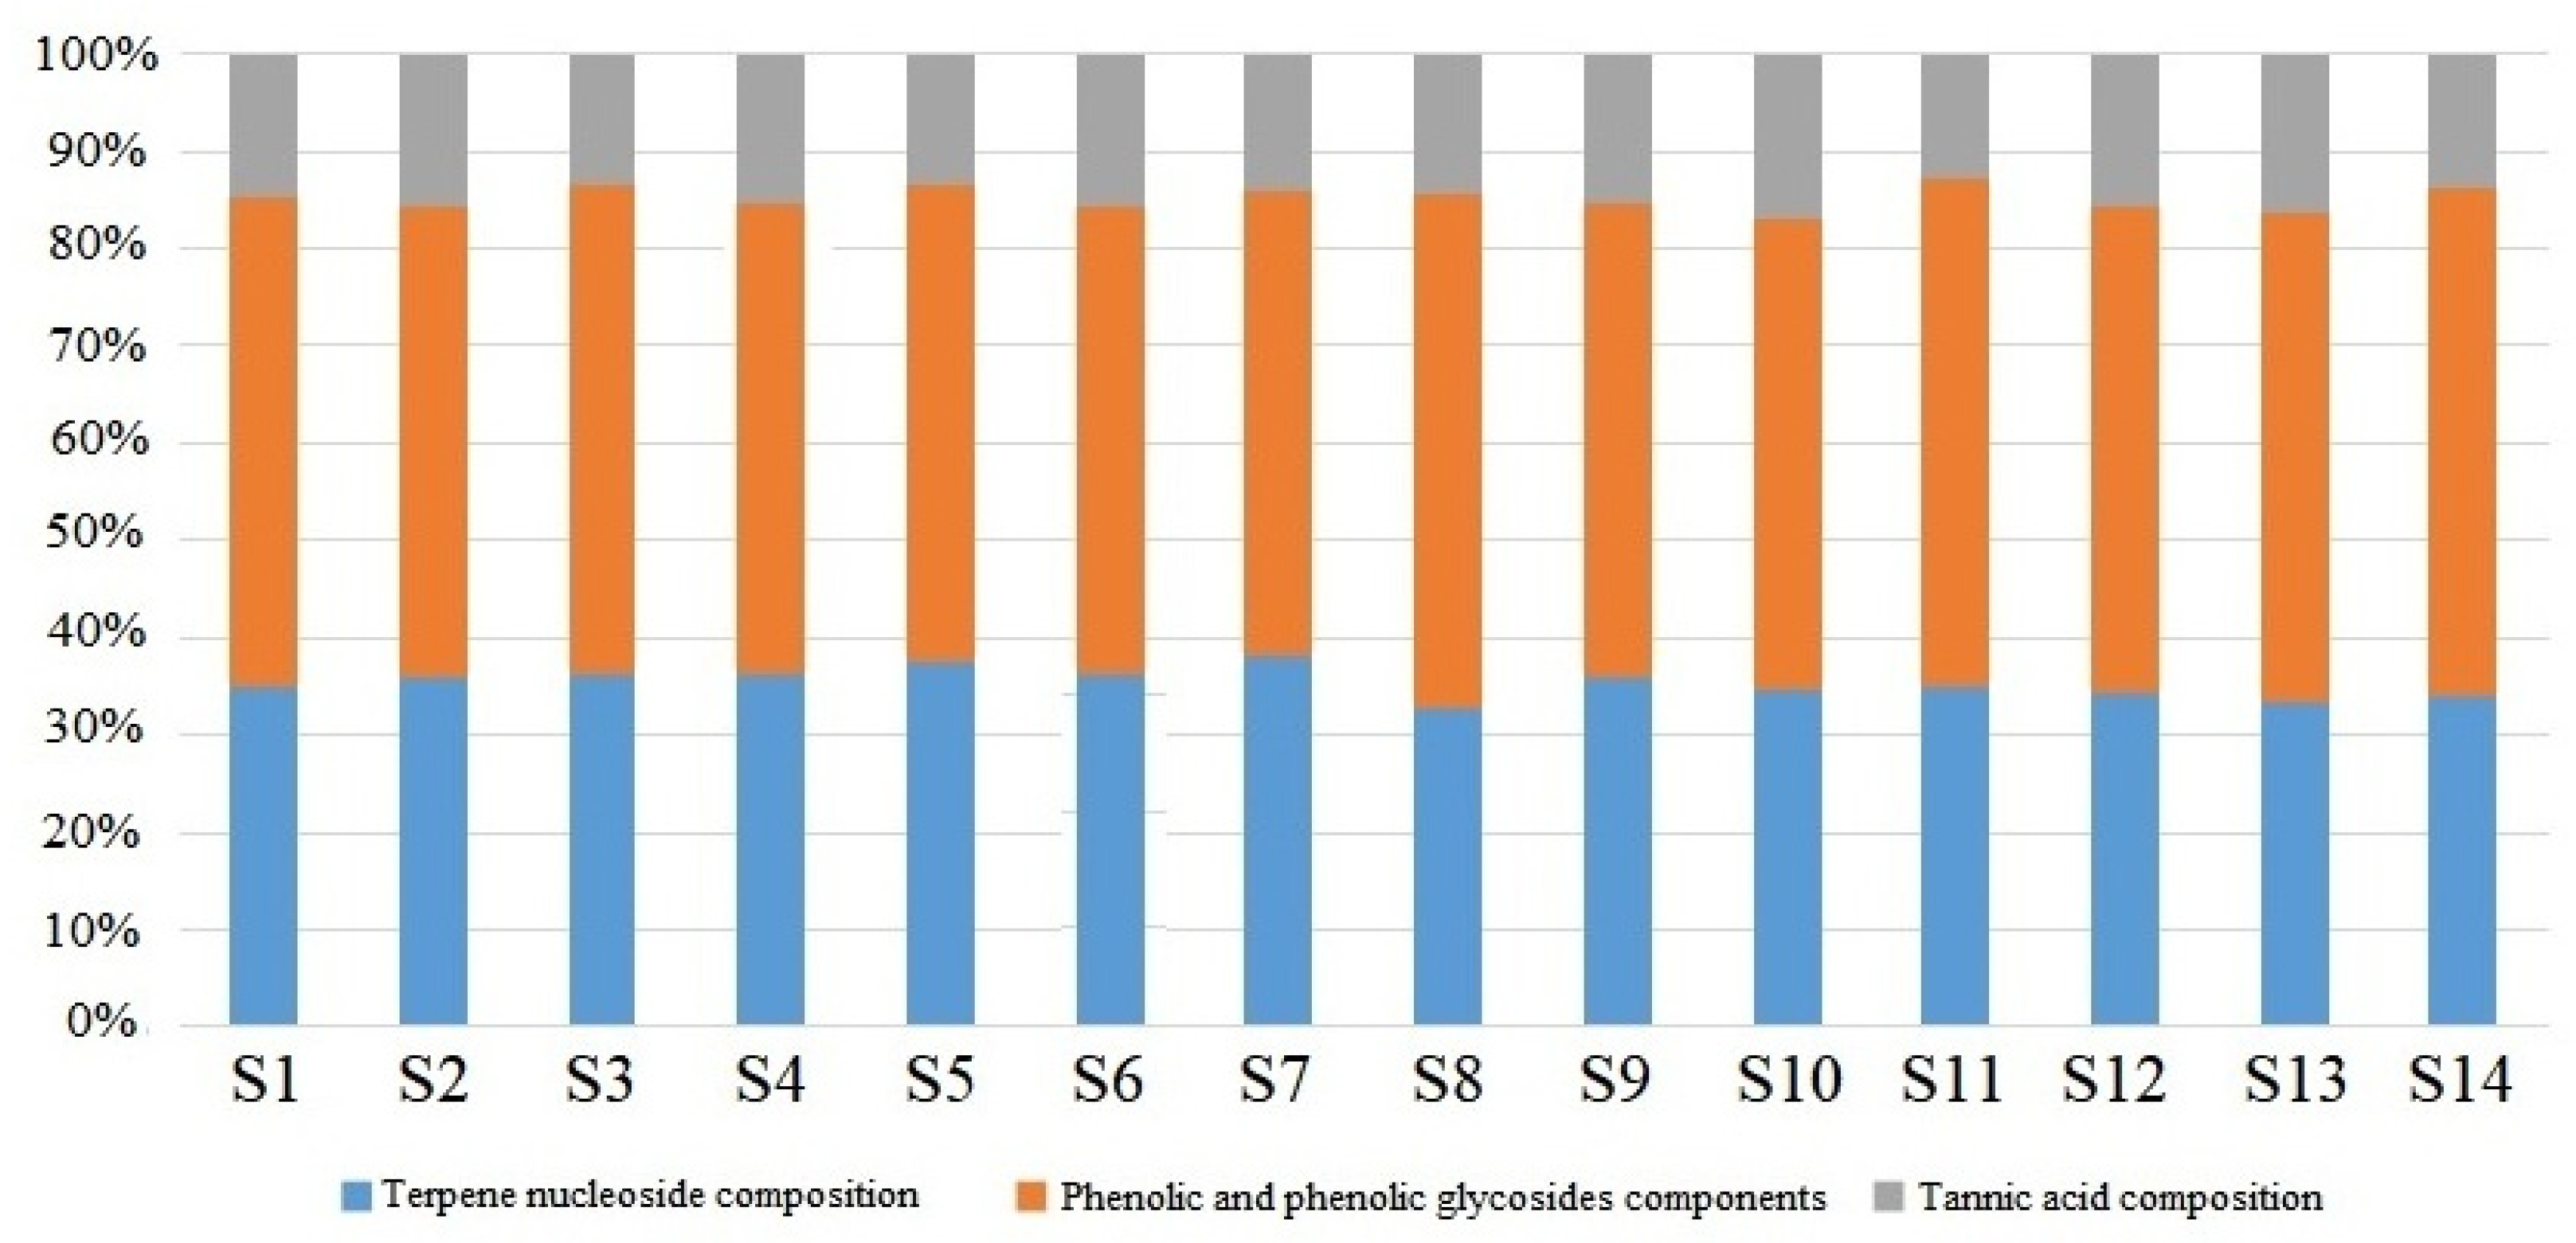
3.9. Analysis of Chemical Composition Content
4. Conclusions
Supplementary Materials
Author Contributions
Funding
Institutional Review Board Statement
Informed Consent Statement
Data Availability Statement
Acknowledgments
Conflicts of Interest
Abbreviations
References
- Aga, E.B.; Nie, L.J.; Zhuoma, D.Z.; Wang, J.L. Evaluation of quality of Onosma hookeri from different sources by quantitative analysis of multi-index components and fingerprint analysis. China J. Chin. Mater. Med. 2015, 40, 4442–4445. [Google Scholar] [CrossRef]
- Dong, L.; Sun, Y.; Pei, W.X.; Dai, J.D.; Prince, Y.; Pan, M.; Chen, J.P.; Wang, Y. Discussion on the research idea of a standardization system of traditional Chinese medicine based on the whole process quality control concept. China J. Chin. Mater. Med. 2017, 42, 4481–4487. [Google Scholar] [CrossRef]
- Hou, J.; Guo, H.R.; Yang, F.D.; Shao, S.J. Comprehensive evaluation of the quality of Glycyrrhiza uralensis produced by multiple indicator components combined with chemometrics. J. Chin. Tradit. Herb. Med. 2019, 50, 3923–3929. [Google Scholar] [CrossRef]
- Hu, X.T.; Ding, L.Q.; Cao, S.J.; Cheng, L.N.; Wang, K.; Guang, C.X.; Li, W.; Koike, K.; Qiu, F. Pharmacokinetics, tissue distribution and excretion of paeonol and its major metabolites in rats provide a further insight into paeonol effectiveness. Front. Pharmacol. 2020, 11, 190. [Google Scholar] [CrossRef] [PubMed]
- Huang, Z.Q.; Wang, T.T.; Ma, Y.Y.; Zhang, Y.F.; Hu, M.X.; Wu, B. Study on quality evaluation of radix puerariae based on multi-index component content and antioxidant activity. J. Chin. Tradit. Herb. Med. 2018, 49, 1667–1676. [Google Scholar] [CrossRef]
- Jang, M.H.; Kim, K.Y.; Song, P.H.; Baek, S.Y.; Seo, H.L.; Lee, E.H.; Lee, S.G.; Park, K.W.; Ahn, S.C.; Kim, S.C.; et al. Moutan Cortex protects hepatocytes against oxidative injury through AMP-activated protein kinase pathway. Biol. Pharm. Bull. 2017, 40, 797–806. [Google Scholar] [CrossRef] [PubMed]
- Jia, X.B. Research and development of traditional Chinese medicine based on the material basis of holistic view. J. Med. Public Health 2017, 19, 1430–1434. [Google Scholar] [CrossRef]
- Jiao, M.J.; Deng, Z.; Zhang, J.; Wang, S.H.; Cui, W.J.; Zhang, G.Z.; Liu, A. A study on the preparation and quality standard of Chinese herbal decoction with volatile components—A case study of peony peel. China J. Chin. Mater. Med. 2018, 43, 891–896. [Google Scholar] [CrossRef]
- Jin, L.; Wu, Y.Y.; Dai, X.W.; Li, H.F. Quality evaluation of multi-stem building based on multi-index component content determination and HPLC fingerprint. J. Chin. Tradit. Herb. Med. 2019, 50, 3178–3186. [Google Scholar] [CrossRef]
- Kee, J.Y.; Inujima, A.; Andoh, T.; Tanaka, K.; Li, F.; Kuraishi, Y.; Sakurai, H.; Shibahara, N.; Saiki, I.; Koizumi, K. Inhibitory effect of Moutan Cortex aqueous fraction on mast cell-mediated allergic inflammation. J. Nat. Med. 2015, 69, 209–217. [Google Scholar] [CrossRef] [PubMed]
- Li, M.Y. Study on HPLC fingerprint of xinmai tong capsule and chemical pattern recognition. J. Chin. Pharm. Anal. 2020, 40, 1104–1112. [Google Scholar] [CrossRef]
- Li, W.B.; Xu, L.; Lu, J.R.; Xing, L.; Liu, Y.; Hu, C.J. A study on quality control of loquat leaf honey before and after processing based on HPLC fingerprinting. China J. Chin. Mater. Med. 2020, 51, 3444–3450. [Google Scholar] [CrossRef]
- Li, X.Y.; Xu, J.D.; Zhou, S.S.; Kong, M.; Xu, Y.Y.; Zou, Y.T.; Tang, Y.; Zhou, L.; Xu, M.Z.; Xu, J.; et al. Time segment scanning-based quasi-multiple reaction monitoring mode by ultra-performance liquid chromatography coupled with quadrupole/time-of-flight mass spectrometry for quantitative determination of herbal medicines: Moutan Cortex, a case study. J. Chromatogr. A 2018, 1581–1582, 33–42. [Google Scholar] [CrossRef] [PubMed]
- Liu, D.F.; Zhao, L.N.; Li, Y.F.; Jin, C.D. Research progress and application of fingerprinting in traditional Chinese medicine. China J. Chin. Mater. Med. 2016, 47, 4085–4094. [Google Scholar] [CrossRef]
- Peng, H.S.; Wang, D.Q.; Peng, D.Y.; Huang, L.Q. A textual research and investigation on the base of medicinal peony. China J. Chin. Mater. Med. 2017, 42, 1632–1636. [Google Scholar] [CrossRef]
- Pharmacopoeia Commission, Ministry of Health of the People’s Republic of China. Pharmacopoeia of the People’s Republic of China; China Medical Science Press: Beijing, China, 2020; Volume 1. [Google Scholar]
- Sun, L.L.; Wang, M.; Ren, X.L. Application of a chemical pattern recognition method in the quality control of traditional Chinese medicine. J. Chin. Tradit. Herb. Med. 2017, 48, 4339–4345. [Google Scholar] [CrossRef]
- Wang, Z.Q.; He, C.; Peng, Y.; Chen, F.H.; Xiao, P.G. Origins, phytochemistry, pharmacology, analytical methods and safety of cortex moutan (Paeonia suffruticosa Andrew): A systematic review. Molecules 2017, 22, 946. [Google Scholar] [CrossRef] [PubMed]
- Wang, Z.Q.; Shen, J.; Li, P.; Liu, S.S.; Yi, F.; Liu, H.B.; Wu, F.R.; He, C.N.; Chen, F.H.; Xiao, P.G. Research on quality markers of Moutan Cortex: Quality evaluation and quality standards of Moutan Cortex. J. Chin. Tradit. Herb. Med. 2017, 9, 307–320. [Google Scholar] [CrossRef]
- Wong, K.H.; Razmovski-Naumovski, V.; Li, K.M.; Li, G.Q.; Chan, K. Differentiating Puerariae lobatae radix and Puerariae Thomsonii radix using HPTLC coupled with multivariate classification analyses. J. Pharm. Biomed. Anal. 2014, 95, 11–19. [Google Scholar] [CrossRef] [PubMed]
- Xia, Y.Q.; Zhu, M.M.; Li, R.; Yang, L.C.; Gao, S.; Cao, S.M.; Feng, L.; Jia, X.B. Study on the structural characteristics of the basic material components in peony skin. China J. Chin. Mater. Med. 2020, 45. [Google Scholar] [CrossRef]

| No. | Longitude Latitude | Longitude Latitude |
|---|---|---|
| S1 | 117°59′54″ | 30°52′24″ |
| S2 | 117°59′18″ | 30°52′40″ |
| S3 | 118°01′34″ | 30°51′20″ |
| S4 | 118°05′32″ | 30°49′01″ |
| S5 | 118°17′48″ | 30°58′00″ |
| S6 | 117°59′28″ | 30°49′17″ |
| S7 | 115°53′13″ | 33°58′30″ |
| S8 | 115°52′43″ | 33°54′18″ |
| S9 | 115°57′40″ | 33°43′14″ |
| S10 | 117°40′40″ | 35°20′14″ |
| S11 | 117°46′21″ | 35°24′16″ |
| S12 | 117°45′28″ | 35°24′32″ |
| S13 | 112°45′37″ | 33°28′37″ |
| S14 | 112°37′42″ | 33°27′27″ |
| S1 | S2 | S3 | S4 | S5 | S6 | S7 | S8 | S9 | S10 | S11 | S12 | S13 | S14 | |
|---|---|---|---|---|---|---|---|---|---|---|---|---|---|---|
| S1 | 1.000 | |||||||||||||
| S2 | 0.958 | 1.000 | ||||||||||||
| S3 | 0.975 | 0.979 | 1.000 | |||||||||||
| S4 | 0.975 | 0.969 | 0.987 | 1.000 | ||||||||||
| S5 | 0.987 | 0.980 | 0.978 | 0.969 | 1.000 | |||||||||
| S6 | 0.944 | 0.963 | 0.984 | 0.983 | 0.945 | 1.000 | ||||||||
| S7 | 0.977 | 0.983 | 0.988 | 0.988 | 0.980 | 0.972 | 1.000 | |||||||
| S8 | 0.839 | 0.909 | 0.925 | 0.906 | 0.853 | 0.961 | 0.904 | 1.000 | ||||||
| S9 | 0.988 | 0.959 | 0.969 | 0.976 | 0.973 | 0.945 | 0.985 | 0.851 | 1.000 | |||||
| S10 | 0.972 | 0.962 | 0.977 | 0.993 | 0.958 | 0.975 | 0.989 | 0.902 | 0.985 | 1.000 | ||||
| S11 | 0.966 | 0.967 | 0.992 | 0.988 | 0.959 | 0.990 | 0.984 | 0.941 | 0.967 | 0.987 | 1.000 | |||
| S12 | 0.959 | 0.961 | 0.982 | 0.991 | 0.948 | 0.985 | 0.985 | 0.931 | 0.972 | 0.996 | 0.993 | 1.000 | ||
| S13 | 0.979 | 0.968 | 0.970 | 0.981 | 0.971 | 0.956 | 0.984 | 0.868 | 0.990 | 0.989 | 0.970 | 0.978 | 1.000 | |
| S14 | 0.985 | 0.967 | 0.976 | 0.982 | 0.974 | 0.956 | 0.988 | 0.867 | 0.994 | 0.991 | 0.975 | 0.981 | 0.996 | 1.000 |
| R | 0.981 | 0.982 | 0.993 | 0.994 | 0.978 | 0.984 | 0.996 | 0.918 | 0.985 | 0.994 | 0.993 | 0.992 | 0.989 | 0.991 |
| No. | Regression Equation | Linear Range (μg/mL) | R2 | Precision (RSD%) | Stability | Repeatability | Recovery | ||
|---|---|---|---|---|---|---|---|---|---|
| Intraday | Interday | (RSD%, n = 6) | (RSD%, n = 6) | Mean | RSD% | ||||
| (n = 6) | (n = 3) | ||||||||
| peak 1 | Y = 6292.3X + 901.11 | 0.67~67.17 | 0.9995 | 1.96 | 2.01 | 0.45 | 1.56 | 99.00 | 1.68 |
| Peak 2 | Y = 8333.7X + 968.99 | 0.94~93.73 | 0.9996 | 0.55 | 0.62 | 0.59 | 1.98 | 99.61 | 2.27 |
| Peak 3 | Y = 1474.1X + 2855.2 | 0.79~78.85 | 0.9996 | 1.91 | 1.98 | 1.62 | 1.08 | 98.22 | 2.18 |
| Peak 4 | Y = 6302.4X + 8720.7 | 0.69~68.57 | 0.9997 | 0.52 | 0.55 | 0.63 | 1.90 | 96.36 | 2.19 |
| Peak 5 | Y = 3217.4X + 8491.9 | 1.11~111.40 | 0.9998 | 1.18 | 1.45 | 0.59 | 1.48 | 97.48 | 1.86 |
| Peak 7 | Y = 3016.6X − 1758.8 | 0.25~250.00 | 0.9991 | 0.87 | 1.12 | 0.31 | 0.35 | 99.17 | 1.89 |
| Peak 8 | Y = 3419.9X + 5805.2 | 0.67~67.10 | 0.9998 | 1.74 | 1.99 | 1.21 | 1.80 | 101.45 | 2.07 |
| Peak 10 | Y = 2480X + 11,696 | 1.14~268.00 | 0.9999 | 1.07 | 1.68 | 1.25 | 0.90 | 109.02 | 2.41 |
| Peak 14 | Y = 7161.9X + 10,447 | 0.77~76.69 | 0.9998 | 1.77 | 1.68 | 0.65 | 1.89 | 109.73 | 1.90 |
| Peak 15 | Y = 3948X + 5354.9 | 0.23~92.86 | 0.9997 | 1.89 | 1.78 | 1.16 | 1.51 | 98.28 | 2.19 |
| Peak 16 | Y = 3046.2X + 5560.8 | 0.99~148.50 | 0.9970 | 1.45 | 1.41 | 0.77 | 0.69 | 99.97 | 2.24 |
| Peak 19 | Y = 8668.6X + 7157.3 | 0.64~64.20 | 0.9995 | 1.79 | 1.81 | 0.84 | 1.66 | 98.82 | 1.75 |
| Peak 20 | Y = 8531.3X + 6545.2 | 0.63~62.70 | 0.9999 | 1.71 | 1.89 | 0.95 | 1.59 | 97.08 | 2.24 |
| Peak 22 | Y = 4192.7X + 5942.2 | 0.99~98.93 | 0.9992 | 1.75 | 1.81 | 0.84 | 1.81 | 96.17 | 1.92 |
| Peak 24 | Y = 3438.3X + 24,737 | 1.48~450.00 | 1.0000 | 1.74 | 1.82 | 1.00 | 0.84 | 111.07 | 1.90 |
| Sample No | Terpene Nucleoside Composition | Phenolic and Phenolic Glycosides Components | Tannic Acid Composition | ||||||||||||
|---|---|---|---|---|---|---|---|---|---|---|---|---|---|---|---|
| Peak 2 | Peak 8 | Peak 10 | Peak 19 | Peak 20 | Peak 22 | Peak 5 | Peak 7 | Peak 24 | Peak 1 | Peak 4 | Peak 14 | Peak 3 | Peak 15 | Peak 16 | |
| S1 | 2.66 ± 0.025 | 0.25 ± 0.001 | 12.80 ± 0.068 | 1.16 ± 0.014 | 0.82 ± 0.002 | 2.68 ± 0.054 | 0.53 ± 0.001 | 1.37 ± 0.014 | 27.28 ± 0.140 | 2.06 ± 0.011 | 1.50 ± 0.011 | 1.37 ± 0.013 | 2.50 ± 0.023 | 0.25 ± 0.008 | 0.83 ± 0.008 |
| S2 | 4.87 ± 0.036 | 0.58 ± 0.002 | 18.67 ± 0.071 | 0.85 ± 0.005 | 1.00 ± 0.014 | 2.41 ± 0.071 | 2.32 ± 0.014 | 6.30 ± 0.062 | 29.90 ± 0.098 | 0.96 ± 0.008 | 2.02 ± 0.019 | 1.50 ± 0.002 | 5.00 ± 0.027 | 0.30 ± 0.009 | 2.56 ± 0.008 |
| S3 | 4.08 ± 0.048 | 0.51 ± 0.002 | 15.32 ± 0.069 | 0.88 ± 0.003 | 0.97 ± 0.011 | 2.64 ± 0.045 | 2.39 ± 0.009 | 6.64 ± 0.061 | 24.96 ± 0.089 | 1.59 ± 0.012 | 1.64 ± 0.017 | 1.31 ± 0.018 | 3.49 ± 0.025 | 0.15 ± 0.009 | 0.95 ± 0.009 |
| S4 | 3.23 ± 0.019 | 0.37 ± 0.003 | 16.23 ± 0.057 | 0.79 ± 0.006 | 0.76 ± 0.007 | 2.49 ± 0.069 | 1.45 ± 0.007 | 4.32 ± 0.052 | 24.47 ± 0.086 | 1.49 ± 0.014 | 1.40 ± 0.021 | 1.11 ± 0.019 | 3.74 ± 0.031 | 0.25 ± 0.009 | 3.72 ± 0.013 |
| S5 | 3.50 ± 0.011 | 0.31 ± 0.004 | 14.87 ± 0.069 | 0.90 ± 0.007 | 0.82 ± 0.006 | 2.65 ± 0.054 | 0.75 ± 0.009 | 1.61 ± 0.009 | 27.57 ± 0.110 | 1.50 ± 0.017 | 1.65 ± 0.022 | 1.30 ± 0.021 | 3.23 ± 0.024 | 0.14 ± 0.008 | 0.51 ± 0.007 |
| S6 | 3.46 ± 0.041 | 0.81 ± 0.002 | 15.93 ± 0.089 | 0.83 ± 0.005 | 0.83 ± 0.009 | 2.67 ± 0.087 | 3.70 ± 0.084 | 10.35 ± 0.076 | 24.72 ± 0.072 | 1.38 ± 0.016 | 1.84 ± 0.016 | 1.20 ± 0.018 | 4.37 ± 0.019 | 0.12 ± 0.007 | 4.78 ± 0.013 |
| Mean | 3.63 | 0.47 | 15.64 | 0.9 | 0.87 | 2.59 | 1.86 | 5.1 | 26.48 | 1.5 | 1.67 | 1.3 | 3.72 | 0.2 | 2.23 |
| Median | 3.48 | 0.44 | 15.62 | 0.86 | 0.83 | 2.65 | 1.89 | 5.31 | 26.12 | 1.49 | 1.65 | 1.3 | 3.62 | 0.2 | 1.76 |
| S7 | 4.63 ± 0.022 | 0.53 ± 0.002 | 19.08 ± 0.025 | 0.95 ± 0.004 | 1.14 ± 0.013 | 4.41 ± 0.054 | 2.17 ± 0.031 | 4.46 ± 0.074 | 32.15 ± 0.170 | 1.84 ± 0.011 | 1.77 ± 0.009 | 1.80 ± 0.017 | 2.23 ± 0.013 | 0.03 ± 0.005 | 3.70 ± 0.013 |
| S8 | 4.03 ± 0.047 | 2.66 ± 0.001 | 18.19 ± 0.089 | 0.89 ± 0.007 | 1.16 ± 0.031 | 4.05 ± 0.079 | 7.53 ± 0.094 | 19.52 ± 0.110 | 22.88 ± 0.190 | 1.35 ± 0.013 | 2.02 ± 0.002 | 1.42 ± 0.016 | 4.13 ± 0.019 | 0.05 ± 0.005 | 4.65 ± 0.019 |
| S9 | 3.02 ± 0.032 | 0.32 ± 0.003 | 12.07 ± 0.065 | 0.96 ± 0.010 | 0.85 ± 0.006 | 3.69 ± 0.081 | 0.54 ± 0.013 | 1.36 ± 0.018 | 26.5 ± 0.160 | 2.23 ± 0.017 | 1.44 ± 0.016 | 1.58 ± 0.019 | 1.67 ± 0.021 | 0.05 ± 0.004 | 2.01 ± 0.024 |
| Mean | 3.9 | 1.17 | 16.45 | 0.94 | 1.05 | 4.05 | 3.41 | 8.45 | 27.18 | 1.81 | 1.74 | 1.6 | 2.68 | 0.04 | 3.45 |
| Median | 4.03 | 0.53 | 18.19 | 0.95 | 1.14 | 4.05 | 2.17 | 4.46 | 26.5 | 1.84 | 1.77 | 1.58 | 2.23 | 0.05 | 3.7 |
| S10 | 3.98 ± 0.021 | 0.59 ± 0.003 | 18.70 ± 0.059 | 0.86 ± 0.007 | 0.95 ± 0.009 | 3.96 ± 0.087 | 2.55 ± 0.014 | 5.35 ± 0.051 | 32.75 ± 0.161 | 2.44 ± 0.021 | 1.29 ± 0.009 | 1.36 ± 0.015 | 2.98 ± 0.023 | 0.12 ± 0.003 | 5.91 ± 0.041 |
| S11 | 4.02 ± 0.054 | 1.15 ± 0.009 | 17.76 ± 0.061 | 0.88 ± 0.008 | 0.94 ± 0.010 | 3.43 ± 0.091 | 3.06 ± 0.021 | 9.4 ± 0.097 | 29.4 ± 0.190 | 2.21 ± 0.019 | 1.32 ± 0.009 | 1.20 ± 0.018 | 3.33 ± 0.027 | 0.03 ± 0.004 | 2.37 ± 0.023 |
| S12 | 4.09 ± 0.046 | 1.08 ± 0.008 | 17.48 ± 0.057 | 0.69 ± 0.009 | 0.88 ± 0.009 | 3.4 ± 0.014 | 3.50 ± 0.011 | 7.57 ± 0.088 | 29.04 ± 0.140 | 2.22 ± 0.018 | 1.33 ± 0.098 | 1.30 ± 0.018 | 2.78 ± 0.026 | 0.12 ± 0.004 | 4.89 ± 0.019 |
| Mean | 4.03 | 0.94 | 17.98 | 0.81 | 0.92 | 3.6 | 3.03 | 7.44 | 30.39 | 2.29 | 1.31 | 1.29 | 3.03 | 0.09 | 4.39 |
| Median | 4.02 | 1.08 | 17.76 | 0.86 | 0.94 | 3.43 | 3.06 | 7.57 | 29.4 | 2.22 | 1.32 | 1.3 | 2.98 | 0.12 | 4.89 |
| S13 | 5.29 ± 0.033 | 0.73 ± 0.004 | 19.23 ± 0.089 | 1.32 ± 0.011 | 1.26 ± 0.011 | 3.96 ± 0.031 | 1.84 ± 0.002 | 3.68 ± 0.032 | 42.51 ± 0.231 | 2.12 ± 0.011 | 1.81 ± 0.010 | 1.58 ± 0.019 | 3.45 ± 0.021 | 0.15 ± 0.004 | 6.49 ± 0.064 |
| S14 | 5.33 ± 0.043 | 0.52 ± 0.004 | 19.25 ± 0.075 | 1.10 ± 0.014 | 1.18 ± 0.012 | 4.02 ± 0.068 | 1.82 ± 0.019 | 3.63 ± 0.030 | 42.69 ± 0.250 | 2.17 ± 0.014 | 1.66 ± 0.011 | 1.49 ± 0.017 | 3.31 ± 0.027 | 0.13 ± 0.034 | 3.95 ± 0.059 |
| Mean | 5.31 | 0.62 | 19.24 | 1.21 | 1.22 | 3.99 | 1.83 | 3.66 | 42.6 | 2.15 | 1.74 | 1.53 | 3.38 | 0.14 | 5.22 |
| Median | 5.31 | 0.62 | 19.24 | 1.21 | 1.22 | 3.99 | 1.83 | 3.66 | 42.6 | 2.15 | 1.74 | 1.53 | 3.38 | 0.14 | 5.22 |
Disclaimer/Publisher’s Note: The statements, opinions and data contained in all publications are solely those of the individual author(s) and contributor(s) and not of MDPI and/or the editor(s). MDPI and/or the editor(s) disclaim responsibility for any injury to people or property resulting from any ideas, methods, instructions or products referred to in the content. |
© 2025 by the authors. Licensee MDPI, Basel, Switzerland. This article is an open access article distributed under the terms and conditions of the Creative Commons Attribution (CC BY) license (https://creativecommons.org/licenses/by/4.0/).
Share and Cite
Fang, W.; Song, Q.; Luo, H.; Wang, R.; Fang, C. Quality Evaluation of the Traditional Chinese Medicine Moutan Cortex Based on UPLC Fingerprinting and Chemometrics Analysis. Metabolites 2025, 15, 281. https://doi.org/10.3390/metabo15040281
Fang W, Song Q, Luo H, Wang R, Fang C. Quality Evaluation of the Traditional Chinese Medicine Moutan Cortex Based on UPLC Fingerprinting and Chemometrics Analysis. Metabolites. 2025; 15(4):281. https://doi.org/10.3390/metabo15040281
Chicago/Turabian StyleFang, Wentao, Qianqian Song, Han Luo, Rui Wang, and Chengwu Fang. 2025. "Quality Evaluation of the Traditional Chinese Medicine Moutan Cortex Based on UPLC Fingerprinting and Chemometrics Analysis" Metabolites 15, no. 4: 281. https://doi.org/10.3390/metabo15040281
APA StyleFang, W., Song, Q., Luo, H., Wang, R., & Fang, C. (2025). Quality Evaluation of the Traditional Chinese Medicine Moutan Cortex Based on UPLC Fingerprinting and Chemometrics Analysis. Metabolites, 15(4), 281. https://doi.org/10.3390/metabo15040281