1. Introduction
Endothelial dysfunction (ED), which is a central feature of many cardiovascular diseases (CVDs), represents a powerful target in the development of new treatments. During atherosclerosis, ED is directly associated with levels of LDL-cholesterol and inversely correlated with HDL-cholesterol. The successful pharmacologic strategy of reducing LDL-cholesterol through the use of statins has produced a remarkable >20% decrease in CVD events. Treatment with PCSK9 inhibitors reduces LDL-cholesterol by approximately 45–60%, whether used alone or in combination with a statin [
1]. However, the risk of a major cardiovascular event in patients with established coronary artery disease remains significant [
2,
3,
4].
Cholesteryl ester transfer protein (CETP) is one of the most potent endogenous regulators of HDL-cholesterol plasma levels. It is a plasma protein that facilitates the transfer of cholesteryl esters from HDL to apoB-containing lipoproteins. In doing so, CETP action leads to a net reduction of HDL-cholesterol in plasma, apparently increasing the risk of atherosclerosis development [
5]. HDL levels have cardiovascular protective roles by several means. Besides removing excess cholesterol from the arterial wall, HDL also inhibits lipid oxidation, restores endothelial function, and exerts anti-inflammatory and antiapoptotic actions [
6,
7]. Therefore, CETP inhibition has been considered a potential target for increasing HDL-cholesterol and reducing CVDs [
8,
9]. The hope is that the residual CVD risk would be significantly diminished by associating CETP inhibitors with LDL lowering agents, such as statins. However, clinical trials employing at least three different CETP inhibitors (torcetrapib, dalcetrapib, and evacetrapib) have failed to prove this hypothesis and all have been terminated prematurely, either because of increased morbidity/mortality or because of a lack of benefit [
10,
11,
12]. However, the CETP inhibitor anacetrapib showed a highly significant but modest benefit for CVD in the REVEAL trial [
13]. Considering that the levels of HDL have several well-established cardiovascular protective roles [
14] and that CETP decreases HDL, the present study tested the hypothesis that CETP expression causes endothelial dysfunction and explored possible mechanisms, such as endoplasmic reticulum and oxidative stress.
2. Materials and Methods
2.1. Human Aortic Endothelial Cell Culture (HAECs)
HAECs, the culture endothelial basal medium (EBM, CC-3121) and endothelial cell growth supplements (EGM, CC-4133) were purchased from Lonza (Walkersville, MD, USA). The cells were grown in EBM containing 15% fetal bovine serum (FBS, R&D, Flowery Branch, GA, USA) at 37 °C in humidified 5% CO2, and used for experiments between passages 3 and 11. All siRNAs were purchased from Invitrogen (Eugene, OR, USA). HAECs were transfected with siRNA using Lipofectamine RNAiMAX reagent (Invitrogen), according to the manufacturer’s protocol. Forty-eight hours after transfection, HAECs were harvested for subsequent analyses.
2.2. Human Monocytic Cells
Human THP-1 monocytes were purchased from ATCC (Manassas, VA, USA). These cells were cultured in RPMI-1640 medium supplemented with 10% (v/v) heat-inactivated FBS, 100 U/mL penicillin, 100 μg/mL streptomycin, and 2 mM L-glutamine (all Invitrogen). The culture was maintained at 37 °C in a humidified atmosphere containing 5% CO2.
2.3. Preparation of Fluorescent THP-1 Cells
To visualize THP-1 cells adhering to the HAECs, fluorescent THP-1 cells were prepared as described by the manufacturer (C2925, Invitrogen). In brief, THP-1 cells were labeled with a fluorescent dye by incubating 1.0 × 10⁶ cells in 10 mL of FBS-free RPMI-1640 and 10 µl of a cell-tracker (final concentration 5 μM) at 37 °C for 45 min. Dye loading was stopped by centrifugation and cells were resuspended in fresh EBM medium.
2.4. Adhesion Experiment of THP-1 Cells/Monocyte-EC adhesion
To investigate the CETP effect on the adhesion of THP-1 cells to the endothelial monolayer, HAECs were plated onto Labtek slides (Thermo Scientific, Rochester, NY, USA) and the monolayers transfected with scramble, non-silence (NS) or siCETP. Human THP-1 monocytes previously incubated with 5 μM CellTracker Green (CMFDA) (Invitrogen, Eugene, OR, USA) and resuspended in 500 µl of new EBM medium were placed into each well of a Labtek slide and incubated at 37 °C for 30 min. Next, the THP-1 cell suspension in each well was discarded, and the HAEC monolayer was gently washed three times with 500 μL of phosphate-buffered saline (PBS, pH 7.3) in order to remove non-adherent THP-1 cells. Adherent fluorescence-labeled THP-1 cells were observed under a fluorescence microscope (Nikon, Eclipse Ti, Japan) and quantified.
2.5. Animals
Mouse protocols were approved by the University Committee for Ethics in Animal Experimentation (CEUA/Unicamp, protocol # 3507-1) in agreement with the guidelines of the Brazilian College for Animal Experimentation and conformed to the Guidelines on the Handling and Training of Laboratory Animals (published by the Universities Federation for Animal Welfare, U.K., in 1992). Hemizygous human CETP transgenic (Tg) mice (line 5203, C57BL6/J background) [
15] expressing a human CETP minigene under the control of its natural flanking sequences were crossed with C57BL6/JUnib mice from the university’s animal care center (CEMIB/UNICAMP) to obtain CETP Transgenic (Tg) and non-transgenic (Ntg) littermates. Male CETP Tg and Ntg, between 12-weeks and 16-weeks of age, were used. Mice were housed in a temperature-controlled room (22 ± 1 °C), on a 12-h light/12-h dark cycle, had free access to water and food and were placed on a standard rodent chow diet (Nuvital CR1, Colombo, Brazil). Mice were genotyped according to the protocol recommended by the Jackson Laboratory (
https://www.jax.org/Protocol?stockNumber=003904&protocolID=24829). Terminal experiments were done in mice anaesthetized with 50 mg of ketamine/kg (Parke-Davis, São Paulo, Brazil) and 10 mg of xylazine/kg (Bayer, São Paulo, Brazil).
2.6. Vascular Reactivity
Cylindrical segments (rings) of the thoracic aorta (2 mm in length), free of adipose and connective tissue, were mounted in an isolated tissue chamber containing Krebs-Henseleit solution (118 mM NaCl, 4.7 mM KCl, 25 mM NaHCO3, 2.5 mM CaCl2-2H2O, 1.2 mM KH2PO4, 1.2 mM MgSO4-7H2O, 11 glucose, and 0.01 mM EDTA) and gassed with 95% O
2 and 5% CO
2. Aortic rings were maintained at a resting tension of 0.5 g at 37 °C, pH 7.4 as previously described [
16]. Isometric tension was recorded using an isometric force transducer (MLT0420, ADInstruments, Sydney, Australia) connected to an acquisition system (PowerLab 8/30, ADInstruments). After a 60-min equilibration period, aortic rings were exposed to 125 mM KCl to assess maximal tension. After a washout period, concentration-response curves to the α
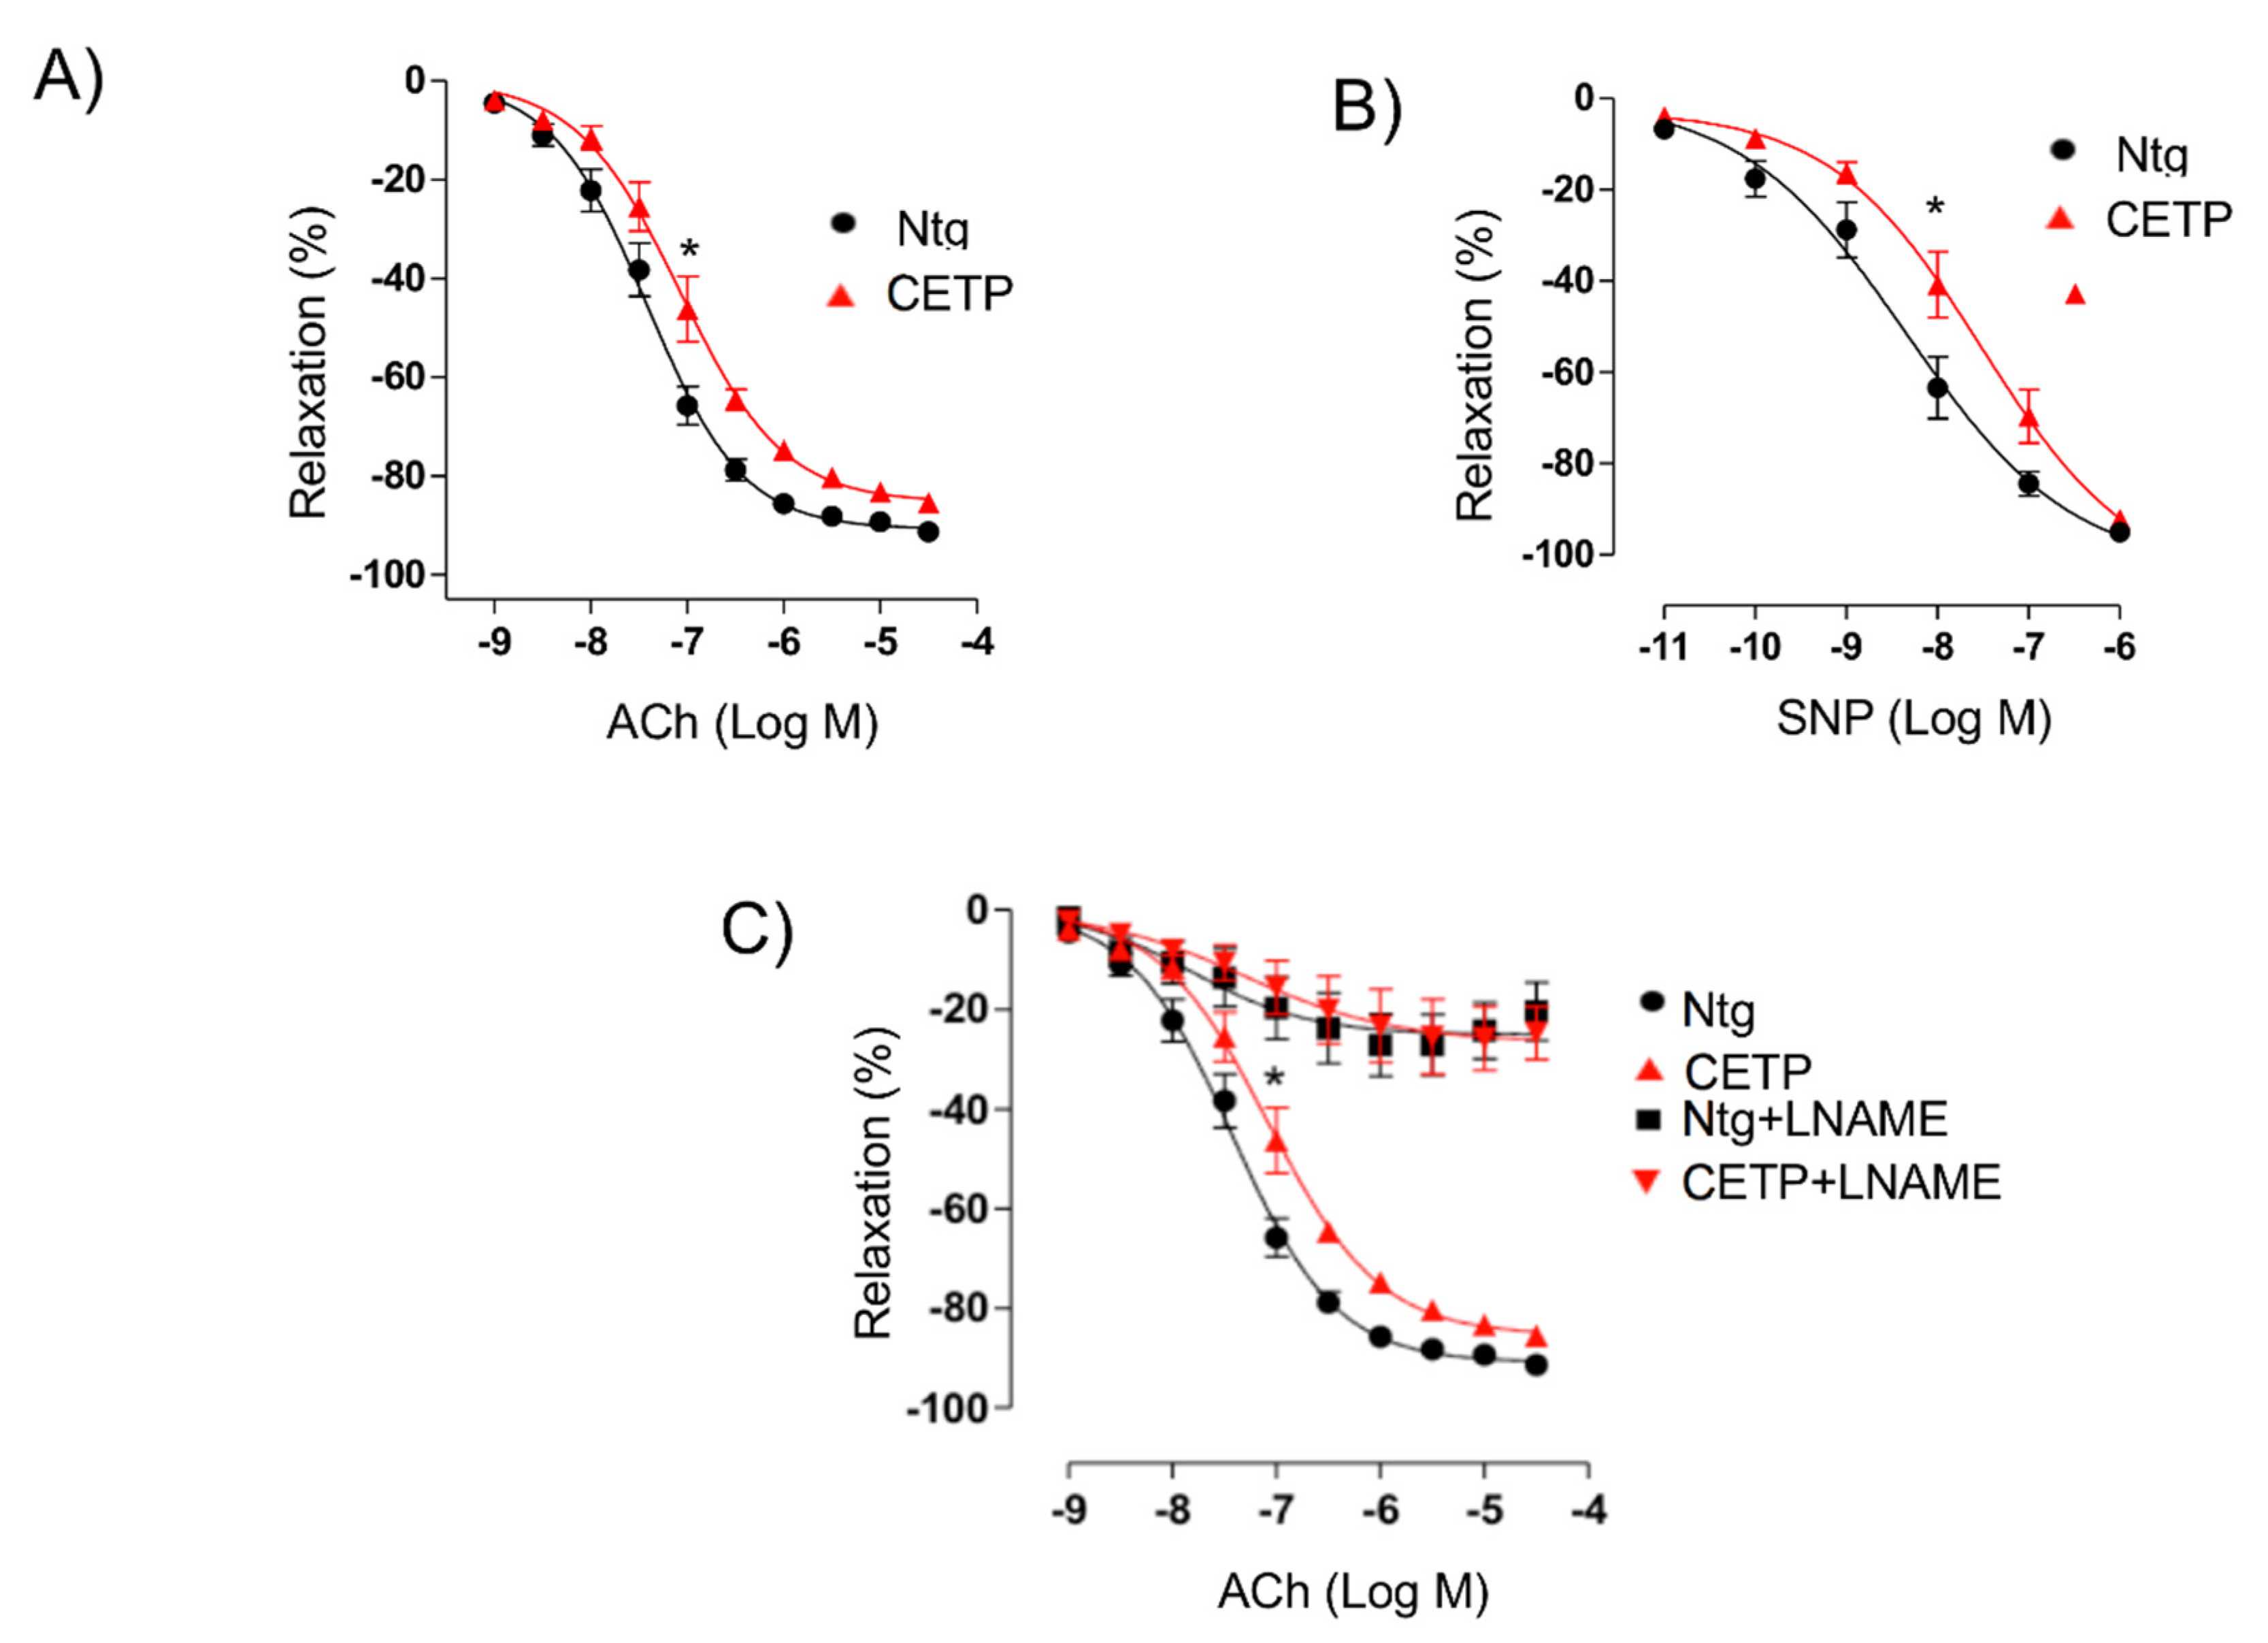
1-adrenoceptor agonist phenylephrine (0.1 nM-10 µM) were obtained and there were no differences. Relaxation concentration–response curves to acetylcholine (1 nM–30 µM) and to the NO-donor sodium nitroprusside (10 pM–3 µM) were generated for the aortic rings contracted with phenylephrine until 50–70% of maximum contraction with 125 mM KCl. Some aortic rings were pre-incubated for 30 min with the nonselective nitric oxide synthase (NOS) inhibitor N-nitro-L-arginine methyl ester (L-NAME, 100 µM, Sigma-Aldrich, St. Louis, MO, USA) before acetylcholine-induced relaxation curves.
2.7. Gene-Expression Analysis
Total RNA was extracted from HAECs using the RNeasy mini plus kit, according to the manufacturers’ instructions (Qiagen, Germantown, MD, USA). cDNA synthesis was performed using the high-capacity cDNA reverse-transcription kit, according to the manufacturer’s instructions (Applied Biosystems). Quantitative PCR was performed using Taqman Universal Master mix in an iQ5 real-time PCR (qRT-PCR) detection system (Bio Rad). All samples were run in triplicates and normalized to a GAPDH/18s endogenous control. Relative fold-change was calculated using the ΔΔCt method. Taqman Gene-expression assays were performed for the following genes: CETP (Hs00163942_m1), TNFA (Hs00174128_m1), CD106 (Hs01003372_m1), CD54 (Hs00164932_m1), and ATF6 (Hs00232586_m1).
2.8. Subcellular Fractionation and Western Blot Analysis
Subcellular fractionation was performed using the Cell Compartment Kit (Qiagen, 37502), according to the manufacturer’s instructions. Whole lysates of HAEC were prepared by scraping cells with lysis buffer containing protease inhibitors (Qiagen). Protein concentration was determined by the bicinchoninic acid (BCA) method. Proteins were separated on 8% or 15% gels by SDS polyacrylamide gel-electrophoresis (PAGE) and transferred onto Immobilon-P membranes (Millipore, St. Louis, MO, USA). Primary antibodies used were anti-p47 (Invitrogen, PA5-27821), NOX2 (Invitrogen, MA5-18052), and L-type Ca2+ channels (sc-25686). Bound primary antibodies were detected with horseradish-peroxidase-conjugated secondary antibodies (Sigma), which was followed by enhanced chemiluminescence (Thermo-Scientific).
The HAECs or aortic tissues were homogenized in RIPA lysis buffer containing a 1% protease inhibitor cocktail. Samples were analyzed by electrophoresis on a 10% sodium dodecyl sulphate containing polyacrylamide gel and then transferred to nitrocellulose/polyvinylidene difluoride (PVDF) membrane. For plasma membrane protein analyses, cells were lysed using Qproteome Plasma Membrane Protein Kit (37601, Qiagen, Germantown, MD, USA). Western-blot analyses were carried out according to standard protocols with primary antibodies raised against CETP (10240, Cayman Chem. Co., Ann Arbor, MI, USA), VCAM-1 (V9263, Sigma), ICAM-1 (HPA002126, Sigma), eNOS (ABS229, Millipore, St. Louis, MO, USA), p-eNOS serine1177 (612392, BD, Franklin Lakes, NJ), SOD2 (ab13533-50, Abcam, Cambridge, MA, USA), AKT1 (sc-8312, Santa Cruz), p-AKT1 serine 473 (sc-7985, Santa Cruz), ERK1 (sc-94, Santa Cruz, Dallas, TX), p-ERK (sc-7383), Caveolin-1 (sc-5310, Santa Cruz), Caveolin-3 (sc-5310, Santa Cruz), nNOS (sc-648, Santa Cruz), p47 (Invitrogen, PA5-27821), NOX2 (Invitrogen, MA5-18052) L-type Ca2+ channel (sc-25686), PERK (Cell Signaling, 3192), p-IRE (NB100-2323, Novus, Centennial, CO), IRE (14C10, Cell Signaling). Beta-actin (AM4302; Thermo Scientific, Waltham, MA), α-tubulin (TU-02, Santa Cruz Biotech.), HSP90 (4874, Cell Signaling, Danvers, MS) and GAPDH (sc-25778, Santa Cruz) were used as internal controls depending on the tissue/condition. Immunodetection was performed using an enhanced chemiluminescence detection kit (Thermo Scientific). Band intensities were quantified using ImageJ software (National Institute of Health, Bethesda, MD, USA).
2.9. Measurements of Superoxide in HAECs
The fluorescent dye dihydroethidine (DHE, Molecular Probes) was used to evaluate superoxide generation, as previously described [
12,
13]. DHE exhibits blue-fluorescence in the cytosol until oxidized, where it intercalates within the cell’s DNA, staining its nucleus a bright fluorescent red. HAECs were incubated at room temperature for 30 min with DHE (3 μM). After washing with PBS, cells were fixed with 2% paraformaldehyde for 5 min at 4 °C. Samples were then mounted in Prolong Gold anti-fade (Invitrogen). Images were obtained using a Zeiss LSM-710 confocal microscope. Nuclear fluorescence captured at 562 nm was quantified using the Image-Pro plus software (MediaCybernetics, Silver Spring, MD, USA) and normalized to a cytosolic fluorescence.
2.10. Measurements of Superoxide in Aortas
DHE was used to evaluate in situ superoxide generation, as previously described [
16,
17]. Nuclear fluorescence captured at 562 nm was quantified using the Image-Pro plus software (MediaCybernetics, Silver Spring, MD, USA) and normalized to cytosolic fluorescence. Aortas were embedded in a freezing medium and transverse sections (10 µm) of frozen arteries were obtained using a cryostat (Company), collected on glass slides, and equilibrated for 10 min in Hanks solution (1.6 mM CaCl
2, 1.0 mM MgSO
4, 145.0 mM NaCl, 5.0 mM KCl, 0.5 mM NaH
2PO
4, 10.0 mM dextrose, 10.0 mM HEPES, pH 7.4) at 37 °C. Fresh Hanks solution containing DHE (2 µM) was topically applied to each tissue section and the slices were incubated in a light-protected humidified chamber at 37 °C for 30 min. Negative control sections received the same volume of Hanks solution in the absence of DHE. Images were obtained with a Leica DMI600B microscope. The number of nuclei labeled with 4,6-diamidino-2-phenylindole (Dapi, positive nuclei) along the vascular wall was automatically counted using Image J software.
2.11. Production of H2O2 by HAECs
To assay the production of H2O2, 0.5 × 10⁵ peritoneal macrophage cells were incubated in 96-well cell culture plates. On the day of the experiment, cells were incubated in a mixture contained 50 μM Amplex Red reagent (Invitrogen, Waltham, MA, USA) and 0.1 U/mL horseradish peroxidase in Krebs-Ringer phosphate (145 mM NaCl, 5.7 mM sodium phosphate, 4.86 mM KCl, 0.54 mM CaCl2, 1.22 mM MgSO4, 5.5 mM glucose, pH 7.35). This assay was conducted in the presence and absence of catalase (1000 U/mL). Fluorescence was monitored over time with a temperature-controlled SpectraMax M3 Microplate Reader (Molecular Devices LLC, San Jose, CA, USA) using excitation and emission wavelengths of 560 and 590 nm, respectively. Results were expressed as μM of H2O2/60 min/0.5 × 105 peritoneal macrophage cells using the standard curve established for each assay with known molar concentrations of H2O2.
2.12. Production of H2O2 by Aortas
Aorta segments were incubated in 96-well cell culture plates with a mixture contained of a 50-µM Amplex Red reagent (Invitrogen) and 0.1 U/mL HRP in Krebs-Ringer phosphate (145 mM NaCl, 5.7 mM sodium phosphate, 4.86 mM KCl, 0.54 mM CaCl2, 1.22 mM MgSO4, 5.5 mM glucose, pH 7.35). Fluorescence was monitored over time with a temperature-controlled SpectraMax M3 Microplate Reader (Molecular Devices LLC) using excitation and emission wavelengths of 560 and 590 nm, respectively.
2.13. Reduced (GSH) and Oxidized (GSSG) Glutathione Levels
Aorta (50 mg) of GSH and GSSG were assayed separately according to the fluorometric ortho-phthalaldehyde (OPT) method [
18]. This method is based on the principle that OPT reacts with GSH and GSSG, at pH 8.0 and pH 12, respectively, to yield a highly fluorescent product, which can be activated at 350 nm with an emission peak at 420 nm. GSSG levels were determined after sample treatment with N-ethylmaleimide to remove GSH completely. The concentrations of GSH and GSSG in samples were calculated according to standard curves prepared with GSH and GSSG, respectively.
2.14. Immunofluorescence Staining
For CETP localization experiments, HAECs were plated on Labtek slides and transfected with siRNA. Forty-eight hours after transfection, HAECs were washed with PBS and then fixed with 4% paraformaldehyde (PFA) for 10 min, blocked with 10% bovine serum albumin in PBS for 1 h, and stained with monoclonal antibody against CETP (Sigma, C7365), Ant1/2 (Abcam, clone AB.H10, # ab18180), p47 (Invitrogen, PA5-27821), NOX2 (Invitrogen, MA5-18052), Grp78/BIP (Abcam, ab-21685), GADD153 (Santa-Cruz Biotechnology, sc-793), overnight. After three washes with 1 × PBS, cells were incubated with Alexa Fluor secondary antibody A11011 and A11029 (Alexa Fluor-Invitrogen) for 1 h at RT. For membrane and cytoplasm co-localisation studies, cells were subsequently stained with Alexa Fluor 555 Wheat Germ Agglutinin (W32464, Life Technologies) or phalloidin conjugated to Alexa Fluor 568 (A12380, Invitrogen), for 1 h or 30 min, respectively, at RT. To perform membrane cholesterol and lipid rafts detection we used filipin (Abcam, 133116) and CTB (Sigma, C1655) staining, respectively. Cells were fixed in 1% PFA for 30 min on ice. Labteks were mounted on glass slides with mounting media containing DAPI (# H-1200, Vectashield, Vector Laboratories, San Jose, CA) or ProLong (P36980, Invitrogen). All images were analyzed using Leica DMI600B and Leica Upright LSM780-NLO microscopes. High magnification z-stack images were recorded for studying cell morphology changes. All gains for the acquisition of comparable images were maintained at a constant level. Image analyses were performed using ImageJ (NIH) and Adobe Photoshop CS5.
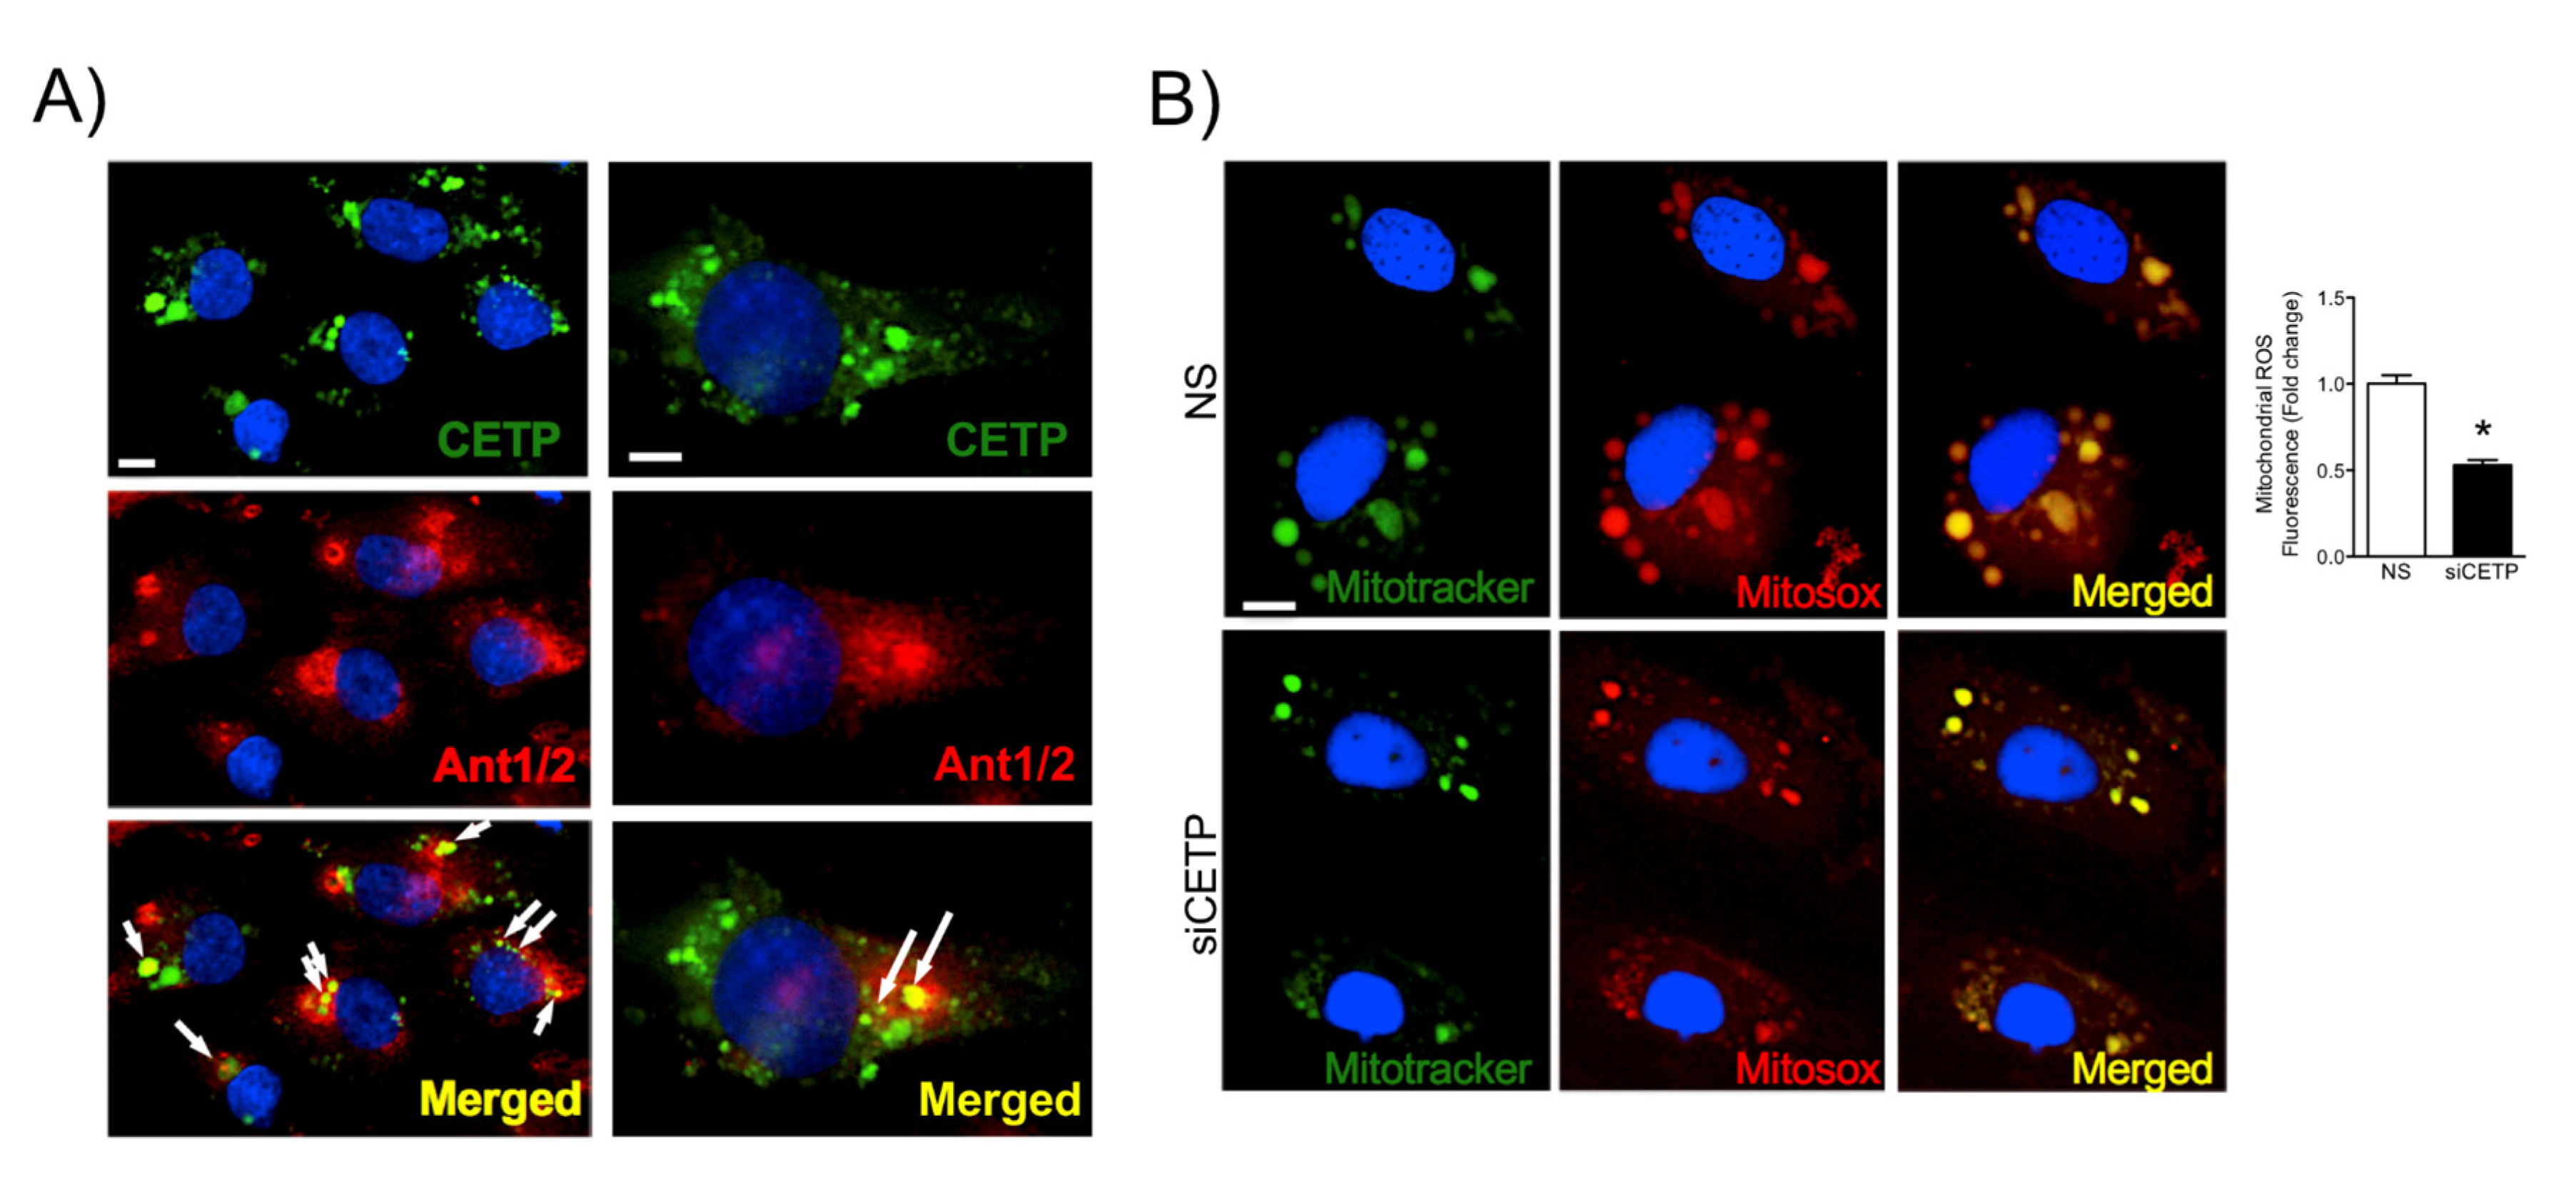
2.15. Measurement of Mitochondrial Superoxide Production in HAECs
HAECs were allowed to grow until 70% confluence and transfected with siCETP on 8-well Labek slides. Cells were pre-incubated with 5 μM of the mitochondrial superoxide indicator MitoSOX (Molecular Probes, Invitrogen) at 37 °C for 30 min. For live cell imaging, cells were then rinsed in warm culture medium and stained with Mitotracker Green (Molecular Probes, Invitrogen) (100 nM) at 37 °C for 15 min, which was followed by three washes with warm medium. Nuclei were counterstained with DAPI for 10 min. Cells were mounted onto glass slides with Mounting Medium Vectashield (Vector Laboratories). Images of cells were acquired using a Leica LSM 780 confocal microscope with 63X objective, which was followed by measurement of the average cell area of at least 10 cells per field using ImageJ software.
2.16. Flow Cytometer Analysis
Reactive oxygen species (ROS) production was determined by CellRox, Deep Red oxidative stress reagent (C10491, Life Technologies, Carlsbad, CA, USA). After transfection, cells were cultured in the medium for 48 h and then collected and treated with diphenyleneiodonium chloride (DPI, 10 µM, Sigma Aldrich, St. Louis, MO, USA), or 2-(2,2,6,6-Tetramethylpiperidin-1-oxyl-4-ylamino)-2-oxoethyl)triphenylphosphonium chloride (mito-TEMPO, 10 μM, Sigma Aldrich) or Apocynin (100 μM) for 2 h. Staining was performed by incubating cells at 37 °C with 5 μM CellRox following the manufacturer’s protocols (Invitrogen) and directly analysed without fixing. Cell analysis was performed in FACS Canto-II (BD Biosciences). For mean fluorescence intensity (MFI) determination, we used FlowJo flow cytometry analysis software. MFI refers to the fluorescence intensity of each event (on average) of the selected cell population in the chosen fluorescence channel.
2.17. Statistical Analysis
Data are presented as a mean ± standard error of the mean (SEM) (n is provided in the figure legends) and the statistical differences were evaluated by Student’s t-test versus the control group. Dose-response curves for vascular reactivity assays were analyzed by two-way ANOVA. Results were considered significantly different at p < 0.05.
4. Discussion
Endothelial dysfunction, which is the earliest detectable change in the initiation of atherosclerosis [
21], is a central feature of many CVDs and is used as an independent predictor of morbidity/mortality in many clinical studies [
22,
23,
24]. The purpose of the present study was to investigate whether and to what extent CETP expression impacts endothelial cell function, which is a well-established surrogate marker for CVD risk. Using a mouse model that recapitulates the myriad features of human endothelial cells expressing CETP [
25,
26], we uncovered evidence that CETP expression is associated with endothelial dysfunction, and enhances ROS production, eNOS phosphorylation, endoplasmic reticulum stress, and expression of cell adhesion molecules.
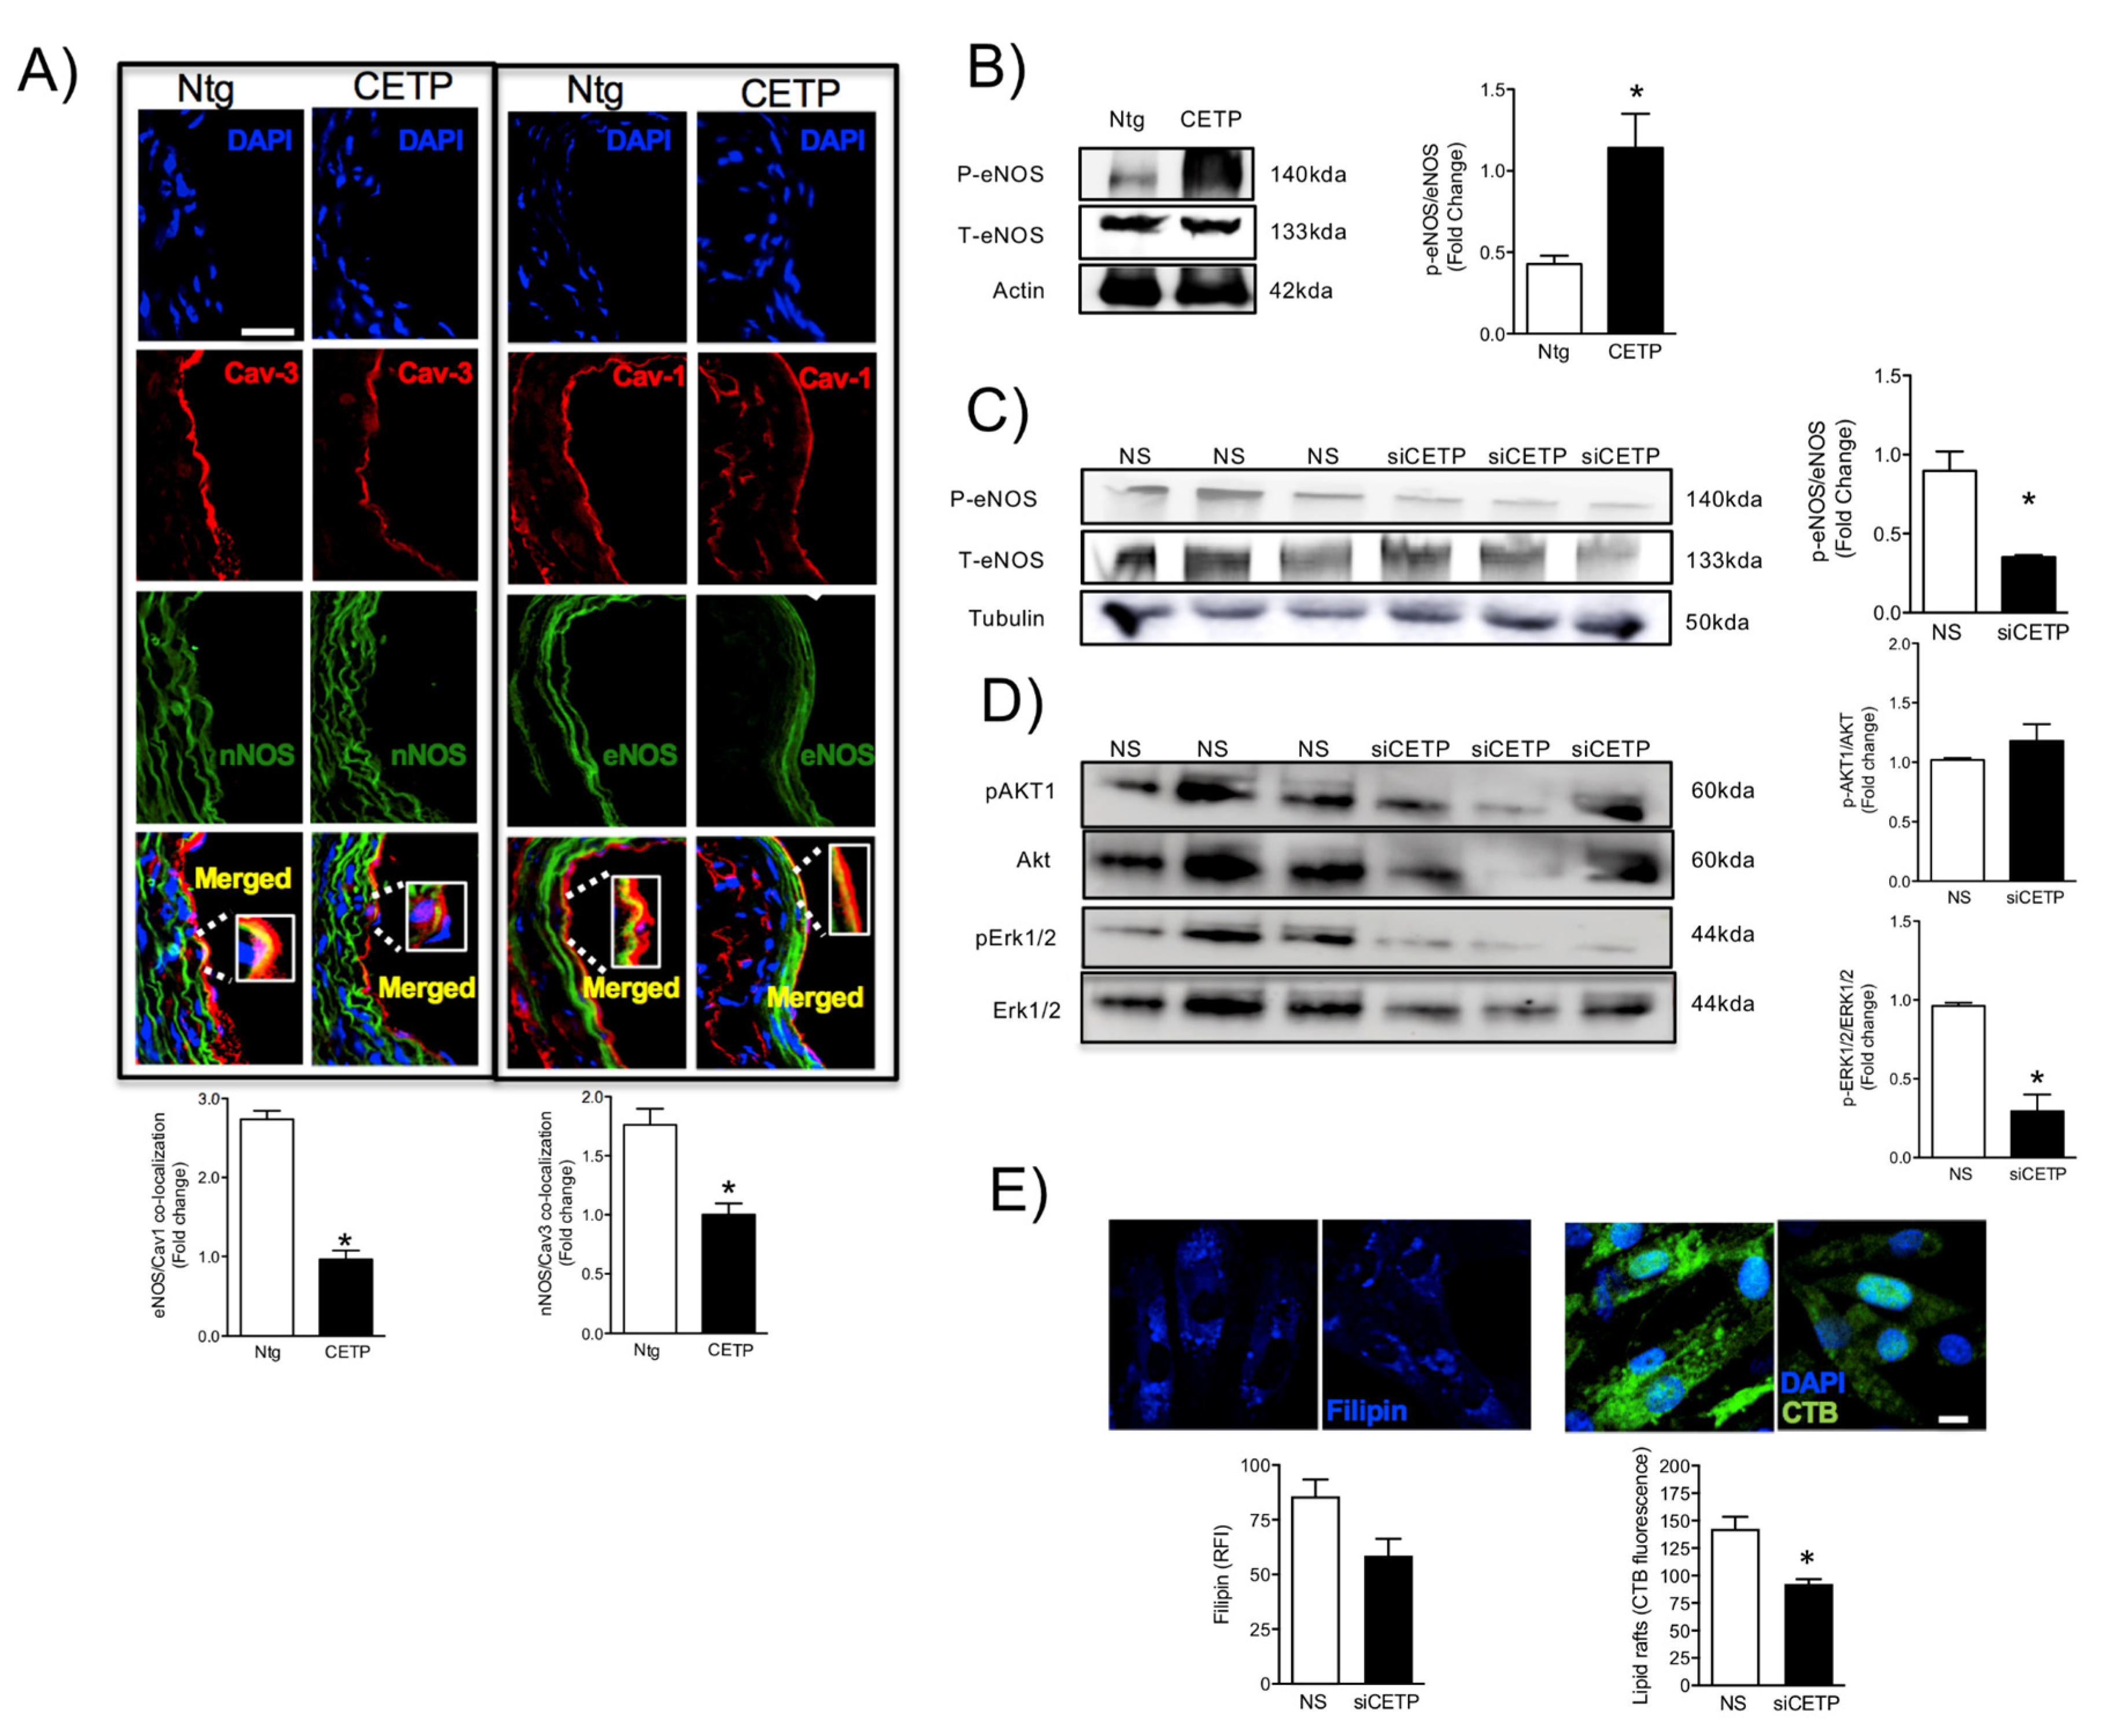
The reduced maximum relaxation in response to acetylcholine in aortas from CETP-transgenic mice, support that this mouse represents a model of endothelial dysfunction. In addition, L-NAME incubation abolished the endothelium-dependent relaxation in response to acetylcholine in both groups, highlighting the importance of NOS. Intriguingly, CETP transgenic aortas also expressed increased eNOS phosphorylation on Ser1177 and reduced eNOS/Cav1 and nNOS/Cav3 interaction, suggesting activation of the constitutive NOS isoforms. Similar findings were seen in the experiments using HAECs, where CETP expressing cells showed higher eNOS phosphorylation compared to cells after CETP knockdown. These findings agree with the previous studies from Gomaraschi and colleagues where HDL from CETP-deficient subjects had a reduced capacity to activate eNOS due to lower bioactive components PON-1 (enzyme that plays a role in eNOS activation) and S1P (lysosphingolipid) [
27,
28]. Our data also showed a decrease in lipid rafts content in HAECs associated with CETP inhibition and this finding could be linked with the regulation of expression or activity of eNOS in cell membranes. We also speculate that higher eNOS phosphorylation and activation in the presence of CETP could be dysfunctional. Increased superoxide generation inactivates NO, reducing its bioavailability and increasing peroxynitrite (ONOO
-) [
29,
30]. The activation of eNOS under oxidative stress state can cause enzyme uncoupling and a shift to superoxide production with less NO synthesis [
31,
32]. eNOS form a functional dimer to couple haem and O
2 reduction to synthetize NO, but oxidative stress may impact eNOS dimerization and coupling [
33]. Therefore, oxidative stress might mitigate the CETP stimulation of NOS activity. A limitation of this study includes the absence of eNOS dimerization/coupling analysis.
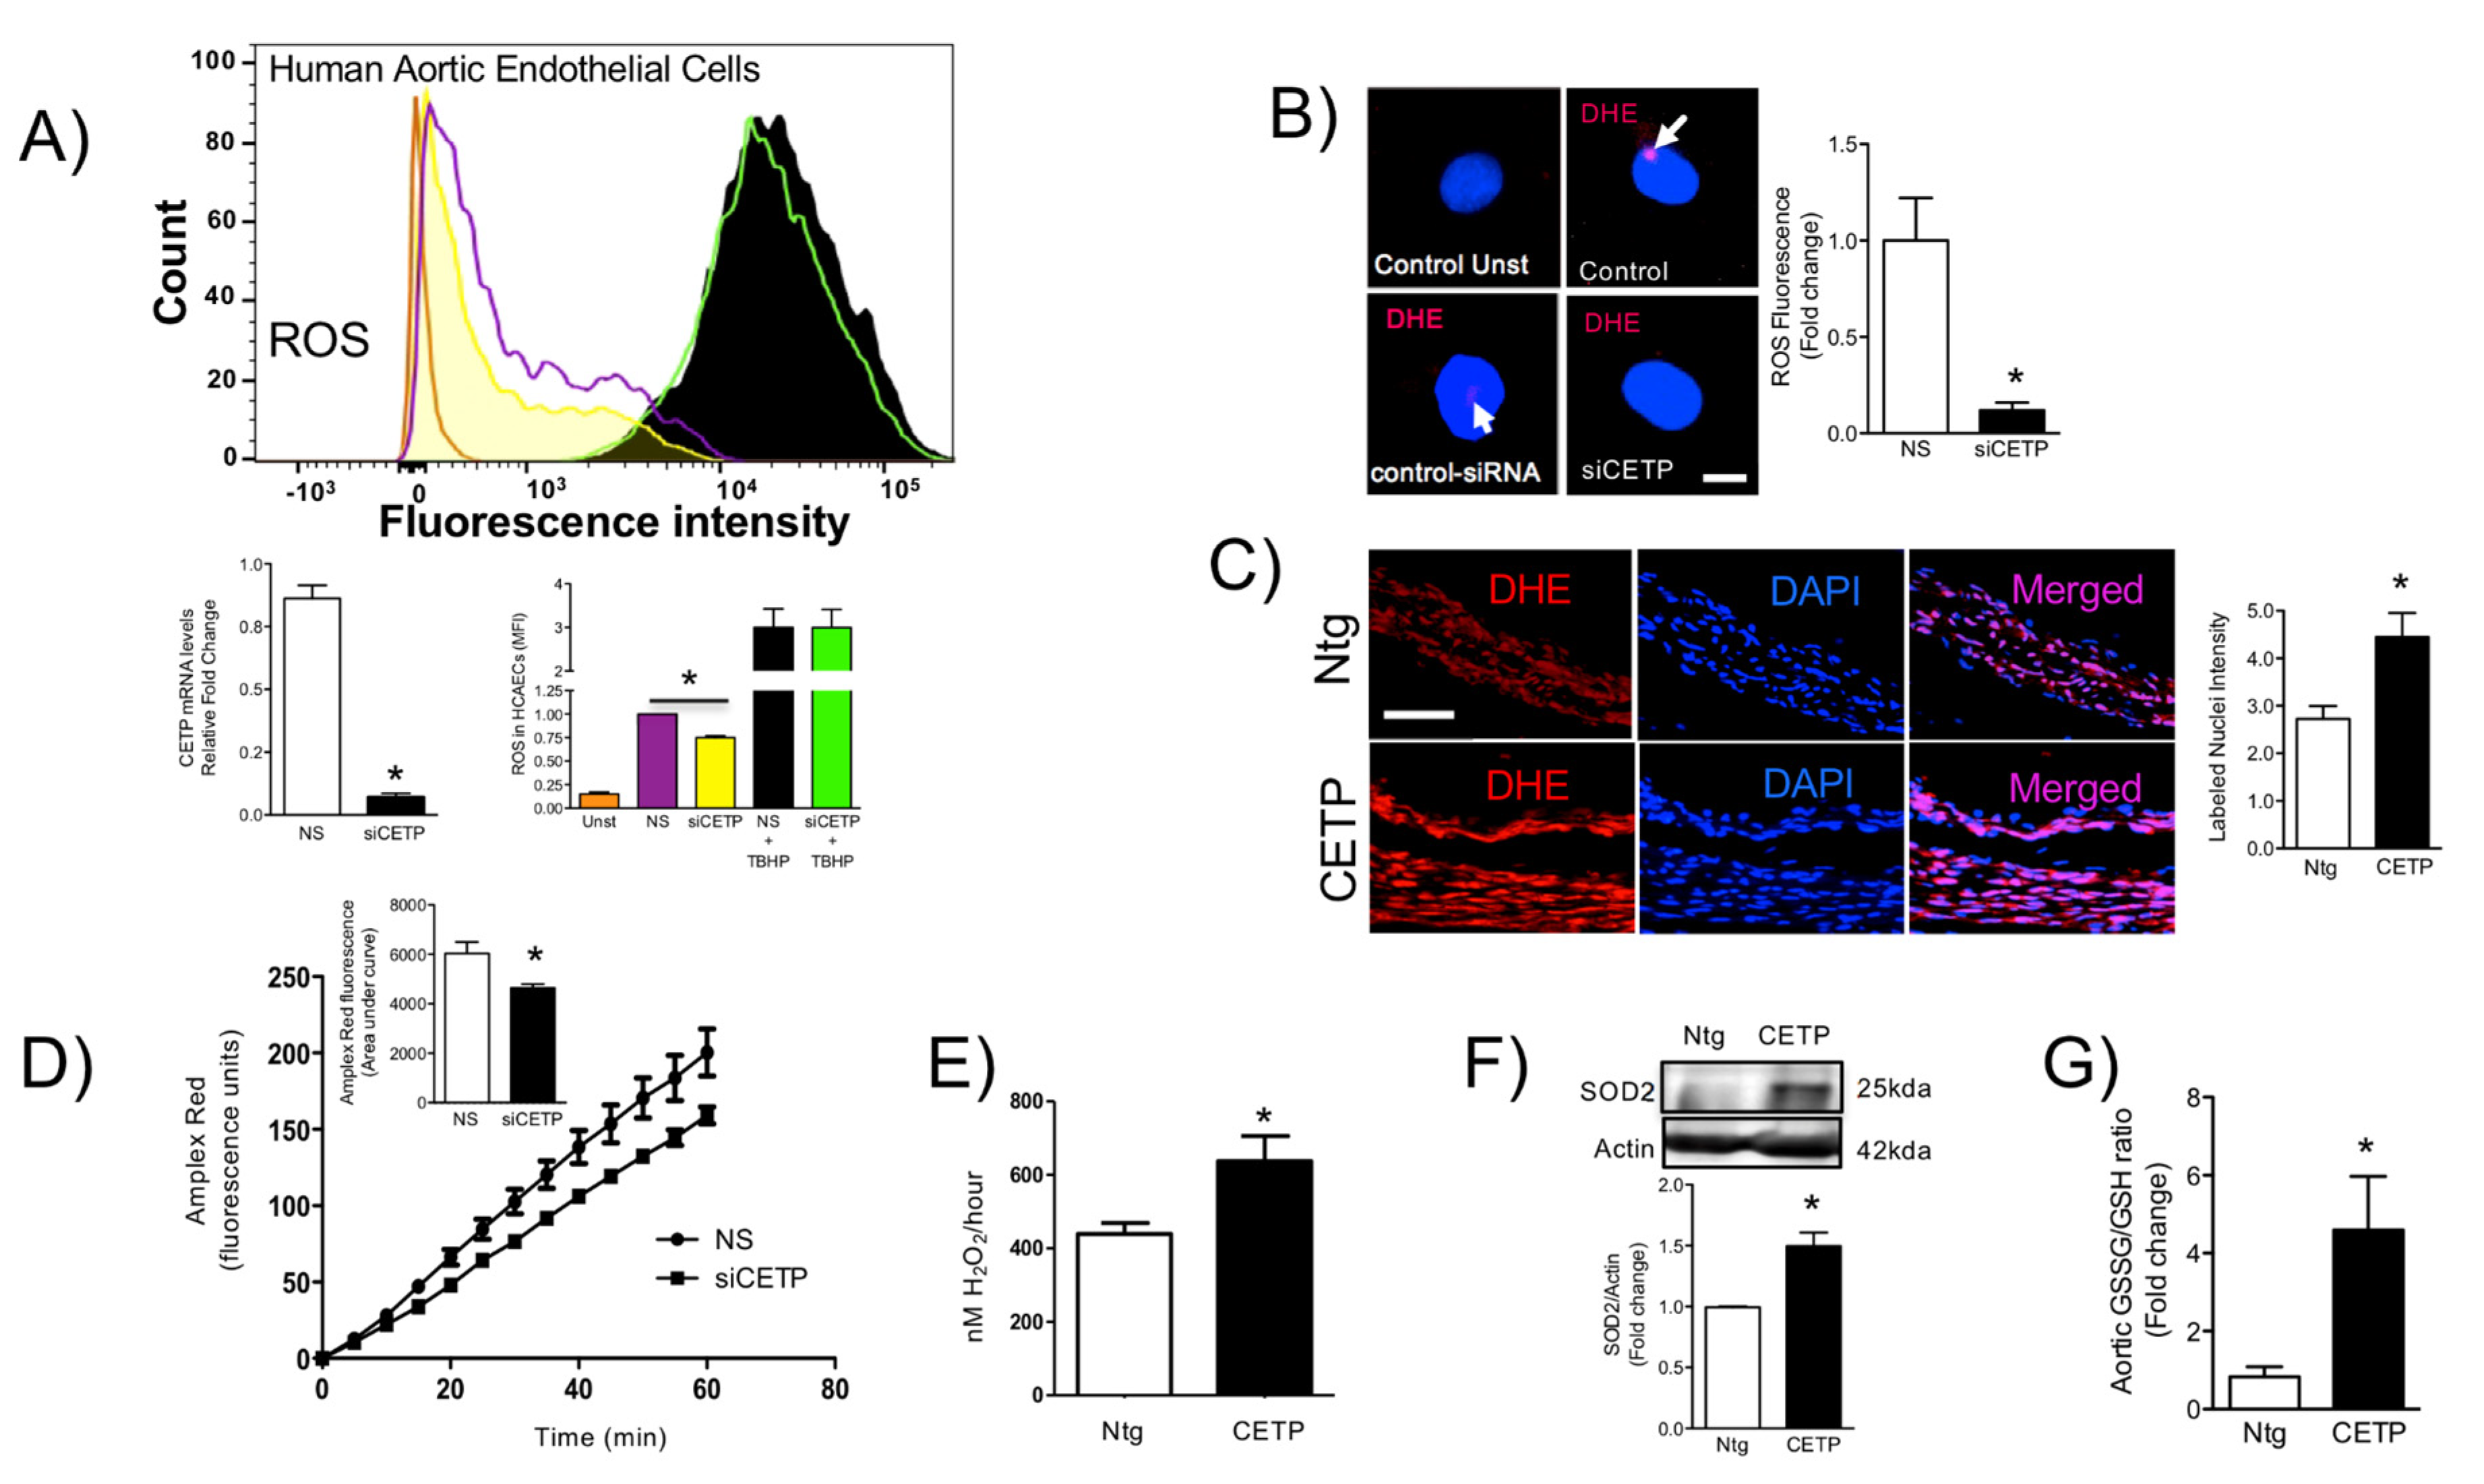
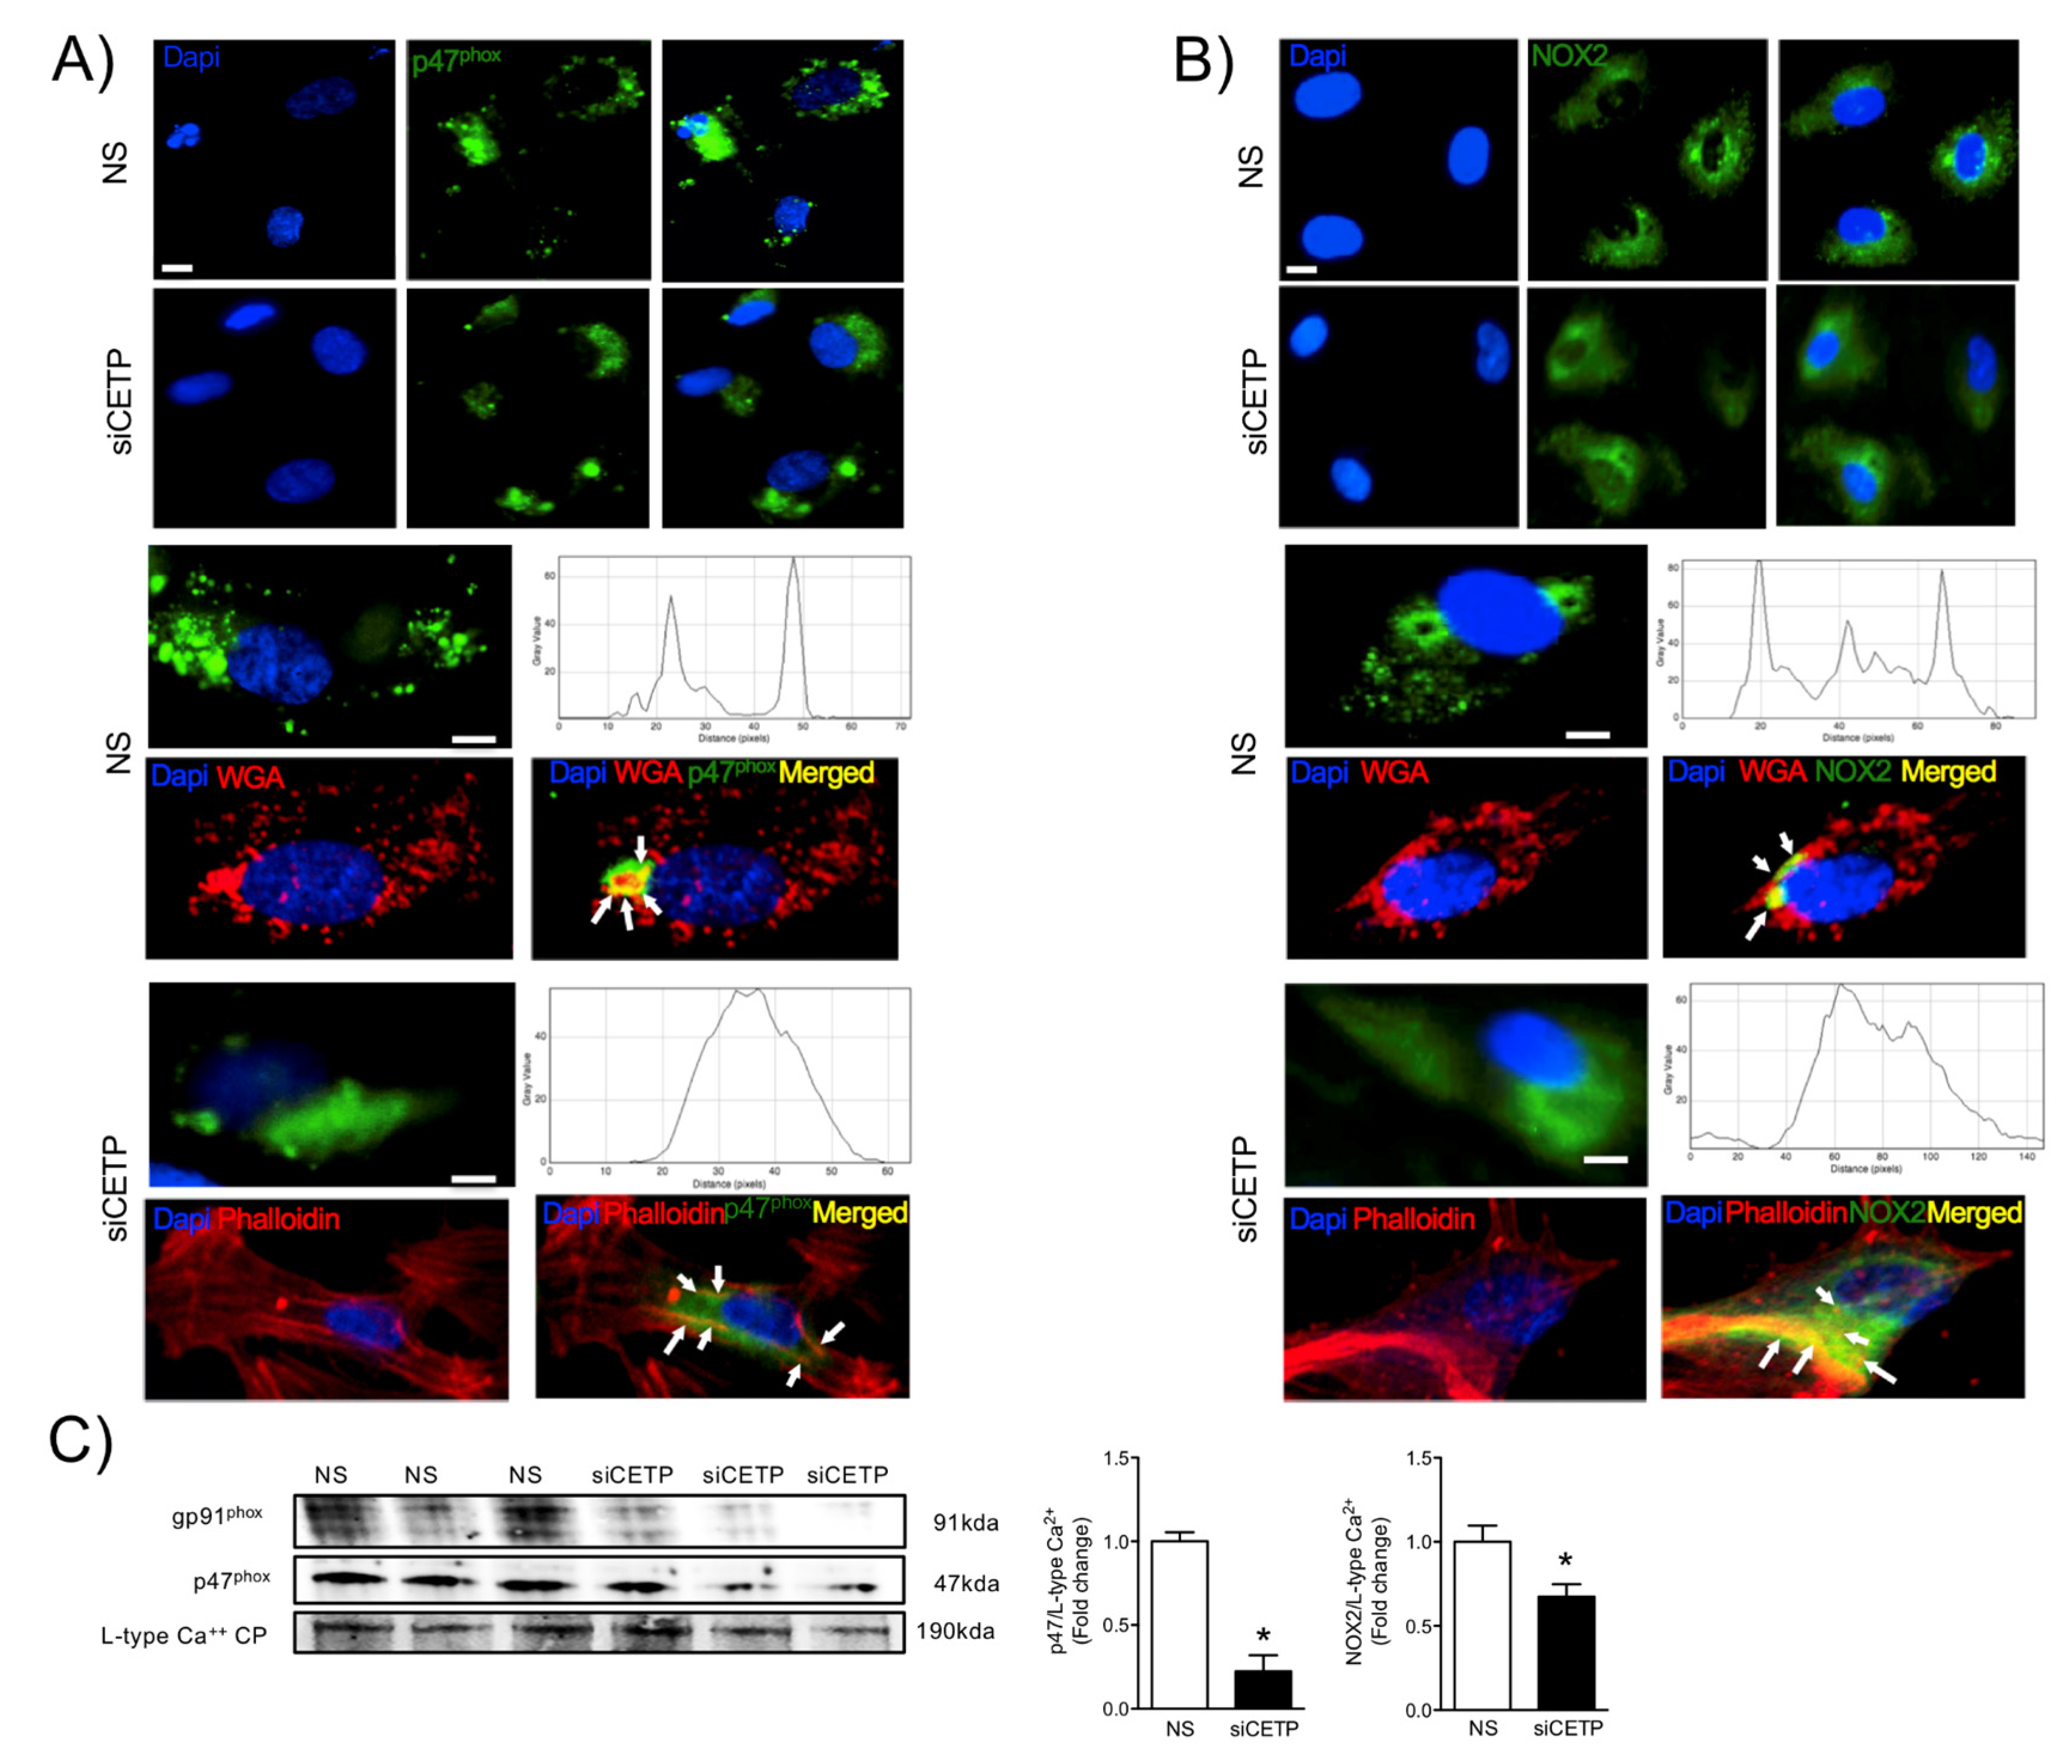
The findings from this work in vitro and in vivo demonstrate that endothelial cells expressing CETP have increased superoxide and hydrogen peroxide production rates and that GSH oxidation is accelerated. To distinguish the possible sources of ROS, we investigated the state of activity of NADPH oxidase (NOX), which is one of the major sources of ROS in vascular cells. Although several isoforms of NOX are expressed in the vessel endothelium, accumulating evidence suggests a crucial role of NOX2 in endothelial injury [
34]. NOX2 is the gp91
phox membrane subunit analog that assembles membrane p22
phox and cytosolic p47
phox, p40
phox, p67
phox, and Rac1 subunits. In response to the cellular stress, the cytosolic p47
phox translocates to the plasma membrane and binds to the membrane-bound catalytic domain, activating NOX2 [
35]. Our analyses suggest that, when CETP is inhibited, there is less NOX2 expression, less translocation of the cytoplasmic subunit p47
phox to the plasma membrane, and, thus, less NOX2 activation. There is a crosstalk between activated NOX and mitochondrial ROS production [
36], and our data showed markedly increased mitochondrial superoxide production in CETP expressing cells. Therefore, we presume the existence of a vicious cycle of ROS generation in these cells. Experiments using NOX inhibitors (Apocynin or DPI) or antioxidant mitoTempo abolished CETP dependent differences in ROS production (data not shown).
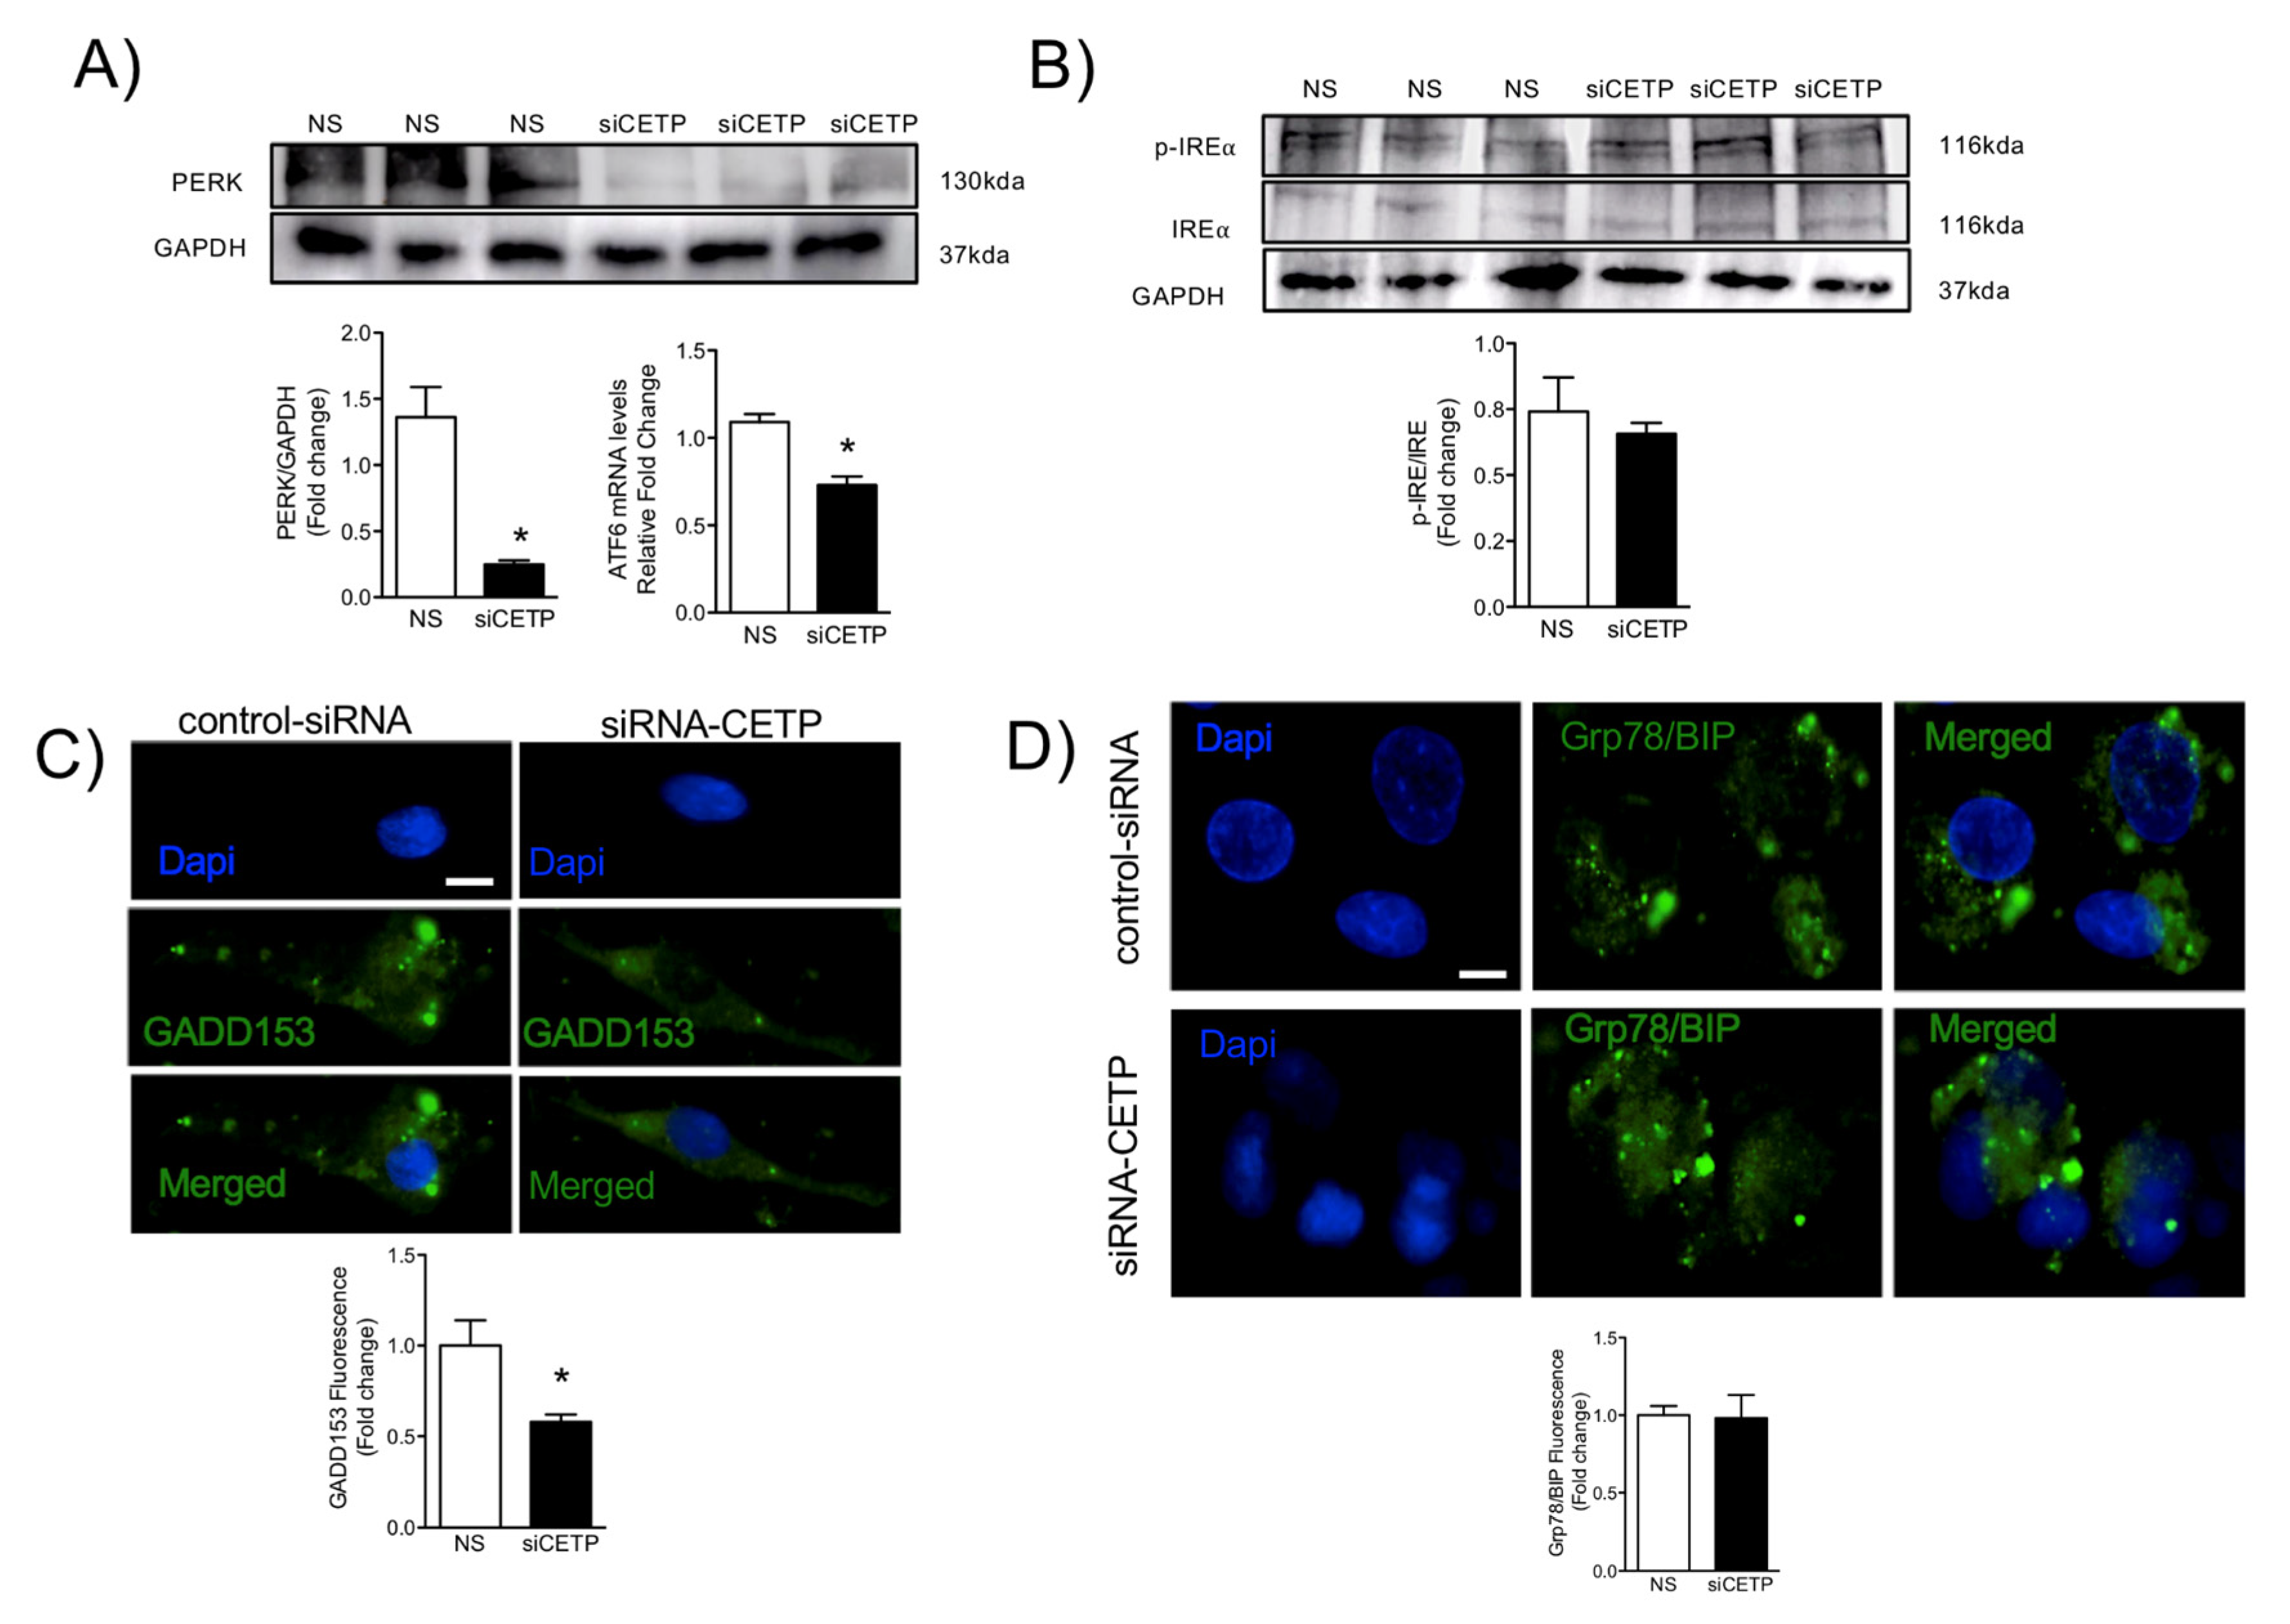
ER stress is another feature of dysfunctional endothelium [
37]. The unfolded protein response (UPR) is an evolutionary conserved adaptive response capable of mitigating stress in conditions that disrupt protein quality control. IRE1α is the most evolutionary conserved branch of UPR, which is one that has recently been identified as a regulator of stress responsiveness. In the present study, UPR sensors and effectors were deactivated after the silencing of CETP, as shown by the reduction in activating transcription factor 6 (ATF6) and the deactivation of the protein kinase RNA-like ER kinase (PERK) UPR branch. One of the components of the ER stress-mediated apoptosis pathway is a C/EBP homologous protein (CHOP), also known as growth arrest- and DNA damage-inducible gene 153 (GADD153) [
38], which was reduced after silencing of CETP, indicating that CETP expression is involved in ER stress, likely through elevation of ROS production. The potential role of CETP in modulating ER stress is particularly intriguing, and our results are in accordance with Lira et al. 2008 [
39], who concluded that CETP transfection in the human liposarcoma cell line (SW872) and human embryonic kidney cell line (HEK293S) causes an induction of genes linked to the ER stress response.
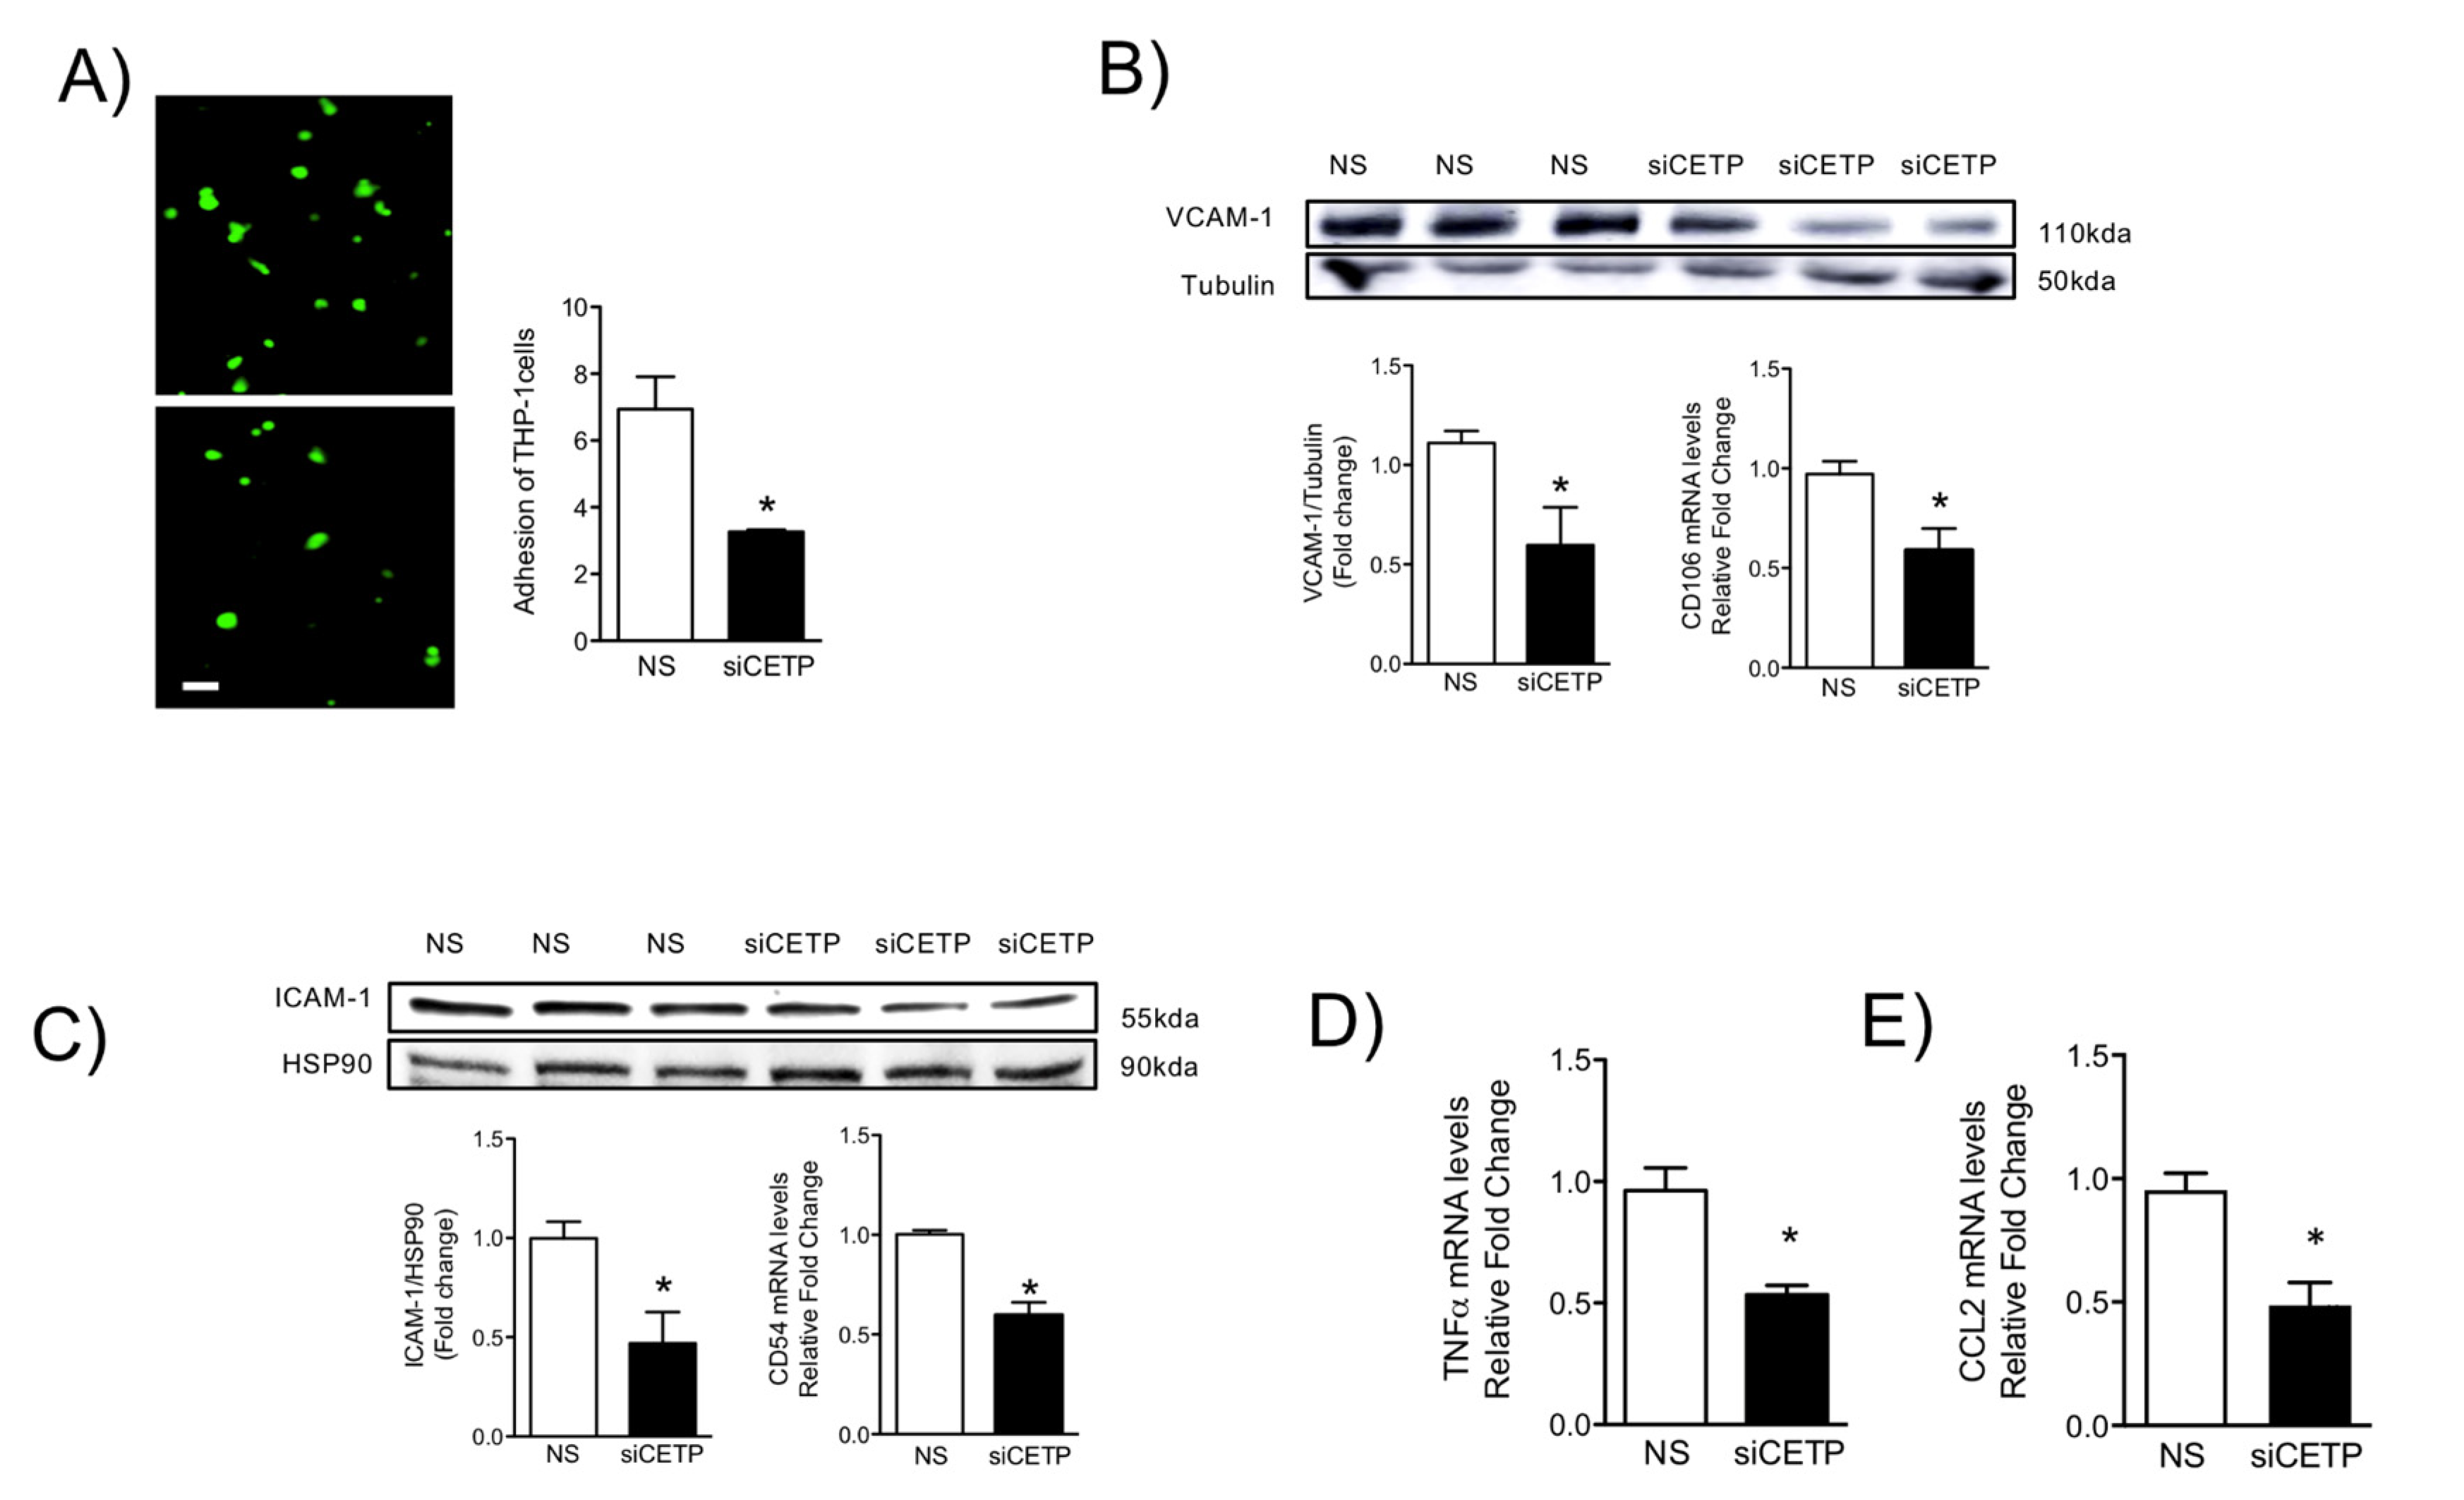
Oxidative stress and inflammation are tightly associated with endothelial activation [
40]. One feature of an activated endothelium is the upregulation of adhesion molecule expression [
41]. These adhesion molecules promote the recruitment of circulating monocytes that transmigrate into the sub-endothelial space, differentiate into macrophages, and become foam cells under atherogenic conditions. We showed that CETP inhibition in HAECs resulted in reduction of TNFα, CCL2, adhesion molecule ICAM-1, and VCAM-1 expression and monocyte trafficking. Together, these results suggest that CETP expression leads to EC dysfunction and may play a role in the setting of EC activation, which is a process that promotes the expression of adhesion molecules, resulting in the recruitment of monocytes/macrophages that could accelerate atherosclerosis.
The CETP effects on endothelial cells described here seem to be independent of HDL, since most of them were observed in in vitro and ex vivo systems. Thus, we hypothesize that CETP has a local intracellular function. Together with our results, the study of Lira and collaborators (2008) [
39] showing CETP induces ER stress support this proposition. In addition, Izem and Morton (2007) [
42] have shown that CETP expression modulates cholesterol and triglyceride homeostasis in the SW872 human liposarcoma cell line. They showed that CETP-deficient cells had inefficient CETP-mediated translocation of cholesterol and triglycerides from the ER to their site of storage. Thus, it is possible that CETP, as a lipid transfer protein, may affect the lipid composition and/or the amount of specific membrane domains highly relevant for endothelial cells. Our data show that inhibition of CETP decreases significantly lipid raft markers in HAECs, which may explain the effects on caveolin/NOS association and the eNOS activation state.
Taken together, our data suggest that CETP-driven endothelial cell oxidative stress is promoted by the major endothelial cell sources of ROS: NOX2 and mitochondria. We propose that CETP-induced ROS production leads to a reduced NO bioavailability and impaired endothelial function even in the presence of nNOS and eNOS activation. CETP induced ER stress is also associated with endothelial dysfunction. Considering that global CETP inhibition has not reached the expected benefits [
43,
44], the present results suggest that endothelial CETP inhibition may be a good strategy to decrease atherosclerosis risk.

 ,
, 
