Next Issue
Volume 12, June
Previous Issue
Volume 12, April


ISPRS Int. J. Geo-Inf., Volume 12, Issue 5 (May 2023) – 29 articles

Cover Story (view full-size image): 
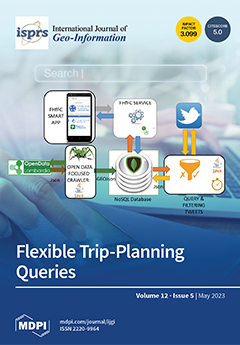
The increased mobility of people for jobs or leisure, reduction in long-term living in the same city, and fast modification of services (such as shops and service locations) are factors that increase the need to be rapidly and constantly aware of local resources and neighbors. In such a context, the current practice of searching on the Internet for different types of geo-resources in a geographic area to identify the most convenient routes for visiting the most relevant ones is inadequate since it requires the iterative formulation of several queries. To perform this task, in this contribution, we propose “flexible trip planning queries” which allow us to formulate a single query to identify the most relevant resources of the types of interest and to rank alternative routes to visit them by taking into account users’ preferences and visit priorities. View this paper
  • Issues are regarded as officially published after their release is announced to the table of contents alert mailing list.
  • You may sign up for e-mail alerts to receive table of contents of newly released issues.
  • PDF is the official format for papers published in both, html and pdf forms. To view the papers in pdf format, click on the "PDF Full-text" link, and use the free Adobe Reader to open them.
Order results
Result details
Select all
Export citation of selected articles as:
15 pages, 3503 KiB  
Article
Intelligent Short-Term Multiscale Prediction of Parking Space Availability Using an Attention-Enhanced Temporal Convolutional Network
by Ke Shang, Zeyu Wan, Yulin Zhang, Zhiwei Cui, Zihan Zhang, Chenchen Jiang and Feizhou Zhang
ISPRS Int. J. Geo-Inf. 2023, 12(5), 208; https://doi.org/10.3390/ijgi12050208 - 22 May 2023
Cited by 1 | Viewed by 1348
Abstract
The accurate and rapid prediction of parking availability is helpful for improving parking efficiency and to optimize traffic systems. However, previous studies have suffered from limited training sample sizes and a lack of thorough investigation into the correlations among the factors affecting parking [...] Read more.
The accurate and rapid prediction of parking availability is helpful for improving parking efficiency and to optimize traffic systems. However, previous studies have suffered from limited training sample sizes and a lack of thorough investigation into the correlations among the factors affecting parking availability. The purpose of this study is to explore a prediction method that can account for multiple factors. Firstly, a dynamic prediction method based on a temporal convolutional network (TCN) model was confirmed to be efficient for ultra-short-term parking availability with an accuracy of 0.96 MSE. Then, an attention-enhanced TCN (A-TCN) model based on spatial attention modules was proposed. This model integrates multiple factors, including related dates, extreme weather, and human control, to predict the daily congestion index of parking lots in the short term, with a prediction period of up to one month. Experimental results on real data demonstrate that the MSE of A-TCN is 0.0061, exhibiting better training efficiency and prediction accuracy than a traditional TCN for the short-term prediction time scale. Full article
Show Figures

Figure 1

26 pages, 47784 KiB  
Article
STO2Vec: A Multiscale Spatio-Temporal Object Representation Method for Association Analysis
by Nanyu Chen, Anran Yang, Luo Chen, Wei Xiong and Ning Jing
ISPRS Int. J. Geo-Inf. 2023, 12(5), 207; https://doi.org/10.3390/ijgi12050207 - 21 May 2023
Viewed by 1390
Abstract
Spatio-temporal association analysis has attracted attention in various fields, such as urban computing and crime analysis. The proliferation of positioning technology and location-based services has facilitated the expansion of association analysis across spatio-temporal scales. However, existing methods inadequately consider the scale differences among [...] Read more.
Spatio-temporal association analysis has attracted attention in various fields, such as urban computing and crime analysis. The proliferation of positioning technology and location-based services has facilitated the expansion of association analysis across spatio-temporal scales. However, existing methods inadequately consider the scale differences among spatio-temporal objects during analysis, leading to suboptimal precision in association analysis results. To remedy this issue, we propose a multiscale spatio-temporal object representation method, STO2Vec, for association analysis. This method comprises of two parts: graph construction and embedding. For graph construction, we introduce an adaptive hierarchical discretization method to distinguish the varying scales of local features. Then, we merge the embedding method for spatio-temporal objects with that for discrete units, establishing a heterogeneous graph. For embedding, to enhance embedding quality for homogeneous and heterogeneous data, we use biased sampling and unsupervised models to capture the association strengths between spatio-temporal objects. Empirical results using real-world open-source datasets show that STO2Vec outperforms other models, improving accuracy by 16.25% on average across diverse applications. Further case studies indicate STO2Vec effectively detects association relationships between spatio-temporal objects in a range of scenarios and is applicable to tasks such as moving object behavior pattern mining and trajectory semantic annotation. Full article
Show Figures

Figure 1

19 pages, 12477 KiB  
Article
MAAFEU-Net: A Novel Land Use Classification Model Based on Mixed Attention Module and Adjustable Feature Enhancement Layer in Remote Sensing Images
by Yonghong Zhang, Huajun Zhao, Guangyi Ma, Donglin Xie, Sutong Geng, Huanyu Lu, Wei Tian and Kenny Thiam Choy Lim Kam Sian
ISPRS Int. J. Geo-Inf. 2023, 12(5), 206; https://doi.org/10.3390/ijgi12050206 - 20 May 2023
Cited by 2 | Viewed by 1228
Abstract
The classification of land use information is important for land resource management. With the purpose of extracting precise spatial information, we present a novel land use classification model based on a mixed attention module and adjustable feature enhancement layer (MAAFEU-net). Our unique design, [...] Read more.
The classification of land use information is important for land resource management. With the purpose of extracting precise spatial information, we present a novel land use classification model based on a mixed attention module and adjustable feature enhancement layer (MAAFEU-net). Our unique design, the mixed attention module, allows the model to concentrate on target-specific discriminative features and capture class-related features within different land use types. In addition, an adjustable feature enhancement layer is proposed to further enhance the classification ability of similar types. We assess the performance of this model using the publicly available GID dataset and the self-built Gwadar dataset. Six semantic segmentation deep networks are used for comparison. The experimental results show that the F1 score of MAAFEU-net is 2.16% and 2.3% higher than the next model and that MIoU is 3.15% and 3.62% higher than the next model. The results of the ablation experiments show that the mixed attention module improves the MIoU by 5.83% and the addition of the adjustable feature enhancement layer can further improve it by 5.58%. Both structures effectively improve the accuracy of the overall land use classification. The validation results show that MAAFEU-net can obtain land use classification images with high precision. Full article
Show Figures

Figure 1

15 pages, 2630 KiB  
Article
Quantifying the Effect of Socio-Economic Predictors and the Built Environment on Mental Health Events in Little Rock, AR
by Alfieri Ek, Grant Drawve, Samantha Robinson and Jyotishka Datta
ISPRS Int. J. Geo-Inf. 2023, 12(5), 205; https://doi.org/10.3390/ijgi12050205 - 18 May 2023
Cited by 1 | Viewed by 1250
Abstract
Law enforcement agencies continue to grow in the use of spatial analysis to assist in identifying patterns of outcomes. Despite the critical nature of proper resource allocation for mental health incidents, there has been little progress in statistical modeling of the geo-spatial nature [...] Read more.
Law enforcement agencies continue to grow in the use of spatial analysis to assist in identifying patterns of outcomes. Despite the critical nature of proper resource allocation for mental health incidents, there has been little progress in statistical modeling of the geo-spatial nature of mental health events in Little Rock, Arkansas. In this article, we provide insights into the spatial nature of mental health data from Little Rock, Arkansas between 2015 and 2018, under a supervised spatial modeling framework. We provide evidence of spatial clustering and identify the important features influencing such heterogeneity via a spatially informed hierarchy of generalized linear, tree-based, and spatial regression models, viz. the Poisson regression model, the random forest model, the spatial Durbin error model, and the Manski model. The insights obtained from these different models are presented here along with their relative predictive performances. The inferential tools developed here can be used in a broad variety of spatial modeling contexts and have the potential to aid both law enforcement agencies and the city in properly allocating resources. We were able to identify several built-environment and socio-demographic measures related to mental health calls while noting that the results indicated that there are unmeasured factors that contribute to the number of events. Full article
Show Figures

Figure 1

22 pages, 3609 KiB  
Article
Flexible Trip-Planning Queries
by Gloria Bordogna, Paola Carrara, Luca Frigerio and Simone Lella
ISPRS Int. J. Geo-Inf. 2023, 12(5), 204; https://doi.org/10.3390/ijgi12050204 - 16 May 2023
Viewed by 1237
Abstract
The current practice of users searching for different types of geo-resources in a geographic area and wishing to identify the most convenient routes for visiting the most relevant ones, requires the iterative formulation of several queries: first to identify the more interesting resources [...] Read more.
The current practice of users searching for different types of geo-resources in a geographic area and wishing to identify the most convenient routes for visiting the most relevant ones, requires the iterative formulation of several queries: first to identify the more interesting resources and then to select the best route to visit them. In order to simplify this process, in this paper a novel functionality for a geographic information retrieval (GIR) system is proposed, which retrieves and ranks several routes for visiting a number of relevant georeferenced resources as a result of a single query, named flexible trip-planning query. An original retrieval model is defined to identify the relevant resources and to rank the most convenient routes by taking into account personal user preferences. To this end, a graph-based algorithm is defined, exploiting prioritized aggregation to optimize the routes’ identification and ranking. The proposed algorithm is applied in the proof-of-concept of a Smart cOmmunity-based Geographic infoRmation rEtrievAl SysTem (SO-GREAT) designed to strengthen local communities: it collects and manages open data from regional authorities describing categories of authoritative territorial resources and services, such as schools, hospitals, etc., and from volunteered geographic services (VGSs) created by citizens to offer services in their neighbourhood. Full article
Show Figures

Figure 1

17 pages, 4939 KiB  
Article
Variations in the Spatial Distribution of Smart Parcel Lockers in the Central Metropolitan Region of Tianjin, China: A Comparative Analysis before and after COVID-19
by Mengyue Ding, Nadeem Ullah, Sara Grigoryan, Yike Hu and Yan Song
ISPRS Int. J. Geo-Inf. 2023, 12(5), 203; https://doi.org/10.3390/ijgi12050203 - 16 May 2023
Cited by 1 | Viewed by 1612
Abstract
The COVID-19 pandemic has led to a significant increase in e-commerce, which has prompted residents to shift their purchasing habits from offline to online. As a result, Smart Parcel Lockers (SPLs) have emerged as an accessible end-to-end delivery service that fits into the [...] Read more.
The COVID-19 pandemic has led to a significant increase in e-commerce, which has prompted residents to shift their purchasing habits from offline to online. As a result, Smart Parcel Lockers (SPLs) have emerged as an accessible end-to-end delivery service that fits into the pandemic strategy of maintaining social distance and no-contact protocols. Although numerous studies have examined SPLs from various perspectives, few have analyzed their spatial distribution from an urban planning perspective, which could enhance the development of other disciplines in this field. To address this gap, we investigate the distribution of SPLs in Tianjin’s central urban area before and after the pandemic (i.e., 2019 and 2022) using kernel density estimation, average nearest neighbor analysis, standard deviation elliptic, and geographical detector. Our results show that, in three years, the number of SPLs has increased from 51 to 479, and a majority were installed in residential communities (i.e., 92.2% in 2019, and 97.7% in 2022). We find that SPLs were distributed randomly before the pandemic, but after the pandemic, SPLs agglomerated and followed Tianjin’s development pattern. We identify eight influential factors on the spatial distribution of SPLs and discuss their individual and compound effects. Our discussion highlights potential spatial distribution analysis, such as dynamic layout planning, to improve the allocation of SPLs in city planning and city logistics. Full article
Show Figures

Figure 1

23 pages, 5906 KiB  
Article
Isolated or Colocated? Exploring the Spatio-Temporal Evolution Pattern and Influencing Factors of the Attractiveness of Residential Areas to Restaurants in the Central Urban Area
by Ruien Tang, Guolin Hou and Rui Du
ISPRS Int. J. Geo-Inf. 2023, 12(5), 202; https://doi.org/10.3390/ijgi12050202 - 15 May 2023
Cited by 1 | Viewed by 1490
Abstract
Catering and urban elements have a strong spatial association. The spatial clustering and dispersal patterns of catering can effectively influence cities’ economic and socio-spatial reconfiguration. This research first introduced the concept of the ARTR (the attractiveness of residential areas to restaurants) and measured [...] Read more.
Catering and urban elements have a strong spatial association. The spatial clustering and dispersal patterns of catering can effectively influence cities’ economic and socio-spatial reconfiguration. This research first introduced the concept of the ARTR (the attractiveness of residential areas to restaurants) and measured its value as well as its spatial and temporal evolutionary patterns using global and local colocation quotients. The DBSCAN algorithm and spatial hot-spot analysis were used to analyze their spatial evolution patterns. On this basis, a multiscale geographically weighted regression (MGWR) model was used to analyze the scale of and spatial variation in the drivers. The results show that (1) Nanjing’s ARTR is at a low level, with the most significant decline in ARTR occurring from 2005 to 2020 for MRs and HRs, while LRs did not significantly respond to urban regeneration. (2) The spatial layout of the ARTR in Nanjing has gradually evolved from a circular structure to a semi-enclosed structure, and the circular structure has continued to expand outward. At the same time, the ARTR for different levels of catering shows a diverse distribution in the margins. (3) Urban expansion and regeneration have led to increasingly negative effects of the clustering level, commercial competition, economic level and neighborhood newness, while the density of the road network has been more stable. (4) The road network density has consistently remained a global influence. Commercial diversity has changed from a local factor to a global factor, while economic and locational factors have strongly spatially non-smooth relationships with the ARTR. The results of this study can provide a basis for a harmonious relationship between catering and residential areas in the context of urban expansion and regeneration. Full article
(This article belongs to the Special Issue Urban Geospatial Analytics Based on Crowdsourced Data)
Show Figures

Figure 1

17 pages, 1793 KiB  
Article
Crime Risk Analysis of Tangible Cultural Heritage in China from a Spatial Perspective
by Ning Ding, Yiming Zhai and Hongyu Lv
ISPRS Int. J. Geo-Inf. 2023, 12(5), 201; https://doi.org/10.3390/ijgi12050201 - 15 May 2023
Cited by 1 | Viewed by 1426
Abstract
Tangible cultural heritage is vulnerable to various risks, particularly those stemming from criminal activity. Through analyzing the distribution and flow of crime risks from a spatial perspective based on quantitative methods, risks can be better managed to contribute to the protection of cultural [...] Read more.
Tangible cultural heritage is vulnerable to various risks, particularly those stemming from criminal activity. Through analyzing the distribution and flow of crime risks from a spatial perspective based on quantitative methods, risks can be better managed to contribute to the protection of cultural heritage. This paper explores and summarizes the spatial characteristics of crime risks from 2011 to 2019 in China. Firstly, the average nearest neighbor (ANN) and the Jenks Natural Breaks Classification method showed that the national key protected heritage sites (NPS) and crime risks exhibit clustering features in space, and most of the NPS were located in the middle and lower reaches of the Yangtze River and the Yellow River. Secondly, the economy has no impact on crime risks in the spatial statistical analysis. However, the population density, distribution of NPS, and tourism development influenced specific types of crime risks. Finally, Global Moran’s I was used to examine the strong sensitivity between crime risks and cultural relics protection policies. The quantitative results of this study can be applied to improve strategies for crime risk prevention and the effectiveness of heritage security policy formulation. Full article
Show Figures

Figure 1

31 pages, 1397 KiB  
Review
A Survey of Methods and Input Data Types for House Price Prediction
by Margot Geerts, Seppe vanden Broucke and Jochen De Weerdt
ISPRS Int. J. Geo-Inf. 2023, 12(5), 200; https://doi.org/10.3390/ijgi12050200 - 14 May 2023
Cited by 5 | Viewed by 4772
Abstract
Predicting house prices is a challenging task that many researchers have attempted to address. As accurate house prices allow better informing parties in the real estate market, improving housing policies and real estate appraisal, a comprehensive overview of house price prediction strategies is [...] Read more.
Predicting house prices is a challenging task that many researchers have attempted to address. As accurate house prices allow better informing parties in the real estate market, improving housing policies and real estate appraisal, a comprehensive overview of house price prediction strategies is valuable for both research and society. In this work, we present a systematic literature review in order to provide insights with regard to the data types and modeling approaches that have been utilized in the current body of research. As such, we identified 93 articles published between 1992 and 2021 presenting a particular technique for house price prediction. Subsequently, we scrutinized these works and scored them according to model and data novelty. A cluster analysis allowed mapping of the property valuation domain and identification of trends. Although conventional methods and traditional input data remain predominant, house price prediction research is slowly adopting more advanced techniques and innovative data sources. In addition, we identify opportunities to include more advanced input data types such as unstructured data and complex spatial data and to introduce deep learning and tailored methods, which could guide further research. Full article
Show Figures

Figure 1

24 pages, 7561 KiB  
Article
Efficient Management and Scheduling of Massive Remote Sensing Image Datasets
by Jiankun Zhu, Zhen Zhang, Fei Zhao, Haoran Su, Zhengnan Gu and Leilei Wang
ISPRS Int. J. Geo-Inf. 2023, 12(5), 199; https://doi.org/10.3390/ijgi12050199 - 13 May 2023
Cited by 1 | Viewed by 1310
Abstract
The rapid development of remote sensing image sensor technology has led to exponential increases in available image data. The real-time scheduling of gigabyte-level images and the storage and management of massive image datasets are incredibly challenging for current hardware, networking and storage systems. [...] Read more.
The rapid development of remote sensing image sensor technology has led to exponential increases in available image data. The real-time scheduling of gigabyte-level images and the storage and management of massive image datasets are incredibly challenging for current hardware, networking and storage systems. This paper’s three novel strategies (ring caching, multi-threading and tile-prefetching mechanisms) are designed to comprehensively optimize the remote sensing image scheduling process from image retrieval, transmission and visualization perspectives. A novel remote sensing image management and scheduling system (RSIMSS) is designed using these three strategies as its core algorithm, the PostgreSQL database and HDFS distributed file system as its underlying storage system, and the multilayer Hilbert spatial index and image tile pyramid to organize massive remote sensing image datasets. Test results show that the RSIMSS provides efficient and stable image storage performance and allows real-time image scheduling and view roaming. Full article
Show Figures

Figure 1

17 pages, 5740 KiB  
Article
A Dynamic Management and Integration Framework for Models in Landslide Early Warning System
by Liang Liu, Jiqiu Deng and Yu Tang
ISPRS Int. J. Geo-Inf. 2023, 12(5), 198; https://doi.org/10.3390/ijgi12050198 - 13 May 2023
Cited by 1 | Viewed by 1601
Abstract
The landslide early warning system (LEWS) relies on various models for data processing, prediction, forecasting, and warning level discrimination. The potential different programming implementations and dependencies of these models complicate the deployment and integration of LEWS. Moreover, the coupling between LEWS and models [...] Read more.
The landslide early warning system (LEWS) relies on various models for data processing, prediction, forecasting, and warning level discrimination. The potential different programming implementations and dependencies of these models complicate the deployment and integration of LEWS. Moreover, the coupling between LEWS and models makes it hard to modify or replace models rapidly and dynamically according to changes in business requirements (such as updating the early warning business process, adjusting the model parameters, etc.). This paper proposes a framework for dynamic management and integration of models in LEWS by using WebAPIs and Docker to standardize model interfaces and facilitate model deployment, using Kubernetes and Istio to enable microservice architecture, dynamic scaling, and high availability of models, and using a model repository management system to manage and orchestrate model-related information and application processes. The results of applying this framework to a real LEWS demonstrate that our approach can support efficient deployment, management, and integration of models within the system. Furthermore, it provides a rapid and feasible implementation method for upgrading, expanding, and maintaining LEWS in response to changes in business requirements. Full article
(This article belongs to the Topic Advances in Earth Observation and Geosciences)
Show Figures

Figure 1

17 pages, 25111 KiB  
Article
Evaluating Landslide Susceptibility Using Sampling Methodology and Multiple Machine Learning Models
by Yingze Song, Degang Yang, Weicheng Wu, Xin Zhang, Jie Zhou, Zhaoxu Tian, Chencan Wang and Yingxu Song
ISPRS Int. J. Geo-Inf. 2023, 12(5), 197; https://doi.org/10.3390/ijgi12050197 - 13 May 2023
Cited by 6 | Viewed by 1635
Abstract
Landslide susceptibility assessment (LSA) based on machine learning methods has been widely used in landslide geological hazard management and research. However, the problem of sample imbalance in landslide susceptibility assessment, where landslide samples tend to be much smaller than non-landslide samples, is often [...] Read more.
Landslide susceptibility assessment (LSA) based on machine learning methods has been widely used in landslide geological hazard management and research. However, the problem of sample imbalance in landslide susceptibility assessment, where landslide samples tend to be much smaller than non-landslide samples, is often overlooked. This problem is often one of the important factors affecting the performance of landslide susceptibility models. In this paper, we take the Wanzhou district of Chongqing city as an example, where the total number of data sets is more than 580,000 and the ratio of positive to negative samples is 1:19. We oversample or undersample the unbalanced landslide samples to make them balanced, and then compare the performance of machine learning models with different sampling strategies. Three classic machine learning algorithms, logistic regression, random forest and LightGBM, are used for LSA modeling. The results show that the model trained directly using the unbalanced sample dataset performs the worst, showing an extremely low recall rate, indicating that its predictive ability for landslide samples is extremely low and cannot be applied in practice. Compared with the original dataset, the sample set optimized through certain methods has demonstrated improved predictive performance across various classifiers, manifested in the improvement of AUC value and recall rate. The best model was the random forest model using over-sampling (O_RF) (AUC = 0.932). Full article
Show Figures

Figure 1

24 pages, 6698 KiB  
Article
A Deep Transfer Learning Toponym Extraction and Geospatial Clustering Framework for Investigating Scenic Spots as Cognitive Regions
by Chengkun Zhang, Yiran Zhang, Jiajun Zhang, Junwei Yao, Hongjiu Liu, Tao He, Xinyu Zheng, Xingyu Xue, Liang Xu, Jing Yang, Yuanyuan Wang and Liuchang Xu
ISPRS Int. J. Geo-Inf. 2023, 12(5), 196; https://doi.org/10.3390/ijgi12050196 - 12 May 2023
Cited by 3 | Viewed by 1755
Abstract
In recent years, the Chinese tourism industry has developed rapidly, leading to significant changes in the relationship between people and space patterns in scenic regions. To attract more tourists, the surrounding environment of a scenic region is usually well developed, attracting a large [...] Read more.
In recent years, the Chinese tourism industry has developed rapidly, leading to significant changes in the relationship between people and space patterns in scenic regions. To attract more tourists, the surrounding environment of a scenic region is usually well developed, attracting a large number of human activities, which creates a cognitive range for the scenic region. From the perspective of tourism, tourists’ perceptions of the region in which tourist attractions are located in a city usually differ from the objective region of the scenic spots. Among them, social media serves as an important medium for tourists to share information about scenic spots and for potential tourists to learn scenic spot information, and it interacts to influence people’s perceptions of the destination image. Extracting the names of tourist attractions from social media data and exploring their spatial distribution patterns is the basis for research on the cognitive region of tourist attractions. This study takes Hangzhou, a well-known tourist city in China, as a case study to explore the human cognitive region of its popular scenic spots. First, we propose a Chinese tourist attraction name extraction model based on RoBERTa-BiLSTM-CRF to extract the names of tourist attractions from social media data. Then, we use a multi-distance spatial clustering method called Ripley’s K to filter the extracted tourist attraction names. Finally, we combine road network data and polygons generated using the chi-shape algorithm to construct the vague cognitive regions of each scenic spot. The results show that the classification indicators of our proposed tourist attraction name extraction model are significantly better than those of previous toponym extraction models and algorithms (precision = 0.7371, recall = 0.6926, F1 = 0.7141), and the extracted vague cognitive regions of tourist attractions also generally conform to people’s habitual cognition. Full article
(This article belongs to the Special Issue Urban Geospatial Analytics Based on Crowdsourced Data)
Show Figures

Figure 1

20 pages, 8792 KiB  
Article
Dominant Modes of Agricultural Production Helped Structure Initial COVID-19 Spread in the U.S. Midwest
by Luke Bergmann, Luis Fernando Chaves, David O’Sullivan and Robert G. Wallace
ISPRS Int. J. Geo-Inf. 2023, 12(5), 195; https://doi.org/10.3390/ijgi12050195 - 9 May 2023
Cited by 3 | Viewed by 3364
Abstract
The spread of COVID-19 is geographically uneven in agricultural regions. Explanations proposed include differences in occupational risks, access to healthcare, racial inequalities, and approaches to public health. Here, we additionally explore the impacts of coexisting modes of agricultural production across counties from twelve [...] Read more.
The spread of COVID-19 is geographically uneven in agricultural regions. Explanations proposed include differences in occupational risks, access to healthcare, racial inequalities, and approaches to public health. Here, we additionally explore the impacts of coexisting modes of agricultural production across counties from twelve midwestern U.S. states. In modeling COVID-19 spread before vaccine authorization, we employed and extended spatial statistical methods that make different assumptions about the natures and scales of underlying sociospatial processes. In the process, we also develop a novel approach to visualizing the results of geographically weighted regressions that allows us to identify distinctive regional regimes of epidemiological processes. Our approaches allowed for models using abstract spatial weights (e.g., inverse-squared distances) to be meaningfully improved by also integrating process-specific relations (e.g., the geographical relations of the food system or of commuting). We thus contribute in several ways to methods in health geography and epidemiology for identifying contextually sensitive public engagements in socio-eco-epidemiological issues. Our results further show that agricultural modes of production are associated with the spread of COVID-19, with counties more engaged in modes of regenerative agricultural production having lower COVID-19 rates than those dominated by modes of conventional agricultural production, even when accounting for other factors. Full article
(This article belongs to the Collection Spatial Components of COVID-19 Pandemic)
Show Figures

Figure 1

25 pages, 5330 KiB  
Article
Convolutional Neural Network-Based Deep Learning Approach for Automatic Flood Mapping Using NovaSAR-1 and Sentinel-1 Data
by Ogbaje Andrew, Armando Apan, Dev Raj Paudyal and Kithsiri Perera
ISPRS Int. J. Geo-Inf. 2023, 12(5), 194; https://doi.org/10.3390/ijgi12050194 - 8 May 2023
Cited by 4 | Viewed by 2410
Abstract
The accuracy of most SAR-based flood classification and segmentation derived from semi-automated algorithms is often limited due to complicated radar backscatter. However, deep learning techniques, now widely applied in image classifications, have demonstrated excellent potential for mapping complex scenes and improving flood mapping [...] Read more.
The accuracy of most SAR-based flood classification and segmentation derived from semi-automated algorithms is often limited due to complicated radar backscatter. However, deep learning techniques, now widely applied in image classifications, have demonstrated excellent potential for mapping complex scenes and improving flood mapping accuracy. Therefore, this study aims to compare the image classification accuracy of three convolutional neural network (CNN)-based encoder–decoders (i.e., U-Net, PSPNet and DeepLapV3) by leveraging the end-to-end ArcGIS Pro workflow. A specific objective of this method consists of labelling and training each CNN model separately on publicly available dual-polarised pre-flood data (i.e., Sentinel-1 and NovaSAR-1) based on the ResNet convolutional backbone via a transfer learning approach. The neural network results were evaluated using multiple model training trials, validation loss, training loss and confusion matrix from test datasets. During testing on the post-flood data, the results revealed that U-Net marginally outperformed the other models. In this study, the overall accuracy and F1-score reached 99% and 98% on the test data, respectively. Interestingly, the segmentation results showed less use of manual cleaning, thus encouraging the use of open-source image data for the rapid, accurate and continuous monitoring of floods using the CNN-based approach. Full article
Show Figures

Figure 1

15 pages, 2718 KiB  
Article
The Non-Linear Influence of Built Environment on the School Commuting Metro Ridership: The Case in Wuhan, China
by Jinming Yan, Qiuyu Wan, Jingyi Feng, Jianjun Wang, Yiwen Hu and Xuexin Yan
ISPRS Int. J. Geo-Inf. 2023, 12(5), 193; https://doi.org/10.3390/ijgi12050193 - 6 May 2023
Cited by 2 | Viewed by 1400
Abstract
Although many studies have investigated the non-linear relationship between the built environment and rail patronage, it remains unclear whether this influence is equally applicable to primary and secondary school students due to their physiological characteristics and cognitive limitations. This study applies the GBDT [...] Read more.
Although many studies have investigated the non-linear relationship between the built environment and rail patronage, it remains unclear whether this influence is equally applicable to primary and secondary school students due to their physiological characteristics and cognitive limitations. This study applies the GBDT model to Wuhan student metro swipe data in order to investigate the relative importance and non-linear association of the built environment on the school-commuting metro ridership. The results show that the variable with the greatest predictive power is the number of living service facilities followed by the number of intersections, and the degree of land-use mixture. All of the built environment variables had non-linear associations with the school-commuting ridership, and the greatest attraction to the school-commuting metro ridership occurred when the number of living service facilities was 500, the number of intersections was 36, and the degree of land-use mixture was 0.8. These findings can help planners to prioritize land-use optimization and the effective range of land-use indicators when developing child-friendly rail transport policies. Full article
Show Figures

Figure 1

19 pages, 8451 KiB  
Article
Linguistic Landscape of Arabs in New York City: Application of a Geosemiotics Analysis
by Siham Mousa Alhaider
ISPRS Int. J. Geo-Inf. 2023, 12(5), 192; https://doi.org/10.3390/ijgi12050192 - 5 May 2023
Viewed by 2231
Abstract
The investigation of linguistic landscapes (LL) among the Arab community in downtown Brooklyn, New York City, is an underserved public space in the literature. This research focused on social and commercial or ‘bottom-up signs’ in LL to understand their purpose, origin and target [...] Read more.
The investigation of linguistic landscapes (LL) among the Arab community in downtown Brooklyn, New York City, is an underserved public space in the literature. This research focused on social and commercial or ‘bottom-up signs’ in LL to understand their purpose, origin and target audience. Drawing upon discourse analysis, the study was conceptualized according to the principles of border theory and geosemiotics. The latter was used to analyze the data, which consisted of random photographs of shopfronts in Brooklyn taken with a digital camera during the summer of 2016. The three semiotic aggregates used for analysis consisted of interaction order, visual and place semiotics. The data analysis showed the multi-layered nature of LL in this urban community and the subjectiveness of spatial borders through a combination of text and symbolic imagery. The paper highlights the importance of commercial signs in the LL among ethnic minority communities. Full article
(This article belongs to the Special Issue Urban Geospatial Analytics Based on Crowdsourced Data)
Show Figures

Figure 1

16 pages, 5894 KiB  
Article
Towards the Monitoring of Underground Caves Using Geomatics and Geophysical Techniques: 3D Analyses and Seismic Response
by Paolo Dabove, Chiara Colombero and Andrea Salerno Quaroni
ISPRS Int. J. Geo-Inf. 2023, 12(5), 191; https://doi.org/10.3390/ijgi12050191 - 5 May 2023
Cited by 1 | Viewed by 1482
Abstract
Analyses of climate change, due to its impact not only on the weather and the environment but also on human health and life, are one of the most important study activities made in recent years. There is relatively high confidence that glacial melt [...] Read more.
Analyses of climate change, due to its impact not only on the weather and the environment but also on human health and life, are one of the most important study activities made in recent years. There is relatively high confidence that glacial melt and heavy rainfall events will continue to increase. These climate-related events carry a microseismic signature that can guide monitoring activities. In the last decade, there have been growing applications of long-term continuous ambient seismic noise systems to monitor landslides and potentially unstable rock sites. This work reports some of the activities made during a project performed under the Department of Excellence on Climate Change (2018–2022), funded by the Italian Ministry for University and Research (MUR), in order to improve environmental seismic analyses. The selected test site is the Bossea Cave (NW Italy), where two seismic stations were installed. The goals were to use these stations to understand and study climate change events above the Bossea Cave, analyzing the data from a geophysical and geomatics point of view. Starting with UAV flights and photogrammetric processing to obtain a 3D model of the cave, both ambient seismic noise and microseismicity analyses highlighted an important effect of air temperature and precipitation on the seismic response of the monitored rock mass overlying the Bossea Cave. In particular, a clear effect on the ambient seismic noise spectral content and the peak frequency of the microseismic events driven by temperature and precipitation was found during the warmer monitoring months, with almost zero delays in the seismic response. This is a preliminary but important study, even if longer monitoring data and thermal modeling efforts are needed to fully understand this seasonal variation. Full article
Show Figures

Figure 1

14 pages, 10720 KiB  
Article
Importance of Protected Areas by Brazilian States to Reduce Deforestation in the Amazon
by Marcos V. L. Sousa, Silas N. Melo, Juciana C. B. Souza, Carlos F. A. Silva, Yuri Feitosa and Lindon F. Matias
ISPRS Int. J. Geo-Inf. 2023, 12(5), 190; https://doi.org/10.3390/ijgi12050190 - 4 May 2023
Cited by 1 | Viewed by 2110
Abstract
Protected areas (PAs) help in strategies for maintaining biodiversity and inhibiting deforestation of the Amazon rainforest. However, there are few studies that evaluate the effectiveness of lands protected by states (or federation units). Our goal was to compare land use change over 35 [...] Read more.
Protected areas (PAs) help in strategies for maintaining biodiversity and inhibiting deforestation of the Amazon rainforest. However, there are few studies that evaluate the effectiveness of lands protected by states (or federation units). Our goal was to compare land use change over 35 years in state-level PAs with another area of protection, both in the Amazon of the Maranhão state, Brazil. We employed remote sensing techniques, the geographic information system (GIS), and statistical analysis with the use of analyses of covariance (ANCOVAS) to analyze the presence of the classes of land use and change in the PA. The results indicate that the state PAs were effective in preserving forest cover and decelerating grazing. The implications of the results are discussed in the context of supporting public policies at the state level for the protection of the Amazon. Full article
(This article belongs to the Special Issue Geomatics in Forestry and Agriculture: New Advances and Perspectives)
Show Figures

Figure 1

19 pages, 3187 KiB  
Article
Spatiotemporal Distribution and Influencing Factors of Theft during the Pre-COVID-19 and COVID-19 Periods: A Case Study of Haining City, Zhejiang, China
by Xiaomin Jiang, Ziwan Zheng, Ye Zheng and Zhewei Mao
ISPRS Int. J. Geo-Inf. 2023, 12(5), 189; https://doi.org/10.3390/ijgi12050189 - 4 May 2023
Viewed by 1941
Abstract
Theft is an inevitable problem in the context of urbanization and poses a challenge to people’s lives and social stability. The study of theft and criminal behavior using spatiotemporal, big, demographic, and neighborhood data is important for guiding security prevention and control. In [...] Read more.
Theft is an inevitable problem in the context of urbanization and poses a challenge to people’s lives and social stability. The study of theft and criminal behavior using spatiotemporal, big, demographic, and neighborhood data is important for guiding security prevention and control. In this study, we analyzed the theft frequency and location characteristics of the study area through mathematical statistics and hot spot analysis methods to discover the spatiotemporal divergence characteristics of theft in the study area during the pre-COVID-19 and COVID-19 periods. We detected the spatial variation pattern of the regression coefficients of the local areas of thefts in Haining City by modeling the influencing factors using the geographically weighted regression (GWR) analysis method. The results explained the relationship between theft and the influencing factors and showed that the regression coefficients had both positive and negative values in the pre-COVID-19 and COVID-19 periods, indicating that the spatial distribution of theft in urban areas of Haining City was not smooth. Factors related to life and work indicated densely populated areas had increased theft, and theft was negatively correlated with factors related to COVID-19. The other influencing factors were different in terms of their spatial distributions. Therefore, in terms of police prevention and control, video surveillance and police patrols need to be deployed in a focused manner to increase their inhibiting effect on theft according to the different effects of influencing factors during the pre-COVID-19 and COVID-19 periods. Full article
(This article belongs to the Collection Spatial Components of COVID-19 Pandemic)
Show Figures

Figure 1

15 pages, 2072 KiB  
Article
Analysis of Road Networks Features of Urban Municipal District Based on Fractal Dimension
by Hongxing Deng, Wen Wen and Wenhui Zhang
ISPRS Int. J. Geo-Inf. 2023, 12(5), 188; https://doi.org/10.3390/ijgi12050188 - 4 May 2023
Cited by 3 | Viewed by 1532
Abstract
The structural characteristics of an urban road network directly affect the urban road network’s overall function and service level. Because the hierarchical division and layout form of an urban road network has self-similarity and scale invariance, the urban traffic network has certain time-space [...] Read more.
The structural characteristics of an urban road network directly affect the urban road network’s overall function and service level. Because the hierarchical division and layout form of an urban road network has self-similarity and scale invariance, the urban traffic network has certain time-space fractal characteristics, and fractal theory has become a powerful tool for evaluating traffic networks. This paper calculates and compares five fractal dimensions (FD) of nine districts in Harbin. Meanwhile, each calculated FD is linearly regressed with the area, population, built-up area, building area, the total number and length of roads, and the number of buildings in the region. The results show that the fractal dimensions of the five types are between 1 and 2. In the same district, the values of the FD perimeter and FD ruler are lower compared to the FD box, FD information, and FD mass, whereas those of the FD box and FD information are higher. Compared to the FD box and FD information, the value of FD mass shows unevenly. Based on the current research results, this study discusses the feasibility of using relevant indicators in the fractal process to evaluate the layout of the urban road network and guide its optimization and adjustment. Full article
Show Figures

Figure 1

20 pages, 6183 KiB  
Article
Finding and Evaluating Community Structures in Spatial Networks
by You Wan, Xicheng Tan and Hua Shu
ISPRS Int. J. Geo-Inf. 2023, 12(5), 187; https://doi.org/10.3390/ijgi12050187 - 4 May 2023
Cited by 2 | Viewed by 1559
Abstract
Community detection can reveal unknown spatial structures embedded in spatial networks. Current spatial community detection methods are mostly modularity-based. However, due to the lack of appropriate spatial networks serving as a benchmark, the accuracy and effectiveness of these methods have not been tested [...] Read more.
Community detection can reveal unknown spatial structures embedded in spatial networks. Current spatial community detection methods are mostly modularity-based. However, due to the lack of appropriate spatial networks serving as a benchmark, the accuracy and effectiveness of these methods have not been tested sufficiently so far. This study first introduced a spatial autoregressive and gravity model united method (SARGM) to simulate benchmark spatial networks with known regional distributions. Then, a novel spectral clustering-based spatial community detection method (SCSCD) was proposed to identify spatial communities from eight kinds of benchmark spatial networks. Comparative experiments on SCSCD and three other methods showed that SCSCD performed the best in accuracy and effectiveness. Moreover, the scale parameter and the community number setting of the SCSCD were investigated experimentally. Finally, a case study was applied to the SCSCD to demonstrate its ability to extract the internal community structure of a high-speed train network in China. Full article
Show Figures

Figure 1

23 pages, 11603 KiB  
Article
Assessment of Perceived and Physical Walkability Using Street View Images and Deep Learning Technology
by Youngok Kang, Jiyeon Kim, Jiyoung Park and Jiyoon Lee
ISPRS Int. J. Geo-Inf. 2023, 12(5), 186; https://doi.org/10.3390/ijgi12050186 - 2 May 2023
Cited by 3 | Viewed by 3036
Abstract
As neighborhood walkability has gradually become an important topic in various fields, many cities around the world are promoting an eco-friendly and people-centered walking environment as a top priority in urban planning. The purpose of this study is to visualize physical and perceived [...] Read more.
As neighborhood walkability has gradually become an important topic in various fields, many cities around the world are promoting an eco-friendly and people-centered walking environment as a top priority in urban planning. The purpose of this study is to visualize physical and perceived walkability in detail and analyze the differences to prepare alternatives for improving the neighborhood’s walking environment. The study area is Jeonju City, one of the medium-sized cities in Korea. For the evaluation of perceived walkability, 196,624 street view images were crawled and 127,317 pairs of training datasets were constructed. After developing a convolutional neural network model, the scores of perceived walkability are predicted. For the evaluation of physical walkability, eight indicators are selected, and the score of overall physical walkability is calculated by combining the scores of the eight indicators. After that, the scores of perceived and physical walkability are visualized, and the difference between them is analyzed. This study is novel in three aspects. First, we develop a deep learning model that can improve the accuracy of perceived walkability using street view images, even in small and medium-sized cities. Second, in analyzing the characteristics of street view images, the possibilities and limitations of the semantic segmentation technique are confirmed. Third, the differences between perceived and physical walkability are analyzed in detail, and how the results of our study can be used to prepare alternatives for improving the walking environment is presented. Full article
(This article belongs to the Special Issue Urban Geospatial Analytics Based on Crowdsourced Data)
Show Figures

Figure 1

22 pages, 808 KiB  
Article
Assessment of the Croatian Open Data Portal Using User-Oriented Metrics
by Andrea Miletić, Ana Kuveždić Divjak and Frederika Welle Donker
ISPRS Int. J. Geo-Inf. 2023, 12(5), 185; https://doi.org/10.3390/ijgi12050185 - 2 May 2023
Cited by 2 | Viewed by 2451
Abstract
Open data portals are web services that serve as a central access point for all government-published open data and can exist at local, regional, national, and international levels. They are an important element of most open data initiatives that have enabled a large [...] Read more.
Open data portals are web services that serve as a central access point for all government-published open data and can exist at local, regional, national, and international levels. They are an important element of most open data initiatives that have enabled a large amount of government data to be widely available. However, data quantity and quality are not the only aspects that should be considered when publishing data. To improve the reusability of data and to achieve greater impact and benefits from open data, it is important to consider user-oriented aspects of the portal management, discovery, and use of data (e.g., organizing the portal in a user-centric way, providing accurate metadata, using a standardized and open data format, etc.). In this paper, we adopted the metrics proposed by the European Commission to assess compliance of the Croatian Open Data Portal with 10 user-oriented principles that open data portals should implement in terms of sustainability and added value. While the results show the government’s efforts in publishing data, some aspects such as better collaboration with data providers and other data portals, offering different visualization tools, etc. need to be improved to achieve active use and impact. Full article
Show Figures

Figure 1

21 pages, 3084 KiB  
Article
Assessing SDI Implementation Scenarios to Facilitate Emergency Mapping Operations in the Dominican Republic
by Gregorio Rosario Michel, María Ester Gonzalez-Campos, Fernando Manzano Aybar and Joep Crompvoets
ISPRS Int. J. Geo-Inf. 2023, 12(5), 184; https://doi.org/10.3390/ijgi12050184 - 28 Apr 2023
Cited by 1 | Viewed by 1727
Abstract
The Dominican Republic (DR) is a small island developing state (SIDS) highly exposed to disaster-risk phenomena, such as earthquakes, hurricanes, etc. The Spatial Data Infrastructure (SDI) enables coordination and sharing of spatial information and services from multiple sources, while emergency mapping operations (EMO) [...] Read more.
The Dominican Republic (DR) is a small island developing state (SIDS) highly exposed to disaster-risk phenomena, such as earthquakes, hurricanes, etc. The Spatial Data Infrastructure (SDI) enables coordination and sharing of spatial information and services from multiple sources, while emergency mapping operations (EMO) help decision-makers build a common operational picture (COP) of impacted communities. Assessment of future scenarios for SDI implementation to meet emergency mapping goals requires the consideration of a wide range of stakeholders with different objectives. We make use of multi-actor multi-criteria analysis (MAMCA) in the case study of DR to evaluate government, private sector, emergency mapping team (EMT), and academia perspectives of three governance scenarios (Going-Concern, Increasing-Hierarchy, and Increasing-Network) for SDI implementation. Our findings suggest that the ‘Increasing Network’ scenario is the most suitable for SDI implementation. A well-coordinated inter-organizational network through a SDI should empower more stakeholders to participate in EMO. This work highlighted the increase of public-private partnerships as a key criterion to share costs and efforts to effectively support emergency mapping tasks. Findings reported herein could assist decision-makers in designing roadmaps to enhance SDI implementation in the DR. This knowledge will also support future studies/practices in other SIDS, which share similar natural hazards and development issues. Full article
Show Figures

Figure 1

18 pages, 3060 KiB  
Article
Mesoscale Structure in Urban–Rural Mobility Networks in the Pearl River Delta Area: A Weighted Stochastic Block Modeling Analysis
by Yurun Wang, Pu Zhao, Senkai Xie and Wenjia Zhang
ISPRS Int. J. Geo-Inf. 2023, 12(5), 183; https://doi.org/10.3390/ijgi12050183 - 27 Apr 2023
Cited by 1 | Viewed by 1587
Abstract
Understanding the spatial structure of a megaregion with urban and rural areas is crucial for promoting sustainable urbanization and urban–rural integration. Compared to the city network (or the network of urban areas), however, fewer studies focus on the network connecting rural areas or [...] Read more.
Understanding the spatial structure of a megaregion with urban and rural areas is crucial for promoting sustainable urbanization and urban–rural integration. Compared to the city network (or the network of urban areas), however, fewer studies focus on the network connecting rural areas or on the comparison of regional structures between urban and rural networks. Using weighted daily mobility flows from the massive mobile-phone signaling data, this study constructs an urban–urban mobility (UUM) network and an urban–rural mobility (URM) network in the Pearl River Delta (PRD) region. A weighted stochastic block model (WSBM) was adopted to identify and compare the latent mesoscale structures in the two networks. Results investigated a gradient community mesoscale structure nested with typical core–periphery (CP) structures in the UUM network and an asymmetric bipartite mesoscale structure mixed with CP hierarchies in the URM network. In a comparison of the different spatial configuration of urban/rural nodes and groupings of their roles, positions, and linkages, the study yielded empirical insights for renewed urban–rural interaction and potential planning pathways towards urban–rural integration. Full article
Show Figures

Figure 1

31 pages, 3124 KiB  
Review
The Use of Decision Support in Search and Rescue: A Systematic Literature Review
by Wajeeha Nasar, Ricardo Da Silva Torres, Odd Erik Gundersen and Anniken T. Karlsen
ISPRS Int. J. Geo-Inf. 2023, 12(5), 182; https://doi.org/10.3390/ijgi12050182 - 25 Apr 2023
Cited by 4 | Viewed by 3341
Abstract
Whenever natural and human-made disasters strike, the proper response of the concerned authorities often relies on search and rescue services. Search and rescue services are complex multidisciplinary processes that involve several degrees of interdependent assignments. To handle such complexity, decision support systems are [...] Read more.
Whenever natural and human-made disasters strike, the proper response of the concerned authorities often relies on search and rescue services. Search and rescue services are complex multidisciplinary processes that involve several degrees of interdependent assignments. To handle such complexity, decision support systems are used for decision-making and execution of plans within search and rescue operations. Advances in data management solutions and artificial intelligence technologies have provided better opportunities to make more efficient and effective decisions that can lead to improved search and rescue operations. This paper provides findings from a bibliometric mapping and a systematic literature review performed to: (1) identify existing search and rescue processes that use decision support systems, data management solutions, and artificial intelligence technologies; (2) do a comprehensive analysis of existing solutions in terms of their research contributions to the investigated domain; and (3) investigate the potential for knowledge transfer between application areas. The main findings of this review are that non-conventional data management solutions are commonly used in land rescue operations and that geographical information systems have been integrated with various machine learning approaches for land rescue. However, there is a gap in the existing research on search and rescue decision support at sea, which can motivate future studies within this specific application area. Full article
Show Figures

Figure 1

21 pages, 10571 KiB  
Article
MAC-GAN: A Community Road Generation Model Combining Building Footprints and Pedestrian Trajectories
by Lin Yang, Jing Wei, Zejun Zuo and Shunping Zhou
ISPRS Int. J. Geo-Inf. 2023, 12(5), 181; https://doi.org/10.3390/ijgi12050181 - 25 Apr 2023
Cited by 1 | Viewed by 1517
Abstract
Community roads are crucial to community navigation. There are automatic methods to obtain community roads using trajectories, but the sparsity and uneven density distribution of community trajectories present significant challenges in identifying community roads. To overcome these challenges, we propose a conditional generative [...] Read more.
Community roads are crucial to community navigation. There are automatic methods to obtain community roads using trajectories, but the sparsity and uneven density distribution of community trajectories present significant challenges in identifying community roads. To overcome these challenges, we propose a conditional generative adversarial network (MAC-GAN) supervised by pedestrian trajectories and neighborhood building footprints for road generation. MAC-GAN packs the “road trajectory–building footprint” pairs into images to characterize implicit ternary relations and sets up a multi-scale skip-connected and asymmetric convolution-based generator to incorporate such a relationship, in which the generator and discriminator mutually learn to optimize the network parameters and then derive approximate optimal results. Experiments on 37 real-world community datasets in Wuhan, China, are conducted to verify the effectiveness of the proposed model. The experimental results show that the F1 score of our model increases by 1.7–6.8%, and the IOU of our model increases by 2.2–7.5% compared with three baselines (i.e., Pix2pix, GANmapper, and DLinkGAN (configured by DLinknet)). In areas with sparse and missing trajectory data, the generated fine roads have high accuracy with the supervision of building footprints. Full article
Show Figures

Figure 1

23 pages, 11993 KiB  
Article
GIS Analysis of Adequate Accessibility to Public Transportation in Metropolitan Areas
by Sultan Alamri, Kiki Adhinugraha, Nasser Allheeib and David Taniar
ISPRS Int. J. Geo-Inf. 2023, 12(5), 180; https://doi.org/10.3390/ijgi12050180 - 25 Apr 2023
Cited by 4 | Viewed by 3160
Abstract
The public transport system plays an important role in a city as it moves people from one place to another efficiently and economically. The public transport network must be organized in a way that will cover as many places and as much of [...] Read more.
The public transport system plays an important role in a city as it moves people from one place to another efficiently and economically. The public transport network must be organized in a way that will cover as many places and as much of the population as possible, and support the city’s growth. As one of Australia’s largest capital cities, Melbourne is growing and expanding its metropolitan area to reflect the growth in population and an increased number of activities. To date, little research has been conducted to determine the accessibility and adequacy of public transport taking into consideration the blank spot areas, the number of public transport options for each area, the population density within specific geographical areas, and other issues. In this study, a new measurement model is developed that examines public transport in residential areas and the extent to which it is adequate for the various local government areas (LGAs). An accessibility approach is adopted to evaluate the accessibility of different types of public transportation in residential areas in metropolitan Melbourne, Victoria, Australia. The results show that in most LGAs, the number of blank spots will decrease as the population density increases. This indicates that residents in lower-density areas will have less accessibility to public transportation. However, there is no indication that there is a greater level of services (such as more night-time and weekend public transportation services) in the high-density areas. This research is significant as it will point to and help to improve the areas with inadequate public transportation and other issues, taking into consideration their geographical locations and population density. Full article
(This article belongs to the Special Issue Urban Geospatial Analytics Based on Crowdsourced Data)
Show Figures

Figure 1

Previous Issue
Next Issue
Back to TopTop