Abstract
This study investigates the coupling and coordination mechanisms between virtual and physical spatial heat in coastal internet-famous streets under the influence of social media. Taking Dalian’s coastal internet-famous street as a case study, user interaction data (likes, favorites, shares, and comments) from the Xiaohongshu platform were integrated with multi-source spatio-temporal big data, including Baidu Heat Maps, to construct an “online–offline” heat coupling and coordination evaluation framework. The entropy-weight method was employed to quantify online heat, while nonlinear regression analysis and a coupling coordination degree model were applied to examine interaction mechanisms and spatio-temporal differentiation patterns. The results show that online heat demonstrates significant polarization with strong agglomeration in the Donggang area, while offline heat fluctuates periodically, rising during the day, stabilizing at night, and peaking on holidays at up to 3.5 times weekday levels with marginal diminishing effects. Forwarding behavior is confirmed as the core driver of online popularity, highlighting the central role of cross-circle communication. The coupling coordination model identifies states ranging from high-quality coordination during holidays to discoordination in daily under-conversion or overload scenarios. These findings verify the leading role of algorithmic recommendation in redistributing spatial power and demonstrate that the sustainability of coastal check-in destinations depends on balancing short-term traffic surges with long-term spatial quality, providing practical insights for governance and sustainable urban planning.
1. Introduction
Drawing on Lefebvre’s theory of the production of space, the essence of popular check-in sites can be understood as the media-driven reconstruction of the “trialectics of space.” Social media generates a “space of representation” through user-generated content (UGC) [], while algorithmic recommendation mechanisms regulate “spatial practices,” ultimately producing a hybrid “spatial reproduction” that interweaves the virtual and the real [,]. Online check-in popularity denotes the virtual attention generated by social media users through the digital sharing of spatial experiences in the form of texts, images, or videos. This represents the space of representation in Lefebvre’s spatial representation. Leveraging collaborative filtering algorithms, social media platforms reinforce the media visibility of specific geographic nodes via positive feedback mechanisms, thereby triggering network-driven viral phenomena. This type of popularity is characterized by three distinct attributes: (1) a traffic conversion function, whereby virtual attention is translated into tangible consumption behaviors; (2) a spatial restructuring function, which disrupts traditional spatial hierarchies and enhances the visibility of non-central areas; and (3) a temporal dynamism, reflected in patterns of rapid escalation followed by cyclical decline [,]. In contrast, offline check-in popularity refers to the embodied spatial attention generated by actual visits to internet-famous destinations, commonly quantified through POI visitation data, pedestrian density, or field surveys. Offline check-in spaces correspond to the spatial practice in Lefebvre’s spatial practices. Offline popularity is shaped by objective factors such as locational conditions, transportation accessibility, and infrastructural support, and is marked by spatial constraints: it is, on the one hand, limited by the physical capacity of the environment, which may lead to overcrowding and reduced experiential quality, and, on the other hand, exhibits a spatial configuration characterized by “core agglomeration-multi-point diffusion” []. Importantly, a dynamic coupling relationship exists between online and offline popularity, with their degree of alignment determining the sustainability of spatial attractiveness. Significant asymmetry between the two often induces a phenomenon of “popularity decay,” thereby constraining the long-term vitality of such spaces [].
There is a dynamic interaction mechanism between online popularity and offline spatial popularity. Social media platforms effectively stimulate users’ willingness to visit and check-in behavior through high-intensity content exposure, while offline popularity feeds back online content reproduction through actual experience, forming a closed-loop ecosystem of “online diversion-offline experience-online feedback” []. However, this virtual-real interaction process often suffers from coordination imbalances. On the one hand, excessive reliance on online marketing may lead to distortions of offline experiences, namely the “filter effect,” resulting in mismatches between publicity and embodied experiences, and ultimately producing the phenomenon of “check-in crash” []. On the other hand, the carrying capacity and management capabilities of offline spaces may fall short of accommodating surging online-driven visitor flows, causing resource imbalances and environmental pressures. The complex interplay and coordination mechanisms between virtual and real spaces have thus become central concerns in the study of influencer-driven urban destinations.
Most related studies only rely on a single data source and lack comprehensive analysis of multi-source data, so it is difficult to fully describe the dynamic relationship between virtual and real popularity. In terms of research content, most of the existing works remain at the level of descriptive analyses of spatial distribution characteristics and have not yet established a systematic coupling and coordination evaluation system, which restricts the scientific evaluation of the development quality of internet celebrity check-in places []. In terms of research subjects, there is an obvious structural imbalance. There is a lack of targeted research on specific types of check-in places such as coastal characteristic landscapes, and there is also a lack of systematic discussion on the coupling mechanism of online and offline communication heat based on coastal scenes [,,,,,]. As a representative coastal tourist city, Dalian leverages its distinctive natural and cultural landscapes to foster a cluster of coastal check-in spaces with strong regional characteristics [,,,,,,,,]. These nodes increasingly serve as critical carriers of social media traffic aggregation and as catalysts for activating consumption in physical space. For instance, Gu (2024) focused primarily on comparing the spatial distribution of check-in hot spots in Dalian with POI characteristics but paid limited attention to the interaction between online popularity and offline visitor flows [].
This study addresses this gap by taking Dalian’s coastal influencer destinations as a case study and integrating Xiaohongshu popularity data with Baidu heat map data to explore the coupling effects between virtual and physical spaces. The research makes two primary contributions: first, it empirically identifies the interaction mechanisms between online engagement and offline mobility through a dual-source validation approach; second, it sheds light on the influencer-driven transformation of coastal leisure spaces, with particular emphasis on the sustainability of popularity trends and their governance implications.
2. Research Area, Data and Methods
2.1. Research Area
This study selects the coastal zone landscape of Dalian as the research object (Figure 1), primarily based on its unique geographical location and landscape diversity advantages. As an important coastal city in Northeast China, Dalian is surrounded by the sea on three sides and has a coastline of 2211 km, forming a unique spatial pattern of “city and sea integration”. Meanwhile, Dalian, as one of the first batch of “excellent tourist cities” in China, has long carried multiple functions such as tourism and leisure and cultural exhibition in its coastal landscape, and has become a natural carrier for Internet celebrity content creation in the era of social media. This triple coupling characteristic of “natural endowment-cultural accumulation-media communication” makes the Dalian coastal zone an ideal spatial sample for studying the mechanism of online and offline heat conduction, which is holds broader significance for revealing the sustainable development law of coastal urban landscape [].
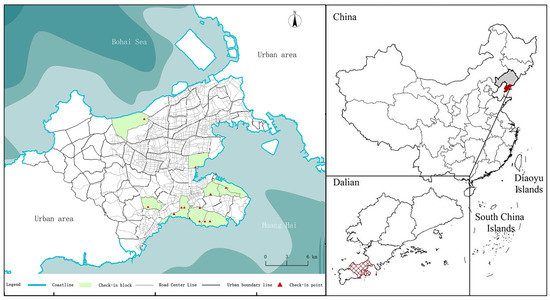
Figure 1.
Dalian Street Research Area.
2.2. Data Sources
As a leading “social + e-commerce” platform in China (with over 200 million monthly active users). The unique “grass planting” culture of the platform encourages users to actively share their authentic consumption experiences and forms a heat accumulation effect through interactive behaviors [,]. Data show that store exploration content accounts for more than 30% of the tourism, and covers cities at all levels across the country, making it an ideal data source for studying the online popularity of Internet celebrity landscapes. This study selects Xiaohongshu as the primary data source based on two main considerations. First, the majority of participants in online check-in behaviors are women, and Xiaohongshu’s user base is likewise predominantly female. This congruence in user characteristics helps ensure consistency between the research subjects and the platform’s audience. Second, tourism and shopping account for a large proportion of the platform’s content structure, which aligns closely with the research focus and thus provides rich and representative data support for the study.
This study focuses on the coastal Internet celebrity check-in places in Dalian city. By screening relevant content with keywords such as “Dalian Coastal Internet Celebrity Check-in”, “Dalian seaside check-in places” and “Dalian seaside photo taking”, the research ensures that the data is highly relevant to the research object. The research collected relevant posts on the Xiaohongshu platform through Python web crawler technology from 1 January 2024, to 31 December 2024, yielding an initial sample of 600 entries. After data cleaning, 197 valid records were retained. The 197 samples ultimately included in the analysis cover 18 major coastal popular check-in space in Dalian. Each containing geographical location, release time and four interaction indicators, forming a structured data set. The structured data set is illustrated Table 1.

Table 1.
Attributes of Some sample Data on Xiaohongshu.
The Baidu Heat Map is a visualization product generated based on the big data of Baidu Maps by aggregating the location data of anonymous users, it reflects the density distribution of people flow in urban spaces in real time []. Its data sources cover hundreds of millions of active users and, relying on the extensive market penetration of Baidu Map, it can accurately capture the dynamic of passenger flow in urban public space. This platform has high spatial and temporal resolution and is suitable for large-scale and multi-period monitoring of foot traffic, providing a reliable data foundation for the research on urban landscape popularity. As the data source of Baidu heat map comes from actual user positioning, its population coverage is wide, and it avoids the sampling deviation of traditional manual research. This study selected eight typical dates (including statutory holidays, weekends, and weekdays) from 2024 to 2025 for tracking Baidu heat map data [,]. To minimize potential interference from external factors, this study adopts the following principles in the selection of time periods: (1) include the Golden Week holiday while excluding the influence of major festivals and large-scale holiday events; (2) incorporate both weekdays and weekends to avoid biases caused by a single date attribute; (3) select May, August, October, and December to adequately account for the seasonal variations in residents’ waterfront activities; (4) exclude extreme weather conditions, limiting the study to clear days without strong winds or rainfall; and (5) mitigate the impact of traffic congestion by dividing observation periods into two-hour intervals. In light of the research objectives, we minimize the influence of contingent events by selecting representative periods and dates; however, the potential effects of external variables cannot be fully excluded.
Using Python web scraping technology, the data was segmented into 2 h intervals from 6:00 to 22:00 each day, with 9 such segments per day, resulting in a total of 72 heat maps. These heat maps serve as key data for this study. The timing of the selection is provided in Table 2 [,].
Table 2.
Basis for Selecting Baidu Heat Data.
2.3. Research Methods
This research is composed of three main steps: Firstly, an online popularity assessment model is constructed based on social media interaction data. Secondly, the nonlinear analysis method is applied to reveal the dynamic response relationship between online popularity and offline flow. Finally, the coupling coordination degree model is used to quantitatively measure the coordinated development level of virtual and real heat. The main research methods include: (1) Online heat model. (2) Nonlinear analysis method. (3) Coupling coordination degree model. These methods reveal the interaction mechanism between virtual social networks and real space activities.
2.3.1. Online Popularity Model
Based on the user interaction data (like, collection, forward and comment) of Xiaohongshu platform, the online popularity model is constructed by using entropy value method and composite index weighting method for quantitative analysis []. First, the original interaction data from each space check-in point is standardized. Then, the entropy method is used to objectively measure the dispersion of each dimension indicator. Finally, the weight coefficients for likes (0.1992), favorites (0.2382), shares (0.3019), and comments (0.2607) are determined. Based on this, a standardized online heat value calculation formula is established:
In the formula, Honline-Entropy weight method represents the online popularity score; L represents the number of likes; S represents the number of saves; R is the number of forwards; C represents the number of comments. Honline-Entropy weight method represents the online popularity index derived from the entropy weight method. The model effectively eliminates the dimensional difference in multi-source indicators through entropy value method, reduces the subjective deviation of traditional weighting methods, and realizes the objective quantitative evaluation of social media popularity. This scientific measurement method provides a reliable data basis for the subsequent online and offline thermal coupling analysis and also a new quantitative analysis paradigm for social media behavior research. In terms of spatial feature analysis, the dual indicators-area and quantity-are innovatively introduced to enhance the expression of spatial features. Its calculation formula is as follows:
In the formula, Honline-Area method represents the online popularity score; L represents the number of likes; S represents the number of collections; R is the number of forwards; C is the number of comments; Ah represents the regional thermal area; “At” represents the total area; Ns represents the number of regional check-in points. Nt represents the total number of check-in points. Honline-Area method represents the area-weighted online popularity index derived from the entropy weight method. Among them, the heat area data is from Baidu Heat Map, and the check-in point data is from Xiaohongshu geographical markers. This double weighting not only retains the information of the original interaction data, but also integrates the spatial distribution characteristics, which provides a richer analysis dimension for revealing the nonlinear relationship between online and offline popularity.
The entropy method is based on the information entropy theory to realize the objective quantification of multi-dimensional interactive behaviors, which is especially suitable for the coupling analysis between systems. The area weighting method is more conducive to capturing the nonlinear relationship between time and space through the enhancement of spatial features [].
2.3.2. Nonlinear Analysis Method
This study utilizes web crawling technology to obtain real-time crowd flow data from target areas, with spatial weighting based on administrative boundaries of streets to ensure each street unit has a corresponding heat value. Data classification employs the Natural Breakpoint Method in ArcGIS, dividing heat values into five levels to avoid distortion caused by manual division. The offline heat threshold is selected using the median as a benchmark, which not only reflects the normal distribution of urban crowd flows but also provides reference for offline event planning.
In modeling, we employ a quadratic polynomial functionto analyze online (Honline) and offline (Hoffline) heat models. Its calculation formula is as follows:
This model effectively captures marginal effects and nonlinear trends, offering both flexible interpretation and visualizable results that support dynamic correlation studies between online and offline popularity metrics.
2.3.3. Coupling Coordination Degree Model
The mechanism of coordinated development between online social popularity and offline physical flow is quantitatively analyzed. In this study, the most significant spatio-temporal stage in nonlinear analysis 31 December and 22:00 of 2024 were selected as typical research objects, and an in-depth analysis was carried out by establishing a three-level progressive evaluation system. In terms of model construction, the coupling degree C value was first calculated:
In the formula, C represent the coupling degree value; Honline represents the online popularity value. “Hoffline” represents the offline popularity value. This metric effectively captures the interaction intensity between the online and offline systems through the ratio relationship between the geometric mean and the arithmetic mean. The design coordination index T value is as follows:
In the formula, T is the coordinated index value; Honline represents the online popularity value. Hoffline represents the offline heat value. The comprehensive development level of the system is calculated by linear weighting method to ensure the scientificity and rationality of the evaluation results; finally, the coordination degree D value (0~1) is obtained:
In the formula, D is the value of coordination degree; C is the coupling degree value; T is This indicator value. The higher its value, the better level of coordination. This compliance index effectively reflects the quality level of the coordinated development of virtual and real Spaces. According to the D value results, the degree of coordination is divided into ten levels, and 0.9–1.0 is divided into high quality coordination, which represents the ideal state of highly integrated online and offline. A coordination level of 0.8–0.9 is considered good coordination, reflecting a relatively stable synergistic relationship between systems. A coordination level of 0.7–0.8 is categorized as intermediate coordination. A coordination level of 0.6–0.7 is classified as primary coordination. A coordination level of 0.5–0.6 is deemed as barely coordinated. Coordination levels below 0.5 are categorized as dysregulated, with a coordination level of 0.4–0.5 specifically defined as the “critical imbalance” warning zone [].
The popularization and application of this model will provide important theoretical support and methodological reference for promoting the coordinated development of the virtual and real Spaces in cities.
3. Result Analysis
3.1. Evaluation of the Popularity of Virtual and Real Space Check-Ins
3.1.1. Online Check-In Popularity Evaluation
Empirical analysis demonstrates that the online popularity of coastal internet-famous destinations in Dalian exhibits a pronounced polarization effect. Using the natural breaks method to classify the 18 study areas, it was found that 12 destinations fall into the high and medium-high categories, occupying an absolute advantage; only one destination belongs to the medium category, creating a distinct gap; while five destinations fall into the medium-low and low categories, with relatively weak popularity and limited user engagement (Figure 2). The distribution exhibits a “pyramid-shaped” hierarchy: a few highly popular sites dominate the top, capturing most traffic; the middle tier, mainly in the southeast, comprises moderately popular sites that channel part of the flow but lack sustained influence; the bottom tier, concentrated in the north, consists of numerous low-heat sites with scattered distribution, limited visibility, and weak diffusion. This pattern underscores the new media mechanism of urban “internet celebrity” spaces, where traffic concentrates in a few head locations, while mid- and lower-tier areas face restricted exposure and influence.
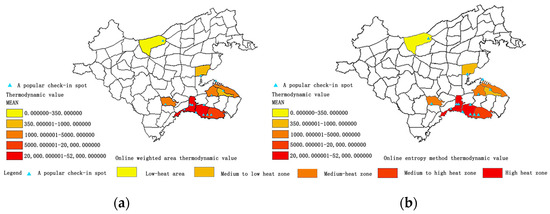
Figure 2.
The online check-in popularity classification of the coastal Internet celebrity street in Dalian City. (a,b) are the thermodynamic value of the Online weighted area and the thermodynamic value of the Online entropy method.
Taking the Donggang area as an example, standardized analysis of its heat data using the area-weighted method reveals a striking aggregation effect. With an absolute advantage of 3.32 million in total heat value, the unit-area heat density reaches 2.71 million per square kilometer-an order of magnitude higher than the average across all study areas, with a density ratio of 10.4:1. This result underscores Donggang’s central role in the spatial distribution of internet-famous destinations, not only confirming the highly concentrated pattern of online traffic but also demonstrating its outstanding spatial value and efficiency in traffic conversion. Through characteristic value analysis, the study provides important quantitative evidence to support urban spatial renewal and value enhancement. Meanwhile, Xinghai Square and Fuzhuang Village exhibit distinct spatial thermal characteristics across different scales. Xinghai Square boasts a total thermal capacity of approximately 1.98 million units, with a heat density of 1.45 million units per square kilometer, achieving a density ratio of 5.6:1. This advantage is particularly evident during festivals and major events, enabling intense instantaneous crowd concentration. Fuzhuang Village’s total thermal capacity stands at 1.24 million units, with a heat density of 0.98 million units per square kilometer, maintaining a density ratio of 3.8:1. These data reveal typical seasonal peaks, especially during summer tourism periods when thermal activity becomes particularly pronounced.
From a qualitative perspective, the three locations each demonstrate unique functional characteristics: Donggang excels in comprehensive and sustainable development, integrating commercial formats, landscape experiences, and consumption conversion capabilities; Xinghai Square emphasizes scale and iconic status, leveraging its openness and landmark attributes to create strong connections between online promotion and offline experiences; Fuzhuang Village highlights uniqueness and seasonality, relying on coastal natural resources to stand out during specific tourism periods. Together, these three areas form a multi-layered network of Dalian’s internet-famous destinations, providing both quantitative and qualitative analytical support for urban spatial renewal and value enhancement.
3.1.2. Evaluation of the Popularity of Offline Check-Ins
In terms of time (Figure 3), through the analysis of offline heat value daily frequency data, it is found that its distribution presents obvious regular characteristics. Data shows that the minimum threshold of heat value for non-holidays is generally stable at 20 and shows a stepped-increasing distribution, with the main intervals being 20–100, 100–150, 150–400 and 400–700. This hierarchical structure suggests that offline activity intensity operates within a relatively stable range of variation. This hierarchical structure indicates that the heat value of offline activities has a relatively fixed fluctuation range, reflecting the stability of the daily flow of people or the scale of activities.
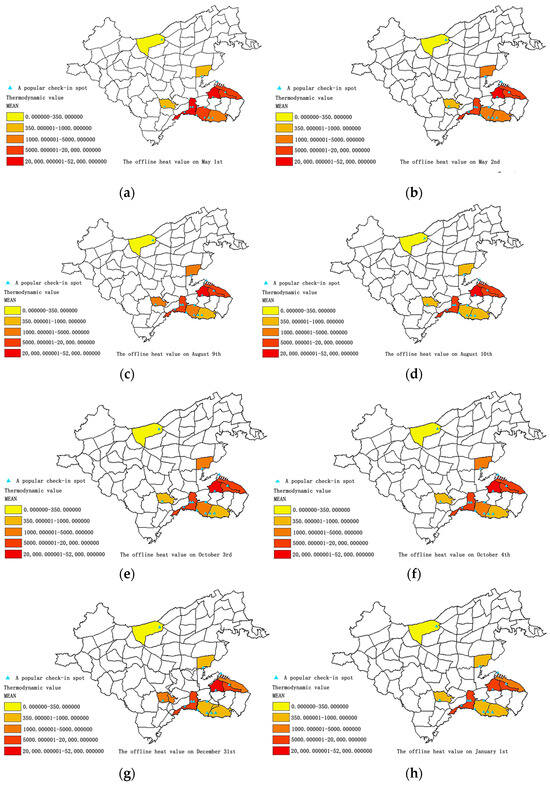
Figure 3.
Daily frequency check data of the hotspots in Dalian’s coastal Internet-famous streets by time and space. (a–h) are the offline heat value on 1st May, the offline heat value on 2nd May, the offline heat value on 9th August, the offline heat value on 10th August, the offline heat value on 3rd October, the offline heat value on 4th October, the offline heat value on 31st December, and the offline heat value on 1st January.
Especially, the thermodynamic value ranges in May, August and October are highly consistent, further confirming this rule. The data for 31 December and 1 January fluctuated greatly, reflecting the significant impact of holidays on offline heat values. On the whole, the distribution of thermal value has certain seasonal characteristics, and the data changes on special dates deserve attention. Comprehensive analysis shows that the offline heat value is significantly affected by the time factor. The daily data stability is high, but the holidays will cause obvious fluctuations, and the seasonal characteristics are also reflected, and the end of the year and the beginning of the year show a large difference.
In terms of time slots (Figure 4), through the systematic analysis of the offline heat value in each period, we find that the distribution of the heat value interval reveals pronounced temporal regularities. Specifically, the heat value in the early morning is mainly concentrated in the baseline range, reflecting the characteristics of the flow of people in the early stage of the place’s opening. The heat value during the daytime remained stably within the range of 20 to 100, indicating the passenger flow level under normal operating conditions. In the evening, the heat value jumped significantly, and some areas entered the range of 100–150, which may be related to the peak passenger flow during the off-work period However, the heat value during the night period dropped back to the basic level. The heat value at all times did not reach the high range of 400–700 which indicates that the overall operation of the place is in a reasonable load state and does not experience overcrowding. This regular fluctuation in calorific value clearly reflects the typical daily operation curve of “start-up-stable-peak-fallback” in commercial places. Based on an in-depth analysis of the heat value of each period, the changes in the heat value of the venue show obvious periodic characteristics, perfectly conforming to the daily laws of commercial operation: the basic level of heat value in the early morning start-up stage, the stable state in the daytime stable operation stage, the significant increase in the evening peak stage, and the natural decline in the night closing stage. This pattern of heat value variation not only verifies the scientific nature of the operation and management of the venue but also reveals the essential law of the change in passenger flow.
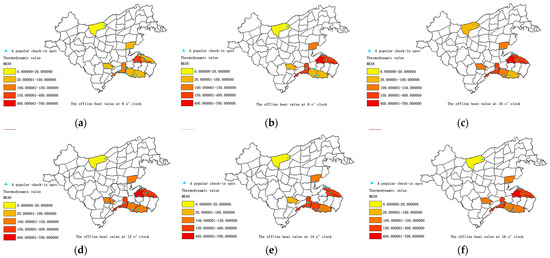
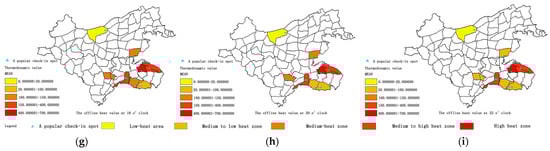
Figure 4.
The temporal and spatial dynamics of the popularity of Dalian’s coastal Internet-famous streets are measured at different time points. (a–i) are the offline heat value at 6 o’clock, the offline heat value at 8 o’clock, the offline heat value at 10 o’clock, the offline heat value at 12 o’clock, the offline heat value at 14 o’clock, the offline heat value at 16 o’clock, the offline heat value at 18 o’clock, the offline heat value at 20 o’clock, and the offline heat value at 22 o’clock.
3.1.3. Robustness Analysis
To ensure the robustness of the online popularity evaluation, this study conducted sensitivity checks at both the methodological and variable levels. In addition to the entropy weighting method, principal component analysis (PCA) was employed to reassign weights to the four indicators (likes, favorites, shares, and comments). Although the indicator weights varied slightly between the two methods, the overall popularity scores and site rankings remained highly consistent, with a Spearman rank correlation coefficient of 0.99 (p < 0.001). Further, sequential removal of individual indicators and recalculation of composite scores showed that core high-popularity sites consistently maintained their leading positions, with only minor fluctuations among medium- and low-popularity sites. These results confirm that the evaluation is not dependent on a single method or indicator and exhibits strong robustness (Figure 5).

Figure 5.
The ranking change chart of the entropy method after gradually eliminating variables and the bar chart comparing the weights of the entropy method vs. PCA index. (a,b) are the ranking changes of the entropy method after gradually eliminating variables and the entropy value method VS PCA Bar chart of indicator weight comparison.
Building on this validation, the study further explores how “internet-famous” streets shape spatiotemporal behaviors and governance practices. Social media platforms, through algorithmic recommendation and sharing mechanisms, transform specific streets into high-frequency check-in destinations, driving offline flows from virtual attention. Such agglomeration not only alters patterns of public space use but also reinforces consumption-oriented spatial logics, facilitating the reconfiguration of commercial and leisure functions. At the same time, this process generates new governance challenges: policymakers must balance surging flows with spatial carrying capacity and, through traffic management, spatial redistribution, and community participation, design adaptive and resilient governance strategies.
3.2. Nonlinear Relationship of Heat
The research finds that (Figure 6) the quadratic curve models of each daily frequency all exhibit similar structural characteristics, but the parameter values were significantly different. The intercept term b1 showed statistical significance in all models (p < 0.05, 95%CI excluding 0), and its estimated value ranged from 0.353 to 0.505, indicating that the underlying thermodynamic level has temporal stability. The coefficient b3 of the second term is generally negative and not significant except for 31 December, indicating that there is a potential inflection point in the growth of thermal value. The goodness of fit of the model indicated that the F-test for all dates reached a significant level (p value 0.009–0.049), but there were differences in explanatory power (R2 range 0.024–0.352). Among them, the models fit best on 1st January and 31st December, while the explanatory power is relatively weak on 2 May and 4 October. In particular, the model parameters on 31 December differed significantly from those on other dates. The b2 and b3 coefficients approached zero and were completely insignificant, reflecting the anomaly of the thermal value distribution pattern in the special scenario of New Year’s Eve. This study finds that the daily frequency distribution of the offline heat value follows a nonlinear law, and its dynamic characteristics contain both stability and obvious temporal heterogeneity. The basic heat level (b1) has time-temporal stability, verifying the basic load characteristics of the site operation. The increase in calorific value generally has a diminishing marginal effect (negative quadratic term), but this effect is not significant on regular dates and completely disappears only during special periods (such as New Year’s Eve). The time difference in model explanatory power revealed the differentiation of the impact mechanism of different dates. New Year’s Day and New Year’s Eve, which are highly popular dates, have stronger regularity, while ordinary dates in spring and autumn are more affected by random factors. Compared with the traditional linear model, the quadratic function better captures the “growth-saturation” dynamic process of the thermodynamic value.
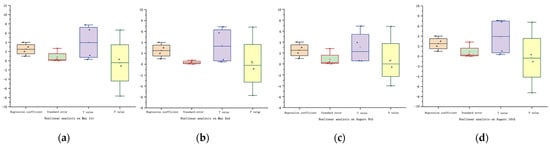
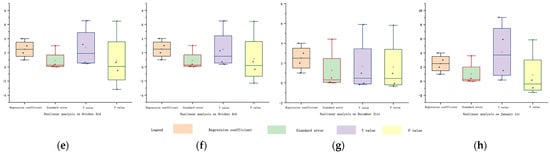
Figure 6.
Box diagram of offline daily frequency nonlinearity analysis of Dalian Binhai Internet celebrity Street. (a–h) are the nonlinear analysis on 1st May, the nonlinear analysis on 2nd May, the nonlinear analysis on 9th August, the nonlinear analysis on 10th August, the nonlinear analysis on 3rd October, the nonlinear analysis on 4th October, the nonlinear analysis on 31st December, and the nonlinear analysis on 1st January.
Based on the nonlinear regression analysis of the offline heat values across different time periods. The analysis is shown in Figure 7: the quadratic curve models of each time period show significant temporal differentiation characteristics. The values exhibit an upward trend from early morning to night, reflecting the law that the basic thermodynamic value level gradually accumulates with daytime activities. The coefficient b3 of the second term is negative, and the absolute value of the coefficient is the largest at 10 and 12, indicating that there is an obvious marginal diminishing effect of the thermal value growth in these two periods. The model’s goodness of fit shows that the F-test is significant in all time periods, but the explanatory power varies significantly. The model is the best at 10:00 a.m. and 12:00 p.m., while the explanatory power is relatively weak at 10:00 p.m. Furthermore, the b2 coefficient at 10 o’clock and 12 o’clock was as high as 11.612–12.497 (though not significant), combined with the steep quadratic curve shape, suggesting that there might be a rapid accumulation stage of thermodynamic values during these two periods. However, the model characteristics at 22:00 are significantly different. The b1 value is the highest, but the b2 and b3 coefficient is the smallest, reflecting that the thermal value at night tends to be in a stable state. The residual analysis showed that the residual fluctuation was larger at 20 o’clock and 22 o’clock, which may be related to the increased randomness of nighttime activities. The analysis of this period reveals the nonlinear law of the dynamic evolution of the offline calorific value and its temporal differentiation characteristics. The basic thermodynamic level has a distinct feature of “rising during the day and stabilizing at night”, continuously accumulating from morning to night, reaching a peak at 10 p.m. During the daytime period (10 o’clock and 12 o’clock), there is a significant phenomenon of accelerated accumulation and marginal decline of calorific value, which may be related to the concentrated activities during working and lunchtime periods. The temporal differences in the explanatory power of the model indicate that the regularity of daytime activities is stronger, while the randomness of nighttime activities increases.
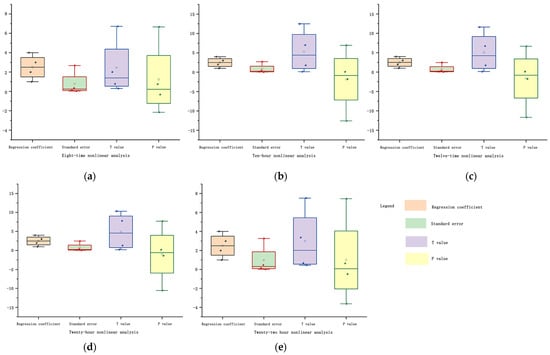
Figure 7.
Nonlinear analysis box chart of offline Time periods in the popular Binhai Street area of Dalian City. (a–e) are the eight-time nonlinear analysis, the ten-hour nonlinear analysis, the twelve-time nonlinear analysis, the twenty-hour nonlinear analysis and the (e) represents the twenty-two hour nonlinear analysis.
The research showed that the relationship between online and offline popularity was time-dependent, with a significant nonlinear correlation in some periods but no obvious correlation in others. Beyond the quantitative modeling results, the nonlinear characteristics of online popularity also reflect the influence of specific narrative elements. For instance, images of the “nightscape ambience” and “seaside check-ins” in areas such as Donggang have been widely disseminated on Xiaohongshu. Their visual appeal and narrative framing reinforce users’ expectations of the place, thereby generating traffic peaks during particular periods. This indicates that the marginal effects of online popularity are not solely determined by the physical capacity of space; rather, the modes of content presentation on social media constitute a critical factor driving the polarization of popularity.
3.3. Analysis of Heat Coupling Coordination Degree
In this study, the coupling coordination degree model is adopted to analyze the relationship between heat levels between the virtual and real Spaces, quantifying the degree of coordination between the two and its dynamic changes. The synergy relationship of online and offline popularity in the virtual and real Spaces was analyzed through the coupling coordination degree model and the most significant daily frequency (31 December) and time period (22:00) were selected for in-depth analysis (Figure 8). The average calorific value was employed for the online data, while the median calorific value was used for the offline data to ensure the representativeness and stability of the data. From the perspective of daily frequency, the coupling coordination degree is higher in some periods, reaching super coordination and good coordination, respectively, indicating that the synergistic effect of online and offline heat in these periods is significant. While in other periods, it is manifested as moderate disorder and mild disorder, analyzed from the perspective of periods. In other periods, moderate and mild dysfunctions were shown. From the perspective of time periods, the coupling coordination degree of the seventh period reached high quality coordination, indicating that the synergistic effect of online and offline heat in this period was very significant. The first and eighth periods showed severe and mild dysfunctions, indicating that the synergy of online and offline heat in these periods was poor. Through the analysis of the coupling coordination degree of the daily frequency (31 December) and the time period (22:00), the dynamic synergy characteristics of the online and offline heat in different time periods were revealed. High-quality coordinated periods indicate a high degree of synergy between online and offline heat, while unbalanced periods reflect the problem of insufficient synergy between online and offline heat. Overall, this analysis provides a scientific basis for optimizing the operation strategies of popular check-in spaces. It suggests increasing online promotion efforts during high-quality coordinated periods and exploring more effective online and offline interaction strategies during off-peak periods to enhance the overall synergy effect.
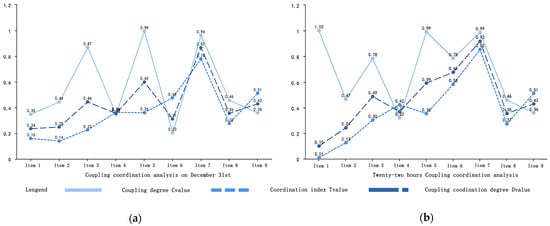
Figure 8.
Coupling and coordination analysis of significant daily frequencies and time periods. (a,b) are the coupling coordination analysis on December 31st and the Twenty-two hours coupling coordination analysis.
It is worth noting that this study, based on one year of data, captures the seasonal characteristics of influencer landscapes; however, such popularity trends may vary over longer temporal scales. Certain sites may sustain long-term attractiveness due to consistent spatial quality and enduring narrative symbols, whereas others may follow a short-term “boom-and-bust” cycle of rapid rise and decline.
By introducing the coupling coordination degree model, this study more accurately quantifies the degree of coordination between online and offline popularity more accurately. The coupling coordination degree model can not only evaluate the matching between online virtual heat and offline actual heat, but also reveal the synergistic effect or disconnection phenomenon between the two. This quantitative assessment addresses the shortcomings of previous studies in the analysis of the coordination of online and offline popularity. To validate the robustness of coupling coordination measurement results, this study conducted sensitivity analysis (Figure 9). The specific methodology involved recalculating coupling coordination by sequentially removing individual indicators to assess their impact on outcomes. Four scenarios were analyzed: first excluding comment counts, second excluding like counts, third excluding collection counts, and fourth excluding repost counts. Results demonstrated that the correlation between virtual popularity and real-world popularity remained consistently high across all scenarios. Pearson correlation coefficients ranged from 0.72 (excluding comments), 0.70 (excluding likes), 0.69 (excluding collections), and 0.71 (excluding reposts), while Spearman correlations fluctuated between 0.48 and 0.52. Overall, the correlation variations showed minimal fluctuations with consistent trends, indicating the model effectively captures dynamic interactions between virtual and physical spaces. Both goodness-of-fit and robustness metrics achieved ideal levels, demonstrating the model’s reliability [].
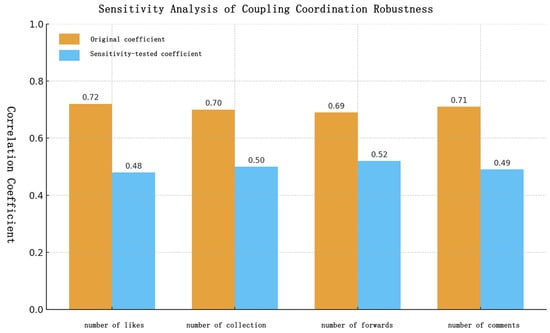
Figure 9.
Sensitivity analysis of coupling coordination robustness.
4. Discussion
Despite the methodological and data innovations of this study, several limitations remain. First, Xiaohongshu users exhibit a pronounced bias in gender and age structure, with the platform’s core demographic being young women. This bias may, to some extent, amplify the consumerist and visualized interpretation of certain spaces, thereby influencing the overall understanding of “urban popularity” [,]. Differences across gender, age, and socioeconomic groups in how they experience and engage with leisure spaces are not fully captured in this study. Second, the data sources are relatively limited, relying solely on Xiaohongshu content and Baidu heat maps, without incorporating other mainstream social media platforms such as Douyin and Weibo, which may reduce the generalizability of the findings. These platforms differ in their communication logics: Douyin, dominated by short videos, tends to trigger explosive bursts of traffic, while Weibo, with its topical and agenda-setting attributes, is closely tied to social events. Such differences may lead to distinct mechanisms of heat evolution and spatial diffusion [,]. Third, in terms of the temporal dimension, although holiday effects were considered, the study period covers only one year and lacks weekday samples, making it difficult to capture long-term trends and cyclical patterns. Finally, the model does not sufficiently account for external environmental variables, such as weather conditions, major events, or commercial promotions, which limits its explanatory power during certain periods. Future research could integrate multi-platform data, extend the temporal scale, and employ machine learning and spatial econometric models, supplemented with user interviews, to enhance the robustness and explanatory capacity of the findings [,,,].
This study takes Dalian, a typical coastal tourist city, as a case and proposes a three-dimensional analytical framework based on “data–time–space” [,]. Compared with existing research, this framework achieves methodological advances in two key respects: first, it replaces simple equal-weighting with the entropy method, thereby providing a more precise quantification of users’ multi-level behaviors from shallow interactions to deep dissemination; second, by integrating online area-weighted heat values with offline median heat values, and supplementing them with temporal segmentation and a coupling coordination model, the framework not only reveals the surface distribution of internet-famous spaces but also evaluates the coordination between online and offline popularity. However, the applicability of this theory in non-tourist cities or inland regions still requires further validation. Significant differences exist among cities in social media usage habits, landscape characteristics, socio-cultural backgrounds, and governance systems, which may affect the comparability and universality of research conclusions across regions. Future studies could conduct cross-regional empirical tests of this theoretical framework within broader geographical and social contexts, optimizing model parameters and variable systems by incorporating local characteristics. Additionally, integrating multi-source data and multi-scale analytical methods can enhance the framework’s explanatory power and application robustness across different spatial types, thereby promoting the deepening and wider adoption of this theory in urban research [,].
Technological advancement has reshaped the communication logic of urban spaces. The “check-in economy” spawned by social media has not only transformed residents’ leisure patterns but also driven spatial reproduction [,]. This study reveals a coupling pattern between virtual and real-world spatial popularity, demonstrating that the “internet-famous” status of urban spaces no longer relies solely on traditional planning or official promotion, but is jointly driven by user-generated content and algorithmic recommendations. This phenomenon presents new challenges for urban governance: On one hand, it requires scientific management of short-term traffic to prevent overcrowding in specific areas; on the other hand, long-term efforts must focus on enhancing cultural depth and quality of urban spaces, ensuring they retain both the vibrancy of being “viewed” and the warmth of being “lived in” [,,,,]. Future research will not only provide new methodological perspectives for understanding urban spatial internet-famous trends but also offer practical insights into the sustainable governance of urban leisure spaces.
5. Conclusions
The study reveals that social media-driven check-in spaces exhibit pronounced heat polarization and abnormal spatio-temporal distribution patterns. The key findings are as follows:
- (1)
- Online check-in popularity demonstrates a pronounced spatial clustering effect. This phenomenon reveals the concentration of traffic in a few “hit” locations, with its formation mechanism closely related to visual appeal of content, user interaction behaviors, and platform algorithm recommendations. Through an entropy-based weighting model validation, this study confirms that sharing behavior contributes most significantly to online popularity, highlighting the critical role of cross-circle dissemination.
- (2)
- Nonlinear regression analysis shows that offline heat growth generally exhibits diminishing marginal returns. However, this effect disappears during high-traffic periods, suggesting that the physical carrying capacity of space may reach a saturation threshold.
- (3)
- Results from the coupling coordination model reveal that online–offline interactions follow a dynamic evolutionary pattern. High-quality coordination tends to occur during peak periods such as holidays, reflecting efficient alignment between online traffic and offline capacity. In contrast, maladjusted states are mainly observed in regular periods, arising from insufficient online-to-offline conversion or offline overload, thus generating evident spatio-temporal differentiation.
- (4)
- In governance, it is essential to balance short-term traffic management with long-term spatial quality enhancement. While flexible traffic diversion and resource allocation can address temporary “traffic surges” in the short term, sustainable solutions require improving scenic environments, cultural narratives, and public services to strengthen attractions’ enduring appeal, thereby reducing overdependence on fleeting online popularity. Based on a coupled coordination hierarchy framework, this study proposes differentiated governance strategies:
① For high-quality coordination zones (D > 0.9, e.g., Donggang at 22:00), introduce AR-based virtual tour systems to extend the window of online-to-offline conversion;
② For maladjusted zones (D < 0.5, e.g., Yanwo Ridge on weekdays), improve accessibility through optimized transit connections to feed back into online visibility;
③ Establish a “heat early-warning system” that triggers crowd control measures once offline density exceeds 4 persons/m2, while simultaneously pushing notifications of alternative nearby check-in sites to Xiaohongshu or Douyin users.
It should be noted that some of these technological measures are forward-looking yet constrained in their practical feasibility. During peak tourism seasons like May and October, management departments should promptly implement visitor diversion and traffic control measures based on real-time monitoring of coupling coordination levels. This includes optimizing ferry routes, implementing time-slot reservation systems, and managing temporary road access to alleviate overcrowding at major attractions. During August’s summer peak, priority should be given to heatwave alerts and environmental capacity monitoring, establishing emergency evacuation protocols for tourists facing high-temperature travel risks. In December and January, AR virtual tour guidance and online promotional campaigns should be utilized to redirect visitors to mid-to-low heat spots, facilitating spatial flow redistribution. It is crucial to emphasize that these digital and innovative measures must be supported by traditional governance tools such as traffic management, crowd dispersal strategies, environmental capacity monitoring, and community engagement. Only through this integration of online popularity metrics with offline capacity management can we achieve coordinated urban leisure space development and promote sustainable growth of urban recreational areas.
Author Contributions
Conceptualization, Yilu Gong and Jun Yang; methodology, Yilu Gong; validation, Sijia Han, Yilu Gong and Jun Yang; formal analysis, Sijia Han; investigation, Sijia Han; writing—original draft preparation, Sijia Han; writing—review and editing, Sijia Han; supervision, Yilu Gong; project administration, Yilu Gong. All authors have read and agreed to the published version of the manuscript.
Funding
This research study was supported by Liaoning Provincial Department of Education Scientific Research Project (JYTQN2023122), Dalian Social Science Federation Project (2025dlskzd436), Dalian Polytechnic University Young Talents Science and Technology Research Pioneer Program Project (XDJH2404), Social Science Federation Project of Dalian Polytechnic University (GDSKLZD202504).
Institutional Review Board Statement
Not applicable.
Data Availability Statement
No new data were created or analyzed in this study. Data sharing is not applicable to this article.
Acknowledgments
The authors gratefully acknowledge the financial support of Dalian Polytechnic University School. We would also like to thank the editors and anonymous reviewers for their helpful and productive comments on the manuscript.
Conflicts of Interest
The author declares no conflicts of interest.
References
- Ramos, E.C.; Ramos, C.M.Q. User-Generated Content and Its Impact on Purchase Intent for Tourism Products: A Comparative Analysis of Millennials and Centennials on TikTok. Future Internet 2025, 17, 105. [Google Scholar] [CrossRef]
- Harkin, B.; Yates, A.; Riach, M.; Clowes, A.; Cole, S. “I Want to See People’s Reactions to the Selfies”: A Lefebvrian Analysis of the Impact of Social Networking Sites on Physical, Mental, and Emotional Functioning. Soc. Sci. Comput. Rev. 2021, 40, 788–808. [Google Scholar] [CrossRef]
- Li, M.Z.; Fan, Z.X. Research on the Coupling Relationship between Street Spatial Quality and Vitality Based on Multi-Source Data Methodology: A Case of Tianhe District, GuangZhou. Contemp. Archit. 2024, 11, 98–104. [Google Scholar]
- Xing, C.X.; Gao, F.R.; Zhan, S.N.; Zhou, L. A Collaborative Filtering Recommendation Algorithm Incorporated with User Interest Change. Comput. Res. Dev. 2007, 44, 296–301. [Google Scholar] [CrossRef]
- Wang, Y.; Zhang, J.; Xu, H.L. Combining User Interests with Improved Collaborative Filtering Re-commendation Algorithm. J. Small Micro Comput. Syst. 2020, 41, 1665–1669. [Google Scholar]
- Uyheng, J.; Moffitt, J.D.; Carley, K.M. The language and targets of online trolling: A psycholinguistic approach for social cybersecurity. Inf. Process. Manag. 2022, 59, 103012. [Google Scholar] [CrossRef]
- Ren, B.L.; Li, Z.J.; Zhang, R.Y.; Xu, F.P. Research on the Vitality and Influencing Factors of Subway Stations in Qingdao’s Historical Urban Area: A Case of Zhongshan Road Subway Station Area. Urban Archit. 2024, 21, 85–88+93. [Google Scholar] [CrossRef]
- Yang, X.Z.; Su, Y.Q.; Zhou, L.; Yang, L.; Chen, X. Characteristics and mechanism of urban cultural space tourismification basedon field theory: A case study of Hechai 1972 Industrial Memory Town. Tour. Trib. 2024, 39, 54–70. [Google Scholar] [CrossRef]
- Daniel, A.G. Virtual reality: Applications and implications for tourism. Tour. Manag. 2010, 31, 637–651. [Google Scholar] [CrossRef]
- Gu, J.Y.; Yang, D.F. New Features of Urban Leisure Space Distribution under the Influence of Social Media: A Comparison between Xiaohongshu Check-ins and POI. J. Geo Inf. Sci. 2024, 26, 332–351. [Google Scholar] [CrossRef]
- Robert, N.A.; Adrian, B.; Kwadwo, A.N.; Elmond, B. Highlighting smart city mirages in public perceptions: A Twitter sentiment analysis of four African smart city projects. Cities 2022, 130, 103857. [Google Scholar] [CrossRef]
- Zhou, K.; Zhang, H.T.; Xia, Y.N.; Liu, C. New Urban Consumption Space Shaped by Social Media: A Case Study of the Geo-Tagging Places of Changsha on Xiaohongshu. Mod. Urban Res. 2021, 2021, 20–27. [Google Scholar] [CrossRef]
- Zeng, W.Q. The Virtual and Physical Space Characteristics and Evolution of Changsha Xiaohongshu Wanghong Clock-in Place. Archit. Cult. 2024; 130–133. [Google Scholar] [CrossRef]
- You, X.H.; Xu, M.Y.; Huang, W.X. Research on University Tourism Open Space Based on Multi-Source Data: Taking the Space Optimization Design of “Tsinghua Campus Tour” as an Example. Contemp. Archit. 2022, 12, 40–45. [Google Scholar]
- Zheng, X.; Ulrike, G. Role of social media in online travel information search. Tour. Manag. 2010, 31, 179–188. [Google Scholar] [CrossRef]
- Tang, H.; Li, W.; Yan, X. Spatiotemporal Evolution Characteristics and Influencing Factors of Cross-Regional Tourism Corridors: A Tourism Geography Perspective. Sustainability 2025, 17, 1126. [Google Scholar] [CrossRef]
- Zhou, Y.F.; Yang, J.W.; Zhou, J.P.; Zhou, P.; Liu, H. Evaluating Vitality of Metro Station Service Area with Heat Map: A Case Study on Shenzhen Subway. Acta Sci. Nat. Univ. Pekin. 2020, 56, 875–883. [Google Scholar] [CrossRef]
- Jin, X.M.; Luan, W.X.; Yang, J.; Tian, C. Balanced and imbalanced: Global population spatial mobility and economic patterns in coastal and interior areas. Humanit. Soc. Sci. Commun. 2024, 11, 1223. [Google Scholar] [CrossRef]
- Dong, S.N.; Chen, X.; Mao, Z.Y.; Zhu, L. Analysis on the Spatial Layout and Related Factors of “Internet Celebrity Check-in Places” Based on Social Media Data—Taking the Main Urban Area of Beijing as an Example. Jiangxi Sci. 2023, 41, 800–807. [Google Scholar] [CrossRef]
- Duan, G.X.; Liu, W.K.; Xing, H.F. Nonlinear relationship between multidimensional street vitality and built environment based on multi-source geographic data: A case study of Futian District, Shenzhen City. Geogr. Sci. 2025, 45, 975–987. [Google Scholar] [CrossRef]
- Niu, C.; Liu, P.C.; Guo, M. Dynamic Dynamic Characteristics of Urban Street Space from the Perspective of Multi-Source Data:Taking Zhongshan Road of Nanjing as an Example. Archit. Cult. 2024, 12, 117–119. [Google Scholar] [CrossRef]
- Zhang, J.; Yu, Q.Q.; Fu, D.S.; Zhang, C.; Guo, T.; Xing, Y.; Shao, F. Research on Space Vitality in West Lake Waterfront of Hangzhou Basedon Multi-source Data. Zhejiang For. Sci. Technol. 2023, 43, 82–89. [Google Scholar] [CrossRef]
- Qin, Z.B.; Long, L.C.; Feng, D.; Cao, S. Quantitative evaluation and promotion strategy of street vitality in tourist cities based on multi-source data: A case study of Guilin historic urban area. J. Guilin Univ. Technol. 2022, 42, 820–829. [Google Scholar] [CrossRef]
- Wang, J.Q.; Yang, Y.; Li, J.L.; Zhu, L. Analysis on the Spatio-Temporal Distribution Characteristics of Street Vitality Based on Large-Scale Linear Sports Activities: A Case Study of Fuzhou International Marathon Track. J. Nanjing Norm. Univ. 2022, 45, 26–33. [Google Scholar] [CrossRef]
- Xiang, J.Y.; Luo, Z.D.; Zhang, J.Y.; Cheng, L. Research on the Distribution Characteristics of “Net Celebrity Space” in the Mobile Internet Era: A Case Study in Main Area of Hangzhou, China. Mod. Urban Res. 2021, 36, 11–19. [Google Scholar] [CrossRef]
- Wang, Z.D.; Zhang, S.L.; Yang, L. Research on Spatial Perception of Internet-famous Spot in Chongqing Based on Web Text Analysis. West. J. Hum. Settl. 2022, 37, 126–131. [Google Scholar] [CrossRef]
- Liang, L.; Fu, H.Y.; Li, J.Q.; Li, B. Spatio-temporal Dynamic Evolution and Influencing Factors of Net Celebrity City Network Attention: A case of Xi’an. Sci. Geogr. Sin. 2022, 42, 1566–1576. [Google Scholar] [CrossRef]
- Duan, Y.Z.; Gao, Y.C.; Wang, X.T. The Spatial Pattern Characteristics of Internet Popular Check-In Spots Based on Social Media Data: A Case of Qingdao. Urban Archit. 2025, 22, 113–117. [Google Scholar] [CrossRef]
- Pan, M.L.; Li, X.M. Study on Vitality and Influencing Factors of Traditional Village Public Space Based on Multi-Source Data: Taking Cuandixia Village as an Example. Chin. Famous Cities 2024, 38, 82–89. [Google Scholar] [CrossRef]
- Carsten, F.; Dormann, J.E.; Sven, B.; Buchmann, C.; Carl, G.; Carré, G.; Marquéz, J.R.G.; Gruber, B.; Lafourcade, B.; Leitão, P.J.; et al. Collinearity: A review of methods to deal with it and a simulation study evaluating their performance. Ecography 2012, 36, 27–46. [Google Scholar] [CrossRef]
- Ren, Z.; Li, Z.; Wu, F.; Ma, H.; Xu, Z.; Jiang, W.; Wang, S.; Yang, J. Spatiotemporal Evolution of the Urban Thermal Environment Effect and Its Influencing Factors: A Case Study of Beijing, China. ISPRS Int. J. Geo-Inf. 2022, 11, 278. [Google Scholar] [CrossRef]
- Yuan, J.; Zheng, Y.; Xie, X. Discovering regions of different functions in a city using human mobility and POIs. In Proceedings of the 18th ACM SIGKDD International Conference on Knowledge Discovery and Data Mining, Beijing China, 12–16 August 2012; pp. 186–194. [Google Scholar] [CrossRef]
- Jiang, H.Y.; Song, T.H.; Li, S.J.; Deng, Z.P. Spatial Pattern Characteristics of Urban Virtual-Real Vitality in the Digitization Context: A Case Study of Guangzhou. Trop. Geogr. 2023, 43, 695–706. [Google Scholar] [CrossRef]
- Liu, J.Y.; Huang, Z.S.; Wu, X.H.; Hou, Q. Optimization of urban village public space vitality based on complex network. Sci. Rep. 2025, 15, 15392. [Google Scholar] [CrossRef] [PubMed]
- Yu, W.; Yang, J.; Wu, F.; He, B.; Xue, B.; Wang, S.; Yu, H.; Xiao, X.; Xia, J. Realistic characteristics and driving mechanisms of pseudo-human settlements in Chinese cities. Humanit. Soc. Sci. Commun. 2023, 10, 50. [Google Scholar] [CrossRef]
- Zhang, L.; Zhu, W.Y. A Study on Spatial Images in Tik-Tok Short Videos: Three Internet-Famous Sites in Chongqing City. Urban Des. 2020, 1, 36–45. [Google Scholar] [CrossRef]
- Li, D.; Fang, R.; Chen, J.Y.; Zhang, Y.; Wang, C.; Zhu, M. Research on the Characteristics, Influencing Factors, and Enhancement Strategies of Tourism Attraction Vitality Based on Multi-Source Data: A Case Study of Hefei City. J. Anhui Agric. Univ. 2024, 51, 987–995. [Google Scholar] [CrossRef]
- Yang, J.; Yang, R.; Sun, J.; Huang, T.; Ge, Q. The Spatial Differentiation of the Suitability of Ice-Snow Tourist Destinations Based on a Comprehensive Evaluation Model in China. Sustainability 2017, 9, 774. [Google Scholar] [CrossRef]
- Zeng, B.X.; Gerritsen, R. What do we know about social media in tourism? Tour. Manag. Perspect. 2014, 10, 27–36. [Google Scholar] [CrossRef]
- Zhang, C.M.; Ge, Y.T.; Xi, J.C. The comprehensive evaluation research of suitability of cultural tourism base in China. Resour. Sci. 2016, 38, 2221–2232. [Google Scholar] [CrossRef]
- Gössling, S.; Scott, D.; Hall, C.M. Pandemics, tourism and global change: A rapid assessment of COVID-19. J. Sustain. Tour. 2020, 29, 1–20. [Google Scholar] [CrossRef]
Disclaimer/Publisher’s Note: The statements, opinions and data contained in all publications are solely those of the individual author(s) and contributor(s) and not of MDPI and/or the editor(s). MDPI and/or the editor(s) disclaim responsibility for any injury to people or property resulting from any ideas, methods, instructions or products referred to in the content. |
© 2025 by the authors. Published by MDPI on behalf of the International Society for Photogrammetry and Remote Sensing. Licensee MDPI, Basel, Switzerland. This article is an open access article distributed under the terms and conditions of the Creative Commons Attribution (CC BY) license (https://creativecommons.org/licenses/by/4.0/).