Article

Multi-Omics Analyses Reveal Systemic Insights into Maize Vivipary

1
Institute of Crop Sciences, Chinese Academy of Agricultural Sciences, Beijing 100081, China
2
State Key Laboratory of Crop Stress Adaptation and Improvement, Henan Joint International Laboratory for Crop Multi-Omics Research, School of Life Sciences, Henan University, Kaifeng 475000, China
3
Department of Plant Pathology, Kansas State University, Manhattan, KS 66506, USA
4
Collaborative Innovation Center of Henan Grain Crops, Key Laboratory of Wheat and Maize Crops Science, College of Agronomy, Henan Agricultural University, Zhengzhou 450002, China
*
Authors to whom correspondence should be addressed.
These authors contributed equally to this work.
Plants 2021, 10(11), 2437; https://doi.org/10.3390/plants10112437
Submission received: 24 September 2021 / Revised: 28 October 2021 / Accepted: 4 November 2021 / Published: 12 November 2021
(This article belongs to the Section Plant Molecular Biology)

Abstract

:
Maize vivipary, precocious seed germination on the ear, affects yield and seed quality. The application of multi-omics approaches, such as transcriptomics or metabolomics, to classic vivipary mutants can potentially reveal the underlying mechanism. Seven maize vivipary mutants were selected for transcriptomic and metabolomic analyses. A suite of transporters and transcription factors were found to be upregulated in all mutants, indicating that their functions are required during seed germination. Moreover, vivipary mutants exhibited a uniform expression pattern of genes related to abscisic acid (ABA) biosynthesis, gibberellin (GA) biosynthesis, and ABA core signaling. NCED4 (Zm00001d007876), which is involved in ABA biosynthesis, was markedly downregulated and GA3ox (Zm00001d039634) was upregulated in all vivipary mutants, indicating antagonism between these two phytohormones. The ABA core signaling components (PYL-ABI1-SnRK2-ABI3) were affected in most of the mutants, but the expression of these genes was not significantly different between the vp8 mutant and wild-type seeds. Metabolomics analysis integrated with co-expression network analysis identified unique metabolites, their corresponding pathways, and the gene networks affected by each individual mutation. Collectively, our multi-omics analyses characterized the transcriptional and metabolic landscape during vivipary, providing a valuable resource for improving seed quality.

1. Introduction

Sophisticated strategies have evolved for seed plants to ensure successful germination. However, precocious seed germination in agriculture, termed preharvest sprouting (PHS) or vivipary, is caused by abscisic acid (ABA) deficiency during the maturation phase and constitutes a severe threat to crop yields. To date, a limited number of vivipary mutants have been reported, such as phs1, phs2, phs3, phs4, and phs8 in rice [1,2]; not, flc and sit in tomato [3,4,5]; and vp1/vp4, vp5, vp7, vp9, vp10/vp13, vp14, vp15, and y9 in maize [6,7,8,9,10,11,12,13,14], and the feature that these mutants have in common is their decreased ABA content. Genes with different biochemical functions have been identified as being responsible for the vivipary phenomenon. Most of them are involved in hormone signaling, including ABA and gibberellin (GA) signaling [15,16]. ABA and GA antagonistically regulate the seed germination process, with ABA being required for dormancy, whereas GA promotes seed germination [17,18]. The key components of the ABA biosynthesis pathway include phytoene synthase (PSY), phytoene desaturase (PDS), ζ-carotene desaturase (ZDS), zeaxanthin epoxidase (ZEP), 9-cis-epoxycarotenoid dioxygenase (NCED), and abscisic aldehyde oxidase (AAO) [15,18]. The GA biosynthesis rate is mainly determined by reactions catalyzed by GA 20-oxidase (GA20ox) and GA 3-oxidase (GA3ox), whereas GA is inactivated by GA 2-oxidase (GA2ox) [16].
Approximately, 15 viviparous maize mutants have been identified. They have been classified into two groups according to phenotypes: mutants with the color of the endosperm, including vp1/vp4, vp6, vp8, vp10/vp13, vp14, and vp15; and mutants with altered levels of carotenoids and chlorophyll resulting in the albino phenotype, including vp2, vp5, vp7/ps1, vp9, vp12/lw2, y9, w3, and rea1 [6]. Maize viviparous mutants have been demonstrated to have defects in ABA biosynthesis or ABA sensing, and multiple maize vivipary-related genes have been cloned. Both the vp1 and vp4 genes encode a plant-specific transcription factor involved in ABA signaling that can complement the Arabidopsis abi3 mutant allele [19,20]. The vp5, vp7, and vp9 genes encode enzymes in the carotenoid biosynthetic pathway, and the mutants showed an albino phenotype with reduced ABA levels [8,9,10]. VP14 is homologous to Arabidopsis NCED9, catalyzing the first committed step in ABA biosynthesis and cleavage of 9-cis-epoxy-carotenoids to form C25 apo-aldehydes and xanthoxin, the precursor of ABA biosynthesis in higher plants [12,21]. The final step of ABA biosynthesis is catalyzed by AAO, with molybdenum as a cofactor (MoCo) [22]. Nitrate reductase xanthine dehydrogenase CNX1, CNX2, CNX3, CNX5, CNX6, and CNX7 have been shown to be involved in MoCo biosynthesis in plants [22,23]. In maize, the vp10 gene encodes ZmCNX1 and the vp15 gene encodes ZmCNX7. Accordingly, vp15 and vp10 mutants are characterized by reduced activity of AAO [11,13]. Apart from the cloned vivipary loci described above, vp2 has not been cloned; vp2 mutant accumulates phytoene, the catalyzed product of PDS enzyme, which can regulate the expression of 4-hydroxyphenylpyruvate dioxygenase (HPPD1) [24].
Although multiple genes related to maize vivipary have been identified, the global transcriptional and metabolome impacts from the mutation of viviparous genes have not been systematically investigated. In this study, transcriptomic and metabolomic analyses were performed, using the embryos of seven viviparous mutants, and these revealed a comprehensive molecular network of maize vivipary and potential novel regulators, including transporters, transcription factors, and metabolites during the development of the vivipary phenotype. The present study provides valuable data for breeding maize lines with suppressed vivipary.

2. Results

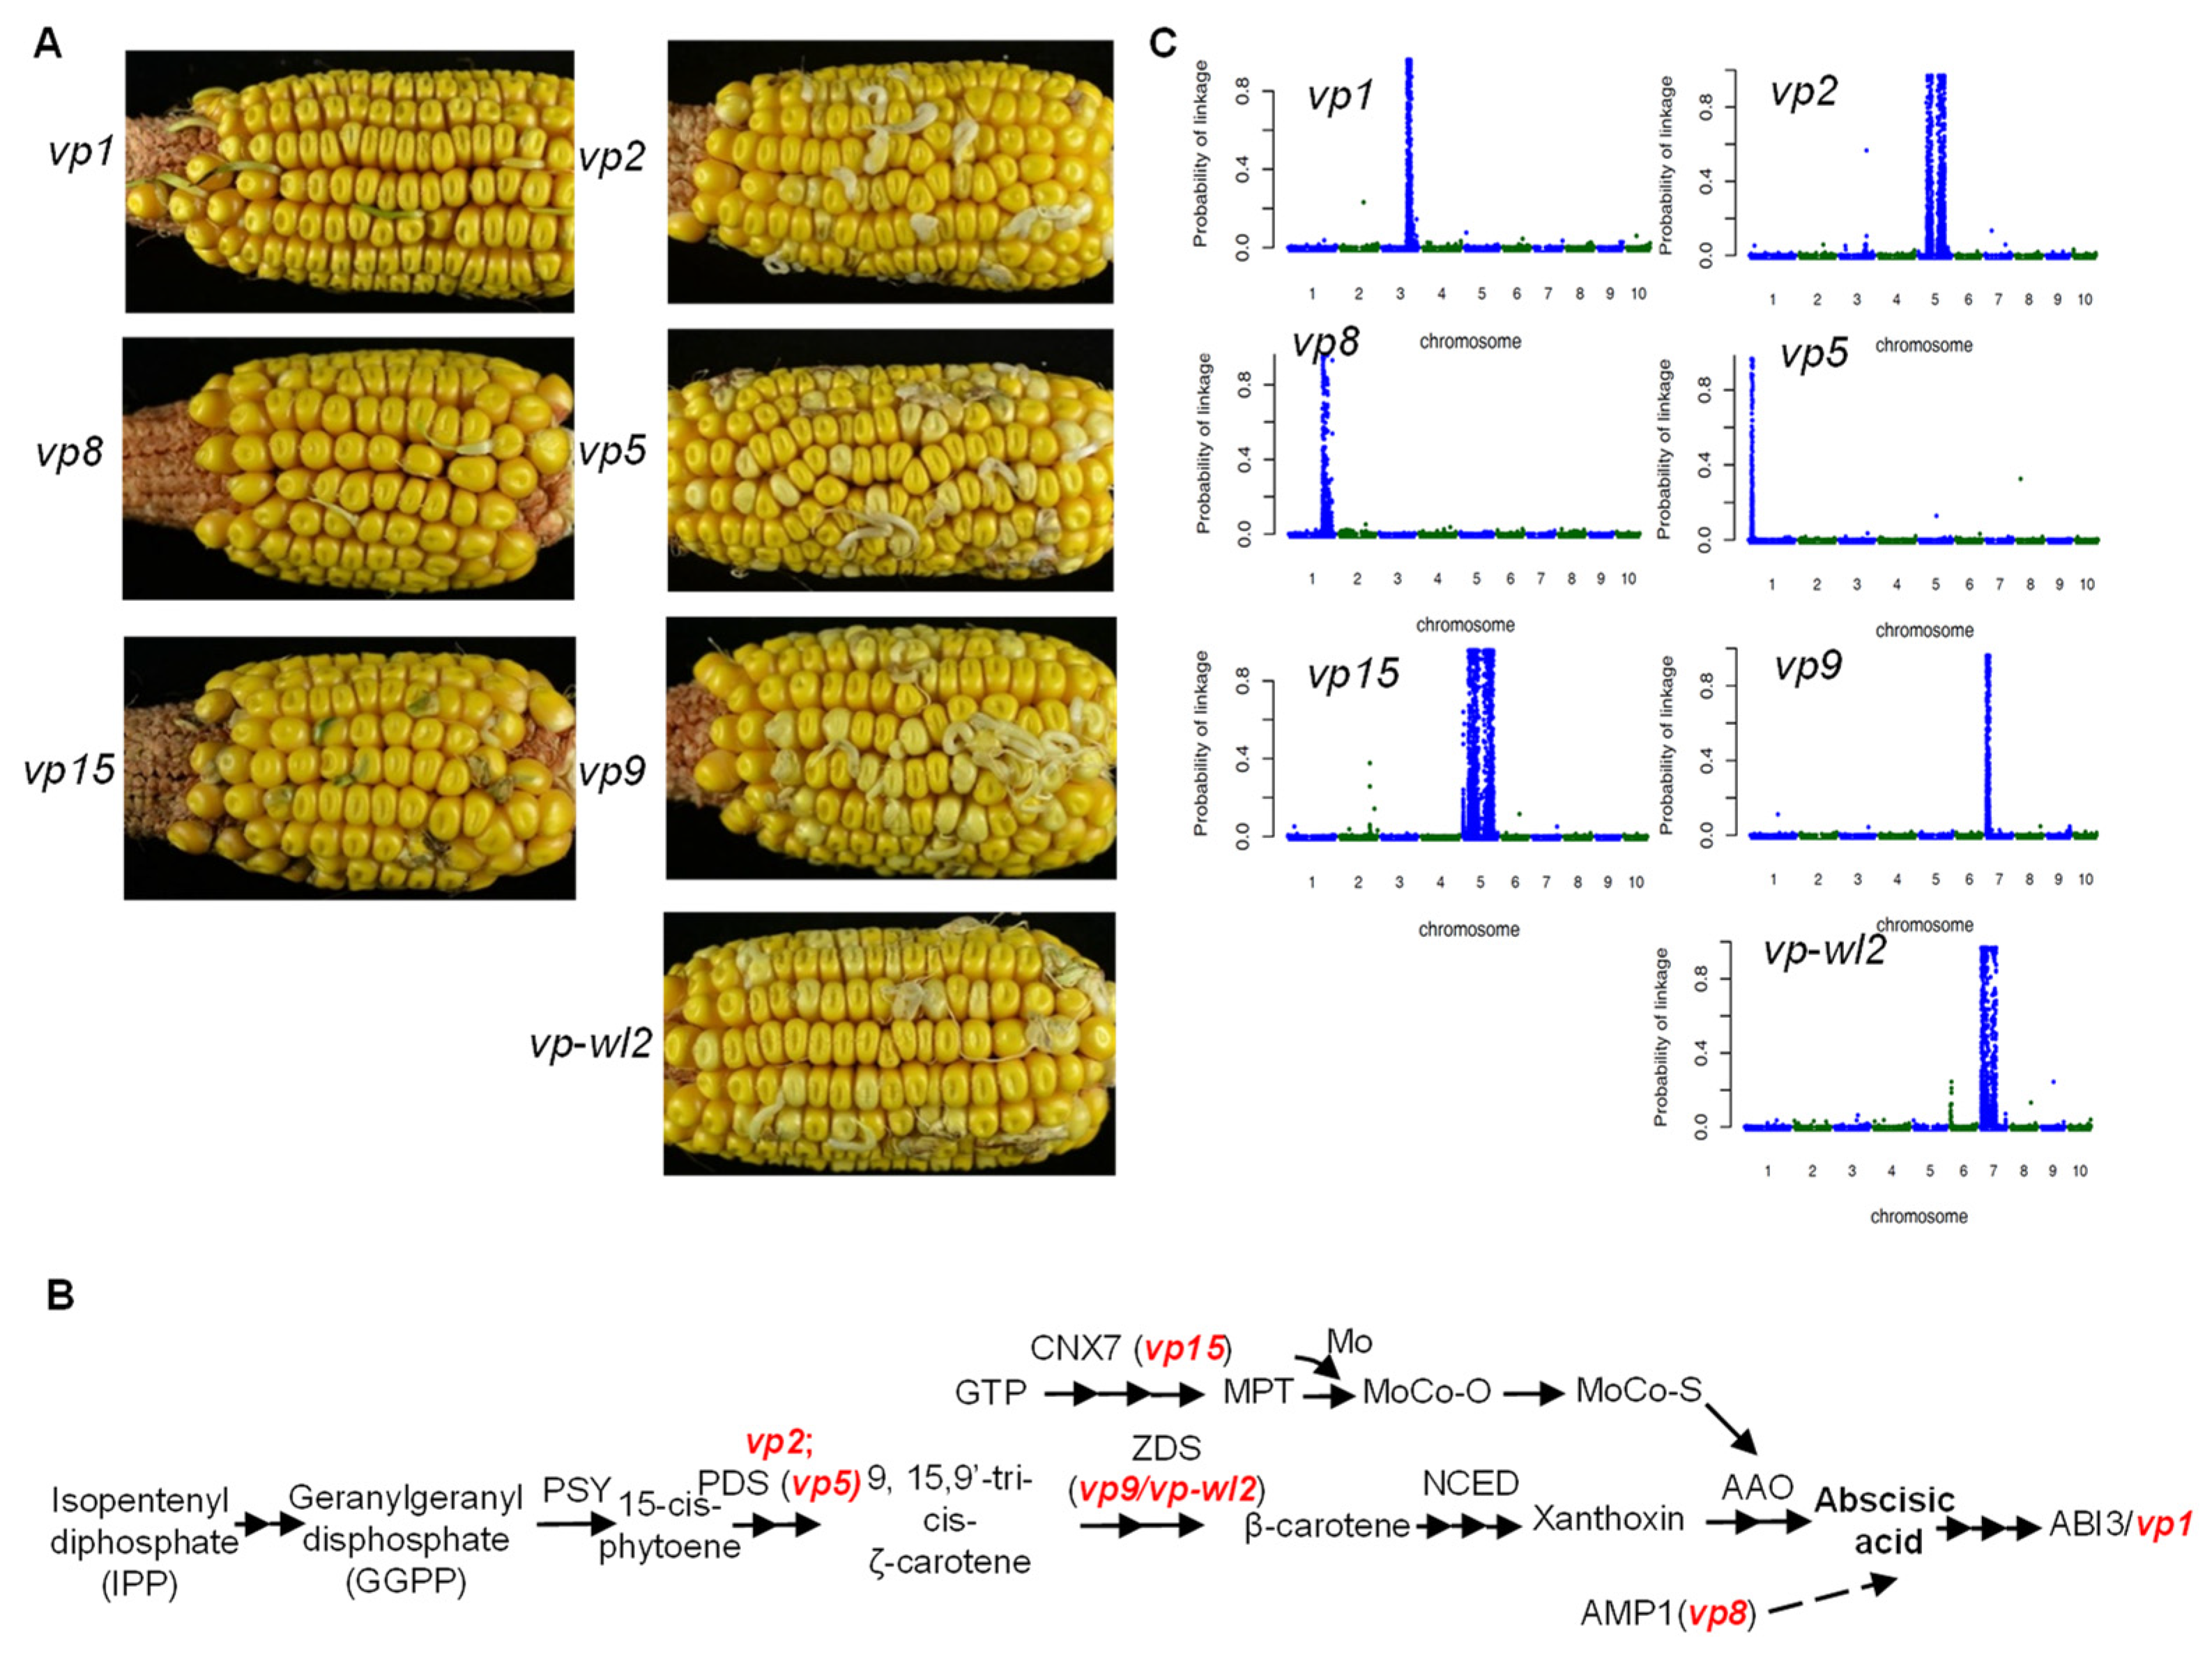
2.1. Phenotype of Vivipary Mutants

We collected seven viviparous mutants including vp1, vp2, vp5, vp8, vp9, vp-wl2 (an allele of the vp9 locus), and vp15 for transcriptome sequencing. To reduce the influence of genetic background, each mutant was backcrossed into the B73 inbred line for at least five generations, followed by self-pollination. The kernels of self-pollinated progeny from each line showed a segregating viviparous phenotype (Figure 1A). Viviparous grains in the vp1, vp8, and vp15 kernels developed green sprouts, whereas viviparous sprout grains in the vp2, vp5, vp9 and vp-wl2 kernels appeared white or pale yellow (Figure 1A), which was consistent with previous reports [6].
Kernels of each ear with segregating viviparous grains were grouped into mutant seeds (vivipary) or wild-type seeds. Embryos of at least ten mutant seeds or wild-type seeds from the same ear were pooled to represent a pair of mutant and wild-type samples for RNA-Seq. Three biological replicates of mutant and wild-type samples were collected for each viviparous mutant. In total, 42 RNA-Seq libraries were prepared and sequenced. With such an experimental design, BSR-Seq was employed for gene mapping [25]. The mapping locations of the five cloned viviparous genes and the uncloned vp2 gene were consistent with previous reports, supporting that the correct genetic materials were used (Figure 1C).

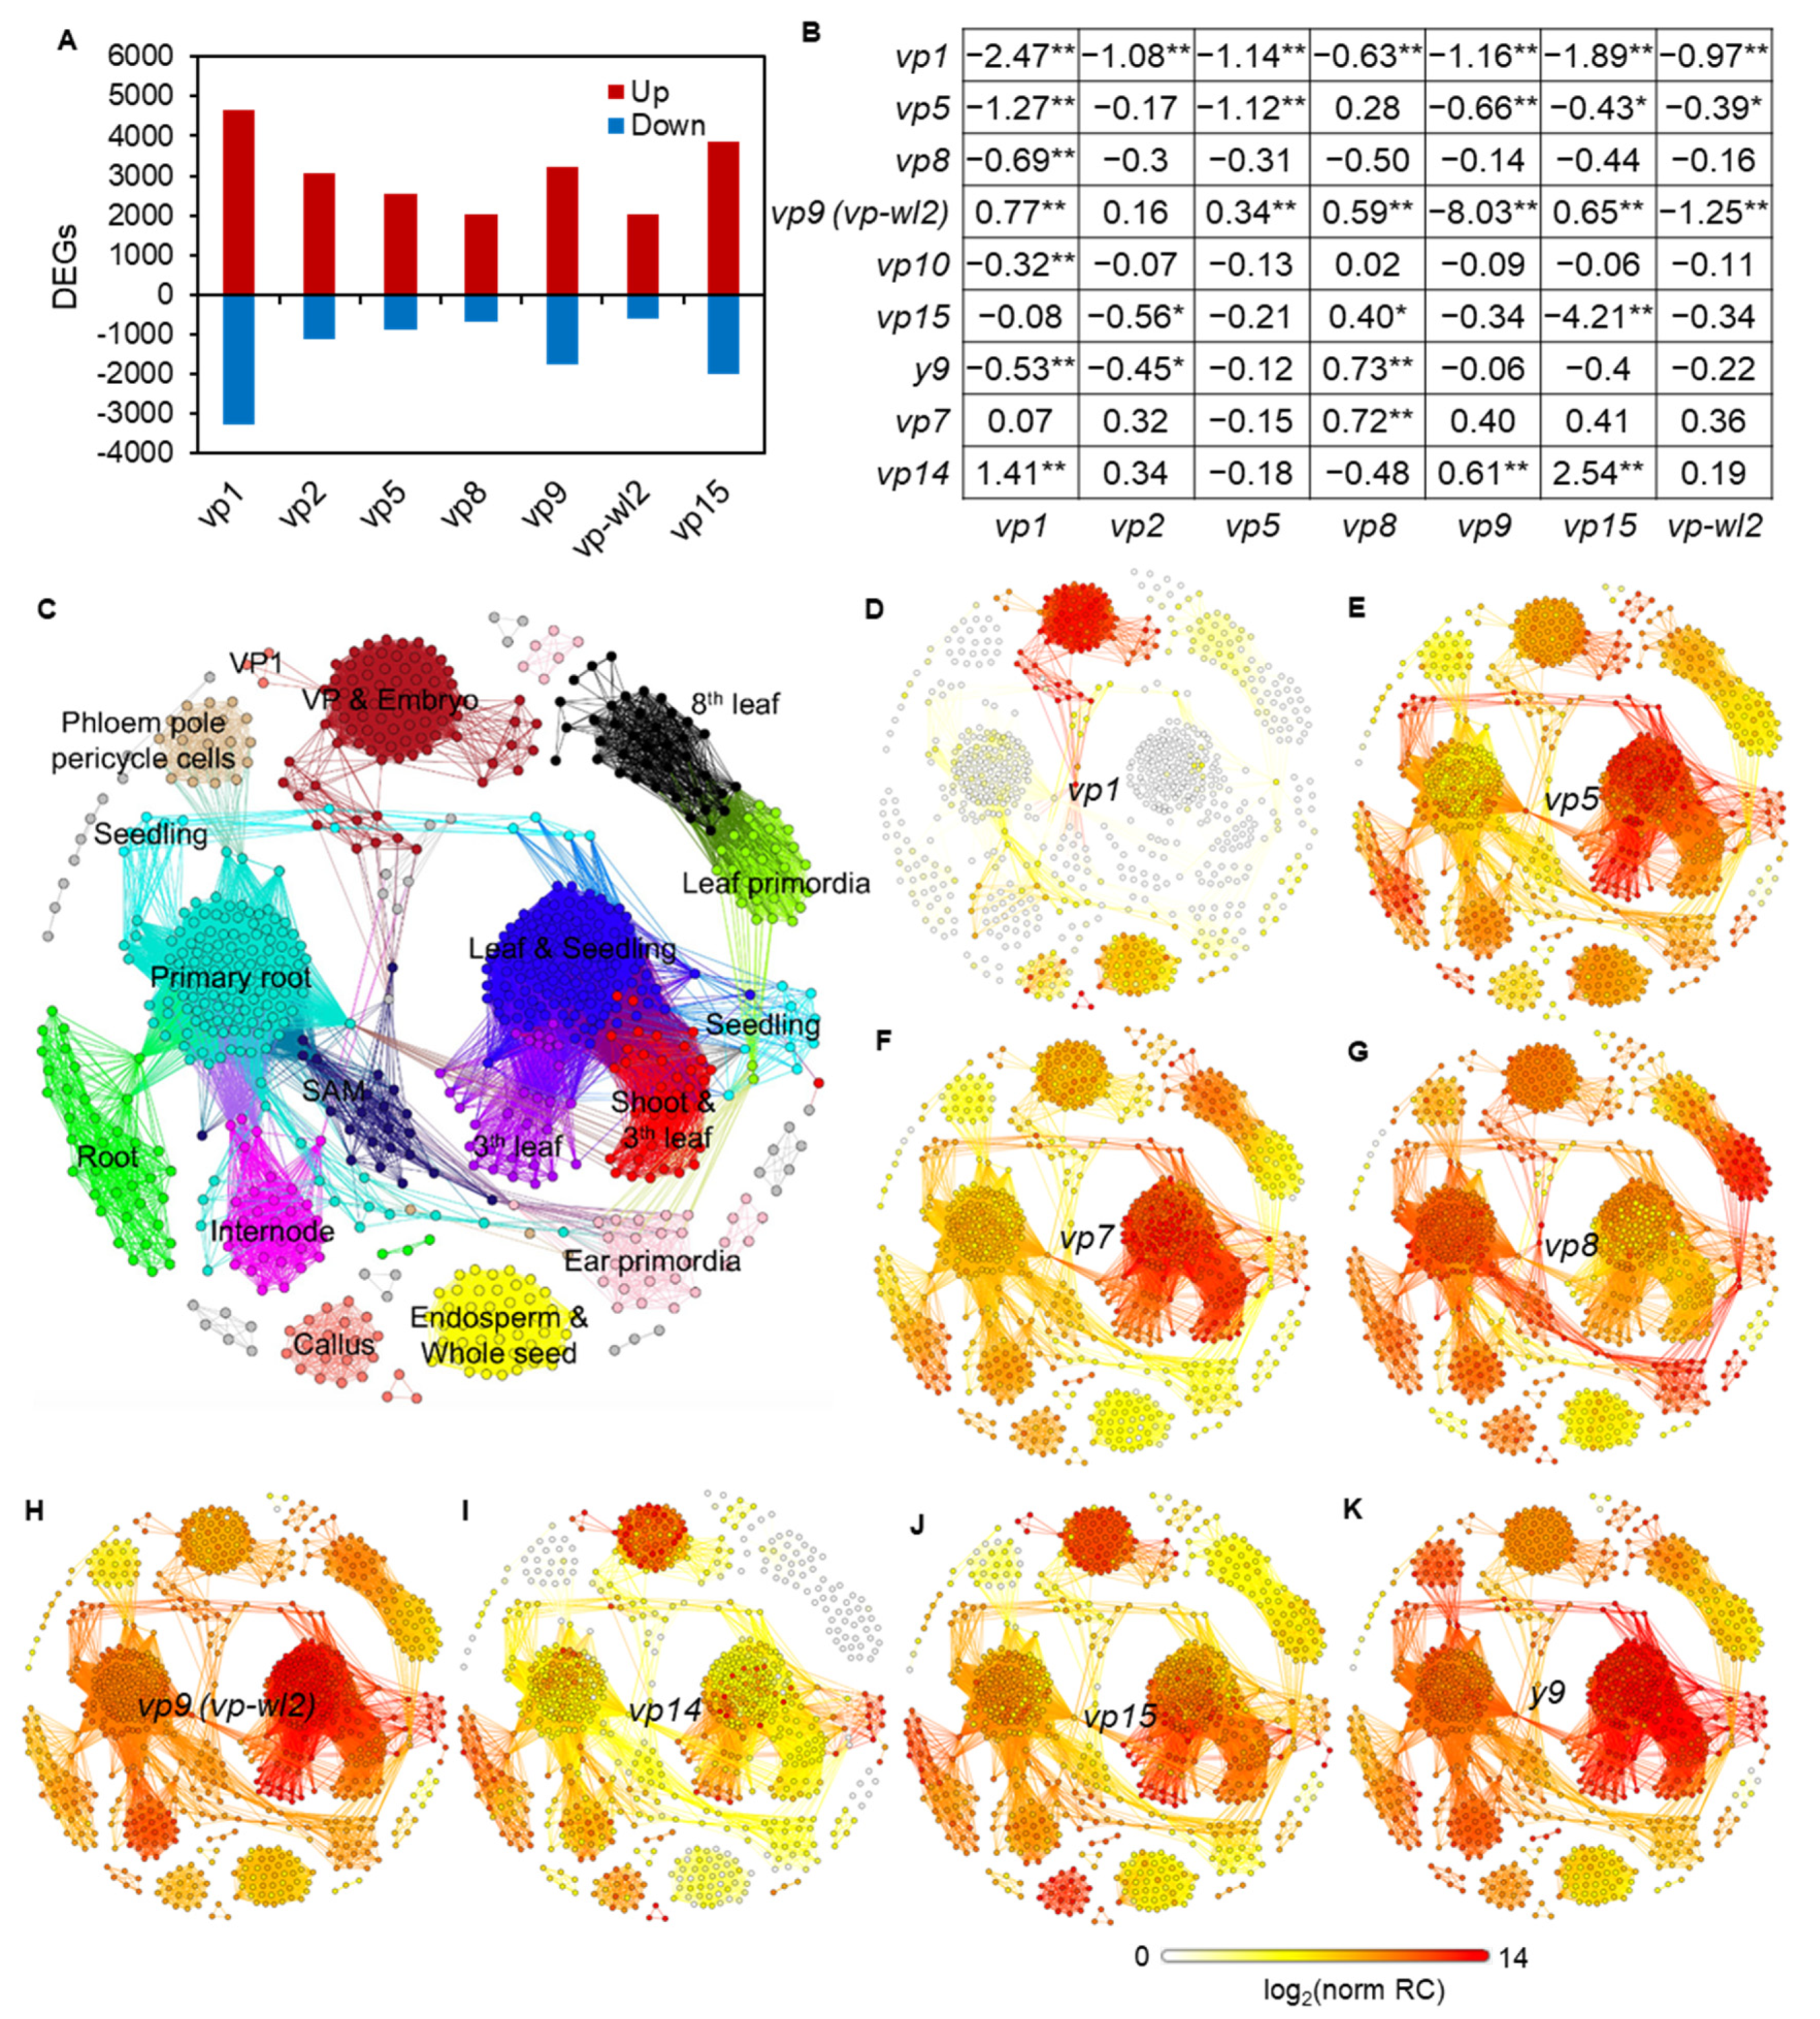
2.2. Common Biological Processes Affected in Vivipary Mutants

Analysis of RNA-Seq data produced approximately 24,000 informative genes (genes with at least five reads on average) from each viviparous mutant (Table S1). With at least two-fold expression change and less than the 5% false discovery rate (FDR), we identified 2632 to 7957 significantly differentially expressed genes (DEGs) in the mutants when compared with their corresponding wild-types, with the vp1 comparison containing the most DEGs (Figure 2A). vp9 and vp-wl2 are two independent allele mutants that vp9 contained an 8-bp insertion in the coding region of the ZDS and vp-wl2 mutant had an insertion of Mu9 in the first intron [10]. The different mutant type of vp9 and vp-wl2 may have different impacts on genes. All known viviparous genes exhibited altered expression levels in at least one comparison (Figure 2B). Interestingly, vp1 was downregulated in all viviparous mutants, and all other known viviparous genes, except vp7 and vp15, were differentially expressed in the vp1 mutant (Figure 2B).
Clustering analysis of RNA-Seq samples via weighted gene co-expression network analysis (WGCNA) grouped RNA-Seq samples from this study and 739 additional publicly available RNA-Seq samples of B73 (Table S2) into 16 tissue clusters (Figure 2C). All samples from this study clustered with embryo samples from public samples. The expression of each viviparous gene was displayed on top of this sample network, showing that all viviparous genes were expressed in the embryo (Figure 2D–K). The expression signals of vp1 (log2(norm RC) = 5–13), vp14 (log2(norm RC) = 4–11), and vp15 (log2(norm RC) = 5–11) were the highest in the embryo (Figure 2D,I,J). vp5 (log2(norm RC) = 9–13), vp7 (log2(norm RC) = 6–10), vp9 (log2(norm RC) = 9–13), and y9 (log2(norm RC) = 6–11) had the highest expressions in the seedling stage and likely played a major role in the seedling stage (Figure 2E–K). The expression of vp8 (log2(norm RC) = 5–10) was highest in the leaf primordia and the primary root (Figure 2G), which is consistent with the function of vp8 in regulating meristem development [26]. To identify functional genes closely associated with vivipary genes, WGCNA was applied to cluster all expressed genes based on all wild-type and vivipary mutant samples. A total of 67 gene modules were obtained, and the four vivipary genes were included in different modules (vp1 in Module 1, vp5 in Module 12, vp9 in Module 26, and vp15 in Module 15) (Table S3), suggesting that each vivipary gene was involved in different gene networks. Among the 67 gene modules, the vp1 related module, Module 1, contained the largest number of genes that participate in diverse biological functions, such as transcription factor activity, signal transducer activity, and transporter activity (Table S4). The above analyses suggest that vp1 may play important roles in maize vivipary.
Among the DEGs, 796 DEGs and 51 DEGs were found to be commonly upregulated and downregulated, respectively, in all vivipary mutants (Figure 3A and Table S5). GO enrichment analysis of the 796 upregulated DEGs in all seven mutants showed that, in biological processes, the metabolic process (GO:0008152), response to stimulus (GO:0050896), and regulation of gene expression (GO:0010468) were enriched; in molecular functions, catalytic activity (GO:0003824), transporter activity (GO:0005215), and oxidoreductase activity (GO:0016491) were significantly enriched. The membrane (GO:0016020) and photosystem (GO:0009521) were significantly enriched in cellular components (Figure S1A). The unique DEGs were identified by hierarchical clustering, and the unique enriched GO terms in each vivipary mutant were also identified (Figure S2), such as cellular amino acid and derivative metabolic processes and the carbohydrate metabolic process being enriched in vp1.

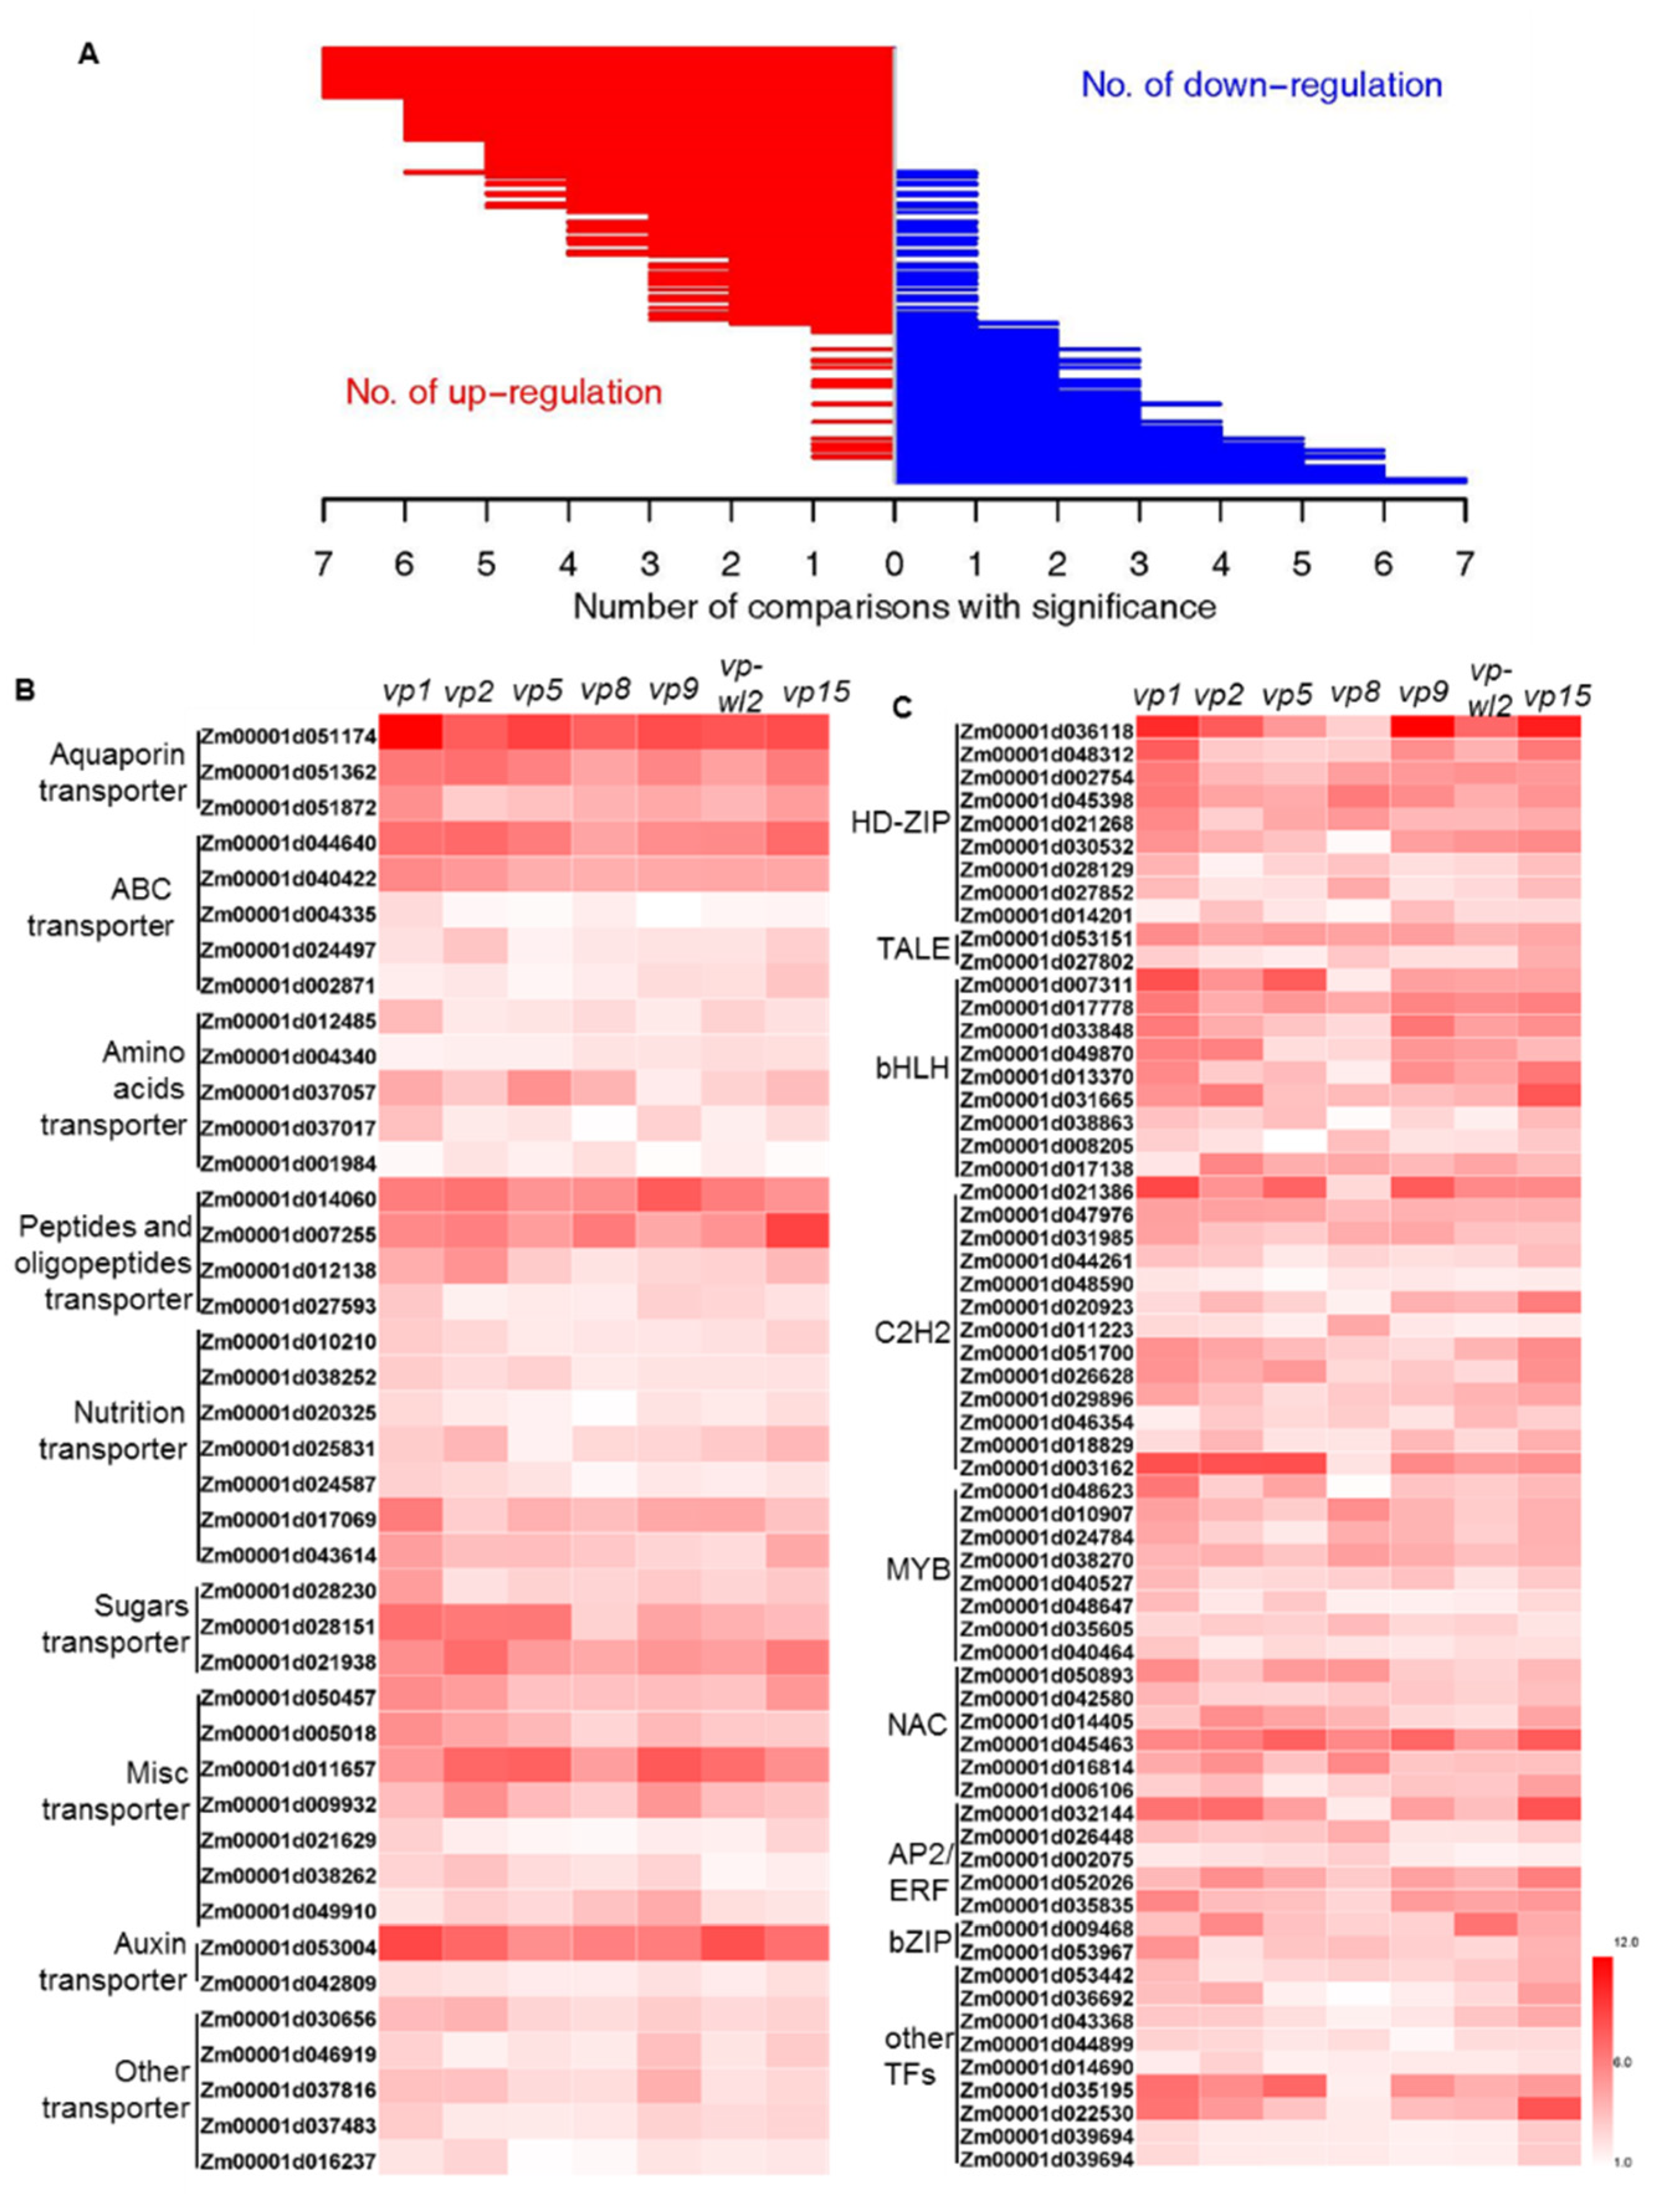
2.3. Transporters and Transcription Factors (TFs) with Altered Expression in Seven Vivipary Mutants

The genes encoding transporters that are enriched in the common DEGs included aquaporin transporter genes (PIP, Zm00001d051174, and Zm00001d051872; TIP and Zm00001d051362), and nutrition and sugar transporters, including three potassium (K) transporters (Zm00001d010210, Zm00001d038252, and Zm00001d020325), two nitrogen (N) transporters (Zm00001d025831 and Zm00001d024587), one phosphorus (Pi) transporter (Zm00001d017069), one sulfur (S) transporter (Zm00001d043614), and three sugar transporters (Zm00001d028230, Zm00001d028151, Zm00001d021938) (Figure 3B). In addition, five ATP-binding cassette (ABC) transporter family genes, five amino acids transporter genes, four peptides and oligopeptides transporter genes, and two auxin transporter genes were upregulated in the mutants (Figure 3B). These transporters are likely required for water uptake and nutrition relocation during the precocious germination process to sustain the growth of the embryo [27,28,29,30].
Transcription factors (TFs) play pivotal roles in almost all biological processes [31,32]. Among the 796 upregulated DEGs, 62 genes from 15 TF families were identified and enriched in these DEGs (hypergeometric test, p-value = 1.93 × 10⁻⁷). The differentially expressed TF genes were from the families of HD-ZIP (nine genes), bHLH (nine genes), C2H2 (13 genes), MYB (eight genes), NAC (six genes), AP2/ERF (six genes), TALE (two genes), and bZIP (two genes) and were upregulated in all vivipary mutants compared with the wild-type (Figure 3C). HD-ZIP TF (Zm00001d021268) and AP2 TF (Zm00001d009468), which are homologs of ATHB7 and RAV1 in Arabidopsis, respectively, were all upregulated in seven vivipary mutants (Figure 3C). ATHB7 and RAV1 act as negative regulators of seed development in Arabidopsis by influencing ABA signaling [33,34]. These TFs may act as important transcriptional regulators of seed germination.
To pinpoint the major genes encoding transcription factors and transporters among the common DEGs, we screened the hub genes by exploring the 67 gene modules using intramodular connectivity and gene significance (Table S6). Fourteen transporter genes and thirteen TF genes were identified, including a sugar transporter (Zm00001d028151) in Module 1. Sugar signaling interacts with ABA signaling to regulate seed germination [28] and sugar transporters in vivipary mutants may be important for energy supply or signaling regulation during the seed germination process.

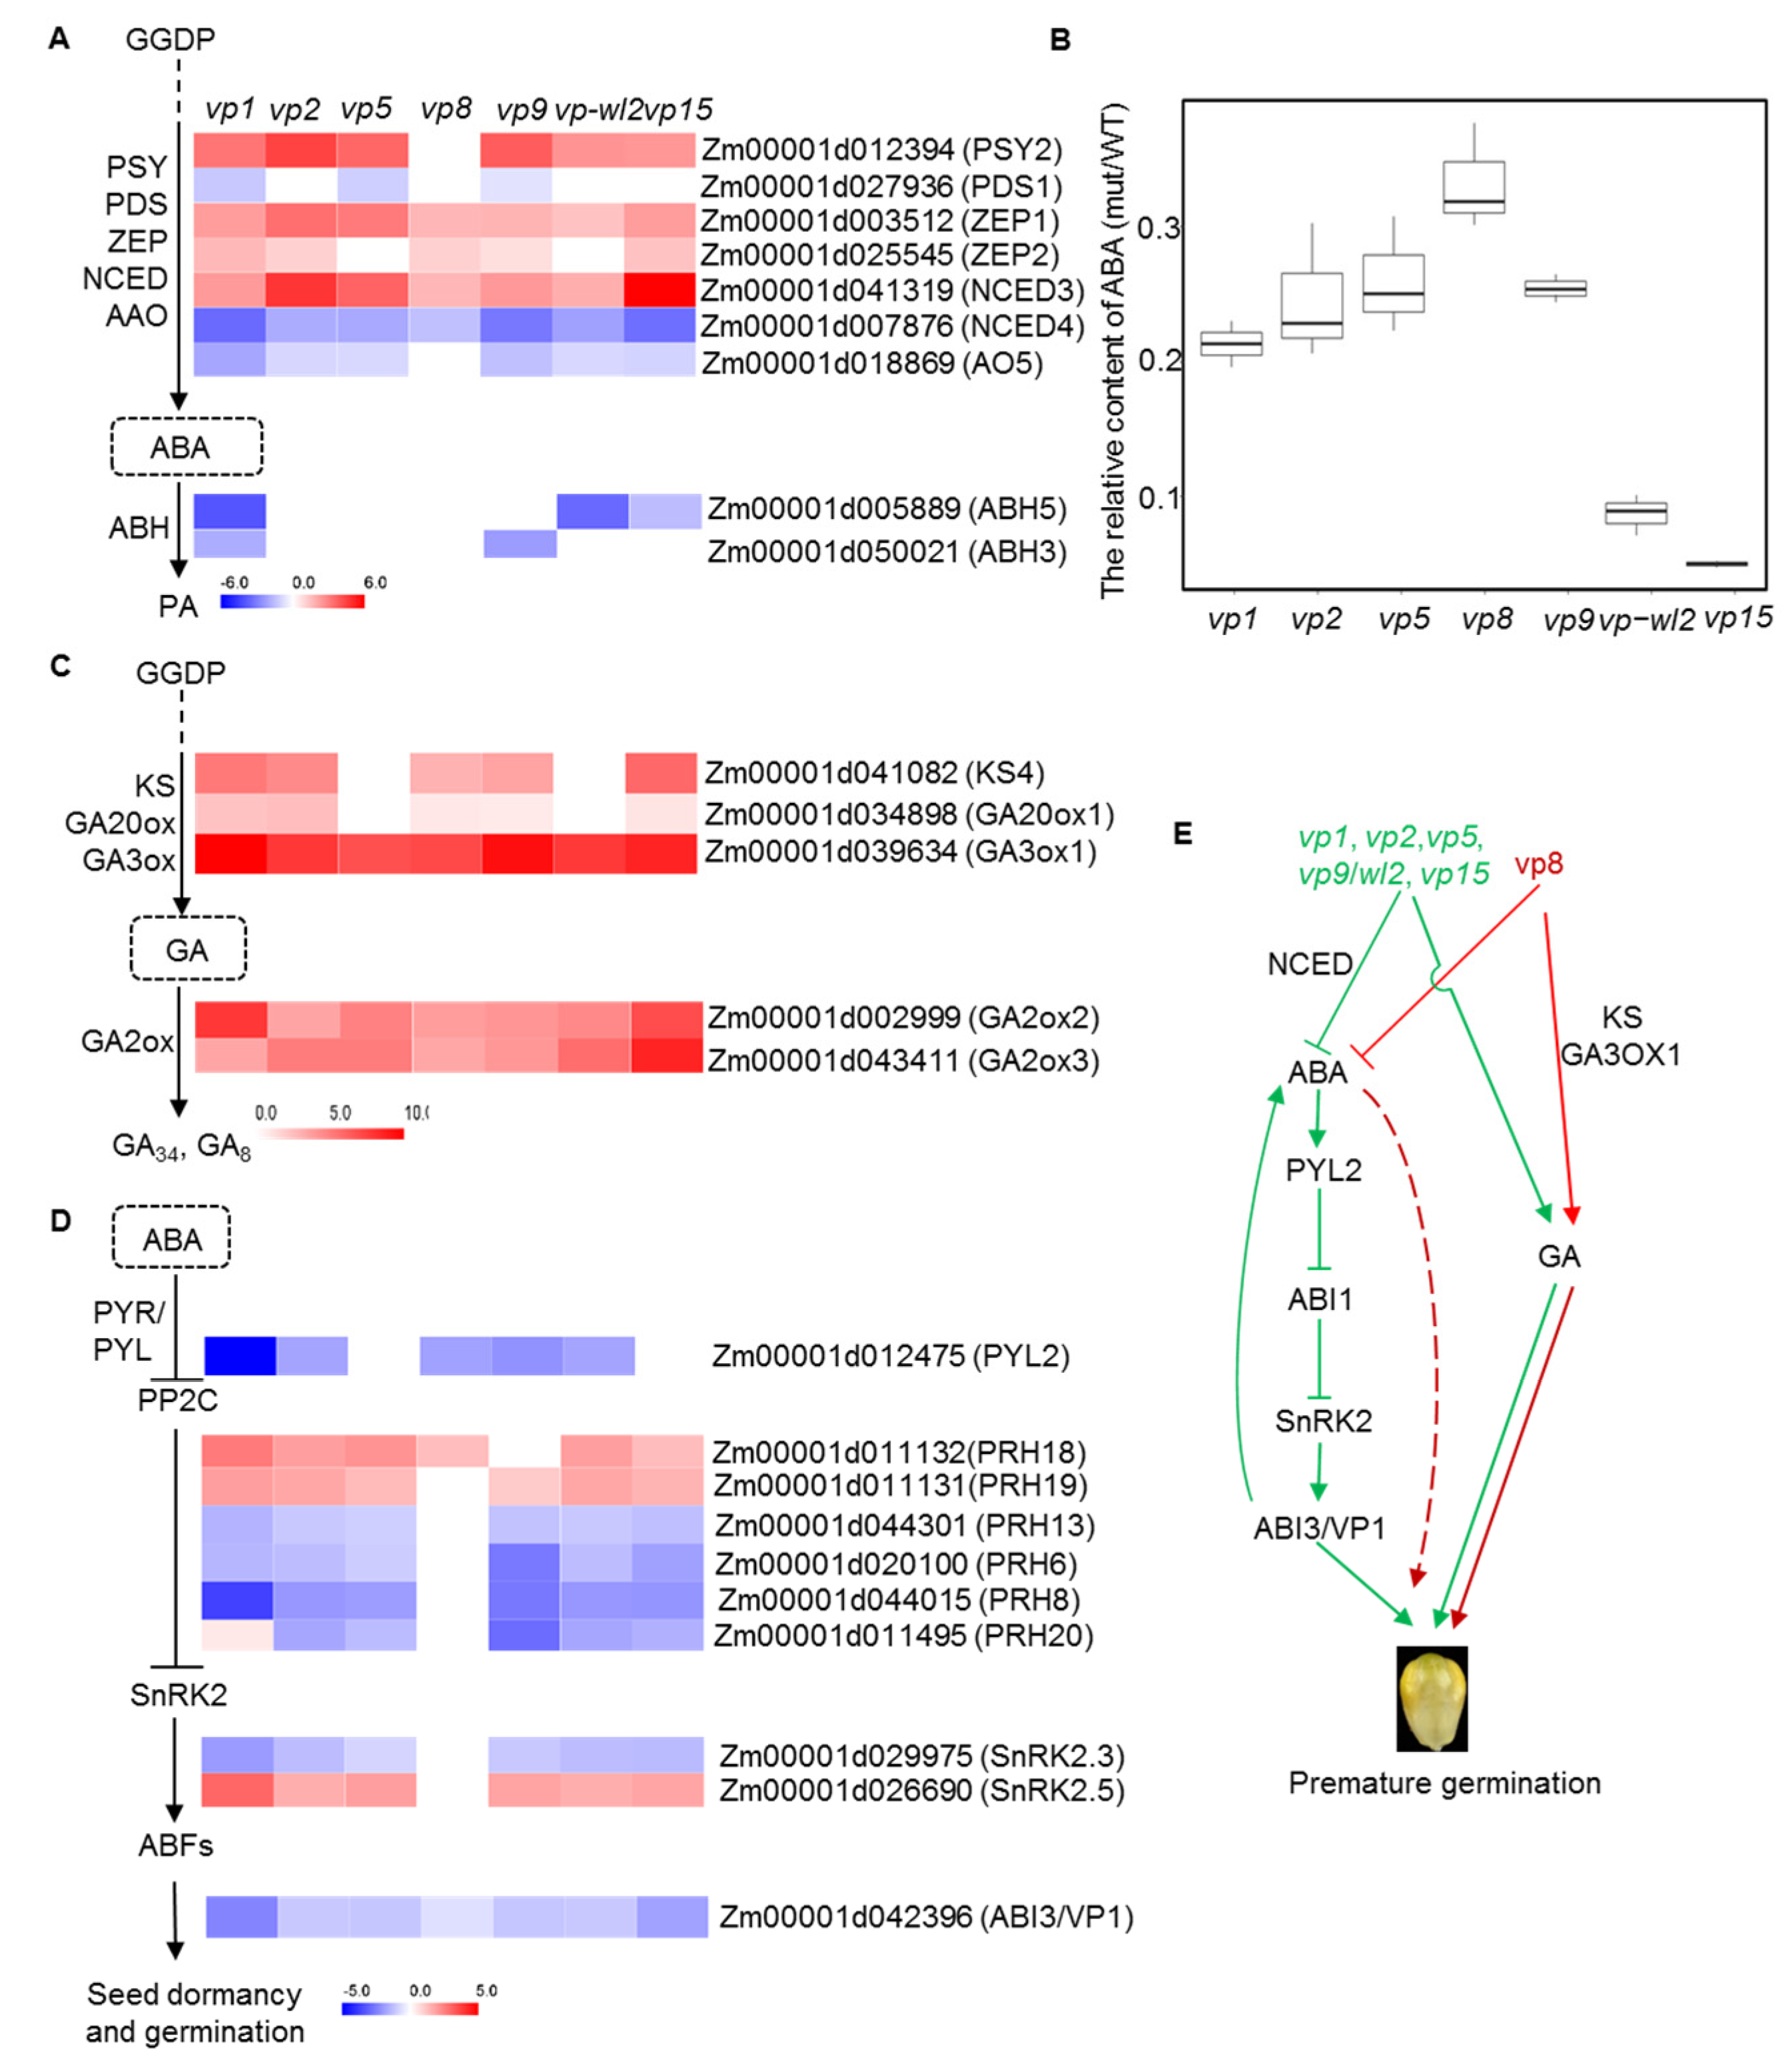
2.4. ABA- and GA-Related Genes Were Differentially Expressed in Vivipary Mutants

As ABA and GA play opposing roles in seed dormancy and germination, we examined the expression of ABA- and GA-related genes in vivipary mutants. In the biosynthetic pathway of carotenoids, precursors of ABA, one PSY gene (Zm00001d012394) was upregulated in all mutants except vp8 (Figure 4A), and one PDS gene (Zm00001d027936) was downregulated in mutants of vp1, vp5, and vp9 (Figure 4A). However, the expression of two ZEP genes (Zm00001d003512 and Zm00001d025545) in the mutants was higher than that in the wild-type (Figure 4A), probably due to the presence of feedback regulation. In the ABA biosynthetic pathway, NCED catalyzes the first committed step [35]. Zm00001d007876 (NCED4) was markedly downregulated in all viviparous mutants, but the Zm00001d041319 (NCED3) showed the opposite trend (Figure 4A). Zm00001d018869 (AO5) was also downregulated in all mutants except vp8. The expressions of two abscisic acid 8′-hydroxylase genes (ABH) (Zm00001d005889 and Zm00001d050021), which convert ABA into its inactive form, were downregulated in vp1, vp9, wl2, and vp15 (Figure 4A). Collectively, similar expression patterns of PSY2, ZEPs, NCEDs, and AO5 were observed in most of the vivipary mutants, indicating that the ABA biosynthetic pathway is subjected to a similar regulation in many vivipary mutants. In addition, we collected embryos from seven viviparous mutants and the wild-type plant at 30 days after pollination (DAP) to quantify the content of ABA. Consistent with previous reports, the ABA content in all mutants was significantly lower than that of the wild type (Figure 4B).
In contrast to ABA, the ent-kaurene synthase gene (KS4, Zm00001d041082), GA20-oxidase gene (GA20ox1, Zm00001d034898), and GA3-oxidase gene (GA3ox1, Zm00001d039634), which are involved in GA biosynthesis, were upregulated in the vivipary mutants (Figure 4C). Notably, the key gene GA3ox1 in GA biosynthesis was markedly upregulated in all vivipary mutants (Figure 4C). With the presumably enhanced GA biosynthesis, the expression of GA2-oxidase genes (GA2ox2, Zm00001d002999; GA2ox3, Zm00001d043411) in the GA catabolic pathway was also upregulated (Figure 4C).
Mutations in ABA signaling components also alter the degree of seed dormancy [36]. ABA core signaling consists of ABA receptors, group A protein phosphatase type 2Cs (PP2Cs), sucrose nonfermenting 1 (SNF1)-related protein kinases 2 (SnRK2s), and downstream TFs [37]. The ABA receptor (PY2, Zm00001d012475) was downregulated in all mutants except vp5 and vp15 mutants (Figure 4D). The key ABA signaling component PP2C genes were differentially expressed in most mutants, including two upregulated (Zm00001d011132 and Zm00001d011131) and four downregulated genes (Zm00001d044301, Zm00001d020100, Zm00001d044015, and Zm00001d011495). Zm00001d029975 (SnRK2.3) was downregulated, and Zm00001d026690 (SnRK2.5) were upregulated in most vivipary mutants to regulate the expression of ABI3/VP1 (Figure 4D). However, most of these genes did not exhibit significantly different expressions between the vp8 mutant and wild-type. These results indicate that the imbalance of ABA and GA as well as altered ABA signaling in vivipary mutants determined the transition from seed dormancy to seed germination, which was conserved between maize and other plants [17]. However, VP8 regulates seed dormancy and germination through other unidentified ABA signaling pathways (Figure 4E).

2.5. Vivipary Mutants Had Distinct Patterns of Metabolite Accumulation

To determine the metabolites highly associated with seed development, we performed global metabolite profiling of vivipary mutants via untargeted metabolome analysis. In total, 3199 metabolites were detected (Table S7). Principle component analysis (PCA) showed that vp1 and vp8 mutants were distant from other mutants, indicating distinct metabolite profiles in these two mutants (Figure 5A). Differential analyses of metabolites between each mutant group and the wild-type control identified 590 to 1719 differentially accumulated metabolites (DAMs) from seven comparisons (p < 0.05, and at least two fold changes in expression) (Figure 5B). The vp1 mutant had the highest number of DAMs, in agreement with the highest DEGs from the transcriptomic analysis. We were able to detect reduced the ABA content in all vivipary mutants through untargeted analysis (Table S8), which was highly consistent with the ABA quantification results (Figure 4B). We further correlated the 67 gene modules to all metabolites (Table S9) and found that Module 1 containing vp1 had the highest mean correlation with metabolites, among which the metabolites with absolute values of Pearson correlation > 0.7 were selected for pathway analysis, revealing that a number of metabolites are involved in amino acid biosynthesis and metabolism (Table S10).
Hierarchal clustering of DAMs from all vivipary mutants specialized in the metabolite profile of each mutant is shown in Figure 5C. We focused on the significantly enriched metabolites in five mutants (indicated by the black boxes in Figure 5C) and performed KEGG enrichment analysis. The number of affected pathways in the vp1 mutant was the highest in all mutants (Figure 5D), with 14 out of 34 related to amino acid metabolism. Similarly, multiple KEGGs that were enriched in other mutants were identified, and these were classified into aminoacyl-tRNA biosynthesis; valine-leucine biosynthesis; arginine biosynthesis; and alanine, aspartate, and glutamate metabolism pathways, affecting major amino acids including leucine, arginine, tryptophan, lysine, phenylalanine, histidine, L-aspartate. The results correlated well with transcriptional analysis, as five amino acid transporter genes were upregulated in the mutants (Figure 3B).
We were able to identify common and unique enriched KEGG among vivipary mutants (Figure 5D). The metabolite pathways of alanine, aspartate, and glutamate metabolism were commonly affected in all vivipary mutants. “Monobactam biosynthesis”, “lysine biosynthesis”, “phenylalanine metabolism”, “histidine metabolism”, “beta-alanine metabolism”, “pentose phosphate pathway”, “fructose and mannose metabolism”, “glycolysis/gluconeogenesis”, “folate biosynthesis”, “inositol phosphate metabolism”, “terpenoid backbone biosynthesis”, “pyrimidine metabolism”, and “flavonoid biosynthesis” were enriched only in vp1. In addition, the “selenocompound metabolism”, “biotin metabolism”, and “pyruvate metabolism” pathways were enriched only in vp2. The metabolites in the “indole alkaloid biosynthesis”; “tropane, piperidine, and pyridine alkaloid biosynthesis”; “riboflavin metabolism”; and “starch and sucrose metabolism” pathways were accumulated only in vp8. “Porphyrin and chlorophyll metabolism” were enriched only in vp9. The metabolites in “caline, leucine and isoleucine degradation”, “betalain biosynthesis”, “linoleic acid metabolism”, “isoquinoline alkaloid biosynthesis”, “galactose metabolism”, “arachidonic acid metabolism”, “tyrosine metabolism”, “phenylpropanoid biosynthesis”, and “zeatin biosynthesis” were accumulated only in vp15. Notably, the “purine metabolism” pathway was affected in both vp1 and vp15 mutants, and purine metabolism can directly affect ABA biosynthesis [38]. The results indicated that mutations in vivipary mutants have distinct effects on different metabolic pathways.

3. Discussion

In the present study, we performed integrated multi-omics analysis using seven maize viviparous mutants and revealed the transcriptional and metabolic landscape of vivipary in maize. We found that the activity of transporters of metabolites including aquaporin, ABC, amino acids, peptides and oligopeptides, nutrition, and sugars was markedly altered during vivipary (Figure 3B). Amino acid and peptide transporters are essential for resource allocation during plant growth and development, especially during seed germination [39,40,41]. AAP8 plays an important role in the uptake of amino acids in embryos and endosperms in Arabidopsis [40], and we identified that, among the five amino acid transporter genes, Zm00001d001984, which is a homolog of AtAAP8, was upregulated in all vivipary mutants (Figure 3B). In addition, we detected an overrepresentation of KEGG pathways related to the metabolism of amino acids in five vivipary mutants (Figure 5D), confirming active metabolism and transport of amino acids during vivipary. Meanwhile, metabolites in the “alanine, aspartate, and glutamate metabolism” KEGG pathways were commonly affected in all vivipary mutants (Figure 5D). Aspartate and glutamate were increased during seed germination, which could provide the necessary energy for this high energy-consuming process [42,43,44,45]. Together, transcriptomic and metabolomic analyses indicated that the reallocation of amino acids might play an important role in the precocious seed germination of vivipary mutants.
In addition to amino acid transporters, genes encoding four peptide transporters (PTRs), five ABC transporters, and three sugar transporters, were found to be upregulated in our mutants, suggesting that they may play a role in seed germination (Figure 3B). PTR2 in Arabidopsis is negatively regulated by ABI4 and plays a key role in water uptake by seeds, ensuring that imbibed seeds proceed to germination [27], and ZmPTR1, VfPTR1, VfPTR2, and HvPTR1 are for seed germination in maize, faba beans, and barley [46,47]. Accordingly, three aquaporin transporters were upregulated in the vivipary mutants (Figure 3B), likely facilitating water uptake during seed germination. Several members of the ABC transporter have been reported as free ABA transporters [48]. ABCG20 is necessary for normal seed dormancy in Arabidopsis, and MtABCG20 is an ABA exporter that influences seed germination of Medicago truncatula [49,50]. The upregulation of ABC transporters in vivipary mutants probably facilitates the export of ABA from the embryo. Sugars are a major energy resource in biological processes, and sugar signaling interacts with ABA signaling to regulate seed germination [28]. In crops, the rice sugar transporter OsSUT1 [51,52] and maize ZmSUT1 [29] are highly expressed in germinating seeds, and the suppression of OsSUT1 resulted in retarded germination [30]. The increased expression of sugar transporters in vivipary mutants may be important for energy supply or signaling regulation during seed germination.
TFs play pivotal roles in seed dormancy and germination. We identified 62 TF-encoding genes that were upregulated in all vivipary mutants. Among these, C2H2, HD-ZIP, bHLH, and MYB were the most abundant (Figure 3C). Previous studies have indicated that at least three class I HD-ZIPs (AtHB6, AtHB7, and AtHB12) participate in ABA signaling as part of a negative feedback loop containing the ABI and ABA receptors [33,53,54]. Nine HD-ZIP TFs, including Zm00001d021268, which is a homolog of ATHB7, were upregulated in all mutants (Figure 3C). The AP2 TF RAV1, as a negative regulator of seed development in Arabidopsis, directly binds to the promoters of ABI3 and ABI4, leading to the perturbation of ABA signaling [34,55]. Zm00001d009468, a homolog of RAV1, was also upregulated in vivipary mutants, whereas the expression of VP1, a homolog of ABI3, was reduced (Figure 3C), indicating a similar function of maize RAV1 in the suppression of ABI3. Meanwhile, many bHLH and MYB TFs were found to be specifically ABA-repressed during seed dormancy [56]. A group of MADS-box, MYB, NAC, and WRKY genes have also been implicated in seed dormancy regulation [57]. We identified a number of bHLH, MYB, and NAC TFs that were induced in seven vivipary mutants, indicating that these genes are likely released from ABA repression during seed germination.
Seed dormancy and germination are regulated by a wide range of plant hormones, including ABA, GA, ethylene, and brassinosteroid, of which ABA and GA are the primary factors for seed dormancy and germination [15,58]. We confirmed that all seven vivipary mutants accumulated significantly less ABA (Figure 4B and Table S8). Most enzymes involved in ABA biosynthesis were identified (Figure 1B). PSY catalyzes the first committed step in carotenogenesis [59]. We found that PSY was upregulated in all the selected mutants, except for vp8 (Figure 4A). This is likely due to feedback regulation, as most of the VP genes are located downstream of PSY. Xanthophyll cleavage by NCED is the first committed step in ABA biosynthesis and is rate-limiting [15,35]. NCED3 was upregulated while NCED4 was downregulated in all mutants. NCED4 (Zm00001d007876) is a homolog of AtNCED9 and VP14. Loss of function of AtNCED9 or VP14 in Arabidopsis or maize leads to decreased endogenous ABA content and thus reduced seed dormancy [12,60]. Therefore, the reduced ABA content in all the mutants is likely a result of downregulated NCED4 expression, indicating a key role of NCED4 but not NCED3 in ABA biosynthesis and seed dormancy maintenance in maize. ABA controls seed dormancy and germination via a complex signaling network. The core components from ABA perception to ABA-regulated gene expression (PYR/PYL/RCAR-ABI1/2-SnRK2s-ABFs/AREBs) have been reported [61]. As expected, the positive seed dormancy genes (one ABA receptor: Zm00001d012475; one SnRK2: Zm00001d029975; and ABI3/VP1: Zm00001d042396) were all downregulated in all mutants except vp8, whereas the negative seed dormancy genes (two PP2Cs: Zm00001d011131 and Zm00001d011132) were upregulated in vivipary mutants. Zm00001d011131, a homology of ABI1, was upregulated in all mutants except vp8. The metabolite PCA also showed that vp8 was separated from other mutants, indicating the distinct role of vp8 in seed dormancy and germination, which may affect another signaling pathway regulating seed dormancy (Figure 4E and Figure 5A). VP1 and ABI3 are key determinants of seed-specific gene expression [20,62]. VP1/ABI3 strongly modifies ABA signaling by regulating of members of ABI1/ABI5-related gene families [63]. Moreover, transgenic wheat constitutively expressing the vp1 gene enhanced seed dormancy and PHS tolerance [64]. HAI2 (a PP2C) negatively regulates the ABA response, and its mutation leads to a deep dormancy phenotype in Arabidopsis [65]. However, Zm00001d020100, Zm00001d044015, and Zm00001d011495, the homologs of HAI2/3, were downregulated in our vivipary mutants (Figure 4D), indicating the different regulation strategies adopted in different plant species.
The maintenance of seed dormancy by ABA and dormancy release by GA has been observed in many species. Dormancy release largely reflects increased GA synthesis, which is dependent on the increased expression of GA3ox1 and GA3ox2 [66]. In seven vivipary mutants, the expression of Zm00001d039634 (GA3ox1) was markedly induced (Figure 4C), likely resulting in the accumulation of GA. Overall, seven vivipary mutants affected seed dormancy and germination by inhibiting ABA synthesis and by promoting GA synthesis (Figure 4E).
In conclusion, our multi-omics analysis of maize vivipary mutants supported the proposition that ABA and GA biosynthesis and signaling are the causes of vivipary. We also revealed common and unique biological processes, transcriptional regulators, and metabolic pathways that are possible regulators of the viviparous phenotype. The data presented in this study can be utilized for the genetic improvement of maize against vivipary.

4. Materials and Methods

4.1. Plant Materials

The reference mutant alleles of each gene (vp1, vp2, vp5, vp8, vp9, vp-wl2, and vp15) were introduced to the inbred line B73 via at least five backcrosses. Self-pollination of heterozygous individuals from the last backcrossing seeds generated segregating families. We selected normal seeds as the wild-type and viviparous seeds as the mutant at 30 DAP.

4.2. RNA Extraction and Sequencing

For RNA-Seq experiments, wild-type and mutant embryos from each family, collected as described above, were separately pooled and stored at −80 °C for RNA extraction. At least 10 embryos per pool were collected for each sample, and 3 biological replicates of each sample were used for RNA-Seq.
Total RNA was extracted using the RNeasy Plant Mini Kit (Qiagen). RNA concentration and purity were determined using a Nanodrop ND-2000 spectrophotometer. cDNA libraries were sequenced with a read length of 150 bp (paired-end) using an Illumina HiSeq 2000 System at Annoroad Genomics (Beijing, China). Sequencing libraries were generated using the VAHTS Universal V6 RNA-seq Library Prep Kit for Illumina® (NR604-01/02) following the manufacturer’s recommendations, and index codes were added to attribute sequences to each sample. mRNAs were isolated using oligo(dT) magnetic beads (Illumina). RNA fragmentation, cDNA synthesis, and PCR amplification were performed, and the final cDNA library was obtained by PCR enrichment. To reduce technical variation during sequencing, all six samples associated with a given viviparous gene were sequenced in the same lane. Quality checks were performed using the FastQC software [67]. Raw reads were trimmed to remove adaptors and low-quality base pairs using Trimmomatic (v3.6) [68]. The remaining clean reads were then mapped to the maize B73 reference genome (AGPv4) using STAR [69]. Raw read counts were used to calculate FPKM values. Genes with expression |log2 (fold change)| ≥1 and FDR < 0.05 were considered DEGs.

4.3. BSR-Seq Mapping

Genomic locations of viviparous genes were determined using bulked segregant RNA sequencing (BSR-Seq) [25].

4.4. Gene Ontology Analysis

Gene ontology (GO) analysis of DEGs was performed using the online tool AgriGo (http://bioinfo.cau.edu.cn/agriGO, accessed on 10 August 2021) [70]. GO terms with adjusted p-values smaller than 0.05 were considered significantly enriched terms.

4.5. Analysis of ABA Content

ABA was quantified using ultra-high-performance liquid chromatography–tandem mass spectrometry (UPLC–MS/MS). The samples were analyzed using a Xevo TQ-XS system (Waters, Milford, MA, USA) equipped with an ESI ion source. Chromatographic separation was conducted using an ACQUITY UPLC HSS T3 column (2.1 × 100 mm, 1.8 µm) maintained at 40 °C. The autosampler temperature was set to 4 °C, and the sample injection volume was 10 μL. The MS data were collected in the negative ion mode using multiple reaction monitoring (MRM) mode. Precursor and fragment ions were ABA (m/z 263.16–153.01) and d6-ABA (m/z 269.20–159.10). Data analysis was performed using a spectrometer software (Masslynx v.4.2).

4.6. WGCNA Network Construction and Module Identification

B73 RNA-Seq data were downloaded from the NCBI Sequence Read Archive (SRA) (Table S2), which was generated from multiple tissues, including but not limited to seedlings, leaves, crown roots, tap roots, whole roots, shoots, seeds, steles, shoots, stems, pollen, ears, and tassels. Raw reads were trimmed to remove adaptors and low-quality base pairs using Trimmomatic (v3.6) [68]. Clean reads were aligned to B73Ref4 using STAR [69]. The read counts for each gene were normalized to library size. Normalized data were used to construct the tissue network using the R package WGCNA (version 1.66) [71]. WGCNA was performed to cluster 739 B73 samples and 42 vivipary samples with the parameters minModuleSize = 20 and soft-thresholding power = 12. If >90% of the samples in one module belonged to the same tissue, then the module was annotated as this tissue. The connectivity between the two samples ranged from 0 to 1. Higher scores indicate stronger connectivity strength and are shown as deeper color edges in the network (Table S11). Gephi software (version 0.9.2) was used to visualize tissue networks with the module and connectivity information from the WGCNA results. The expression of each vivipary gene was converted to a shade of red and marked in the tissue network.
Samples of the wild-type and vivipary mutants were used to construct the co-expression network using the R package WGCNA. The gene significance (GS) quantifying associations of individual genes with the vivipary phenotype and the module membership (MM), which acted as the correlation between the module Eigen genes and the gene expression profiles, were calculated. Genes with a GS > 0.75 and an MM > 0.85 were considered major genes.

4.7. Metabolomic Analysis

Wild-type and mutant embryos from seven viviparous materials were collected for metabolomic analysis. The powder of each sample was extracted overnight using 80% HPLC-grade methanol containing 1 μM chrysin as the internal standard. The ratio of the fresh weight to the volume of extraction solution was kept at 0.1 g/mL. The undissolved sample residues were precipitated by centrifugation at 13,000× g rpm for 30 min at 4 °C. The clear supernatants were loaded into injection vials for UHPLC–MS/MS.
For the UHPLC–MS/MS assay, the vanquish-flex UHPLC system was coupled to a Q Exactive Plus mass spectrometer (Thermo Fisher Scientific, Bremen, Germany) for metabolite separation and detection. Following LC–MS analysis, raw data were collected and processed using Compound Discoverer 3.2 (Thermo Fisher Scientific) with the metabolite databases mzCloud, mzVault, Masslist, and Chemspider. A principal component analysis (PCA) was performed directly. Heatmap and KEGG analyses of metabolites were performed using R software (version 3.6.3).

Supplementary Materials

The following are available online at https://www.mdpi.com/article/10.3390/plants10112437/s1. Supplementary Figure S1: GO category analysis of DEGs in seven vivipary mutants. Supplementary Figure S2: Gene ontology (GO) category analysis of the specific genes in vivipary mutants. Supplementary Table S1: The summary of RNA-Seq. Supplementary Table S2: Information on the 739 B73 RNA-Seq samples. Supplementary Table S3: Sixty-seven modules obtained following WGCNA analysis. Supplementary Table S4: GO categories analysis of the genes in Module 1. Supplementary Table S5: The commonly up- and downregulated genes in seven vivipary mutants. Supplementary Table S6: The module membership and gene significance of transporters and TFs. Supplementary Table S7: The summary of metabolites. Supplementary Table S8: The relative level of metabolite abscisic acid in vivipary mutants. Supplementary Table S9: The correlation of gene modules with metabolites. Supplementary Table S10: KEGG analysis of the metabolites that had high mean correlation with Module 1. Supplementary Table S11: The connectivity of the tissue samples in the network

Author Contributions

Conceptualization, Y.W., J.Z. (Jun Zheng), X.Z., J.F. and S.L.; methodology, Y.W., C.H. and H.D.; validation, Y.W., J.Z. (Junli Zhang) and M.S.; formal analysis, Y.W., C.H., J.Z. (Junli Zhang), X.W. and B.Z.; investigation, Y.W., M.S., R.L., Z.Y. and J.L.; resources, J.Z. (Jun Zheng) and X.Z.; data curation, Y.W. and C.H.; writing—original draft preparation, Y.W.; writing—review and editing, S.L., X.Z., J.Z. (Jun Zheng), K.Y. and J.F.; visualization, X.Z.; supervision, J.Z. (Jun Zheng) and X.Z.; project administration, J.Z. (Jun Zheng); funding acquisition, J.Z. (Jun Zheng). All authors have read and agreed to the published version of the manuscript.

Funding

This research was supported by the National Natural Science Foundation of China (grant no. 32072079) and by the Agricultural Science and Technology Innovation Program of CAAS.

Institutional Review Board Statement

Not applicable.

Informed Consent Statement

Not applicable.

Data Availability Statement

The RNA-seq data in this study were deposited in the NCBI sequence read archive (SRA) with the accession number PRJNA773210. The results of transcript quantification (raw reads count) and metabolites are provided as Supplementary Materials.

Conflicts of Interest

The authors declare that they have no known competing financial interest or personal relationships that could have appeared to influence the work reported in this paper.

References

  1. Fang, J.; Chai, C.; Qian, Q.; Li, C.; Tang, J.; Sun, L.; Huang, Z.; Guo, X.; Sun, C.; Liu, M.; et al. Mutations of genes in synthesis of the carotenoid precursors of ABA lead to pre-harvest sprouting and photo-oxidation in rice. Plant J. 2008, 54, 177–189. [Google Scholar] [CrossRef] [Green Version]
  2. Du, L.; Xu, F.; Fang, J.; Gao, S.; Tang, J.; Fang, S.; Wang, H.; Tong, H.; Zhang, F.; Chu, J.; et al. Endosperm sugar accumulation caused by mutation of PHS8/ISA1 leads to pre-harvest sprouting in rice. Plant J. 2018, 95, 545–556. [Google Scholar] [CrossRef] [Green Version]
  3. Burbidge, A.; Grieve, T.M.; Jackson, A.; Thompson, A.; McCarty, D.R.; Taylor, I.B. Characterization of the ABA-deficient tomato mutant notabilis and its relationship with maize Vp14. Plant J. 1999, 17, 427–431. [Google Scholar] [CrossRef] [PubMed]
  4. Sagi, M.; Scazzocchio, C.; Fluhr, R. The absence of molybdenum cofactor sulfuration is the primary cause of the flacca phenotype in tomato plants. Plant J. 2002, 31, 305–317. [Google Scholar] [CrossRef]
  5. Harrison, E.; Burbidge, A.; Okyere, J.P.; Thompson, A.J.; Taylor, I.B. Identification of the tomato ABA-deficient mutant sitiens as a member of the ABA-aldehyde oxidase gene family using genetic and genomic analysis. Plant Growth Regul. 2011, 64, 301–309. [Google Scholar] [CrossRef]
  6. Robertson, D.S. The genetics of vivipary in maize. Genetics 1955, 40, 745–760. [Google Scholar] [CrossRef] [PubMed]
  7. McCarty, D.R.; Hattori, T.; Carson, C.B.; Vasil, V.; Lazar, M.; Vasil, I.K. The Viviparous-1 developmental gene of maize encodes a novel transcriptional activator. Cell 1991, 66, 895–905. [Google Scholar] [CrossRef]
  8. Hable, W.E.; Oishi, K.K.; Schumaker, K.S. Viviparous-5 encodes phytoene desaturase, an enzyme essential for abscisic acid (ABA) accumulation and seed development in maize. Mol. Gen. Genet. 1998, 257, 167–176. [Google Scholar] [CrossRef]
  9. Singh, M.; Lewis, P.E.; Hardeman, K.; Bai, L.; Rose, J.K.C.; Mazourek, M.; Chomet, P.; Brutnell, T.P. Activator mutagenesis of the Pink scutellum1/viviparous7 locus of maize. Plant Cell 2003, 15, 874–884. [Google Scholar] [CrossRef] [PubMed] [Green Version]
  10. Chen, Y.; Li, J.; Fan, K.; Du, Y.; Ren, Z.; Xu, J.; Zheng, J.; Liu, Y.; Fu, J.; Ren, D.; et al. Mutations in the maize zeta-carotene desaturase gene lead to viviparous kernel. PLoS ONE 2017, 12, e0174270. [Google Scholar] [CrossRef]
  11. Porch, T.G.; Tseung, C.W.; Schmelz, E.A.; Mark Settles, A. The maize Viviparous10/Viviparous13 locus encodes the Cnx1 gene required for molybdenum cofactor biosynthesis. Plant J. 2006, 45, 250–263. [Google Scholar] [CrossRef] [PubMed]
  12. Schwartz, S.H.; Tan, B.C.; Gage, D.A.; Zeevaart, J.A.D.; McCarty, D.R. Specific oxidative cleavage of carotenoids by VP14 of maize. Science 1997, 276, 1872–1874. [Google Scholar] [CrossRef] [Green Version]
  13. Suzuki, M.; Mark Settles, A.; Tseung, C.W.; Li, Q.B.; Latshaw, S.; Wu, S.; Porch, T.G.; Schmelz, E.A.; James, M.G.; McCarty, D.R. The maize viviparous15 locus encodes the molybdopterin synthase small subunit. Plant J. 2006, 45, 264–274. [Google Scholar] [CrossRef]
  14. Li, F.; Murillo, C.; Wurtzel, E.T. Maize Y9 encodes a product essential for 15-cis-ζ-carotene isomerization. Plant Physiol. 2007, 144, 1181–1189. [Google Scholar] [CrossRef] [PubMed] [Green Version]
  15. Chen, K.; Li, G.J.; Bressan, R.A.; Song, C.P.; Zhu, J.K.; Zhao, Y. Abscisic acid dynamics, signaling, and functions in plants. J. Integr. Plant Biol. 2020, 62, 25–54. [Google Scholar] [CrossRef] [Green Version]
  16. Tuan, P.A.; Kumar, R.; Rehal, P.K.; Toora, P.K.; Ayele, B.T. Molecular mechanisms underlying abscisic acid/gibberellin balance in the control of seed dormancy and germination in cereals. Front. Plant Sci. 2018, 9, 668. [Google Scholar] [CrossRef] [PubMed] [Green Version]
  17. Kucera, B.; Cohn, M.A.; Leubner-Metzger, G. Plant hormone interactions during seed dormancy release and germination. Seed Sci. Res. 2005, 15, 281–307. [Google Scholar] [CrossRef]
  18. Finkelstein, R.; Reeves, W.; Ariizumi, T.; Steber, C. Molecular aspects of seed dormancy. Annu. Rev. Plant Biol. 2008, 59, 387–415. [Google Scholar] [CrossRef] [Green Version]
  19. McCarty, D.R.; Carson, C.B.; Stinard, P.S.; Robertson, D.S. Molecular Analysis of viviparous-1: An Abscisic Acid-Insensitive Mutant of Maize. Plant Cell 1989, 1, 523. [Google Scholar] [CrossRef]
  20. Suzuki, M.; Kao, C.-Y.; Cocciolone, S.; McCarty, D.R. Maize VP1 complements Arabidopsis abi3 and confers a novel ABA/auxin interaction in roots. Plant J. 2001, 28, 409–418. [Google Scholar] [CrossRef]
  21. Tan, B.-C.; Cline, K.; McCarty, D.R. Localization and targeting of the VP14 epoxy-carotenoid dioxygenase to chloroplast membranes. Plant J. 2001, 27, 373–382. [Google Scholar] [CrossRef] [Green Version]
  22. Schwarz, G.; Mendel, R.R. Molybdenum cofactor biosynthesis and molybdenum enzymes. Annu. Rev. Plant Biol. 2006, 57, 623–647. [Google Scholar] [CrossRef]
  23. Nakai, Y.; Harada, A.; Hashiguchi, Y.; Nakai, M.; Hayashi, H. Arabidopsis molybdopterin biosynthesis protein Cnx5 collaborates with the ubiquitin-like protein urm11 in the thio-modification of tRNA. J. Biol. Chem. 2012, 287, 30874–30884. [Google Scholar] [CrossRef] [Green Version]
  24. Matthews, P.D.; Luo, R.B.; Wurtzel, E.T. Maize phytoene desaturase and ζ-carotene desaturase catalyse a poly-Z desaturation pathway: Implications for genetic engineering of carotenoid content among cereal crops. J. Exp. Bot. 2003, 54, 2215–2230. [Google Scholar] [CrossRef] [PubMed] [Green Version]
  25. Liu, S.; Yeh, C.T.; Tang, H.M.; Nettleton, D.; Schnable, P.S. Gene mapping via bulked segregant RNA-Seq (BSR-Seq). PLoS ONE 2012, 7, e36406. [Google Scholar] [CrossRef] [Green Version]
  26. Suzuki, M.; Latshaw, S.; Sato, Y.; Settles, A.M.; Koch, K.E.; Hannah, L.C.; Kojima, M.; Sakakibara, H.; McCarty, D.R. The maize viviparous8 locus, encoding a putative ALTERED MERISTEM PROGRAM1-like peptidase, regulates abscisic acid accumulation and coordinates embryo and endosperm development. Plant Physiol. 2008, 146, 1193–1206. [Google Scholar] [CrossRef] [Green Version]
  27. Choi, M.G.; Kim, E.J.; Song, J.Y.; Choi, S.B.; Cho, S.W.; Park, C.S.; Kang, C.S.; Park, Y.-Il. Peptide transporter2 (PTR2) enhances water uptake during early seed germination in Arabidopsis thaliana. Plant Mol. Biol. 2020, 102, 615–624. [Google Scholar] [CrossRef] [Green Version]
  28. Rolland, F.; Baena-Gonzalez, E.; Sheen, J. Sugar sensing and signaling in plants: Conserved and novel mechanisms. Annu. Rev. Plant Biol. 2006, 57, 675–709. [Google Scholar] [CrossRef] [PubMed] [Green Version]
  29. Aoki, N.; Hirose, T.; Takahashi, S.; Ono, K.; Ishimaru, K.; Ohsugi, R. Molecular cloning and expression analysis of a gene for a sucrose transporter in maize (Zea mays L.). Plant cell Physiol. 1999, 40, 1072–1078. [Google Scholar] [CrossRef] [Green Version]
  30. Scofield, G.N.; Hirose, T.; Gaudron, J.A.; Upadhyaya, N.M.; Ohsugi, R.; Furbank, R.T. Antisense suppression of the rice sucrose transporter gene, OsSUT1, leads to impaired grain filling and germination but does not affect photosynthesis. Funct. Plant Biol. 2002, 29, 815–826. [Google Scholar] [CrossRef] [PubMed]
  31. Dubos, C.; Stracke, R.; Grotewold, E.; Weisshaar, B.; Martin, C.; Lepiniec, L. MYB transcription factors in Arabidopsis. Trends Plant Sci. 2010, 15, 573–581. [Google Scholar] [CrossRef]
  32. Jakoby, M.; Weisshaar, B.; Dröge-Laser, W.; Vicente-Carbajosa, J.; Tiedemann, J.; Kroj, T.; Parcy, F. bZIP transcription factors in Arabidopsis. Trends Plant Sci. 2002, 7, 106–111. [Google Scholar] [CrossRef]
  33. Valdés, A.E.; Övernäs, E.; Johansson, H.; Rada-Iglesias, A.; Engström, P. The homeodomain-leucine zipper (HD-Zip) class I transcription factors ATHB7 and ATHB12 modulate abscisic acid signalling by regulating protein phosphatase 2C and abscisic acid receptor gene activities. Plant Mol. Biol. 2012, 80, 405–418. [Google Scholar] [CrossRef] [PubMed]
  34. Shin, H.Y.; Nam, K.H. RAV1 negatively regulates seed development by directly repressing MINI3 and IKU2 in Arabidopsis. Mol. Cells 2018, 41, 1072–1080. [Google Scholar] [CrossRef] [PubMed]
  35. Nambara, E.; Marion-Poll, A. Abscisic acid biosynthesis and catabolism. Annu. Rev. Plant Biol. 2005, 56, 165–185. [Google Scholar] [CrossRef] [PubMed] [Green Version]
  36. Ali, F.; Qanmber, G.; Li, F.; Wang, Z. Updated role of ABA in seed maturation, dormancy, and germination. J. Adv. Res. 2021. [Google Scholar] [CrossRef]
  37. Weiner, J.J.; Peterson, F.C.; Volkman, B.F.; Cutler, S.R. Structural and functional insights into core ABA signaling. Curr. Opin. Plant Biol. 2010, 13, 495–502. [Google Scholar] [CrossRef] [Green Version]
  38. Watanabe, S.; Matsumoto, M.; Hakomori, Y.; Takagi, H.; Shimada, H.; Sakamoto, A. The purine metabolite allantoin enhances abiotic stress tolerance through synergistic activation of abscisic acid metabolism. Plant, Cell Environ. 2014, 37, 1022–1036. [Google Scholar] [CrossRef] [Green Version]
  39. Schmidt, R.; Stransky, H.; Koch, W. The amino acid permease AAP8 is important for early seed development in Arabidopsis thaliana. Planta 2007, 226, 805–813. [Google Scholar] [CrossRef]
  40. Tsay, Y.F.; Chiu, C.C.; Tsai, C.B.; Ho, C.H.; Hsu, P.K. Nitrate transporters and peptide transporters. FEBS Lett. 2007, 581, 2290–2300. [Google Scholar] [CrossRef] [Green Version]
  41. Stacey, G.; Koh, S.; Granger, C.; Becker, J.M. Peptide transport in plants. Trends Plant Sci. 2002, 7, 257–263. [Google Scholar] [CrossRef]
  42. Fait, A.; Angelovici, R.; Less, H.; Ohad, I.; Urbanczyk-Wochniak, E.; Fernie, A.R.; Galili, G. Arabidopsis seed development and germination is associated with temporally distinct metabolic switches. Plant Physiol. 2006, 142, 839–854. [Google Scholar] [CrossRef] [PubMed] [Green Version]
  43. Glevarec, G.; Bouton, S.; Jaspard, E.; Riou, M.T.; Cliquet, J.B.; Suzuki, A.; Limami, A.M. Respective roles of the glutamine synthetase/glutamate synthase cycle and glutamate dehydrogenase in ammonium and amino acid metabolism during germination and post-germinative growth in the model legume Medicago truncatula. Planta 2004, 219, 286–297. [Google Scholar] [CrossRef] [PubMed]
  44. Han, C.; Yang, P. Studies on the molecular mechanisms of seed germination. Proteomics 2015, 15, 1671–1679. [Google Scholar] [CrossRef]
  45. Galili, G.; Avin-Wittenberg, T.; Angelovici, R.; Fernie, A.R. The role of photosynthesis and amino acid metabolism in the energy status during seed development. Front. Plant Sci. 2014, 5, 447. [Google Scholar] [CrossRef]
  46. Tnani, H.; López-Ribera, I.; García-Muniz, N.; Vicient, C.M. ZmPTR1, a maize peptide transporter expressed in the epithelial cells of the scutellum during germination. Plant Sci. 2013, 207, 140–147. [Google Scholar] [CrossRef]
  47. Miranda, M.; Borisjuk, L.; Tewes, A.; Dietrich, D.; Rentsch, D.; Weber, H.; Wobus, U. Peptide and amino acid transporters are differentially regulated during seed development and germination in faba bean. Plant Physiol. 2003, 132, 1950–1960. [Google Scholar] [CrossRef] [PubMed] [Green Version]
  48. Borghi, L.; Kang, J.; Ko, D.; Lee, Y.; Martinoia, E. The role of ABCG-type ABC transporters in phytohormone transport. Biochem. Soc. Trans. 2015, 43, 924–930. [Google Scholar] [CrossRef]
  49. Do, T.H.T.; Martinoia, E.; Lee, Y. Functions of ABC transporters in plant growth and development. Curr. Opin. Plant Biol. 2018, 41, 32–38. [Google Scholar] [CrossRef]
  50. Pawela, A.; Banasiak, J.; Biała, W.; Martinoia, E.; Jasiński, M. MtABCG20 is an ABA exporter influencing root morphology and seed germination of Medicago truncatula. Plant J. 2019, 98, 511–523. [Google Scholar] [CrossRef] [Green Version]
  51. Hirose, T.; Imaizumi, N.; Scofield, G.N.; Furbank, R.T.; Ohsugi, R. cDNA cloning and tissue specific expression of a gene for sucrose transporter from rice (Oryza sativa L.). Plant Cell Physiol. 1997, 38, 1389–1396. [Google Scholar] [CrossRef] [PubMed] [Green Version]
  52. Matsukura, C.; Saitoh, T.; Hirose, T.; Ohsugi, R.; Perata, P.; Yamaguchi, J. Sugar uptake and transport in rice embryo. Expression of companion cell-specific sucrose transporter (OsSUT1) induced by sugar and light. Plant Physiol. 2000, 124, 85–93. [Google Scholar] [CrossRef] [PubMed] [Green Version]
  53. Himmelbach, A.; Hoffmann, T.; Leube, M.; Höhener, B.; Grill, E. Homeodomain protein ATHB6 is a target of the protein phosphatase ABI1 and regulates hormone responses in Arabidopsis. EMBO J. 2002, 21, 3029–3038. [Google Scholar] [CrossRef] [PubMed] [Green Version]
  54. Elhiti, M.; Stasolla, C. Structure and function of homodomain-leucine zipper (HD-Zip) proteins. Plant Signal. Behav. 2009, 4, 86–88. [Google Scholar] [CrossRef] [Green Version]
  55. Feng, C.Z.; Chen, Y.; Wang, C.; Kong, Y.H.; Wu, W.H.; Chen, Y.F. Arabidopsis RAV1 transcription factor, phosphorylated by SnRK2 kinases, regulates the expression of ABI3, ABI4, and ABI5 during seed germination and early seedling development. Plant J. 2014, 80, 654–668. [Google Scholar] [CrossRef] [PubMed]
  56. Wu, Q.; Bai, X.; Wu, X.; Xiang, D.; Wan, Y.; Luo, Y.; Shi, X.; Li, Q.; Zhao, J.; Qin, P.; et al. Transcriptome profiling identifies transcription factors and key homologs involved in seed dormancy and germination regulation of Chenopodium quinoa. Plant Physiol. Biochem. 2020, 151, 443–456. [Google Scholar] [CrossRef]
  57. Okamoto, M.; Tatematsu, K.; Matsui, A.; Morosawa, T.; Ishida, J.; Tanaka, M.; Endo, T.A.; Mochizuki, Y.; Toyoda, T.; Kamiya, Y.; et al. Genome-wide analysis of endogenous abscisic acid-mediated transcription in dry and imbibed seeds of Arabidopsis using tiling arrays. Plant J. 2010, 62, 39–51. [Google Scholar] [CrossRef] [PubMed]
  58. Koornneef, M.; Bentsink, L.; Hilhorst, H. Seed dormancy and germination. Curr. Opin. Plant Biol. 2002, 5, 33–36. [Google Scholar] [CrossRef] [Green Version]
  59. Li, F.; Vallabhaneni, R.; Yu, J.; Rocheford, T.; Wurtzel, E.T. The maize phytoene synthase gene family: Overlapping roles for carotenogenesis in endosperm, photomorphogenesis, and thermal stress tolerance. Plant Physiol. 2008, 147, 1334–1346. [Google Scholar] [CrossRef] [PubMed] [Green Version]
  60. Lefebvre, V.; North, H.; Frey, A.; Sotta, B.; Seo, M.; Okamoto, M.; Nambara, E.; Marion-Poll, A. Functional analysis of Arabidopsis NCED6 and NCED9 genes indicates that ABA synthesized in the endosperm is involved in the induction of seed dormancy. Plant J. 2006, 45, 309–319. [Google Scholar] [CrossRef] [PubMed]
  61. Fujii, H.; Chinnusamy, V.; Rodrigues, A.; Rubio, S.; Antoni, R.; Park, S.Y.; Cutler, S.R.; Sheen, J.; Rodriguez, P.L.; Zhu, J.K. In vitro reconstitution of an abscisic acid signalling pathway. Nature 2009, 462, 660–664. [Google Scholar] [CrossRef] [Green Version]
  62. Parcy, F.; Valon, C.; Raynal, M.; Gaubier-Comella, P.; Delseny, M.; Giraudat, J. Regulation of gene expression programs during Arabidopsis seed development: Roles of the ABI3 locus and of endogenous abscisic acid. Plant Cell 1994, 6, 1567–1582. [Google Scholar] [CrossRef] [PubMed] [Green Version]
  63. Suzuki, M.; Ketterling, M.G.; Li, Q.B.; McCarty, D.R. Viviparous1 alters global gene expression patterns through regulation of abscisic acid signaling. Plant Physiol. 2003, 132, 1664–1677. [Google Scholar] [CrossRef] [PubMed] [Green Version]
  64. Huang, T.; Qu, B.; Li, H.P.; Zuo, D.Y.; Zhao, Z.X.; Liao, Y.C. A maize viviparous 1 gene increases seed dormancy and preharvest sprouting tolerance in transgenic wheat. J. Cereal Sci. 2012, 55, 166–173. [Google Scholar] [CrossRef]
  65. Kim, W.; Lee, Y.; Park, J.; Lee, N.; Choi, G. HONSU, a protein phosphatase 2C, regulates seed dormancy by inhibiting ABA signaling in Arabidopsis. Plant Cell Physiol. 2013, 54, 555–572. [Google Scholar] [CrossRef] [PubMed] [Green Version]
  66. Seo, M.; Nambara, E.; Choi, G.; Yamaguchi, S. Interaction of light and hormone signals in germinating seeds. Plant Mol. Biol. 2009, 69, 463–472. [Google Scholar] [CrossRef]
  67. Andrews, S. FastQC: A Quality Control Tool for High Throughput Sequence Data. 2010. Available online: http://www.bioinformatics.babraham.ac.uk/projects/fastqc (accessed on 15 August 2021).
  68. Bolger, A.M.; Lohse, M.; Usadel, B. Trimmomatic: A flexible trimmer for Illumina sequence data. Bioinformatics 2014, 30, 2114–2120. [Google Scholar] [CrossRef] [Green Version]
  69. Dobin, A.; Davis, C.A.; Schlesinger, F.; Drenkow, J.; Zaleski, C.; Jha, S.; Batut, P.; Chaisson, M.; Gingeras, T.R. STAR: Ultrafast universal RNA-seq aligner. Bioinformatics 2013, 29, 15–21. [Google Scholar] [CrossRef]
  70. Tian, T.; Liu, Y.; Yan, H.; You, Q.; Yi, X.; Du, Z.; Xu, W.; Su, Z. AgriGO v2.0: A GO analysis toolkit for the agricultural community, 2017 update. Nucleic Acids Res. 2017, 45, W122–W129. [Google Scholar] [CrossRef]
  71. Langfelder, P.; Horvath, S. WGCNA: An R package for weighted correlation network analysis. BMC Bioinform. 2008, 9, 559. [Google Scholar] [CrossRef] [Green Version]
Figure 1. Mapping of each of seven vivipary genes via BSR-Seq. (A) Viviparous and normal seeds on heterozygous ears at 60 days after self-pollination of seven viviparous maize mutants vp1, vp2, vp5, vp8, vp9, vp-wl2, and vp15. (B) The ABA biosynthesis pathway in plants. The red font indicates the position of the mutants in the pathway. (C) BSR-Seq results for each viviparous mutant. The physical position of each SNP marker was plotted versus the probability of each SNP marker being in complete linkage disequilibrium with the causal gene (y-axis). The interval length of the x-axis of each plot was determined by corresponding chromosome length. SNP markers on adjacent chromosomes are distinguished by blue and green dots.
Plants 10 02437 g001
Figure 2. Expression pattern of vivipary genes. (A) Number of DEGs in seven comparison groups. Red bars represent upregulated genes in mutants, and blue bars represent downregulated genes in mutants. The DEGs were obtained by comparing the mutant to wild-type (|log2 (fold change)| ≥ 1 and FDR < 0.05). (B) The reported viviparous genes were significantly expressed in at least one mutant compared with the wild-type. The data are indicated by log2 (fold change) of mutants versus wild-types (* p-value < 0.05, ** p-value < 0.1). (C) Tissue-specific sample clusters based on WGCNA analysis: 739 B73 RNA-Seq samples were used to construct the network. Each individual node represented a sample and edges between nodes were determined by the connectivity strength of two samples. “VP1” stands for the vp1 mutant sample, and “VP & embryo” stands for other vivipary samples except vp1 and the embryo samples in the 739 additional publicly available data. The different colors represent different modules of B73 RNA-Seq samples. The majority tissues (>90%) of samples in each module were marked on the corresponding module. (DK) Expression profile of eight different viviparous genes vp1, vp5, vp7, vp8, vp9 (vp-wl2), vp14, vp15, and y9 in all samples. The node and edge colors from yellow to red indicate the gene expression levels from low to high. Transparent nodes and edges indicate that the gene is not expressed in this sample. The data was showed by the log2 (normalized Read Counts (norm RC)) value.
Plants 10 02437 g002
Figure 3. Differentially expression genes (DEGs) between mutants and wild-types of seven vivipary mutants. (A) Genes were upregulated or downregulated in the seven comparisons of vivipary mutants versus wild-types. The level of upregulation (red) and downregulation (blue) genes in the vivipary mutants was determined and plotted. The X-axis represents the number of comparisons, and the Y-scale represents the level of genes. From top to bottom, the number of upregulated and downregulated genes was used to facilitate sorting. (B,C) Heatmap analysis of transporters (B) and TFs (C) showing upregulation in seven vivipary mutants. The DEGs were obtained by comparing the mutant to WT (|log2fold change| ≥ 1 and FDR < 0.05).
Plants 10 02437 g003
Figure 4. Vivipary mutants affected the biosynthesis and signaling of ABA and GA. (A) The expression profiles of ABA biosynthesis-related genes, indicated by log2 (fold change) of gene expression in mutants versus wild types, are color-coded. Red boxes represent upregulated genes, and blue boxes represent downregulated genes. (B) The relative ABA content of viviparous mutant and wild-type seeds at 30 DAP. Three biological replicates of each sample were conducted. (C) The expression profiles of GA biosynthesis-related genes, indicated by log2 (fold change) of gene expression in mutants versus wild types, are color-coded. Red boxes represent upregulated genes, and blue boxes represent downregulated genes. (D) The expression profiles of ABA signaling-related genes, indicated by log2 (fold change) of gene expression in mutants versus wild types, are color-coded. Red boxes represent upregulated genes, and blue boxes represent downregulated genes. (E) The pathway of seven vivipary mutants regulated precocious seed germination. Green lines represent the pathway of vp1, vp2, vp5, vp9/wl2, and vp15, and red lines represent the pathway of vp8.
Plants 10 02437 g004
Figure 5. Metabolic profiling of seven vivipary mutants. (A) The principal component analysis (PCA) plot demonstrated a distinct separation of seven mutants. (B) Different accumulated metabolites (DAMs) in seven comparison groups. Red bars represent increased numbers and blue bars represent decreased numbers of metabolites in the mutants. (C) Heatmap of metabolites identified to be significantly discriminatory in the seven comparisons of vivipary mutants versus wild-types. Black boxes represent the specific metabolites in each mutant. (D) KEGG analysis of the specific metabolites in seven mutants. Red dots represent amino acid metabolic pathways.
Plants 10 02437 g005
Publisher’s Note: MDPI stays neutral with regard to jurisdictional claims in published maps and institutional affiliations.

