
A GBS-Based GWAS Analysis of Leaf and Stripe Rust Resistance in Diverse Pre-Breeding Germplasm of Bread Wheat (Triticum aestivum L.)
 , ,
, ,
Abstract
:
1. Introduction
2. Results
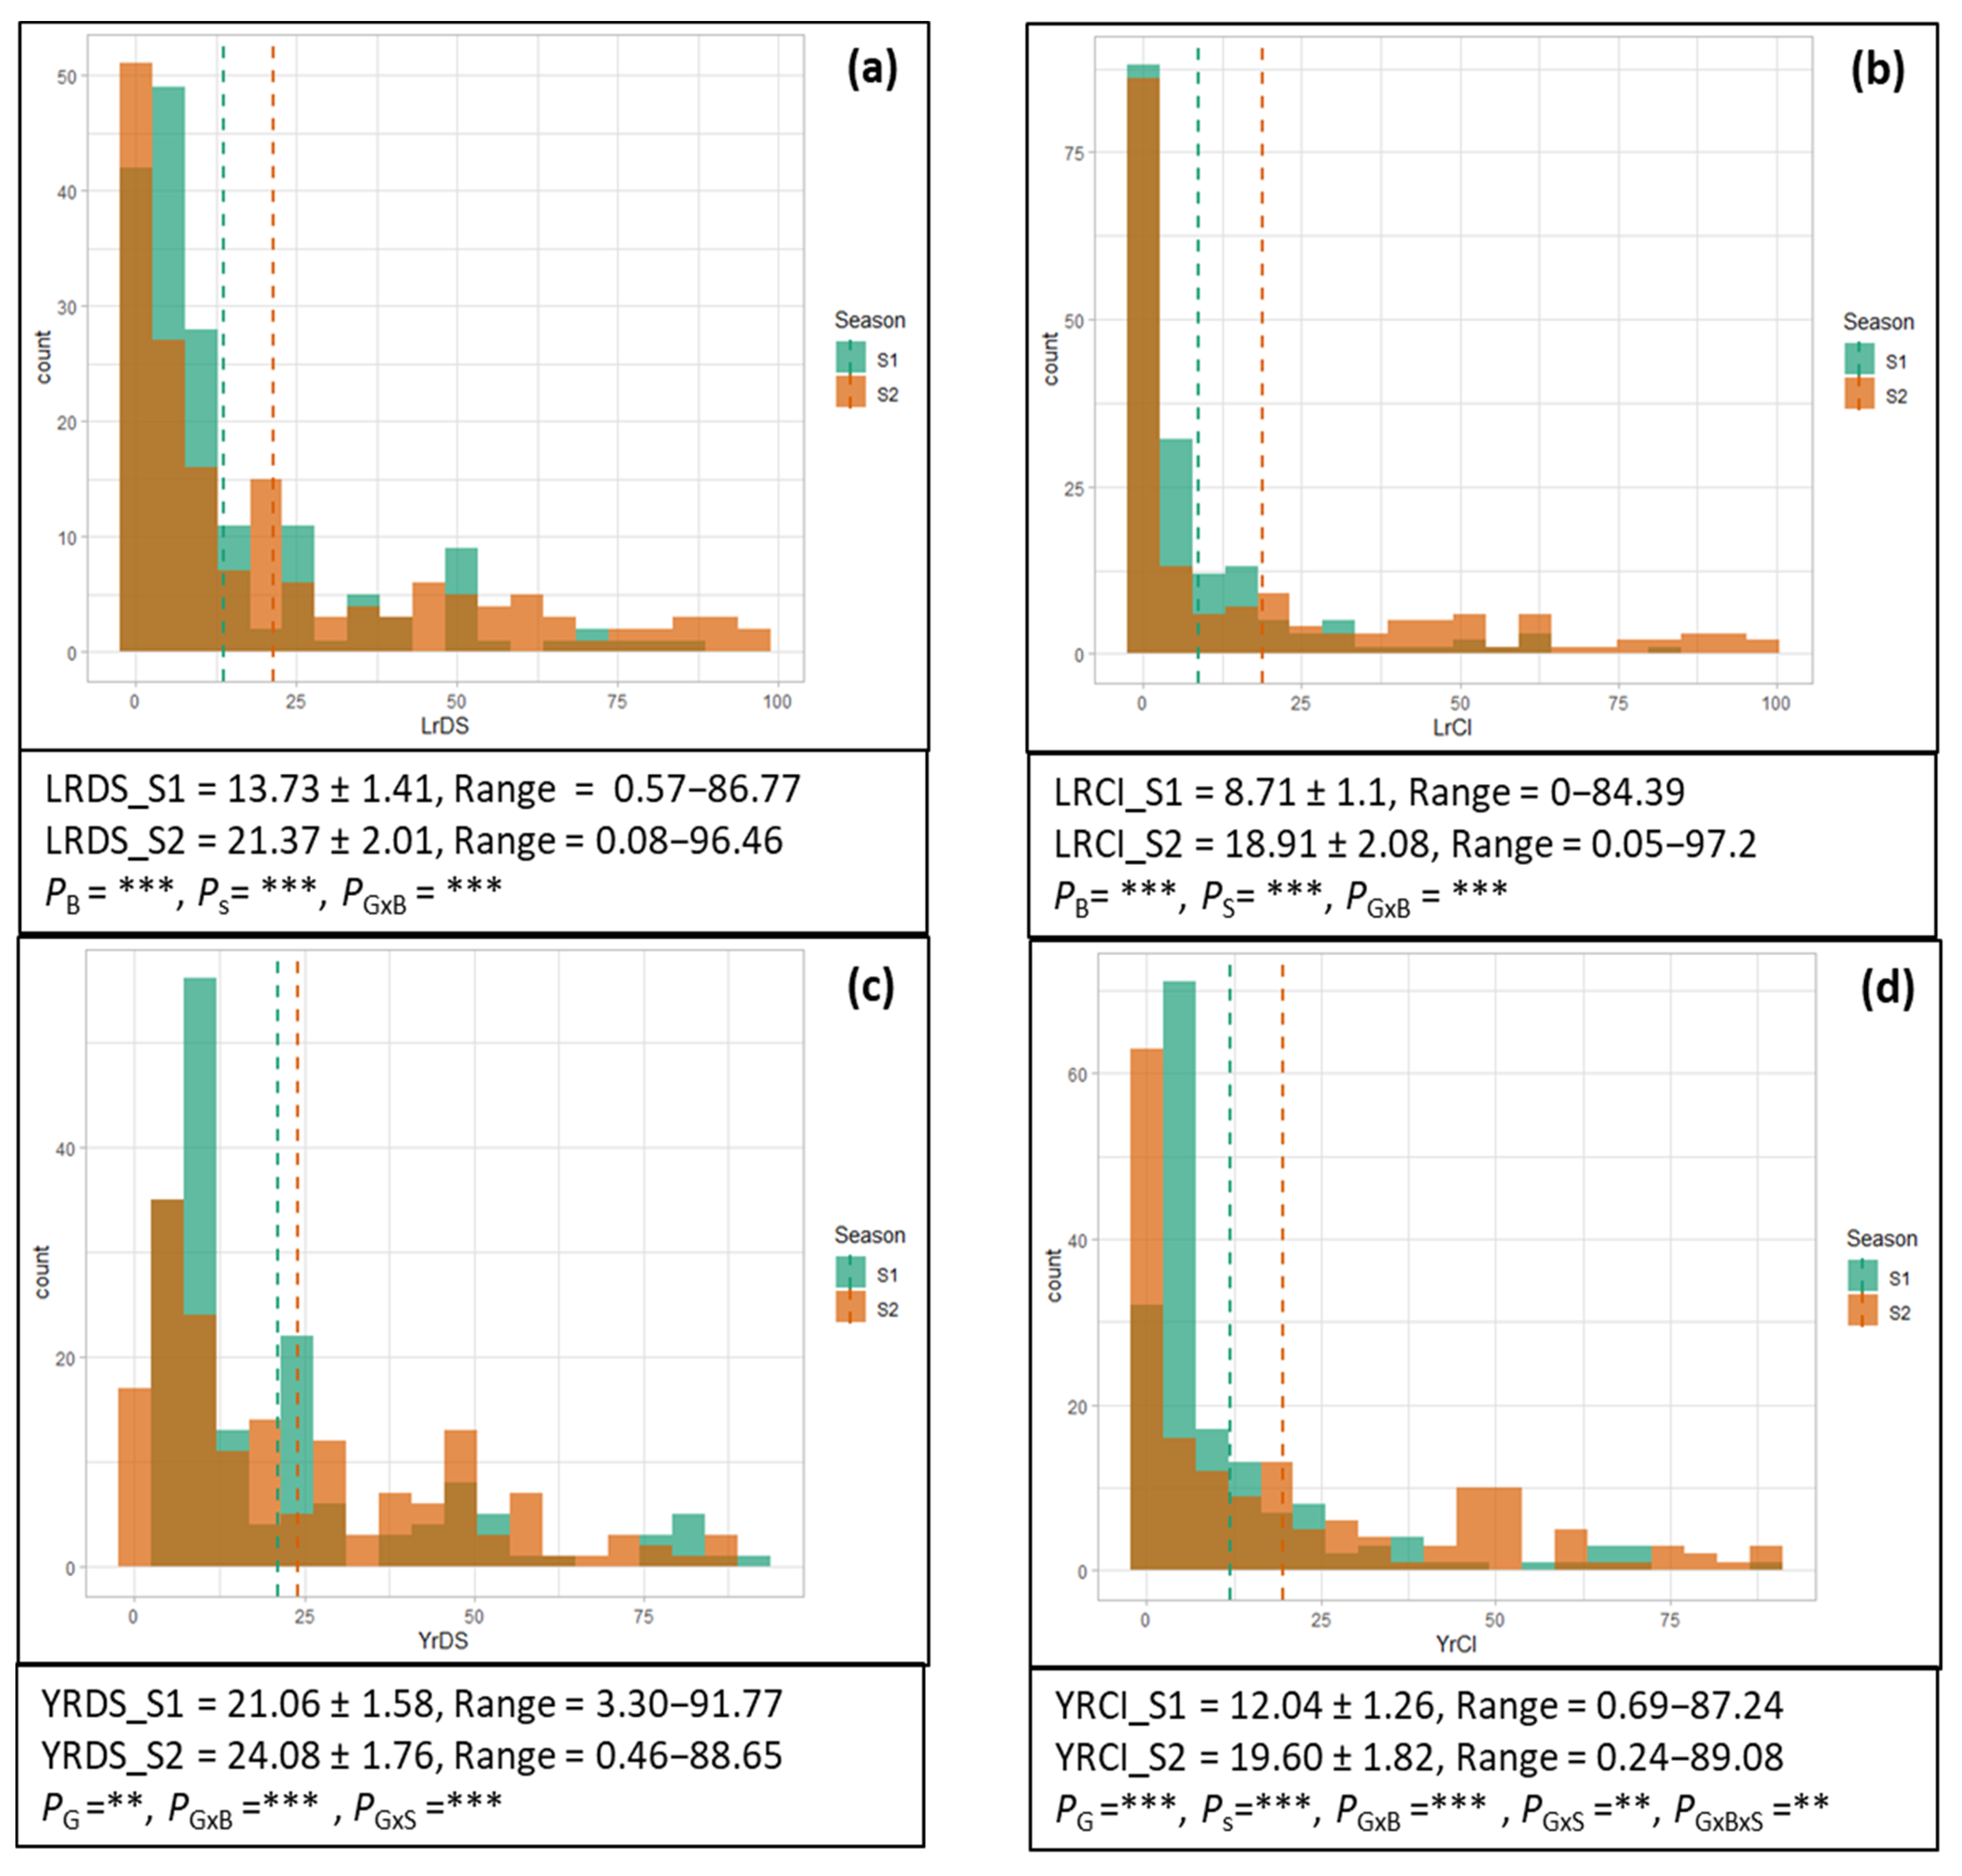
2.1. Phenotypic Characterization
2.1.1. Leaf Rust
2.1.2. Yellow Rust
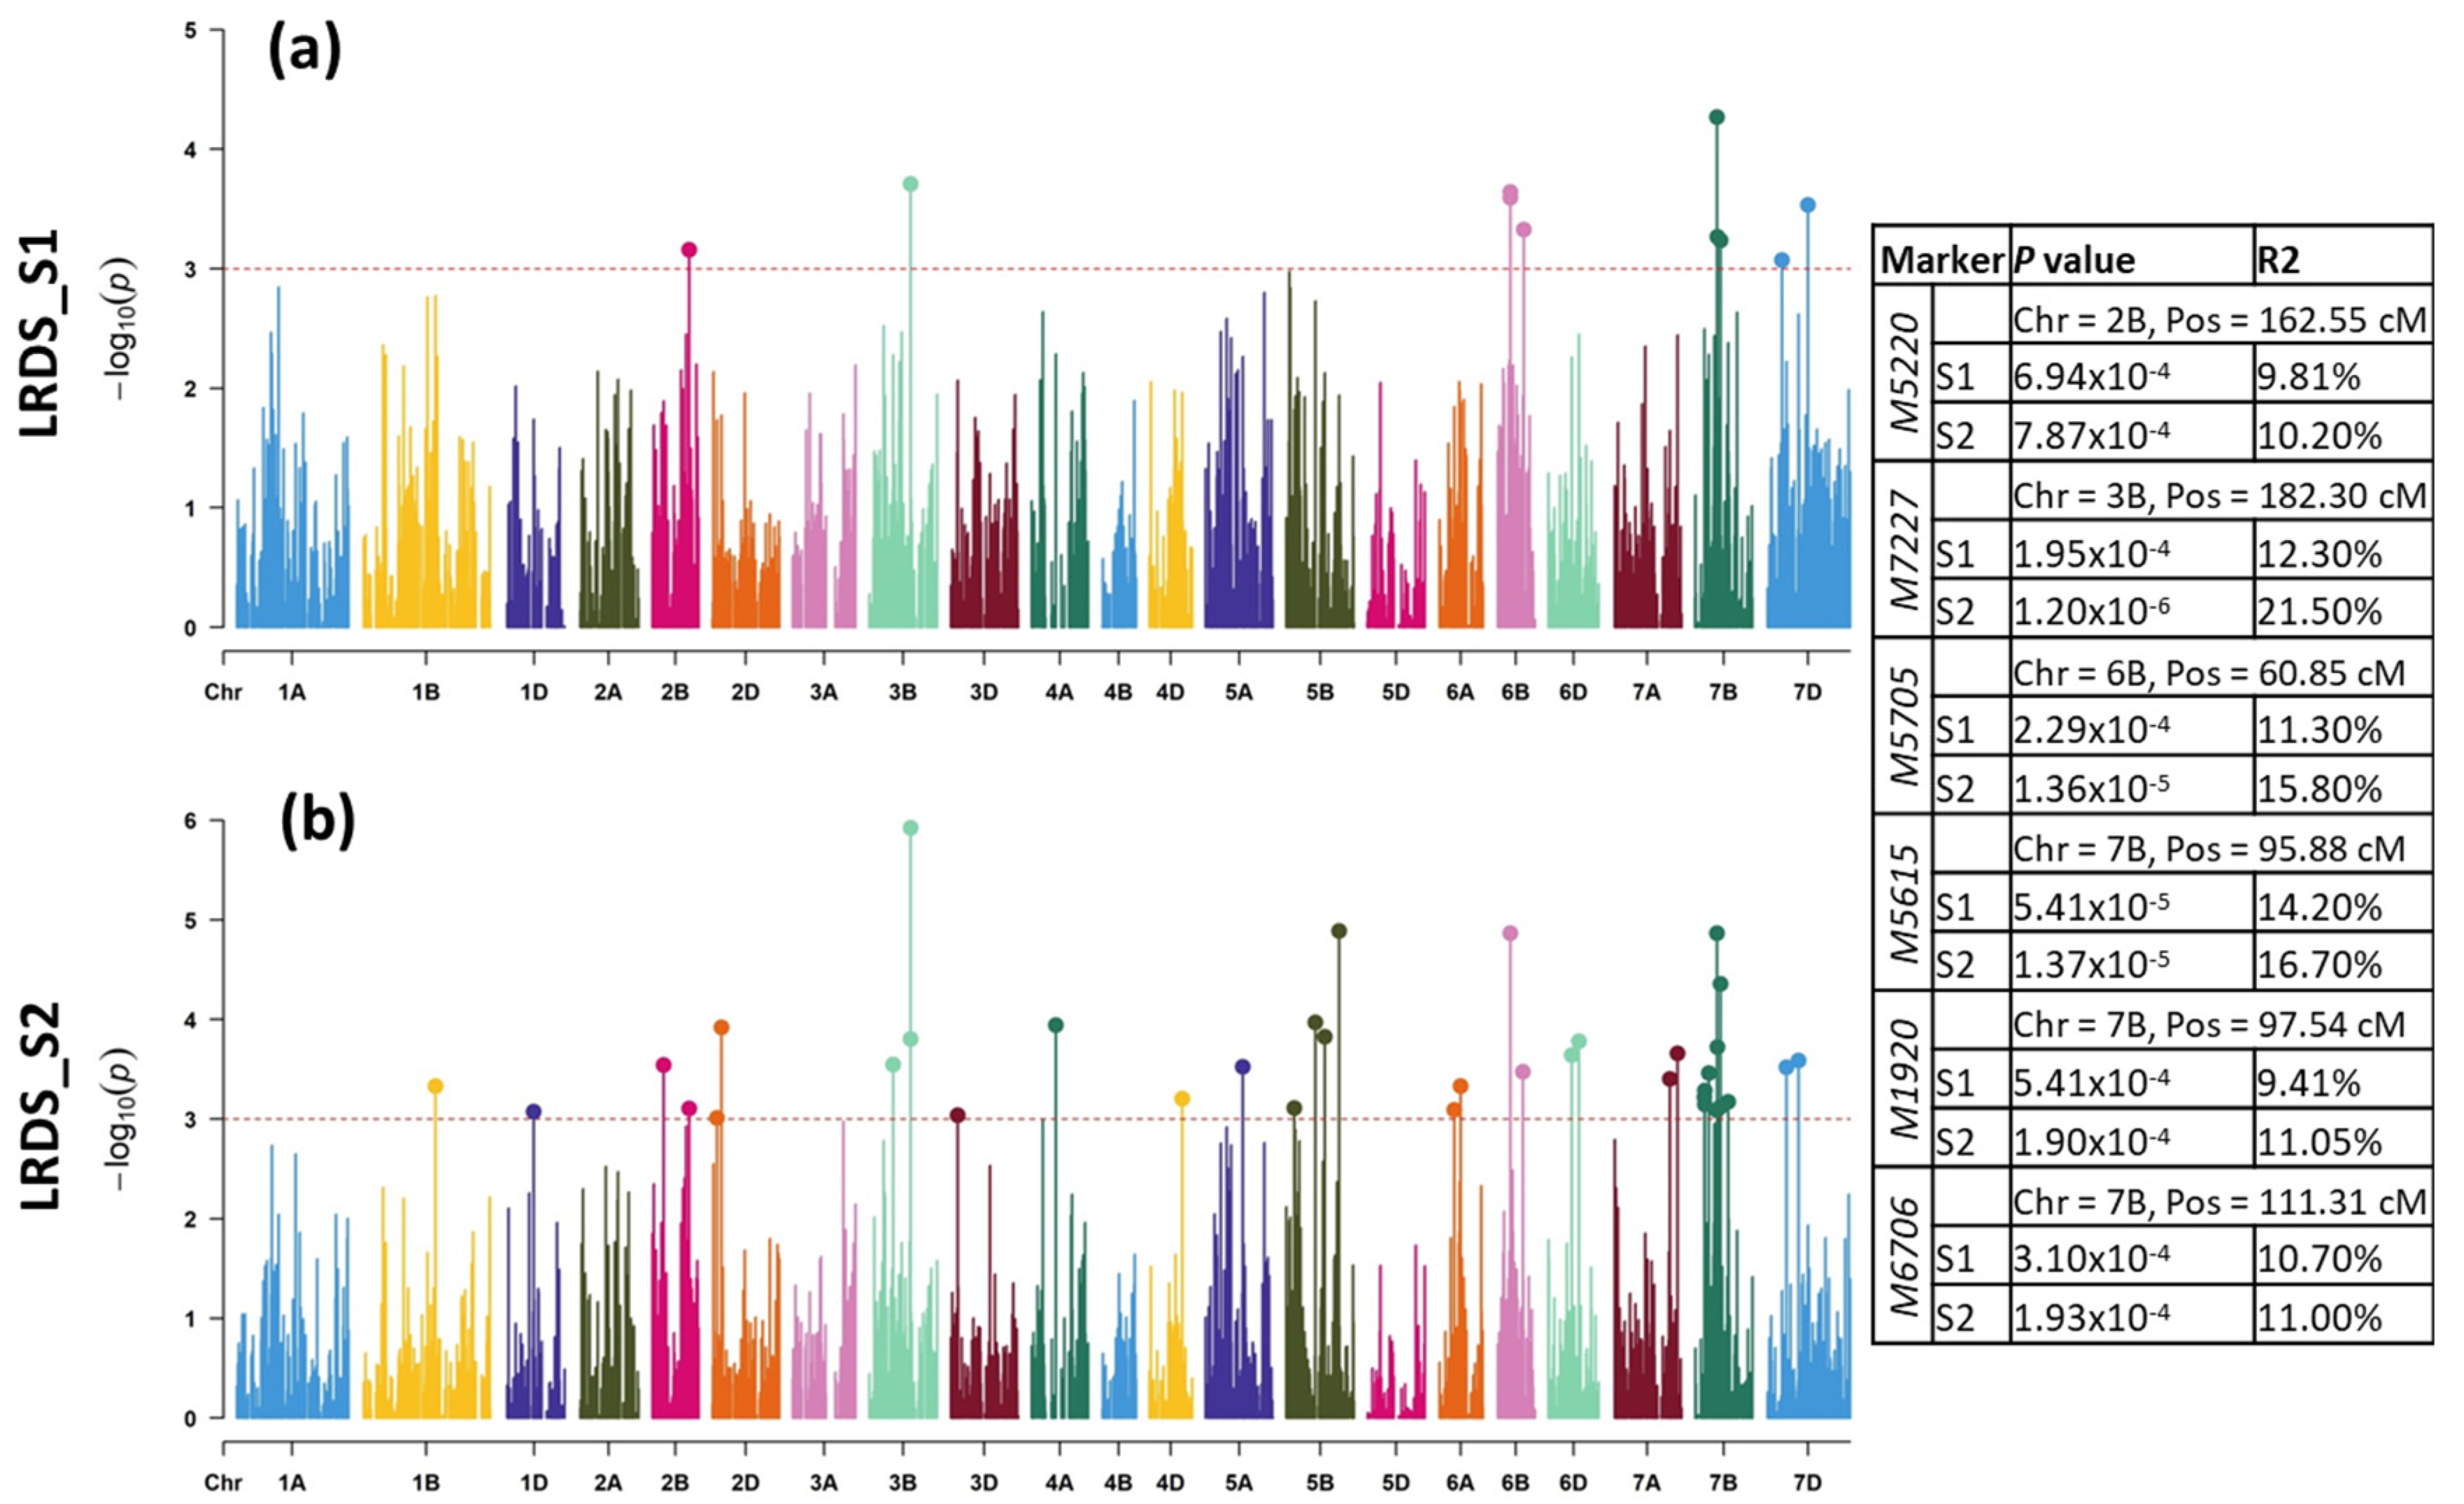
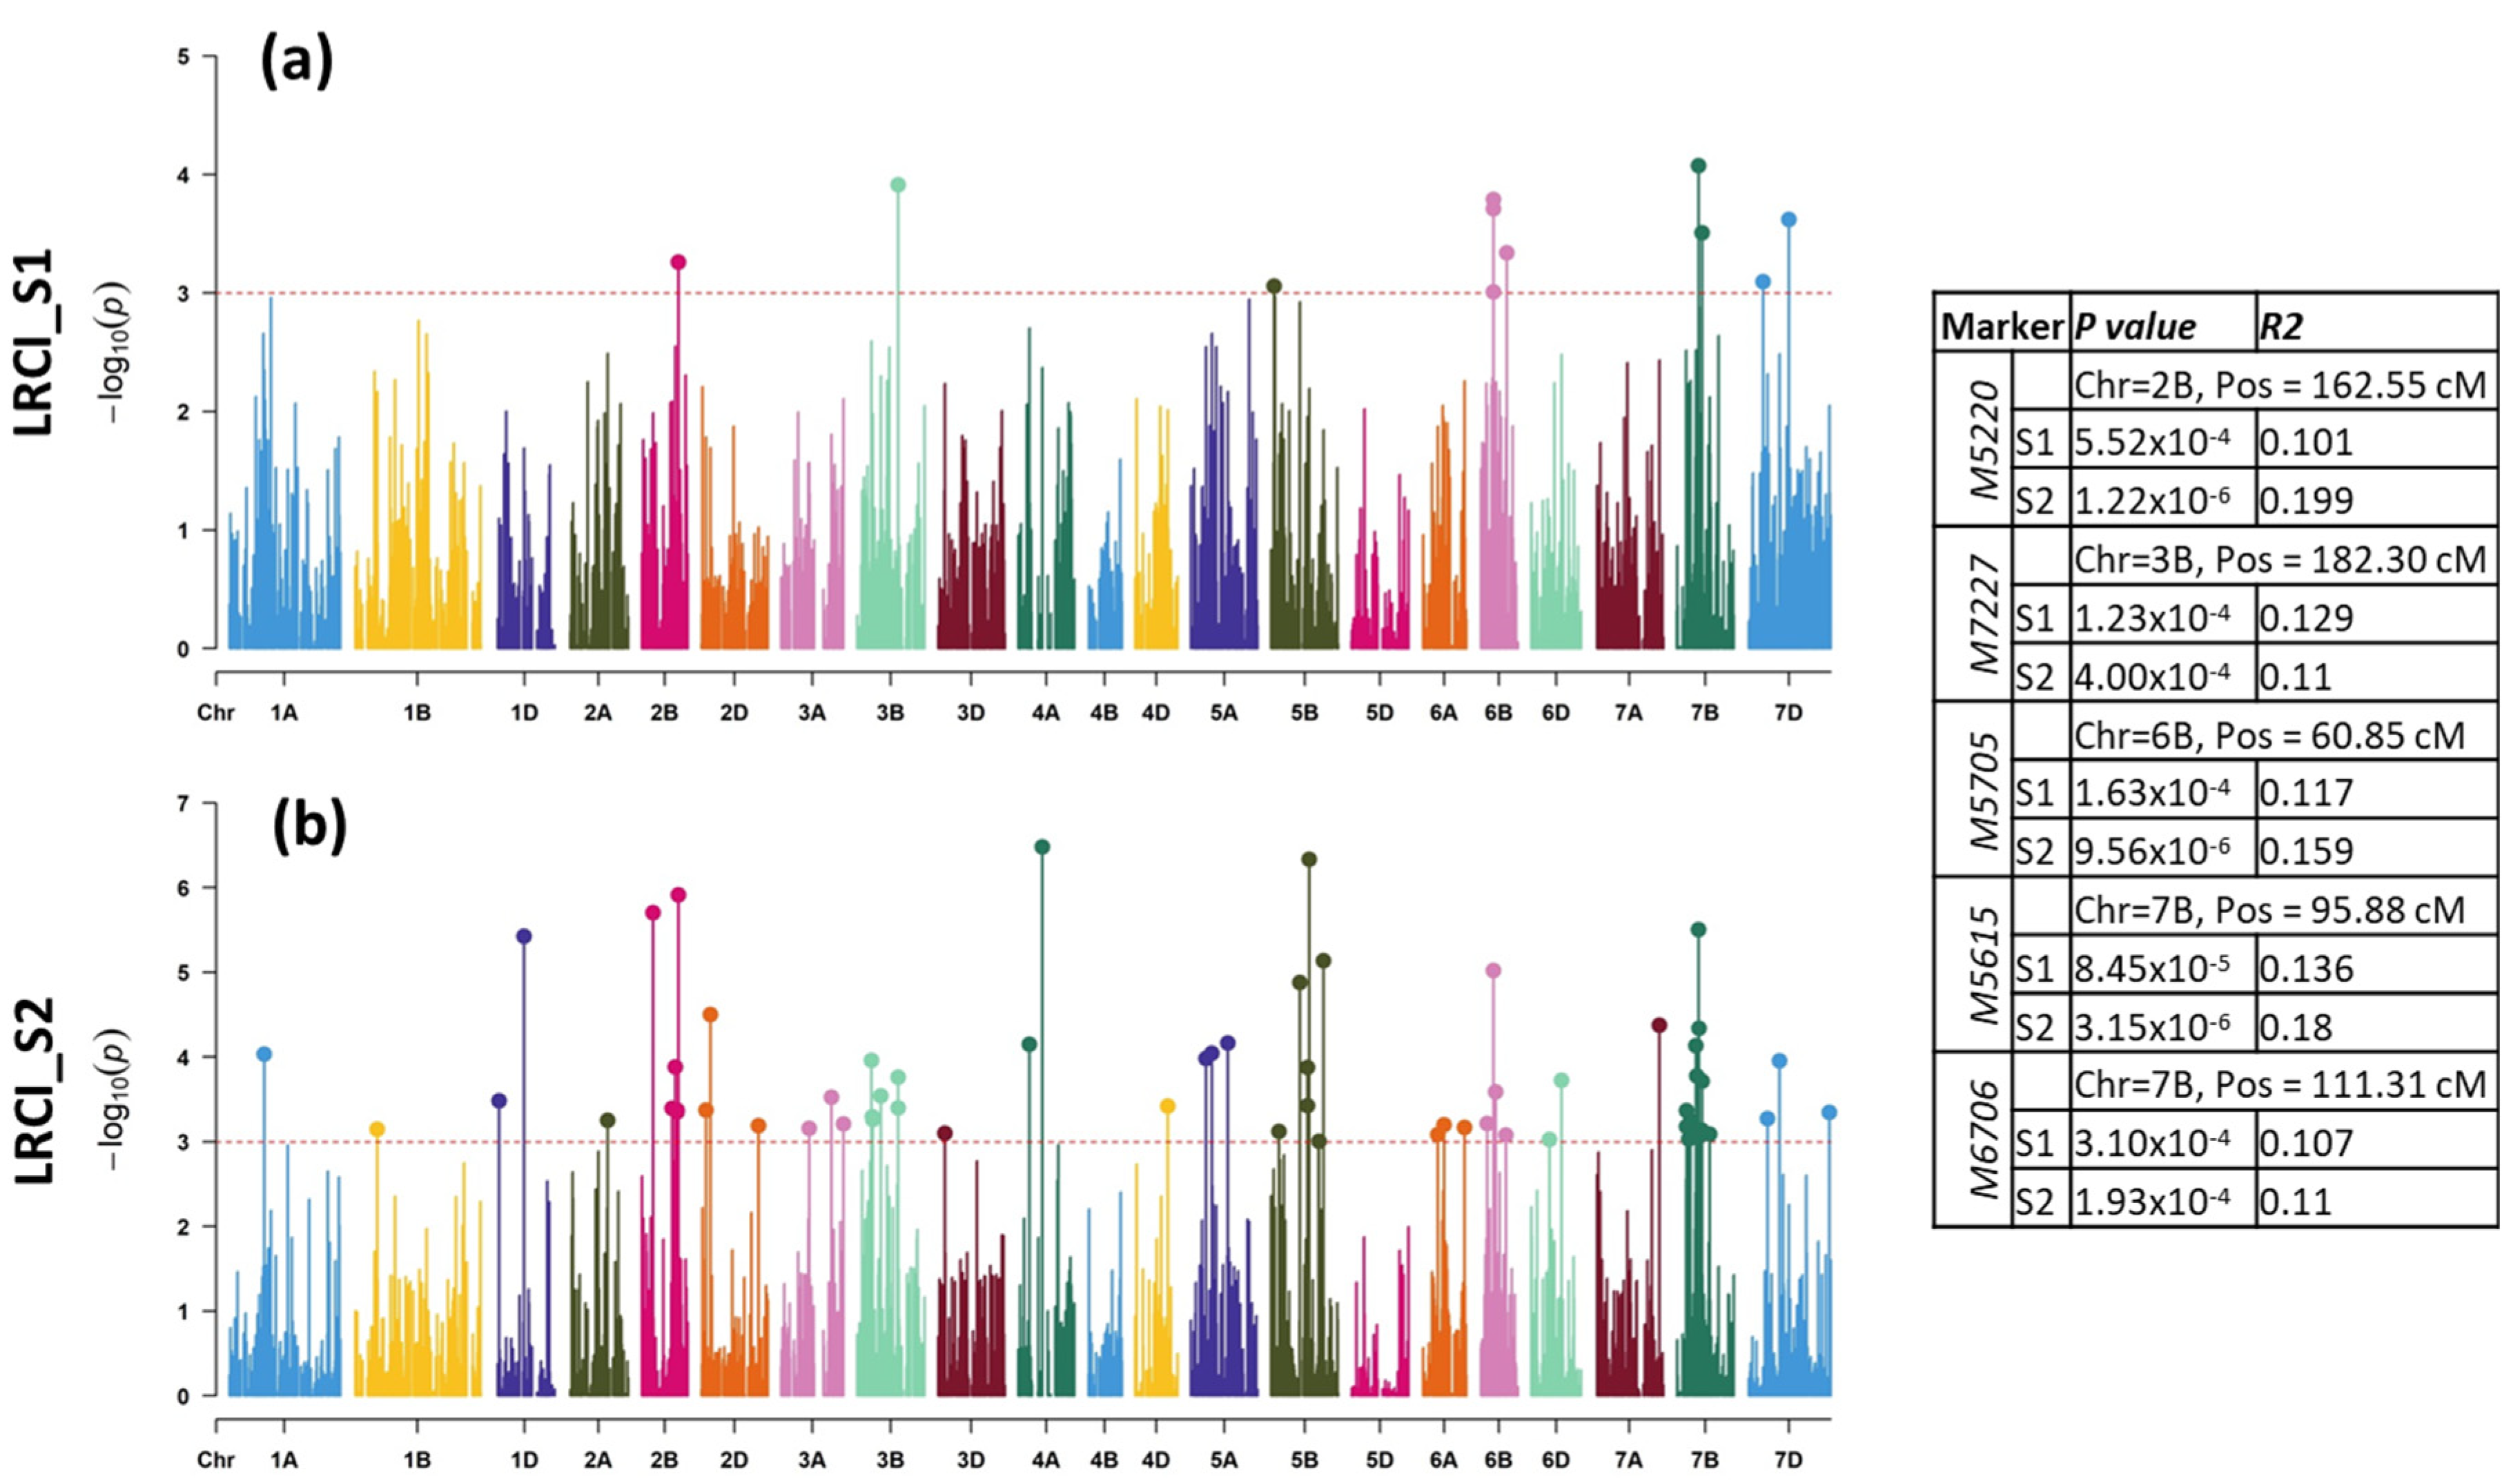
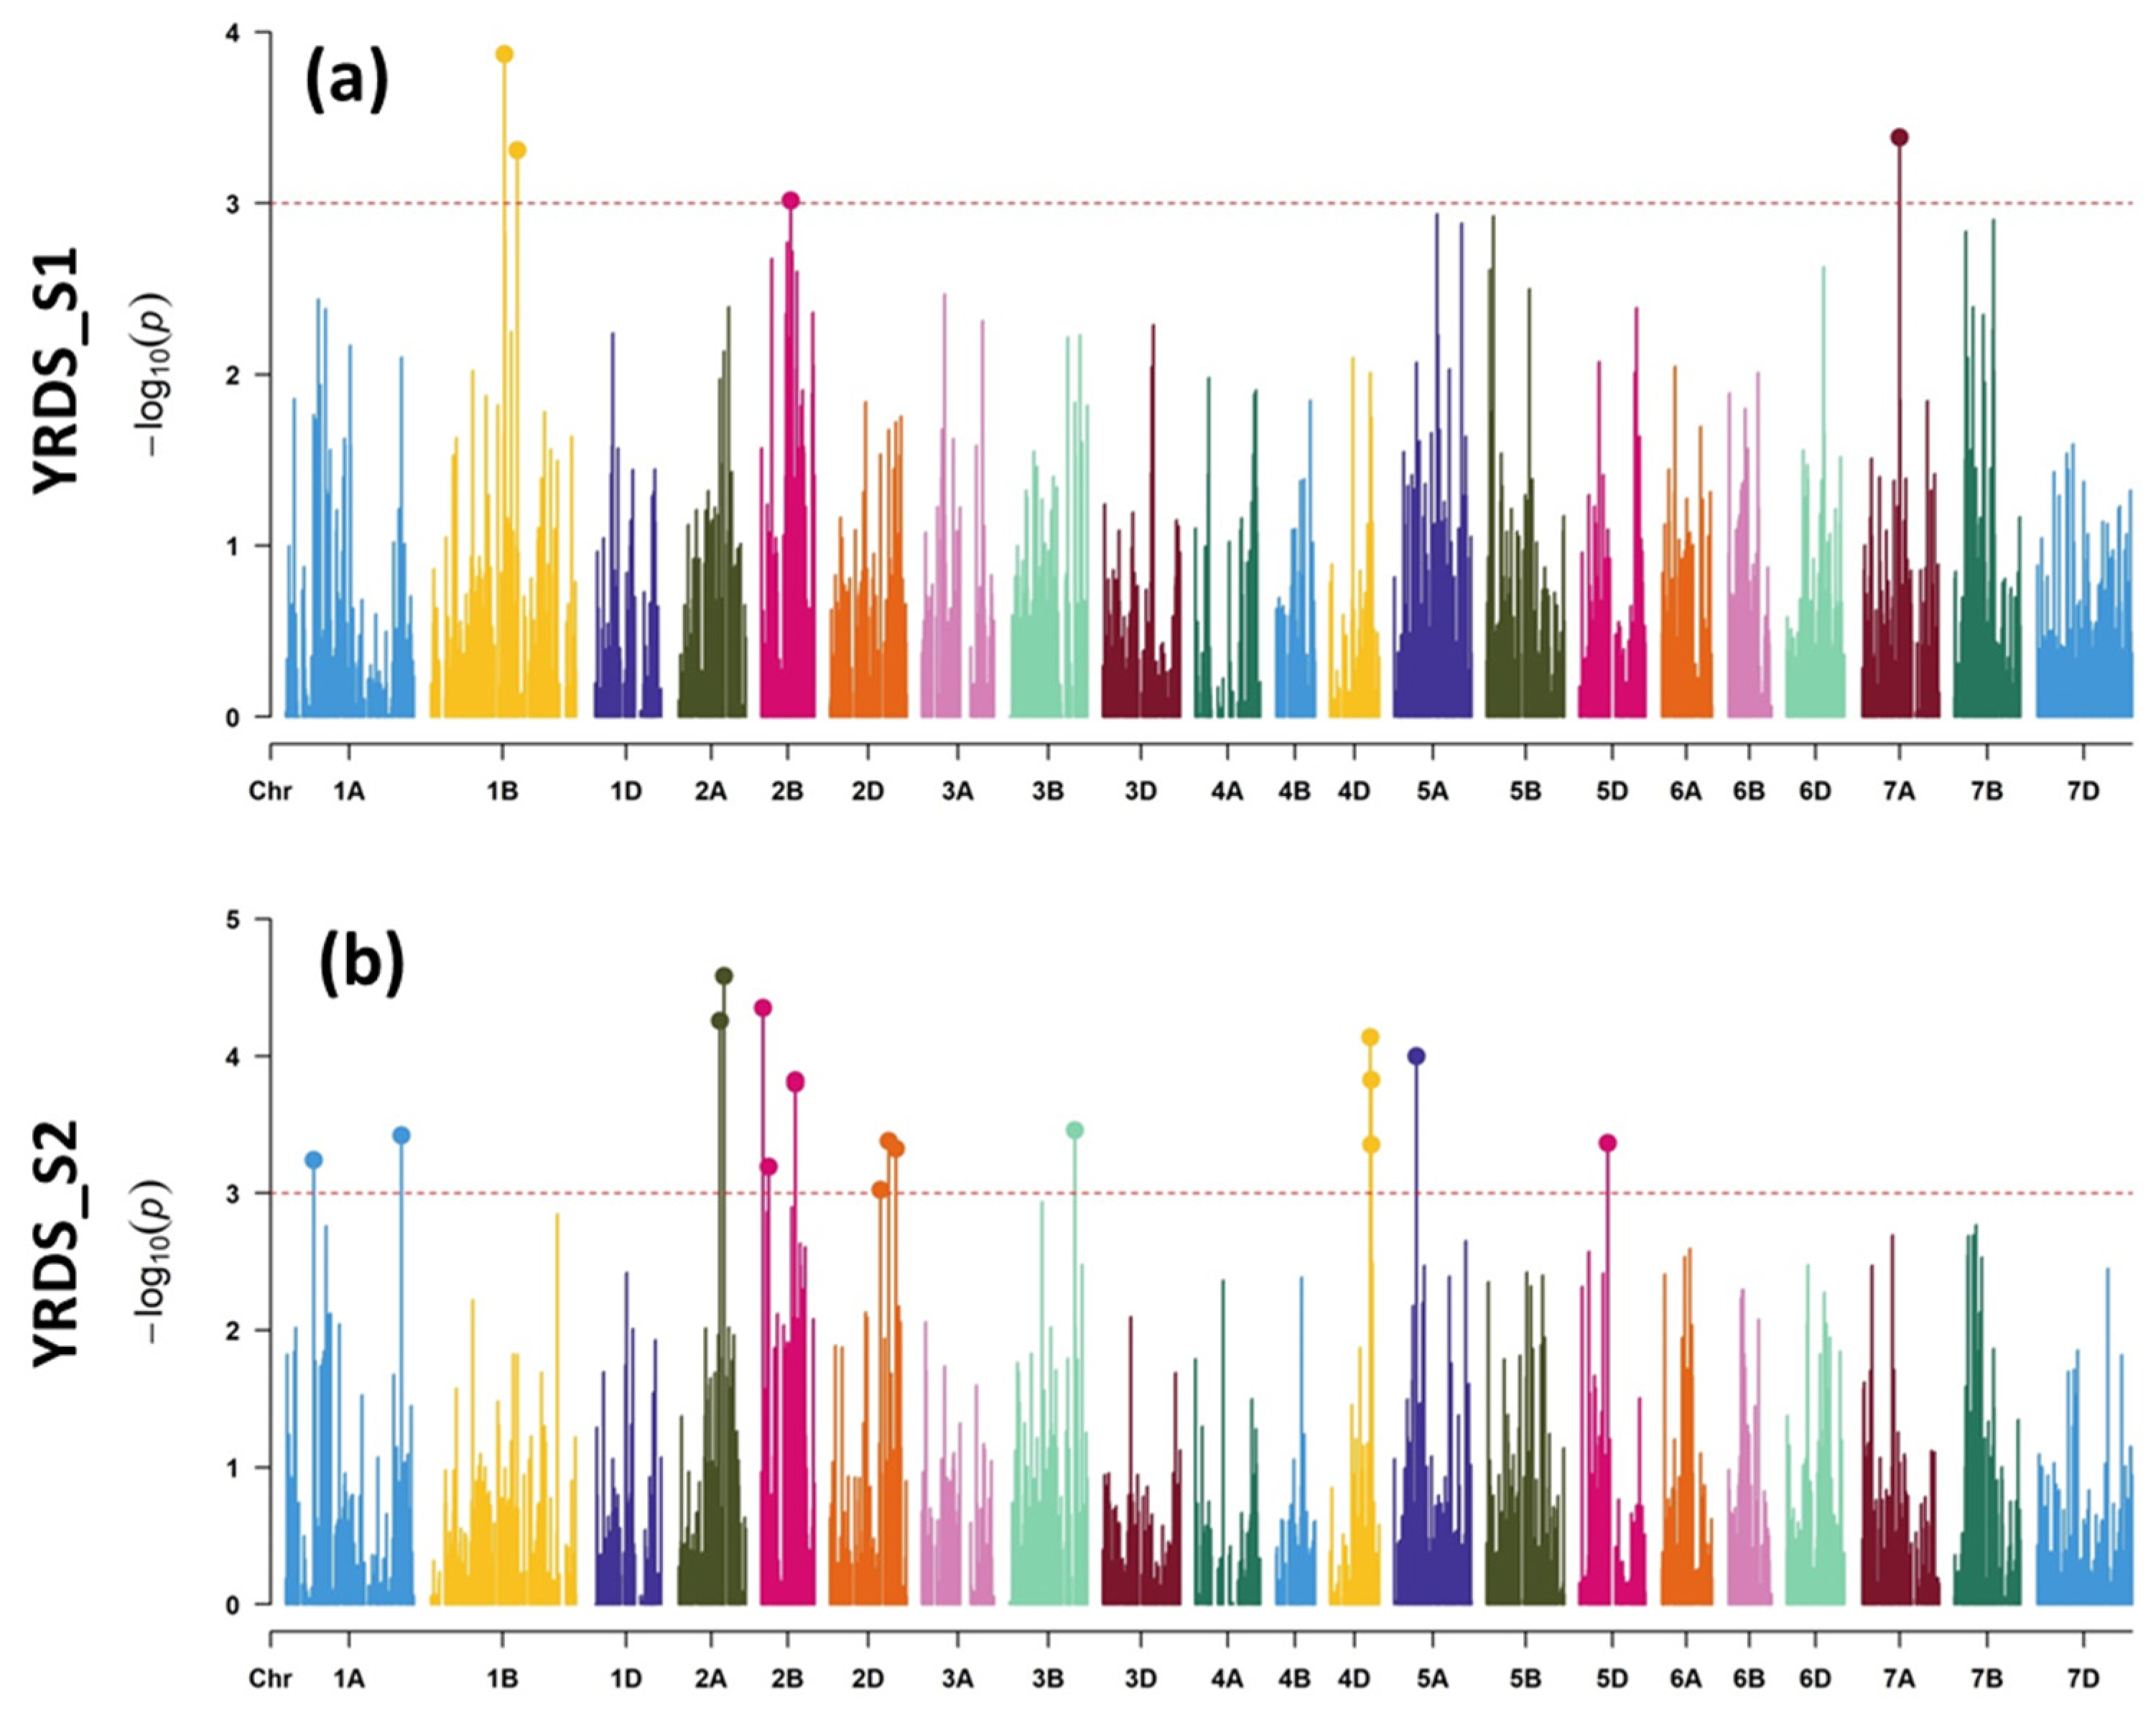
2.2. Genetic Analyses
2.2.1. LR Mapping
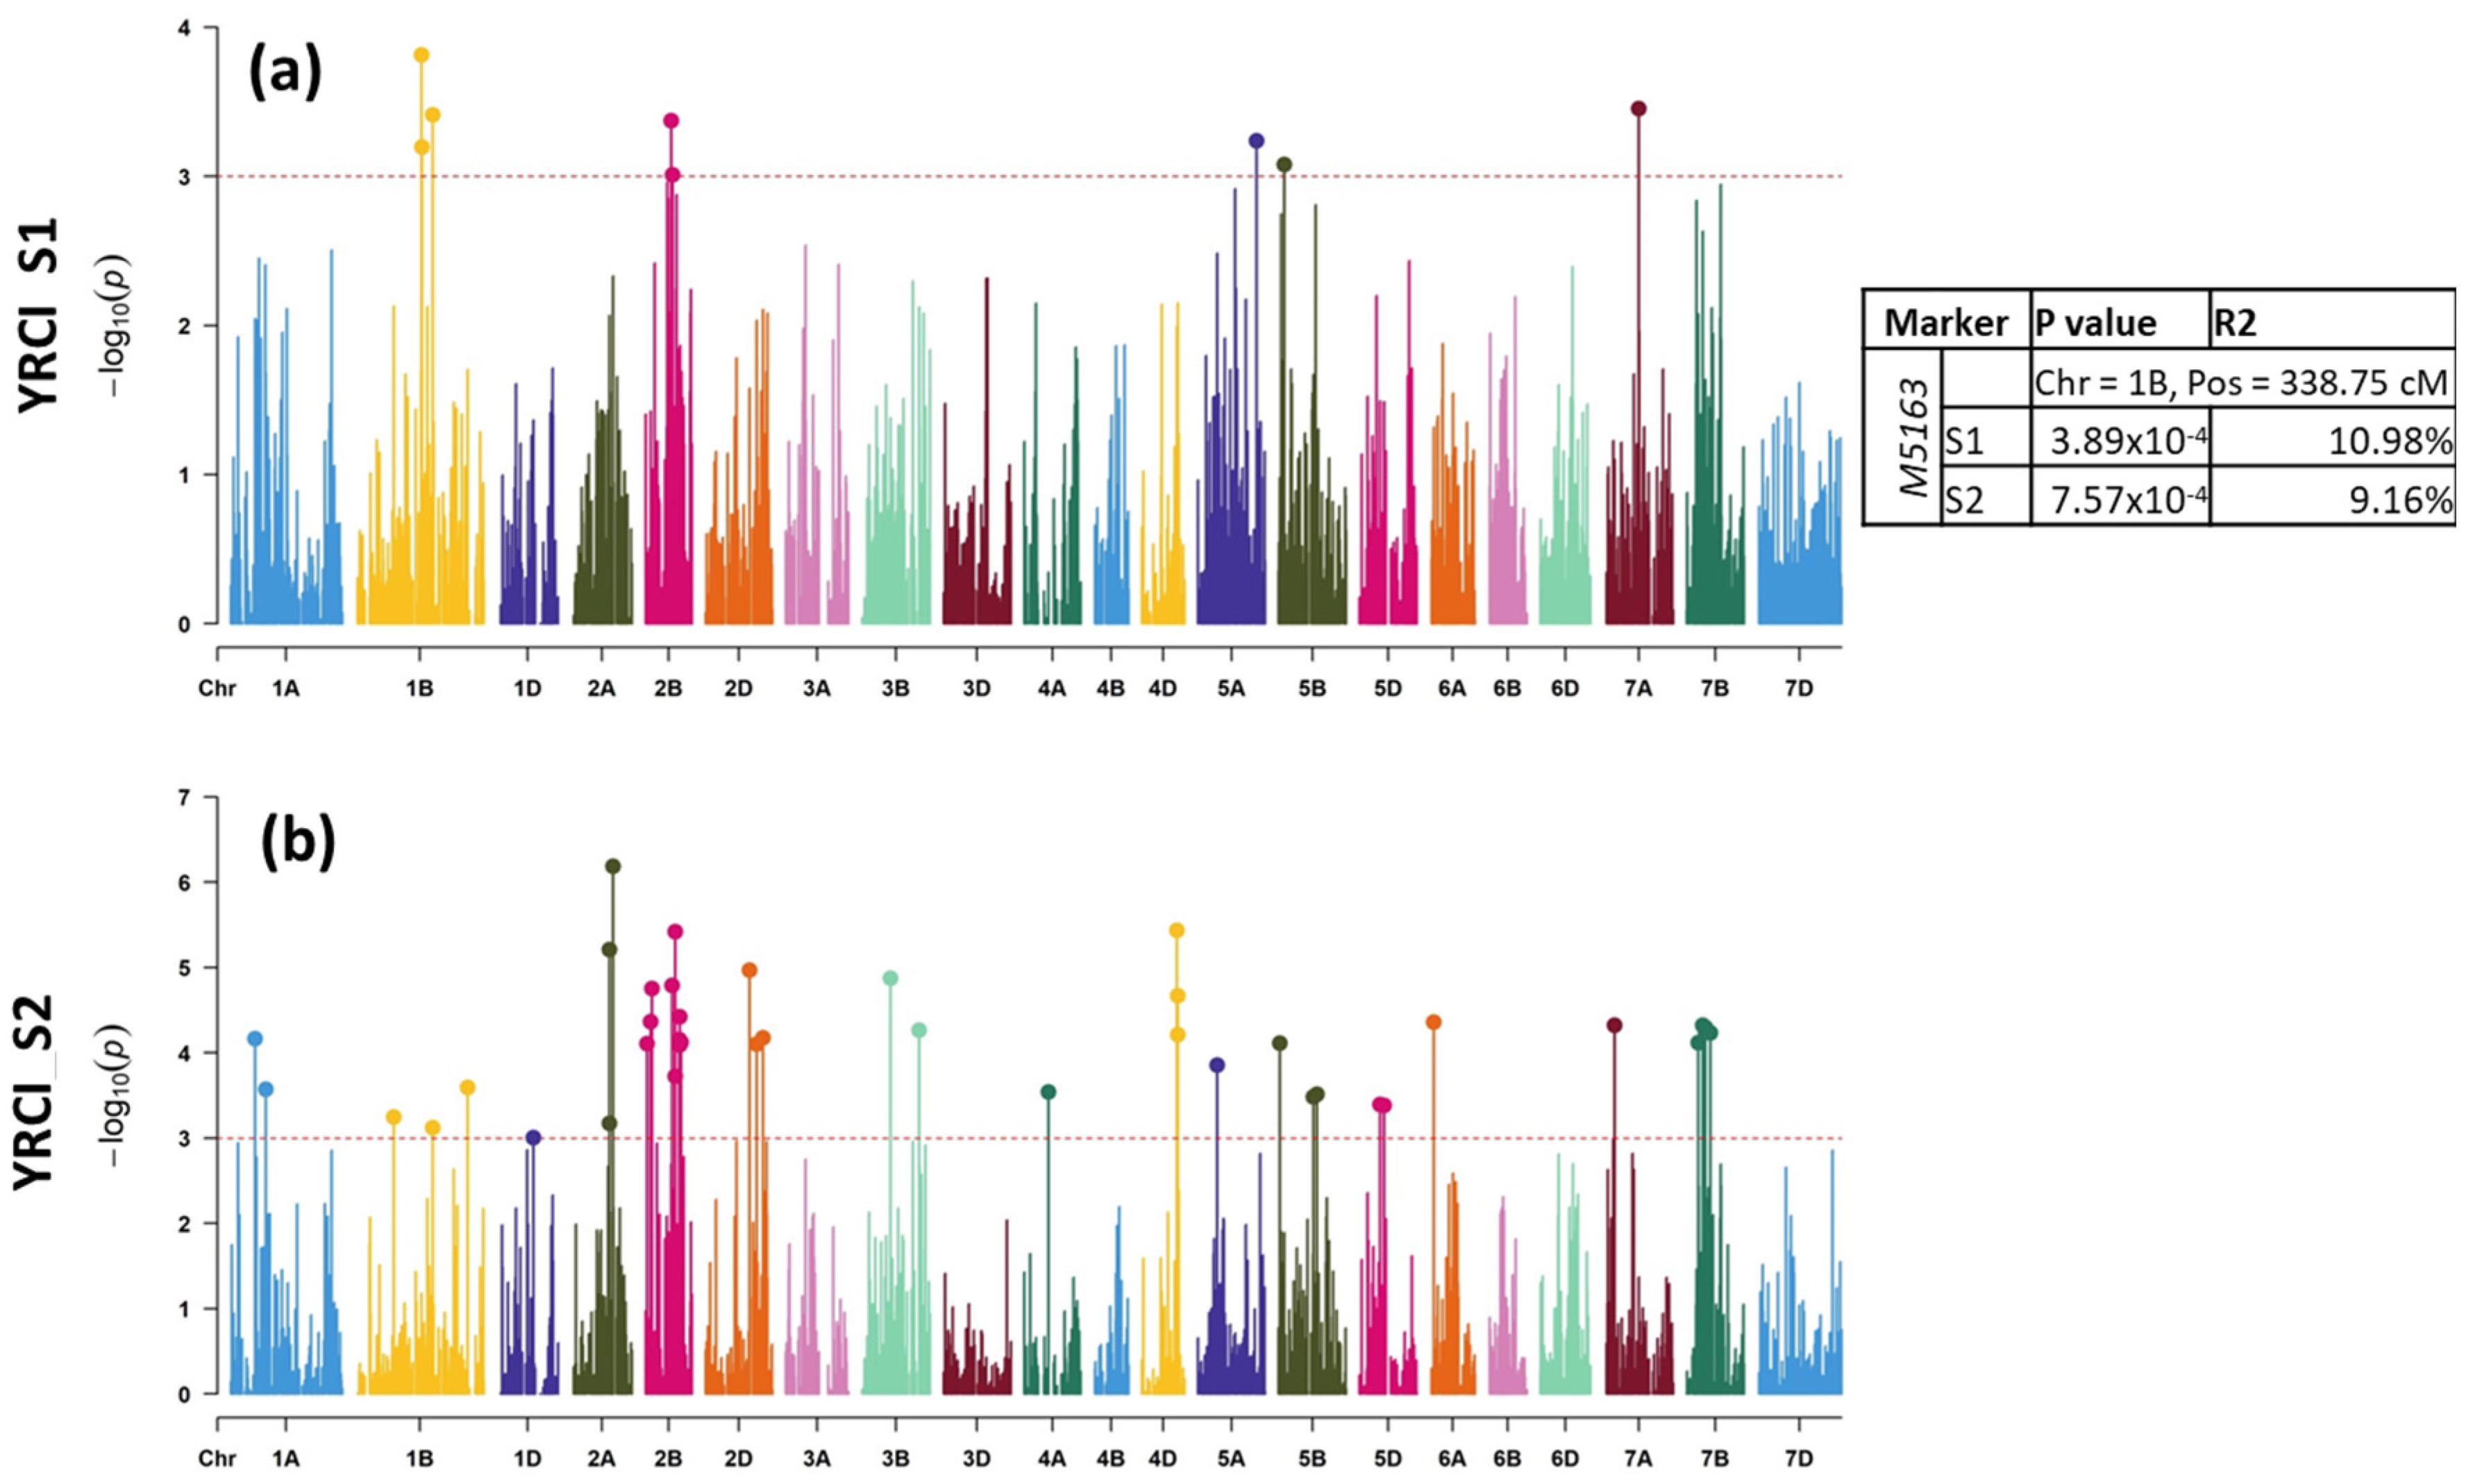
2.2.2. YR Mapping
3. Discussion
3.1. Phenotypic Variation
3.2. Molecular Mapping
3.3. Candidate Genes
3.4. Prospects of Field Deployment of Rust Resistance
4. Materials and Methods
4.1. Plant Materials
4.2. Experimental Design and Phenotyping Methods
4.3. Phenotypic Assessment
4.4. Genotyping and Genetic Analysis
5. Conclusions
Supplementary Materials
Author Contributions
Funding
Data Availability Statement
Acknowledgments
Conflicts of Interest
References
- Li, C.-X.; Xu, W.G.; Guo, R.; Zhang, J.-Z.; Qi, X.-L.; Hu, L.; Zhao, M.-Z. Molecular marker assisted breeding and genome composition analysis of Zhengmai 7698, an elite winter wheat cultivar. Sci. Rep. 2018, 8, 322. [Google Scholar] [CrossRef] [PubMed]
- Savadi, S.; Prasad, P.; Kashyap, P.L.; Bhardwaj, S.C. Molecular breeding technologies and strategies for rust resistance in wheat (Triticum aestivum) for sustained food security. Plant Pathol. 2018, 67, 771–791. [Google Scholar] [CrossRef]
- Tao, F.; Wang, J.; Guo, Z.; Hu, J.; Xu, X.; Yang, J.; Chen, X.; Hu, X. Transcriptomic analysis reveal the molecular mechanisms of wheat higher-temperature seedling-plant resistance to Puccinia striiformis f. sp. tritici. Front. Plant Sci. 2018, 9, 240. [Google Scholar] [CrossRef]
- Chen, X. Epidemiology and control of stripe rust [Puccinia striiformis f. sp. tritici] on wheat. Can. J. Plant Pathol. 2005, 27, 314–337. [Google Scholar] [CrossRef]
- Chen, X.; Kang, Z. Introduction: History of research, symptoms, taxonomy of the pathogen, host range, distribution, and impact of stripe rust. In Stripe Rust; Springer: Berlin/Heidelberg, Germany, 2017; pp. 1–33. [Google Scholar]
- Stubbs, R. Stripe rust. In Diseases, Distribution, Epidemiology, and Control; Elsevier: Amsterdam, The Netherlands, 1985; pp. 61–101. [Google Scholar]
- Wellings, C.R. Global status of stripe rust: A review of historical and current threats. Euphytica 2011, 179, 129–141. [Google Scholar] [CrossRef]
- Beddow, J.M.; Pardey, P.G.; Chai, Y.; Hurley, T.M.; Kriticos, D.J.; Braun, J.-C.; Park, R.F.; Cuddy, W.S.; Yonow, T. Research investment implications of shifts in the global geography of wheat stripe rust. Nat. Plants 2015, 1, 1–5. [Google Scholar] [CrossRef] [PubMed]
- Savary, S.; Willocquet, L.; Pethybridge, S.J.; Esker, P.; McRoberts, N.; Nelson, A. The global burden of pathogens and pests on major food crops. Nat. Ecol. Evol. 2019, 3, 430–439. [Google Scholar] [CrossRef]
- Wellings, C. Global status of stripe rust. In Proceedings of the BGRI 2010 Technical Workshop Oral Presentations, St Petersburg, Russia, 30–31 May 2010; pp. 34–35. [Google Scholar]
- Murray, D.G.; Murray, G.M. Stripe Rust: Understanding the Disease in Wheat; NSW Department of Primary Industries: Sydney, Australia, 2005. [Google Scholar]
- Johnson, R. Past, present and future opportunities in breeding for disease resistance, with examples from wheat. In Breeding for Disease Resistance; Springer: Berlin/Heidelberg, Germany, 1992; pp. 3–22. [Google Scholar]
- Zadoks, J.; van Leur, J. Durable resistance and host-pathogen-environment interaction. In Durable Resistance in Crops; Springer: Berlin/Heidelberg, Germany, 1983; pp. 125–140. [Google Scholar]
- Milus, E.A.; Kristensen, K.; Hovmøller, M.S. Evidence for increased aggressiveness in a recent widespread strain of Puccinia striiformis f. sp. tritici causing stripe rust of wheat. Phytopathology 2009, 99, 89–94. [Google Scholar] [CrossRef]
- Chen, X. Pathogens which threaten food security: Puccinia striiformis, the wheat stripe rust pathogen. Food Secur. 2020, 12, 239–251. [Google Scholar] [CrossRef]
- Singh, R.P.; Singh, P.K.; Rutkoski, J.; Hodson, D.P.; He, X.; Jørgensen, L.N.; Hovmøller, M.S.; Huerta-Espino, J. Disease impact on wheat yield potential and prospects of genetic control. Annu. Rev. Phytopathol. 2016, 54, 303–322. [Google Scholar] [CrossRef] [Green Version]
- Hussain, M.; Hassan, S.; Kirmani, M. Virulence in Puccinia recondita Rob. ex. Desm. f. sp. tritici in Pakistan during 1978 and 1979. In Proceedings of the 5th European and Mediterranean Cereal Rust Conference, Bari, Italy, 28 May 1980. [Google Scholar]
- Pinto da Silva, G.B.; Zanella, C.M.; Martinelli, J.A.; Chaves, M.S.; Hiebert, C.W.; McCallum, B.D.; Boyd, L.A. Quantitative trait loci conferring leaf rust resistance in hexaploid wheat. Phytopathology 2018, 108, 1344–1354. [Google Scholar] [CrossRef]
- Wang, M.; Chen, X. Stripe Rust Resistance. In Stripe Rust; Chen, X., Kang, Z., Eds.; Springer: Dordrecht, The Netherlands, 2017; pp. 353–558. [Google Scholar]
- Abdur Rahman Arif, M.; Bux, H.; Kazi, A.G.; Rasheed, A.; Napar, A.A.; Riaz, A.; Mujeeb-Kazi, A. Stripe rust analysis of D-genome synthetic wheats (2 n= 6 x= 42, AABBDD) and their molecular diversity. Arch. Phytopathol. Plant Prot. 2012, 45, 1479–1487. [Google Scholar] [CrossRef]
- Singh, S.; Vikram, P.; Sehgal, D.; Burgueño, J.; Sharma, A.; Singh, S.K.; Sansaloni, C.P.; Joynson, R.; Brabbs, T.; Ortiz, C.; et al. Harnessing genetic potential of wheat germplasm banks through impact-oriented-prebreeding for future food and nutritional security. Sci. Rep. 2018, 8, 12527. [Google Scholar] [CrossRef] [PubMed]
- Shokat, S.; Sehgal, D.; Vikram, P.; Liu, F.; Singh, S. Molecular Markers Associated with Agro-Physiological Traits under Terminal Drought Conditions in Bread Wheat. Int. J. Mol. Sci. 2020, 21, 3156. [Google Scholar] [CrossRef] [PubMed]
- Singh, S.; Sehgal, D.; Kumar, S.; Arif, M.A.R.; Vikram, P.; Sansaloni, C.P.; Fuentes-Dávila, G.; Ortiz, C. GWAS revealed a novel resistance locus on chromosome 4D for the quarantine disease Karnal bunt in diverse wheat pre-breeding germplasm. Sci. Rep. 2020, 10, 1–11. [Google Scholar]
- Dababat, A.; Arif, M.A.R.; Toktay, H.; Atiya, O.; Shokat, S.; E-Orakci, G.; Imren, M.; Singh, S. A GWAS to identify the cereal cyst nematode (Heterodera filipjevi) resistance loci in diverse wheat prebreeding lines. J. Appl. Genet. 2021, 62, 93–98. [Google Scholar] [CrossRef]
- Akram, S.; Arif, M.A.R.; Hameed, A. A GBS-based GWAS analysis of adaptability and yield traits in bread wheat (Triticum aestivum L.). J. Appl. Genet. 2020, 62, 27–41. [Google Scholar] [CrossRef]
- Arif, M.A.R.; Liaqat, M.; Imran, M.; Waheed, M.Q.; Arif, A.; Singh, S.; Shokat, S. Genetic basis of some physiological traits and yield in early and late sowing conditions in bread wheat (Triticum aestivum L.). J. Appl. Genet. 2021, 62, 601–605. [Google Scholar] [CrossRef]
- Dimmock, J.; Gooding, M. The influence of foliar diseases, and their control by fungicides, on the protein concentration in wheat grain: A review. J. Agric. Sci. 2002, 138, 349–366. [Google Scholar] [CrossRef]
- Line, R.F. Stripe rust of wheat and barley in North America: A retrospective historical review. Annu. Rev. Phytopathol. 2002, 40, 75–118. [Google Scholar] [CrossRef]
- Singh, R.; Huerta-Espino, J.; Rajaram, S. Achieving near-immunity to leaf and stripe rusts in wheat by combining slow rusting resistance genes. Acta Phytopathol. Entomol. Hung. 2000, 35, 133–139. [Google Scholar]
- Saleem, K.; Arshad, H.M.I.; Shokat, S.; Atta, B. Appraisal of wheat germplasm for adult plant resistance against stripe rust. J. Plant Prot. Res. 2015, 55, 405–414. [Google Scholar] [CrossRef]
- Ali, S.; Rodriguez-Algaba, J.; Thach, T.; Sørensen, C.K.; Hansen, J.G.; Lassen, P.; Nazari, K.; Hodson, D.P.; Justesen, A.F.; Hovmøller, M.S. Yellow rust epidemics worldwide were caused by pathogen races from divergent genetic lineages. Front. Plant Sci. 2017, 8, 1057. [Google Scholar] [CrossRef] [PubMed]
- Hovmøller, M. Sources of seedling and adult plant resistance to Puccinia striiformis f. sp. tritici in European wheats. Plant Breed. 2007, 126, 225–233. [Google Scholar] [CrossRef]
- Mundt, C.C. Pyramiding for resistance durability: Theory and practice. Phytopathology 2018, 108, 792–802. [Google Scholar] [CrossRef]
- Burdon, J.J.; Zhan, J.; Barrett, L.G.; Papaïx, J.; Thrall, P.H. Addressing the challenges of pathogen evolution on the world’s arable crops. Phytopathology 2016, 106, 1117–1127. [Google Scholar] [CrossRef]
- Niks, R.E.; Qi, X.; Marcel, T.C. Quantitative resistance to biotrophic filamentous plant pathogens: Concepts, misconceptions, and mechanisms. Annu. Rev. Phytopathol. 2015, 53, 445–470. [Google Scholar] [CrossRef]
- Arif, M.A.R.; Waheed, M.Q.; Lohwasser, U.; Shokat, S.; Alqudah, A.M.; Volkmar, C.; Börner, A. Genetic insight into the insect resistance in bread wheat exploiting the untapped natural diversity. Front. Genet. 2022, 13, 828905. [Google Scholar] [CrossRef]
- McIntosh, R.A.; Yamazaki, Y.; Dubcovsky, J.; Rogers, J.; Morris, C.; Appels, R. Catalogue of gene symbols for wheat: 2008. In Proceedings of the 11th International Wheat Genetics Symposium, Brisbane, Australia, 24–29 August 2008; Appels, R., Eastwood, R., Lagudah, E., Langridge, P., Mackay, M., McIntyre, L., Sharp, P., Eds.; Sydney University Press: Sydney, Australia, 2008. [Google Scholar]
- Arif, M.A.R.; Shokat, S.; Plieske, J.; Ganal, M.; Lohwasser, U.; Chesnokov, Y.V.; Kocherina, N.V.; Kulwal, P.; Kumar, N.; McGuire, P.E.; et al. A SNP-based genetic dissection of versatile traits in bread wheat (Triticum aestivum L.). Plant J. 2021, 108, 960–976. [Google Scholar] [CrossRef]
- Azzimonti, G.; Marcel, T.C.; Robert, O.; Paillard, S.; Lannou, C.; Goyeau, H. Diversity, specificity and impacts on field epidemics of QTLs involved in components of quantitative resistance in the wheat leaf rust pathosystem. Mol. Breed. 2014, 34, 549–567. [Google Scholar] [CrossRef]
- E Bokore, F.; Knox, R.E.; Cuthbert, R.D.; Pozniak, C.J.; McCallum, B.D.; N’Diaye, A.; Depauw, R.M.; Campbell, H.L.; Munro, C.; Singh, A.; et al. Mapping quantitative trait loci associated with leaf rust resistance in five spring wheat populations using single nucleotide polymorphism markers. PLoS ONE 2020, 15, e0230855. [Google Scholar] [CrossRef] [PubMed]
- Chen, X.; Jones, S.; Line, R. Chromosomal location of genes for resistance to Puccinia striiformis in seven wheat cultivars with resistance genes at the Yr3 and Yr4 loci. Phytopathology 1996, 86, 1228–1233. [Google Scholar] [CrossRef]
- Zhang, X.; Han, D.; Zeng, Q.; Duan, Y.; Yuan, F.; Shi, J.; Wang, Q.; Wu, J.; Huang, L.; Kang, Z. Fine mapping of wheat stripe rust resistance gene Yr26 based on collinearity of wheat with Brachypodium distachyon and rice. PLoS ONE 2013, 8, e57885. [Google Scholar] [CrossRef] [PubMed]
- Rosewarne, G.M.; Singh, R.P.; Huerta-Espino, J.; William, H.M.; Bouchet, S.; Cloutier, S.; McFadden, H.; Lagudah, E.S. Leaf tip necrosis, molecular markers and β1-proteasome subunits associated with the slow rusting resistance genes Lr46/Yr29. Theor. Appl. Genet. 2006, 112, 500–508. [Google Scholar] [CrossRef] [PubMed]
- Liu, F.; Niu, Y.; Deng, H.; Tan, G. Mapping of a major stripe rust resistance gene in Chinese native wheat variety Chike using microsatellite markers. J. Genet. Genom. 2007, 34, 1123–1130. [Google Scholar] [CrossRef]
- Lin, F.; Chen, X. Molecular mapping of genes for race-specific overall resistance to stripe rust in wheat cultivar Express. Theor. Appl. Genet. 2008, 116, 797–806. [Google Scholar] [CrossRef]
- Li, Q.; Ma, D.; Fan, Y.; Shen, X.; Jing, J.; Wang, B.; Kang, Z. Genetic analysis and molecular mapping of a stripe rust resistance gene in Chinese wheat differential Guinong 22. J. Phytopathol. 2016, 164, 476–484. [Google Scholar] [CrossRef]
- Huang, Q.; Li, X.; Chen, W.Q.; Xiang, Z.P.; Zhong, S.F.; Chang, Z.J.; Zhang, M.; Zhang, H.Y.; Tan, F.Q.; Ren, Z.L.; et al. Genetic mapping of a putative Thinopyrum intermedium-derived stripe rust resistance gene on wheat chromosome 1B. Theor. Appl. Genet. 2014, 127, 843–853. [Google Scholar] [CrossRef]
- Yong, R.E.N.; Li, S.R.; Wei, Y.M.; Zhou, Q.; Du, X.Y.; He, Y.J.; Zheng, Y.L. Molecular mapping of a stripe rust resistance gene in Chinese wheat cultivar Mianmai 41. J. Integr. Agric. 2015, 14, 295–304. [Google Scholar]
- Yue, Y.-L.; Yao, Z.-J.; Ren, X.-X.; Wang, L. Molecular mapping of a gene for resistance to stripe rust in wheat variety PIW138. Agric. Sci. China 2010, 9, 1285–1291. [Google Scholar] [CrossRef]
- Zhang, H.; Zhang, L.; Wang, C.; Wang, Y.; Zhou, X.; Lv, S.; Liu, X.; Kang, Z.; Ji, W. Molecular mapping and marker development for the Triticum dicoccoides-derived stripe rust resistance gene YrSM139-1B in bread wheat cv. Shaanmai 139. Theor. Appl. Genet. 2016, 129, 369–376. [Google Scholar] [CrossRef] [PubMed]
- Hou, L.; Ma, D.; Hu, M.; He, M.; Lu, Y.; Jing, J. Genetic analysis and molecular mapping of an all-stage stripe rust resistance gene in Triticum aestivum-Haynaldia villosa translocation line V3. J. Integr. Agric. 2013, 12, 2197–2208. [Google Scholar] [CrossRef]
- Sui, X.; Wang, M.; Chen, X. Molecular mapping of a stripe rust resistance gene in spring wheat cultivar Zak. Phytopathology 2009, 99, 1209–1215. [Google Scholar] [CrossRef] [PubMed] [Green Version]
- Feng, J.Y.; Wang, M.N.; Chen, X.M.; See, D.R.; Zheng, Y.L.; Chao, S.M.; Wan, A.M. Molecular mapping of YrSP and its relationship with other genes for stripe rust resistance in wheat chromosome 2BL. Phytopathology 2015, 105, 1206–1213. [Google Scholar] [CrossRef]
- Cheng, P.; Chen, X. Molecular mapping of a gene for stripe rust resistance in spring wheat cultivar IDO377s. Theor. Appl. Genet. 2010, 121, 195–204. [Google Scholar] [CrossRef]
- Chhetri, M. Molecular Mapping and Genetic Characterization of Rust Resistance in Wheat; University of Sydney: Sydney, Australia, 2015. [Google Scholar]
- Deng, Z.Y.; Zhang, X.Q.; Wang, X.P.; Jing, J.K.; Wang, D.W. Identification and molecular mapping of a stripe rust resistance gene from a common wheat line Qz180. Acta Bot. Sin.-Engl. Ed. 2004, 46, 236–241. [Google Scholar]
- Wang, Y.-B.; Xu, S.-C.; Xu, Z.; Liu, T.-G.; Lin, R.-M. A microsatellite marker linked to the stripe rust resistance gene YrV23 in the wheat variety Vilmorin23. Yi Chuan Hered. 2006, 28, 306–310. [Google Scholar]
- Hassan, R.; Waheed, M.Q.; Shokat, S.; Rehman-Arif, M.A.; Tariq, R.; Arif, M.; Arif, A. Estimation of genomic diversity using sequence related amplified polymorphism (SRAP) markers in a mini core collection of wheat germplasm from Pakistan. Cereal Res. Commun. 2020, 48, 33–40. [Google Scholar] [CrossRef]
- Begcy, K.; Walia, H. Drought stress delays endosperm development and misregulates genes associated with cytoskeleton organization and grain quality proteins in developing wheat seeds. Plant Sci. 2015, 240, 109–119. [Google Scholar] [CrossRef]
- Luo, G.; Shen, L.; Zhao, S.; Li, R.; Song, Y.; Song, S.; Yu, K.; Yang, W.; Li, X.; Sun, J.; et al. Genome-wide identification of seed storage protein gene regulators in wheat through coexpression analysis. Plant J. 2021, 108, 1704–1720. [Google Scholar] [CrossRef]
- Ren, H.; Gray, W.M. SAUR proteins as effectors of hormonal and environmental signals in plant growth. Mol. Plant 2015, 8, 1153–1164. [Google Scholar] [CrossRef] [PubMed]
- Zhao, L.; Zhao, X.; Francis, F.; Liu, Y. Genome-wide identification and characterization of the TPS gene family in wheat (Triticum aestivum L.) and expression analysis in response to aphid damage. Acta Physiol. Plant. 2021, 43, 1–14. [Google Scholar] [CrossRef]
- Lin, R.; Wang, H. Arabidopsis FHY3/FAR1 gene family and distinct roles of its members in light control of Arabidopsis development. Plant Physiol. 2004, 136, 4010–4022. [Google Scholar] [CrossRef]
- Arif, M.A.R.; Nagel, M.; Lohwasser, U.; Börner, A. Genetic architecture of seed longevity in bread wheat (Triticum aestivum L.). J. Biosci. 2017, 42, 81–89. [Google Scholar] [CrossRef] [PubMed]
- Arif, M.A.R.; Börner, A. Mapping of QTL associated with seed longevity in durum wheat (Triticum durum Desf.). J. Appl. Genet. 2019, 60, 33–36. [Google Scholar] [CrossRef]
- Arif, M.A.R.; Börner, A. An SNP based GWAS analysis of seed longevity in wheat. Cereal Res. Commun. 2020, 48, 149–156. [Google Scholar] [CrossRef]
- Arif, M.A.R.; Afzal, I.; Börner, A. Genetic Aspects and Molecular Causes of Seed Longevity in Plants—A Review. Plants 2022, 11, 598. [Google Scholar] [CrossRef]
- Arif, M.A.R.; Agacka-Mołdoch, M.; Qualset, C.O.; Börner, A. Mapping of additive and epistatic QTLs linked to seed longevity in bread wheat (Triticum aestivum L.). Cereal Res. Commun. 2022, 1–7. [Google Scholar] [CrossRef]
- Singh, S.; Jighly, A.; Sehgal, D.; Burgueño, J.; Joukhadar, R.; Sharma, A.; Vikram, P.; Sansaloni, C.P.; Govindan, V.; Bhavani, S.; et al. Direct introgression of untapped diversity into elite wheat lines. Nat. Food 2021, 2, 819–827. [Google Scholar] [CrossRef]
- Roelfs, A.P. Rust Diseases of Wheat: Concepts and Methods of Disease Management; Cimmyt: Batan, Mexico, 1992. [Google Scholar]
- Bradbury, P.J.; Zhang, Z.; Kroon, D.E.; Casstevens, T.M.; Ramdoss, Y.; Buckler, E.S. TASSEL: Software for association mapping of complex traits in diverse samples. Bioinformatics 2007, 23, 2633–2635. [Google Scholar] [CrossRef]


| Sr # | PBL # | GID | Pedigree | YrCI_S1 | YrCI_S2 | YrDS_S1 | YrDS_S2 | LrCI_S1 | LrCI_S2 | LrDS_S1 | LrDS_S2 | |
|---|---|---|---|---|---|---|---|---|---|---|---|---|
| 1 | PBLs with positive allels for both Yr QTLs (suitable for Yr only) | 757 | 7644421 | BCN//CETA/AE.SEARSII (34D)/6/KAUZ//ALTAR 84/AOS/3/PASTOR/4/MILAN/CUPE//SW89.3064/5/KIRITATI/7/SW89.5277/BORL95//SKAUZ/3/PRL/2*PASTOR/4/HEILO | 1.25 | 0.46 | 5 | 2.33 | 3 | 1.33 | 5 | 6.66 |
| 2 | 765 | 7643989 | 68.111/RGB-U//WARD RESEL/3/STIL/4/AE.SQUARROSA (700)/6/KAUZ//ALTAR 84/AOS/3/PASTOR/4/MILAN/CUPE//SW89.3064/5/KIRITATI/7/SW89.5277/BORL95//SKAUZ/3/PRL/2*PASTOR/4/HEILO | 1 | 0.46 | 5 | 2.33 | 3 | 7.66 | 10 | 23.33 | |
| 3 | 878 | 7645480 | DOY1/AE.SQUARROSA (318)/3/KACHU #1/KIRITATI//KACHU/4/PBW343*2/KUKUNA*2//FRTL/PIFED | 0.25 | 0.26 | 2.5 | 1.33 | 0.75 | 1 | 2.5 | 5 | |
| 4 | 899 | 7645610 | D67.2/PARANA 66.270//AE.SQUARROSA (354)/3/KACHU #1/KIRITATI//KACHU/4/PBW343*2/KUKUNA*2//FRTL/PIFED | 0 | 0 | 2.5 | 0 | 0 | 1.33 | 0 | 6.66 | |
| 5 | PBLs with positive allels for all six Lr QTLs (suitable for Lr only) | 759 | 7644473 | CHEN/AE.SQ//2*OPATA/6/KAUZ//ALTAR 84/AOS/3/PASTOR/4/MILAN/CUPE//SW89.3064/5/KIRITATI/7/SW89.5277/BORL95//SKAUZ/3/PRL/2*PASTOR/4/HEILO | 1 | 0.4667 | 5 | 2.33333 | 1 | 0.33333 | 2.5 | 1.66667 |
| 6 | 891 | 7645167 | JAL95.4.3/3/KACHU #1/KIRITATI//KACHU/4/PBW343*2/KUKUNA*2//FRTL/PIFED | 1.5 | 1.1333 | 7.5 | 5.66667 | 0.3 | 0 | 1 | 0 | |
| 7 | 973 | 7645610 | 68.111/RGB-U//WARD/3/AE.SQUARROSA (452)/4/2*OASIS/SKAUZ//4*BCN/5/NAVJ07/6/KACHU | 20 | 50.667 | 50 | 56.6667 | 0 | 0 | 0 | 0 | |
| 8 | PBLs with positive allels for all seven Yr/Lr QTLs (suitable for both Yr and Lr) | 759 | 7644473 | CHEN/AE.SQ//2*OPATA/6/KAUZ//ALTAR 84/AOS/3/PASTOR/4/MILAN/CUPE//SW89.3064/5/KIRITATI/7/SW89.5277/BORL95//SKAUZ/3/PRL/2*PASTOR/4/HEILO | 1 | 0.46 | 5 | 2.33 | 1 | 0.33 | 2.5 | 1.66 |
| 9 | 871 | 4645422 | 68.111/RGB-U//WARD/3/FGO/4/RABI/5/AE.SQUARROSA (809)/6/COPIO/7/KACHU #1/KIRITATI//KACHU | 2.5 | 1.66 | 5 | 5 | 0.6 | 0.33 | 3 | 1.66 | |
| 10 | 873 | 7645428 | 68.111/RGB-U//WARD/3/FGO/4/RABI/5/AE.SQUARROSA (809)/6/COPIO/7/KACHU #1/KIRITATI//KACHU | 3 | 1.16 | 5 | 5 | 0 | 0.66 | 0 | 3.33 | |
| 11 | 876 | 7645728 | DOY1/AE.SQUARROSA (318)/3/KACHU #1/KIRITATI//KACHU/4/PBW343*2/KUKUNA*2//FRTL/PIFED | 0.75 | 0.46 | 2.5 | 2.33 | 0 | 0.33 | 0 | 1.66 | |
| 12 | 878 | 7645480 | DOY1/AE.SQUARROSA (318)/3/KACHU #1/KIRITATI//KACHU/4/PBW343*2/KUKUNA*2//FRTL/PIFED | 0.25 | 0.26 | 2.5 | 1.33 | 0.75 | 1 | 2.5 | 5 |
Publisher’s Note: MDPI stays neutral with regard to jurisdictional claims in published maps and institutional affiliations. |
© 2022 by the authors. Licensee MDPI, Basel, Switzerland. This article is an open access article distributed under the terms and conditions of the Creative Commons Attribution (CC BY) license (https://creativecommons.org/licenses/by/4.0/).
Share and Cite
Saleem, K.; Shokat, S.; Waheed, M.Q.; Arshad, H.M.I.; Arif, M.A.R. A GBS-Based GWAS Analysis of Leaf and Stripe Rust Resistance in Diverse Pre-Breeding Germplasm of Bread Wheat (Triticum aestivum L.). Plants 2022, 11, 2363. https://doi.org/10.3390/plants11182363
Saleem K, Shokat S, Waheed MQ, Arshad HMI, Arif MAR. A GBS-Based GWAS Analysis of Leaf and Stripe Rust Resistance in Diverse Pre-Breeding Germplasm of Bread Wheat (Triticum aestivum L.). Plants. 2022; 11(18):2363. https://doi.org/10.3390/plants11182363
Chicago/Turabian StyleSaleem, Kamran, Sajid Shokat, Muhammad Qandeel Waheed, Hafiz Muhammad Imran Arshad, and Mian Abdur Rehman Arif. 2022. "A GBS-Based GWAS Analysis of Leaf and Stripe Rust Resistance in Diverse Pre-Breeding Germplasm of Bread Wheat (Triticum aestivum L.)" Plants 11, no. 18: 2363. https://doi.org/10.3390/plants11182363