Article

High-Density Linkage Mapping of Agronomic Trait QTLs in Wheat under Water Deficit Condition using Genotyping by Sequencing (GBS)

by
Nayyer Abdollahi Sisi
1,2,*,
Nils Stein
3,
Axel Himmelbach
3 and
Seyed Abolghasem Mohammadi
2
1
Department of Plant Breeding, IFZ Research Centre for Biosystems, Land Use and Nutrition, Justus Liebig University, 35392 Giessen, Germany
2
Department of Plant Breeding and Biotechnology, Faculty of Agriculture, University of Tabriz, Tabriz 51666, Iran
3
Leibniz Institute of Plant Genetics and Crop Plant Research (IPK), 06466 Seeland, Germany
*
Author to whom correspondence should be addressed.
Plants 2022, 11(19), 2533; https://doi.org/10.3390/plants11192533
Submission received: 28 July 2022 / Revised: 5 September 2022 / Accepted: 15 September 2022 / Published: 27 September 2022

Abstract

:
Improvement of grain yield is the ultimate goal for wheat breeding under water-limited environments. In the present study, a high-density linkage map was developed by using genotyping-by-sequencing (GBS) of a recombinant inbred line (RIL) population derived from the cross between Iranian landrace #49 and cultivar Yecora Rojo. The population was evaluated in three locations in Iran during two years under irrigated and water deficit conditions for the agronomic traits grain yield (GY), plant height (PH), spike number per square meter (SM), 1000 kernel weight (TKW), grain number per spike (GNS), spike length (SL), biomass (BIO) and harvest index (HI). A linkage map was constructed using 5831 SNPs assigned to 21 chromosomes, spanning 3642.14 cM of the hexaploid wheat genome with an average marker density of 0.62 (markers/cM). In total, 85 QTLs were identified on 19 chromosomes (all except 5D and 6D) explaining 6.06–19.25% of the traits phenotypic variance. We could identify 20 novel QTLs explaining 8.87–19.18% of phenotypic variance on chromosomes 1A, 1B, 1D, 2B, 3A, 3B, 6A, 6B and 7A. For 35 out of 85 mapped QTLs functionally annotated genes were identified which could be related to a potential role in drought stress.

1. Introduction

Drought caused by climate change affects crop production, especially under water-limited environments. Wheat (Triticum aestivum L.) is one of the fundamental global crops which are mostly cultivated in dry regions. Here water deficit can cause up to 50% yield reduction in wheat if compared to production under irrigation conditions [1]. In this context breeding for drought tolerance is a major concern globally.
Components of the grain yield in wheat are complex and multigenic with low heritability which are highly affected by environmental conditions, especially drought stress [2]. Moreover, yield and yield components traits like number of spikes, number of grains per spike, and 1000 kernel weight as well as some morphological and physiological traits have been recognized as relevant traits to drought tolerance [3]. To develop drought tolerant varieties it is essential to understand the genetic basis of these complex traits [4], thus identification of quantitative trait loci (QTL) and genes for important agronomical traits such as grain yield and its components is a key component of crop improvement programs [5]. To date, a large number of QTLs associated with yield component traits and grain yield under water deficit condition [1,2,3,6,7,8,9,10,11,12,13,14] and normal condition [15,16,17,18,19,20,21,22,23,24,25,26,27,28,29] have been identified on all 21 wheat chromosomes.
To precisely map QTLs underlying the traits of interest, a high-density linkage map is a prerequisite. Today, single nucleotide polymorphisms (SNPs) are the marker of choice for the development of high-density linkage map in crops such as wheat due to their abundance, genome coverage, stability, efficiency, and cost effectiveness [7,30]. Among SNP genotyping methods Genotyping-by-Sequencing (GBS) has emerged as a robust approach that allows performing SNP detection and genotyping simultaneously [31]. GBS is an easy, flexible, cost effective and highly reproducible approach that has been applied to dissect the genetic bases of grain yield-related traits in wheat. Zhou et al. [32] used GBS and the iSelect 9K assay to construct linkage map (spanning 2934.1 cM) in a wheat doubled-haploid population and identified 45 QTLs associated with six spike traits. Using 327,609 GBS-based SNP markers in a panel of 768 wheat cultivars Pang et al. [33] detected 395 QTLs for 12 agronomic traits in seven environments. Genome wide association study (GWAS) approach using 78,606 GBS SNP markers was performed to identify QTLs associated with agronomic and disease resistance traits in 44,624 wheat lines [34]. They could identify stable QTLs for GY on chromosomes 2A, 3B, 4D and 6A across multiple environments [34]. Additionally, GWAS study was performed using GBS SNP markers in 720 wheat lines, and genomic regions on chromosomes 2B, 3A, 4A, 5B, 7A and 7B associated with grain yield and yield stability across multiple irrigated and water stress conditions were reported [21].
The Iran #49 (hereafter referred to as #49) × Yecora Rojo recombinant inbred line (RIL) population has been previously characterized for root and shoot traits using SSR and retrotransposon-based (IRAP and REMAP) markers [35]. Due to low marker density in the respective linkage map, the observed marker-QTL linkages were still inappropriate for marker-assisted breeding. In the present study, we applied GBS to construct a high-density genetic linkage map and performed drought-related QTL identification in wheat. Our objectives were to: (1) construct a high-density linkage map using GBS-based SNP markers; (2) map QTLs for grain yield and related traits in a wheat RIL population under irrigated and water deficit conditions; and (3) identify potential candidate genes for these QTLs based on their tight genetic/physical linkage and functional annotation.

2. Results

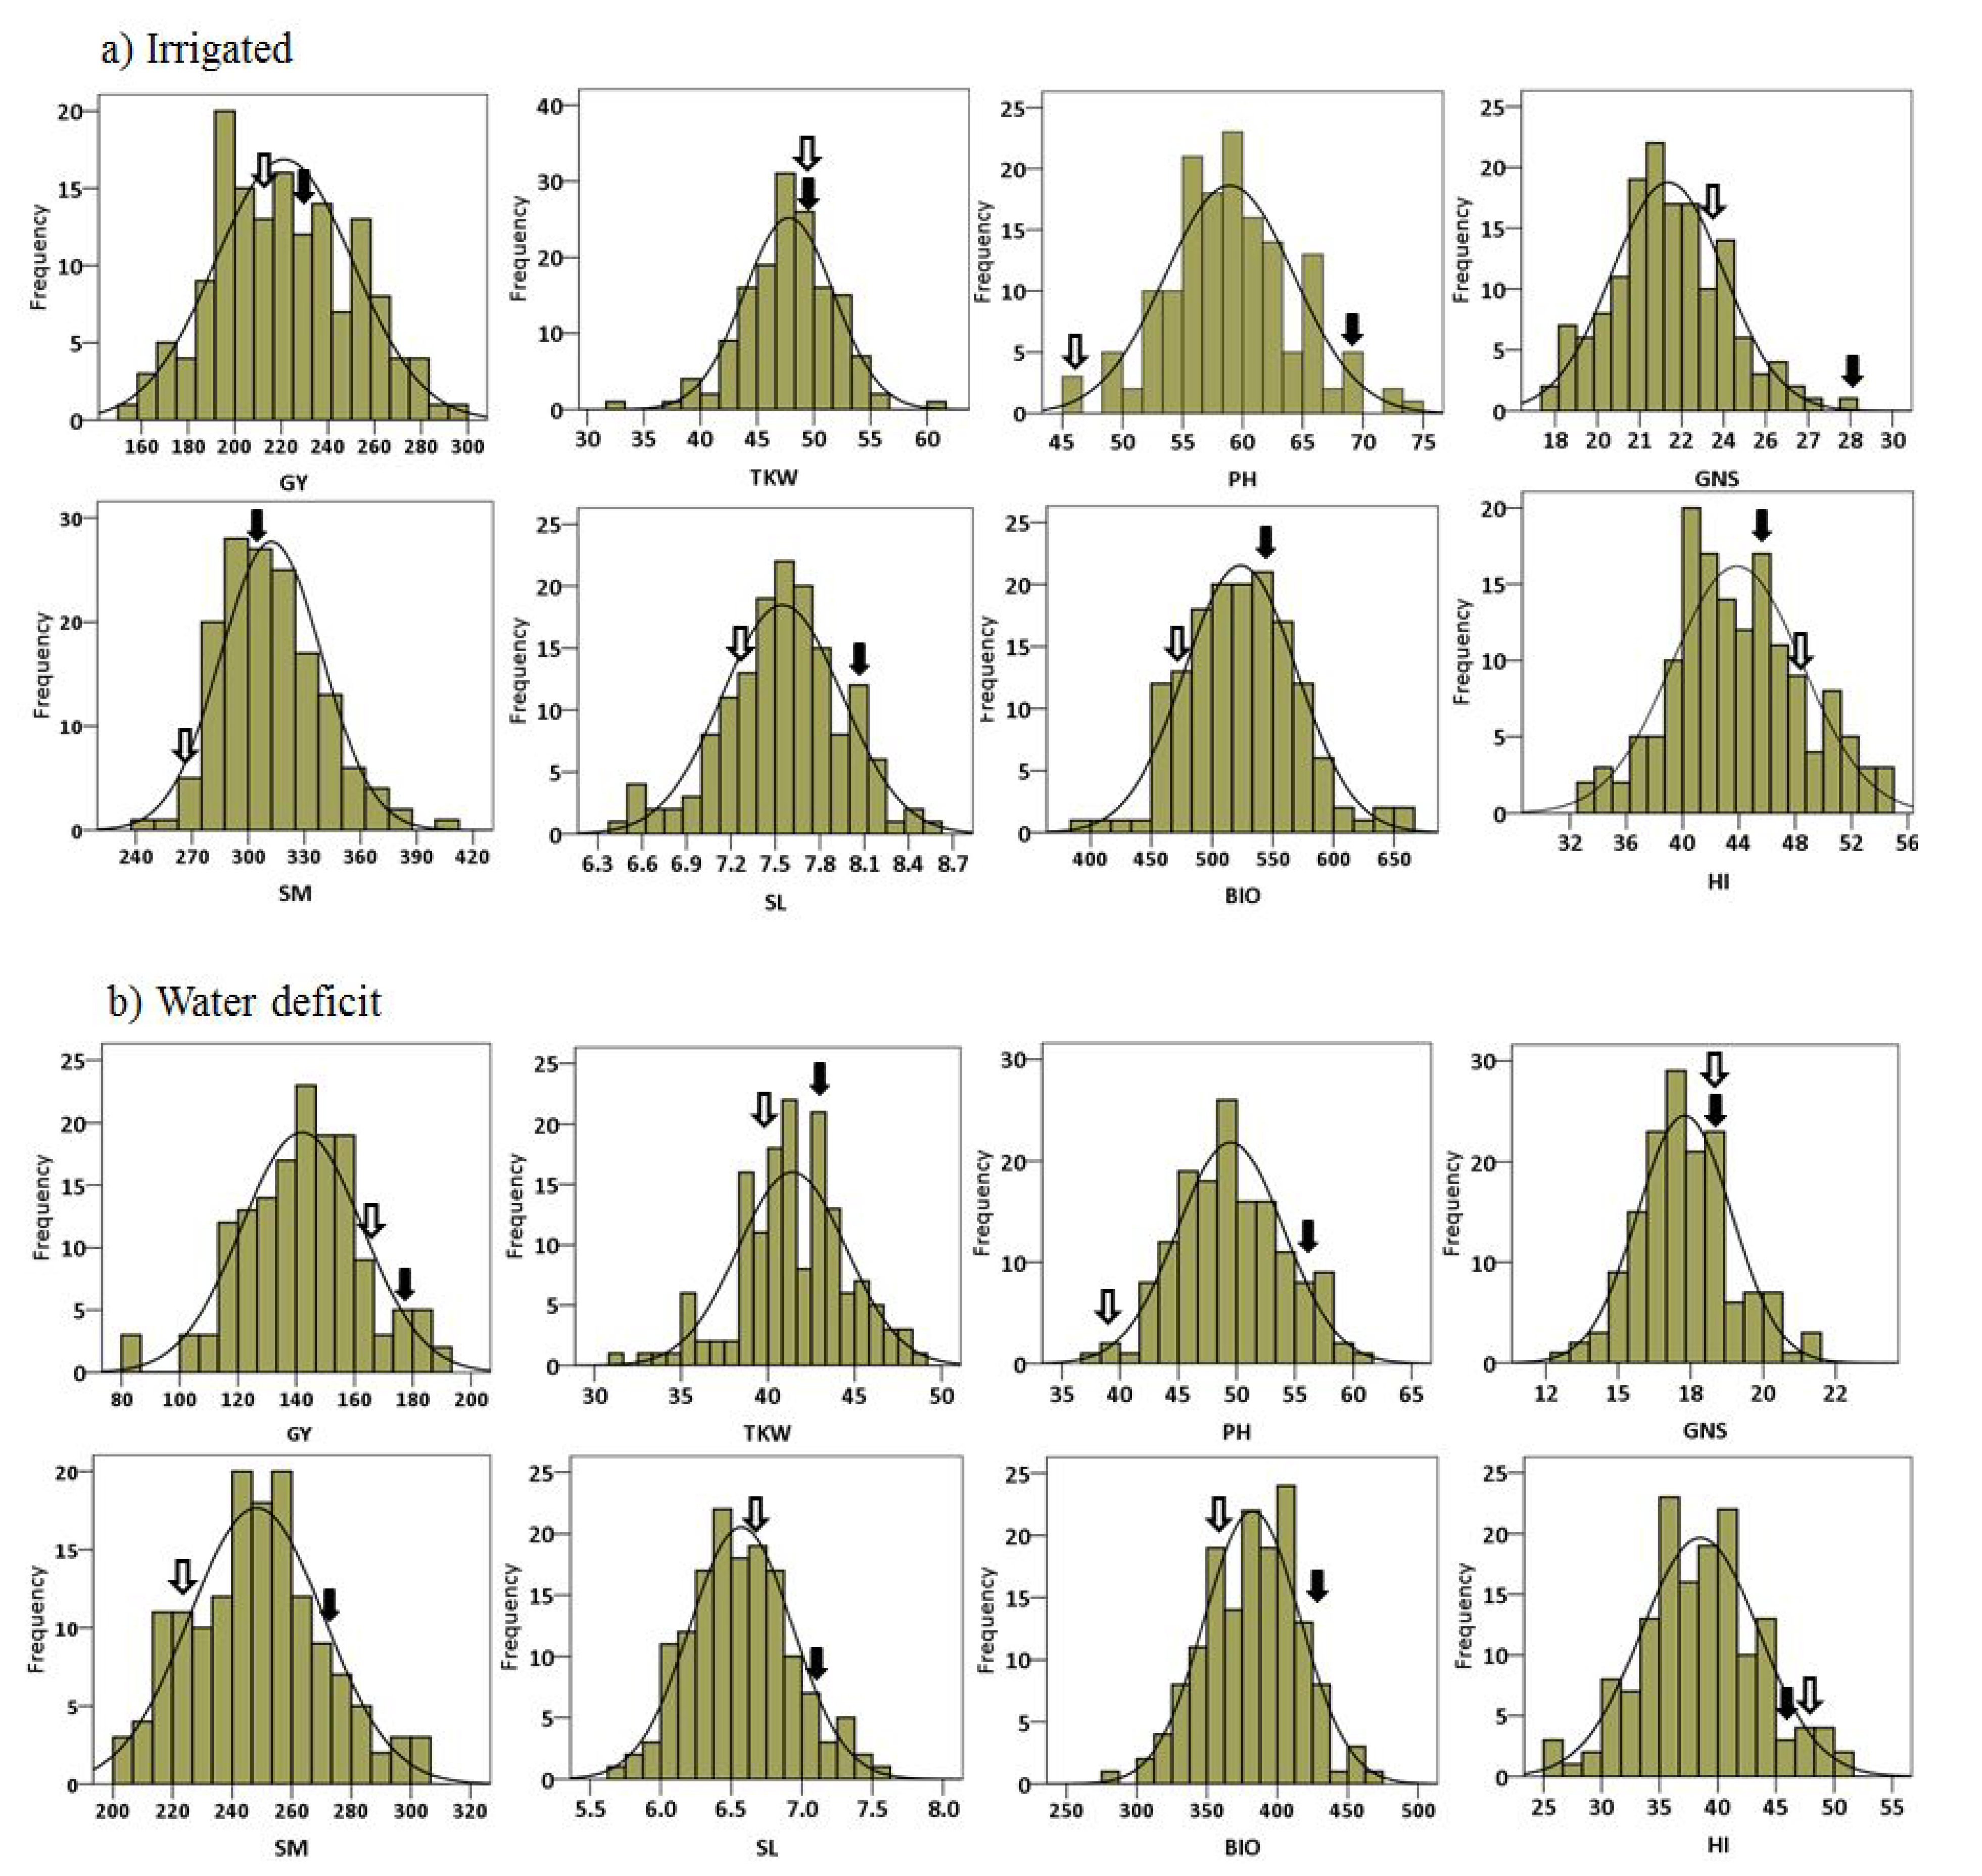
2.1. Phenotypic Data Analysis

A total of 148 RILs as well as parents were grown at three locations and over two years to test performance under irrigation and water deficit regimes. Eight traits were recorded: GY, PH, SM, TKW, GNS, SL, BIO and HI. The combined mean distribution of the traits over six environments (three locations and two years) under irrigated and water deficit conditions are presented in Figure 1a,b, respectively. The results revealed the normal distribution of the traits in the population. For all the studied traits except HI, #49 had higher mean values compared with Yecora Rojo under both conditions (Table S1 supplementary data). GY was positively correlated with all other traits under irrigated and water deficit conditions; however, the correlation between PH and GY under water deficit conditions was not significant. Strong correlations were observed between GY and HI as well as BIO under both conditions. The correlations between SM and PH, SL and GNS were negative and significant under irrigated conditions, whereas these correlations were not significant under water deficit conditions. BIO showed significant positive correlation with all the traits under both conditions except for HI. Negative correlations of SM with GNS, PH, SL and TKW indicate competition between yield components and traits such as plant height for available resources during plant growth (Table 1).

2.2. Genome Wide SNP Discovery by GBS

In total, 481.3 million reads were generated and 98% of them were mapped to the Chinese Spring reference genome. The number of reads per samples varied from 2.0 to 4.6 million reads with an average of 3.0 million reads. We required a read depth of four independent sequence reads for homozygous and heterozygous genotype calls, thus our 4-fold coverage SNP matrix was used in subsequent analysis. A total of 35,405 SNPs with a MAF = 0.05 were detected by the SAMtools pipeline based on wheat RefSeqv1.0 [36]. After removing SNPs with ≥ 20% missing values, a total of 7788 polymorphic SNPs distributing across all 21 wheat chromosomes, based on their predicted physical position, were used for further analyses (Table 2). The maximum (785) and minimum (27) number of SNPs were mapped on chromosome 2B and 4D, respectively.

2.3. Linkage Map Construction

A total of 7788 SNP markers were used for map construction and out of which 5831 SNPs were mapped on 21 linkage groups corresponding to the 21 chromosomes of hexaploid wheat (Figure 2). The linkage map spanned a total length of 3642.14 centiMorgan (cM) with an average marker density of 0.62 cM. A total of 2933 (50%) and 2454 (42%) markers were mapped to the B and A genome, respectively, covering 1519.70 and 1566.64 cM of these two genomes. Only 444 out of 5831 SNPs were mapped to the D genome spanning a length of 555.8 cM, indicating a much lower level of polymorphism in D compared to the A and B genomes. The number of markers in the different chromosomes ranged from 570 (2B) to 15 (4D), respectively, and chromosome 3D exhibited the lowest marker density (2.89 cM between two adjacent markers) (Table 2).

2.4. QTL Mapping

A total of 85 QTLs were identified for the studied traits across three locations (Mahabad, Miandoab and Tabriz, Iran) during two years and mean of three locations under irrigated and water deficit conditions (Table 3). The Logarithm of Odds (LOD) score of the detected QTLs varied from 2.55 to 10.60 with an average 4.5 explaining 6.06 to 19.25% of the trait’s phenotypic variation (mean 10.6%). No QTL was identified on chromosomes 5D and 6D. The number of QTL varied from 19 for PH to seven for SM, GNS and BIO. For 38 QTLs, additive effect was positive and for 47 QTLs was negative, indicating inheritance to the offspring of favorable alleles in theses loci from either #49 or Yecora Rojo, respectively. Five QTLs were stably identified across irrigated and water deficit conditions. The chromosomes 4A and 6B possessed QTLs associated with most of the traits (PH, SL, GNS, BIO and GY) and (PH, SM, TKW and GY), respectively. Genetic positions of yield-related trait QTLs are shown in Figure 3a–c.

2.4.1. Grain Yield (GY)

In total, eight QTLs were detected for grain yield with LOD ranging from 3.49 to 4.22 and R2 values from 8.30 to 10.5% (Table 3, Figure 3a–c). Among these, six QTLs on chromosomes 2A, 4A and 6B (4) and two QTLs on chromosome 2A were identified under irrigated and water deficit conditions, respectively. The favorable alleles for GY at the loci on chromosomes 4A and 6B were contributed by #49, and those on chromosome 2A were inherited from Yecora Rojo.

2.4.2. Plant Height (PH)

For plant height, 10 QTLs on chromosomes 2B, 3A, 3D, 4B (2), 4D, 6B (2), 7A and 7B with LOD ranging from 3.59 to 10.60 and R2 from 6.20 to 19% were mapped under irrigated conditions (Table 3, Figure 3a–c). Under water deficit conditions, nine QTLs for PH were identified on chromosomes 4A, 4B, 4D, 7A (5) and 7D with LOD ranging from 3.81 to 6.13 explaining 8.9–14.0% of the trait phenotypic variance. The favorable alleles were contributed by Yecora Rojo at all loci except for QTL on chromosome 6B under water deficit conditions. The two QTLs on chromosome 4B and 4D were consistent under both conditions.

2.4.3. Number of Spikes per Square Meter (SM)

Six QTLs on chromosomes 5A, 2B and 6B under irrigated and one QTL on chromosomes 2B under water deficit conditions were mapped. The LOD scores ranged from 3.68 to 8.01 with R2 value ranging from 8.70 to 17.6%. The #49 contributed the favorable alleles at all the loci except for QTLs on chromosome 2B (Table 3, Figure 3a–c).

2.4.4. 1000. Kernel Weight (TKW)

For 1000 kernel weight, 13 QTLs with LOD ranging from 3.32 to 5.17 were identified (Table 3, Figure 3a–c). QTLs identified under irrigated conditions were mapped to chromosomes 1B (3), 5B (2) and 6B explaining 7.90–14.61% of phenotypic variance and seven QTLs identified under water deficit conditions were allocated to chromosomes 3B (2), 4B (2), 5B (2) and 7B explaining 8.30 to 11.60% phenotypic variation. For TKW, favorable alleles at the identified QTLs were contributed by both parents.

2.4.5. Number of Grains per Spike (NGS)

Seven QTLs were identified for number of grains per spike on chromosomes 1A, 3A, 4A (3) and 7D (2) with LOD score from 2.82 to 7.58 and R2 from 6.6 to 19.25% and both parents contributed the favorable alleles (Table 3, Figure 3a–c). Among these, three QTLs were found under irrigated and four QTLs under water deficit conditions. The QTL on 4A was stable at two locations and under two conditions.

2.4.6. Spike Length (SL)

Spike length was affected by nine QTLs mapped to chromosomes 2A, 2B, 3A, 3B, 4A (2), 7A and 7D (2) with R2 from 7.40 to 19.18% and LOD score from 3.27 to 7.15 under two conditions (Table 3, Figure 3a–c). Both parents contributed favorable alleles at the identified QTLs.

2.4.7. Biomass (BIO)

Totally seven QTLs on 1B (2), 1D, 4A (2) and 5A (2) were associated significantly with biomass (Table 3, Figure 3a–c). BIO QTLs explained the phenotypic variation with an average 10.16% and their LOD score varied from 3.65 to 4.43. Except for loci on 5A, #49 contributed alleles for increasing biomass.

2.4.8. Harvest Index (HI)

For the harvest index, we detected seven QTLs on 1B (2), 2A (2), 3D and 6A (2) and eight QTLs on 1B (2), 2D, 3B (4) and 5A under irrigated and water deficit conditions, respectively (Table 3, Figure 3a–c). HI QTLs explained an average of 10.63% phenotypic variation and the LOD score ranged from 2.55 to 6.43. Both parents contributed alleles to affect this trait.

3. Discussion

Improving grain yield under water deficit conditions is of utmost importance for wheat breeding programs for arid and semi-arid regions of the world. To study drought tolerance related genomic regions, QTL mapping has been conducted using GBS in a RIL population derived from a cross between #49 × Yecora Rojo under irrigated and water deficit conditions. Due to simultaneous discovery and genotyping of a large numbers of SNPs, cost-efficiency and flexibility, GBS has been applied to mapping of QTLs in several plant species including wheat [21,32,33,34,37,38]. We employed GBS to genotype 148 recombinant inbred lines and two parental lines. After filtering against low-quality markers, 7788 high quality SNPs were used to generate a linkage map.
In the present study, 85 putative QTLs for grain yield and its related traits were identified on 19 out of 21 chromosomes of hexaploid wheat (Table 3, Figure 3a–c). We could identify unique QTLs for studied traits that were likely not detected in the previous studies. This population revealed high-effect QTL under water deficit conditions for spike length in the interval of 59.9–75.5 Mb of 7A with 19.18% R2 and 7.15 LOD score (Qsl-Wd.mah-7A) and favorable alleles were contributed by Yecora Rojo. SL QTL Qsl-Wd.mia-2B detected on 2B spanning from 26.5 to 33.7 Mb (with 11.64% R2) has not also been reported. For TKW under water deficit conditions, two unique QTLs, Qtkw-Wd.mah-3B and Qtkw-Wd.mia-3B, with 11.59 and 8.60% R2, were identified on 3B (20.4–28 Mb). GNS QTL, Qgns-Wd.mia-1A, was mapped on 1A (12–14.8 Mb) and explained the 11.10% phenotypic variation. The genomic regions on chromosome 1B contained BIO QTLs (Qbio1-Wd.mia-1B and Qbio2-Wd.mia-1B) spanning from 9.6 to 16.4 Mb and HI QTLs (Qhi1-Wd.tab-1B and Qhi2-Wd.tab-1B) spanning from 420.5 to 427 Mb. In this study, some unique QTLs related to irrigation conditions were also identified, the high effect of which was Qhi-Irr.mia-6A (580–595 Mb) with a 14.20% R2 and 6.43 LOD score. Two QTLs on chromosome 6B spanning from 28 to 35 Mb (43 and 49 cM) were co-localized for GY and SM under irrigation conditions that explained an average of 9.28% phenotypic variation, and the LOD score ranged from 3.65 to 4.22. BIO QTL (Qbio-Irr.mia-1D) on chromosome 1D (34–250 Mb) and PH QTL (Qph-Irr.3P-3A) on chromosome 3A (33.4–37.2 Mb) were identified under irrigation conditions and explained 10.78 and 8.30% of the phenotypic variation, respectively. To date, numerous QTL associated with grain yield and yield components have been reported by using various populations. However, different QTL expression and its position may be influenced by factors such as type and size of population, density of the linkage map, analytical tools and the environmental conditions used in different studies [39].
The corresponding loci that were previously reported for yield-related traits in the same interval were extracted from literature and are shown in Supplementary Table S2 and Figure S1. This study mapped TKW QTLs (Qtkw1-Irr.mah-1B, Qtkw2-Irr.mah-1B and Qtkw-Irr.mia-1B) in the interval of 639–646.1 Mb of chromosome 1B explained the phenotypic variation with an average 12.74%, which were reported for QTLs associated with TKW and GY [6,40]. In the interval of 20–33 Mb of 2A, three GY (Qgy-Irr.mia-2A, Qgy-Wd.mia-2A and Qgy-Wd.3P-2A) and a SL (Qsl-Wd.3P-2A) QTLs were found, in which QTLs associated with GY and PH have been reported in the literature [34,41,42]. We mapped SM QTL (Qsm-Wd.tab-2B) on 2B spanning from 493.6 to 548.6 Mb, which have been reported for PH and GY [10,43]. Identified QTLs for PH (Qph-Irr.3P-2B) and SM (Qsm1-Irr.3P-2B and Qsm2-Irr.3P-2B) on chromosome 2B (770–780.5 Mb) were also in a similar region of the PH QTLs reported by Zanke et al. [42]. Qgns-Irr.mah-3A and Qsl-Irr.tab-3A were mapped on 695.6–707.9 Mb of chromosome 3A, and this loci could correspond to the QTL for GY identified by Bhatta et al. [6]. A region of 3B (37.6–44.8 Mb) contained SL QTL Qsl-Wd.mah-3B explained 8.8% variation in SL corroborate with the findings of Li at al. [17]. We identified a 6 Mb region on 3D (453.9–459.2 Mb) associated with PH and HI, of which the HI QTL was also mapped in a similar region by Bhatta et al. [6]. In addition to the grain yield QTLs, a set of QTLs associated with PH and BIO was identified on chromosomes 4A. QTL cluster on chromosome 4A includes Qgy-Irr.mah-4A, Qph-Wd.3P-4A, Qbio-Irr.mah-4A and Qbio-Irr.3P-4A were mapped in a flanking region from 612 to 621 Mb, which explained the phenotypic variation with an average 9.5%. Previously, QTLs for grain yield and its components have been localized in this interval [6,9,13,14,16,18,44]. A region on 4A (632.2–684.9 Mb) contained QTLs for GNS (Qgns1-Irr.tab-4A, Qgns2-Irr.tab-4A and Qgns-Wd.3P-4A) and for SL (Qsl1-Irr.tab-4A and Qsl2-Irr.tab-4A) with an average of 14.32% and 8.92% phenotypic variation, respectively. QTLs at similar locations were previously reported for PH [10], GNS and TKW [15]. Several significant QTLs for PH (Qph1-Irr.tab-4B, Qph2-Irr.tab-4B and Qph-Wd.tab-4B) and for TKW (Qtkw1-Wd.tab-4B and Qtkw2-Wd.tab-4B) were detected in the interval of 21.5–37.5 Mb of 4B, explaining 8.4–19% of phenotypic variation. This region contains Rht-B1 gene regulating plant height. Previously, QTLs associated with PH, SL, GY and GNS have been reported in this region [15,17,24,29,33]. In the interval of 112–342.7 Mb on 4D, PH QTLs (Qph-Irr.tab-4D and Qph-Wd.tab-4D) were mapped with R2 value ranging from 9.04 to 18.6%. This genomic region, containing Rht-D1 gene, have been reported by several studies for carrying QTLs associated with PH, GY, BIO and TKW [23,28,45,46,47]. These two genomic regions on 4B and 4D were detected under both irrigated and water deficit conditions with strong effects on plant height, and alleles contributed by Yecora Rojo reduced plant height. Basically, dwarfing is one of the morphological responses to drought stress [48]. Besides the Rht loci, genes required for vernalization response (Vrn) have also attracted attention of breeding to improve plant adaptation by flowering at the appropriate time. Therefore, identifying QTLs for yield-related traits close to Vrn genes can be predicted [11]. In the present study, QTLs associated with SM Qsm-Irr.tab-5A and Qsm-Irr.3P-5A explaining 13.8 to 17.6% variation, mapped closely to the VrnA1 gene on chromosome 5A (581–589 Mb). Likewise, some QTLs associated with various traits have been previously reported in this genomic region [42,49]. Genomic regions spanning from 360.4–445 Mb on chromosome 5B were detected controlling TKW. The identified QTLs (Qtkw1-Irr.tab-5B, Qtkw2-Irr.tab-5B, Qtkw1-Wd.tab-5B and Qtkw2-Wd.tab-5B) explained 8.30 to 13% of phenotypic variation. QTLs associated with TKW and GY have been localized in the similar interval of 5B by previous studies [15,46,50]. The present study also confirmed QTLs for TKW (Qtkw-Irr.tab-6B) and PH (Qph1-Irr.mia-6B and Qph2-Irr.mia-6B) in 659.5–676 Mb of 6B, which have been previously reported [8,28]. Under water deficit conditions, five PH QTLs (Qph1-Wd.mia-7A, Qph2-Wd.mia-7A, Qph1-Wd.3P-7A, Qph2-Wd.3P-7A and Qph3-Wd.3P-7A) were mapped in the interval of 15.5–28.5 Mb of 7A explaining 8.9–11.4% variation in PH. Acuña-Galindo et al. [51] using SNP markers identified BIO QTL in the similar interval under drought and heat stress. A QTL associated with PH (Qph-Irr.3P-7B) was mapped on 7B (648.7–657.8 Mb) which reported by Zanke et al. [42] for plant height. A region on 7B spanning from 693–703.9 Mb have been previously associated with TKW [40], PH [52] and GNS [14], which co-localized with TKW QTL in this study under water deficit stress (Qtkw-Wd.tab-7B). QTLs associated with GNS (Qgns1-Wd.mah-7D) and SL (Qsl1. Irr.tab-7D and Qsl2. Irr.tab-7D) were identified in the interval of 89.3–105 Mb of 7D explained 6.6–9.10% of phenotypic variation. This locus was already detected controlling GY [28], GNS [14,17], PH [42] and TKW [40,53].
We aimed to predict candidate genes for QTL function on the basis of the structural and functional gene annotation provided with Chinese Spring RefSeqv1.0 [36]. The important putatively drought-related genes underlying the QTL intervals are listed in Table 4. Since the physical intervals of several QTLs overlapped with each other, the same annotated gene is co-located with more than one QTL.
Potential candidate genes underlying Qtkw-Wd.tab-7B, Qsl1-Irr.tab-4A and Qph1-Irr.mia-6B were annotated as F-box family protein. F-box proteins play a role in responses to hormones [54,55], light and abiotic stress [56,57]. Other putatively drought-related genes for PH QTLs on chromosomes 4B under irrigated and water deficit conditions belonged to the gene class of protein kinases. Generally, protein kinases are involved in drought response as regulatory proteins. Mao et al. [58] reported that a serine/threonine-protein kinase of wheat increases multi-stress tolerance in Arabidopsis. The gene underlying Qph1-Wd.mia-7A and Qph1-Wd.3P-7A identified under water deficit condition was a 60 kDa chaperonin protein. The 60 kDa chaperonin, like other heat-shock proteins, are induced by hot temperatures, salinity, cold and water deficit stress as a protective mechanism [59,60]. NBS-LRR disease resistance protein genes were present in chromosomal regions of two QTLs under water deficit condition for grain yield and spike length on chromosomes 2A and 2B, respectively. Improvement of drought tolerance by enhanced expression of NBS-LRR genes was reported by Chini et al. [61]. The function of candidate genes underlying Qtkw-Wd.mah-3B and Qsl-Wd.3P-2A were annotated as AP2-EREBP transcription factor and ABC transporter protein, respectively. Liu and et al. [62] and Song and et al. [63] reported the role of an AP2-EREBP transcription factor in signal transduction pathways in drought and ABA responses. Furthermore, some members of the ABC transporter family proteins mediate the transport of acyl-coenzyme A [64] which contributes to drought tolerance. An NAD(P)H-quinone oxidoreductase was located within marker intervals for GNS QTLs (Qgns2-Irr.tab-4A, Qgns-Wd.3P-4A and Qgns2-Irr.tab-4A) on chromosome 4A. NAD(P)H-quinone oxidoreductase inhibits the production of semiquinones and oxygen radicals by the reduction of quinones to quinols [65]. Cysteine proteinase genes were co-located with grain yield QTLs on chromosome 6B identified in irrigated condition. The role of cysteine proteinases family in wheat under severe drought [66] and salinity, drought, oxidation and cold stress [67] has been established. Another important response to abiotic stress particularly drought is the elimination of reactive oxygen species (ROS) which is performed by different kind of detoxification proteins. In present study, a gene related to detoxification function was found within QTL intervals for PH on chromosome 7A (Qph-Irr.tab-7A). Cytochrome P450 genes were identified for HI QTLs intervals on chromosomes 2A (Qhi2-Irr.mia-2A) and 1B (Qhi2-Irr.tab-1B). Cytochrome P450 genes are members of a large superfamily enzyme which involved in drought stress response [68]. Ubiquitin-conjugating enzyme E2 was annotated on QTLs underlying 1000 kernel weight on chromosome 1B (Qtkw1-Irr.mah-1B and Qtkw-Irr.mia-1B). Ubiquitinylation is a multi-step reaction for protein degradation and plays an important role in light signaling, biotic and abiotic stress responses [69].

4. Materials and Methods

4.1. Plant Materials

The mapping population consisted of 148 F8 recombinant inbred lines (RILs) derived from a cross between genotype Iran #49 and Yecora Rojo. Iran #49 is a tall late spring landrace collected at Allary, 30°56′, 61°39′, alt. 530 m, average rainfall = 50 mm, in Bluchestan, southeast Iran with a large root system. Yecora Rojo is spring wheat variety from Mexico which was cultivated in Southern California for more than 40 years, which is carrying two dwarfing genes and is characteristic for its shallow root system [35]. The parental lines were different for a number of phenological, morphological, and agronomic traits including grain yield and plant height.

4.2. Experimental Design and Phenotypic Evaluation

Field trials were conducted during growing seasons of the years 2008–2009 and 2009–2010 at the University of Tabriz, Faculty of Agriculture research farm (N 46°, 17′ E 38°, 05′ and 1360 m), and in the growing seasons of the years 2013–2014 and 2014–2015 at the PayamNour University of Mahabad, Mahabad research station (N 45°43′, E 36°01′ and 1320 m) and Miandoab Agricultural and Natural Resource Station farm (N 46°06′, E 36°58′ and 1314 m), respectively, under irrigated and water deficit conditions at the flowering stage, resulting in a total of 12 environments. In each station, the 148 RILs and two parental lines were planted in an alpha lattice design with two replications each consisting of ten incomplete blocks with 15 genotypes, both under water deficit and irrigation conditions. Each line was sown in three rows of 2.5 m length with inter- and in-row spacing of 20 and 5 cm, respectively. Irrigation in non-stress conditions was done after 70 mm evaporation from class A Pan corresponded to soil water potential of −0.5 MPa and in water deficit conditions was performed after 130 mm evaporation from class-A Pan corresponded to soil water potential of −1.2 MPa. In the stressed treatment, water deficit stress was induced by stopping irrigation from 50% heading to physiological maturity in order to simulate terminal drought stress. The following phenotypic traits were recorded: The number of spikes per square meter (SM) was recorded at physiological maturity and plant height (PH) was measured in centimeters (cm) from the ground to the tip of the spike from 10 randomly sampled and tagged plants in each plot before harvesting. The spike length (SL) [measured in cm] and the numbers of grains per spike (NGS) were recorded after harvesting from the main tillers of 10 randomly selected plants. Thousand kernel weight (TKW) was determined measured from randomly sampled 1000 seeds after harvest and expressed in g/1000 seed. The grain yield per plot (GY) and biomass were determined as the weight (grams) of the grain from a plot where the plot sizes were 2.5 m rows with 50 plants after eliminating borders. Finally, the harvest index (HI) was calculated as the proportion of the total biomass devoted to grain yield.

4.3. GBS Library Construction, Genotyping and SNP Calling

DNA was extracted and purified from the leaf tissue of the RILs and parental lines using Guanidine thiocyanate-based DNA isolation technique. Briefly, six centimeters of two-week-old of leaves were harvested and transferred into 1.1 mL 8-strip mini tubes (supplier, type) together with two 4mm glass beads and homogenized by using a 96-well block holder and a Retsch MM 400 mixer mill (Retsch GmbH, Haan, Germany) for a minimum of 1 min at 30 Hz frequency. 600 μL preheated GTC extraction buffer (1 M Guanidine thiocyanate, 2 M NaCl, 30 mM NaAc pH 6.0) was added to the tubes and incubated at 65 °C for 30 min. After spinning for 30 min at 4000 rpm using a table top centrifuge, 480 μL of the supernatants were transferred to a 96-Well AcroPrep Advance plate (Thermo Fisher Scientific GmbH, Dreieich, Germany) for vacuum filtration. 900 μL wash buffer (50 mM NaCl, 10 mM Tris/HCl pH 8, 1mM EDTA, Ethanol 70%) was added twice and the vacuum was applied with a vacuum manifold after every washing step. The 96-Well AcroPrep Advance plate was placed onto a NUNC 96-well plate (Thermo Fisher Scientific GmbH, Dreieich, Germany) and 100 μL preheated 1x TE light elution buffer (0.1 mM EDTA, 10 mM Tris/HCl pH 8) was pipetted to each well. Extracted DNA was eluted by spinning at 3500 rpm for 10 min. DNA quality and concentration were checked by running electrophoresis of 1% agarose gels (Invitrogen, Carlsbad, CA, USA) in 1X TBE buffer (89 mM Tris, 89 mM Boric acid, 2 mM EDTA pH 8.0) and by using Qubit 2.0 Fluorometer (Invitrogen, Carlsbad, CA, USA) were used.
GBS libraries were constructed for each RIL and parental lines according to a previously described protocol [70]. Libraries comprising 150 individually barcoded samples were sequenced as a pool in three lanes of an Illumina HiSeq2500 (Illumina Inc., San Diego, CA, USA). The length of single-end reads was 100 bp. Each of the RILs and parents were sequenced three and six times, respectively, to specify the minimum required number of reads per sample. Raw data processing followed a previously established reference-based GBS pipeline using SAMtools [71]. First, sequence reads were quality- and adaptor-trimmed and then mapped against Chinese Spring RefseqV1.0 [36]. Variant filtering was done with the following parameters: minimum minor allele frequency 0.05, maximum fraction of missing genotype call 0.9 and minimum read depth 4 for both of homozygous and heterozygous genotype calls. As the maximum expected residual heterozygosity for RIL population is 10%, this parameter was set to 0.1. Identified SNPs were named as “chromosome name_ physical position” i.e., chr4A_614700608. All unknown or heterozygous SNPs in the parents as well as those with >20% missing data were excluded from further analysis.

4.4. Linkage Map Construction and QTL Mapping

A total of 7788 SNPs were used for construction of a linkage map based on 148 RILs. Linkage analysis was performed using the regression mapping function in JoinMap 4.1 (Kyazma B.V., Wageningen, The Netherlands) [72] with LOD values in the range from 3 to 8. The Kosambi mapping function was used to convert recombination frequency to genetic distance based on centi-Morgan [73]. The identical markers and unmapped SNPs were removed automatically by JoinMap. The loci with significant segregation distortion (p ≤ 0.01) were also excluded. QTLs were identified by composite interval mapping (CIM) based on model 6 and forward and backward regression to select cofactors implemented in WinQTL Cartographer V2.5 software [74]. The QTL threshold for the studied traits (LOD significance threshold) was estimated by 1000 permutations. The percentage of phenotypic variance explained by each QTL and their additive effect were also evaluated. Each QTL was denominated as “Q” (abbreviation of QTL)+ trait name+ trial name+ chromosome name. For example, Qtkw-Wd.mia-3B reveals QTL for thousand kernel weight under water deficit conditions in Miandoab in which it stands on 3B chromosome. MapChart (version 2.3) software [75] was used for the graphical presentation of linkage maps and QTL positions. The physical position of flanking markers surrounding identified QTLs were extracted and used to search on the IWGSC_RefSeq v1.0 assembly. Gene IDs present in each of physical intervals were obtained from JBrowse. The annotation of the gene was then retrieved from the Functional Annotation_v1 of IWGSC_RefSeqv1.0, which is publicly available at https://wheat-urgi.versailles.inra.fr/Seq-Repository/Annotations (accessed on 21 October 2018).

5. Conclusions

The results of present study indicate that GBS methods provide an opportunity to develop a high-density linkage map for the RIL population derived from a cross between #49 and Yecora Rojo, and precise identification of QTLs for grain yield and its components. For grain yield and its related traits 20 novel QTLs explaining 8.87–19.18% of phenotypic variance were mapped on chromosomes 1A, 1B, 1D, 2B, 3A, 3B, 6A, 6B and 7A. We could identify two stable QTLs for plant height under irrigated and water deficit conditions, which they were associated with Rht-B1 and Rht-D1 genes on chromosomes 4B and 4D, respectively. Some linkage groups had QTLs associated with several traits showing pleiotropic effects, which might be interesting for gene pyramiding. In addition, annotation of genes underlying the QTL intervals revealed their potential role in drought stress responses. These QTLs and potential candidate genes can be further analyzed and validated for breeding applications.

Supplementary Materials

The following supporting information can be downloaded at: https://www.mdpi.com/article/10.3390/plants11192533/s1, Table S1: Phenotypic performance for grain yield (GY), Plant height (PH), Number of grain per spike (GNS), 1000 kernel weight (TKW), Spike length (SL), Number of spike per m2 (SM), Biomass (BIO) and Harvest index (HI) for recombinant inbred lines and their parents across all environments under irrigated and water deficit conditions; Table S2: Coincidences of significant QTLs in this study with QTL regions reported previously; Figure S1: Coincidences of significant QTLs in this study with QTL regions reported previously. Each chromosome is represented by physical positions Mb (on the left) and identified QTLs (on the right). QTL names indicate the trait, trail (water condition+ environment) and chromosome name along with different colors: GY (red), PH (green), SM (yellow), TKW (pink), GNS (blue), SL (light blue), BIO (black), HI (brown). Identified QTLs under irrigated and water deficit conditions are represented by solid filled and stripes filled box, respectively. QTL regions reported by previous studies are shown by non-filled black box. KN: kernel number, KW: kernel width, DM: Dry mass accumulation, DSI: drought susceptibility index, NSS: number of spikelet per spike, SSN: Sterile spikelet number, CL: Coleoptile length, DTH: days to heading, DTA: days to anthesis, ShL: Shoot length, CID: carbon isotope discrimination, SG: stay green, NDVI: normalized differential vegetative index, ClF:Chlorophyll fluorescence.

Author Contributions

N.A.S. performed phenotyping and all data analysis and wrote the first draft of the manuscript. S.A.M. supervised and contributed to experimental design and phenotyping and revised the paper. A.H. performed GBS sequencing. N.S. checked data analysis, provided GBS experiment and revised the paper. All authors have read and agreed to the published version of the manuscript.

Funding

This research was funded by Iran National Science Foundation (INSF) under vote No. PHD95100692.

Acknowledgments

We thank Susanne König and Ines Walde for technical assistance on libraries and sequencing and Center of Excellence in Cereal Molecular Breeding, University of Tabriz for providing fun for filed experiments. The authors are grateful to Martin Mascher and Parastoo Hoseinzadeh for helping with GBS data analysis.

Conflicts of Interest

The authors declare no conflict of interest.

References

  1. Zaynali Nezhad, K.; Weber, W.E.; Röder, M.S.; Sharma, S.; Lohwasser, U.; Meyer, R.C.; Saal, B.; Börner, A. QTL Analysis for Thousand-Grain Weight under Terminal Drought Stress in Bread Wheat (Triticumaestivum L.). Euphytica 2012, 186, 127–138. [Google Scholar] [CrossRef]
  2. Wu, X.; Wang, Z.; Chang, X.; Jing, R. Genetic Dissection of the Developmental Behaviours of Plant Height in Wheat under Diverse Water Regimes. J. Exp. Bot. 2010, 61, 2923–2937. [Google Scholar] [CrossRef] [PubMed]
  3. Koua, A.P.; Oyiga, B.C.; Baig, M.M.; Léon, J.; Ballvora, A. Breeding Driven Enrichment of Genetic Variation for Key Yield Components and Grain Starch Content Under Drought Stress in Winter Wheat. Front. Plant Sci. 2021, 12, 1703. [Google Scholar] [CrossRef]
  4. Fleury, D.; Jefferies, S.; Kuchel, H.; Langridge, P. Genetic and Genomic Tools to Improve Drought Tolerance in Wheat. J. Exp. Bot. 2010, 61, 3211–3222. [Google Scholar] [CrossRef]
  5. Shatalina, M.; Wicker, T.; Buchmann, J.P.; Oberhaensli, S.; Šimková, H.; Doležel, J.; Keller, B. Genotype-Specific SNP Map Based on Whole Chromosome 3B Sequence Information from Wheat Cultivars Arina and Forno. Plant Biotechnol. J. 2013, 11, 23–32. [Google Scholar] [CrossRef] [PubMed]
  6. Bhatta, M.; Morgounov, A.; Belamkar, V.; Baenziger, P.S. Genome-Wide Association Study Reveals Novel Genomic Regions for Grain Yield and Yield-Related Traits in Drought-Stressed Synthetic Hexaploid Wheat. Int. J. Mol. Sci. 2018, 19, 3011. [Google Scholar] [CrossRef]
  7. Edae, E.A.; Byrne, P.F.; Haley, S.D.; Lopes, M.S.; Reynolds, M.P. Genome-Wide Association Mapping of Yield and Yield Components of Spring Wheat under Contrasting Moisture Regimes. Theor. Appl. Genet. 2014, 127, 791–807. [Google Scholar] [CrossRef]
  8. Gahlaut, V.; Jaiswal, V.; Tyagi, B.S.; Singh, G.; Sareen, S.; Balyan, H.S.; Gupta, P.K. QTL Mapping for Nine Drought-Responsive Agronomic Traits in Bread Wheat under Irrigated and Rain-Fed Environments. PLoS ONE 2017, 12, e0182857. [Google Scholar] [CrossRef]
  9. Kirigwi, F.M.; Van Ginkel, M.; Brown-Guedira, G.; Gill, B.S.; Paulsen, G.M.; Fritz, A.K. Markers Associated with a QTL for Grain Yield in Wheat under Drought. Mol. Breed. 2007, 20, 401–413. [Google Scholar] [CrossRef]
  10. McIntyre, C.L.; Mathews, K.L.; Rattey, A.; Chapman, S.C.; Drenth, J.; Ghaderi, M.; Reynolds, M.; Shorter, R. Molecular Detection of Genomic Regions Associated with Grain Yield and Yield-Related Components in an Elite Bread Wheat Cross Evaluated under Irrigated and Rainfed Conditions. TAG Theor. Appl. Genet. Theor. Angew. Genet. 2010, 120, 527–541. [Google Scholar] [CrossRef]
  11. Quarrie, S.A.; Steed, A.; Calestani, C.; Semikhodskii, A.; Lebreton, C.; Chinoy, C.; Steele, N.; Pljevljakusić, D.; Waterman, E.; Weyen, J.; et al. A High-Density Genetic Map of Hexaploid Wheat (Triticum Aestivum L.) from the Cross Chinese Spring × SQ1 and Its Use to Compare QTLs for Grain Yield across a Range of Environments. Theor. Appl. Genet. 2005, 110, 865–880. [Google Scholar] [CrossRef] [PubMed]
  12. Rufo, R.; López, A.; Lopes, M.S.; Bellvert, J.; Soriano, J.M. Identification of Quantitative Trait Loci Hotspots Affecting Agronomic Traits and High-Throughput Vegetation Indices in Rainfed Wheat. Front. Plant Sci. 2021, 12, 735192. [Google Scholar] [CrossRef] [PubMed]
  13. Shukla, S.; Singh, K.; Patil, R.V.; Kadam, S.; Bharti, S.; Prasad, P.; Singh, N.K.; Khanna-Chopra, R. Genomic Regions Associated with Grain Yield under Drought Stress in Wheat (Triticum Aestivum L.). Euphytica 2015, 203, 449–467. [Google Scholar] [CrossRef]
  14. Wu, X.; Chang, X.; Jing, R. Genetic Insight into Yield-Associated Traits of Wheat Grown in Multiple Rain-Fed Environments. PLoS ONE 2012, 7, e31249. [Google Scholar] [CrossRef]
  15. Gao, F.; Wen, W.; Liu, J.; Rasheed, A.; Yin, G.; Xia, X.; Wu, X.; He, Z. Genome-Wide Linkage Mapping of QTL for Yield Components, Plant Height and Yield-Related Physiological Traits in the Chinese Wheat Cross Zhou 8425B/Chinese Spring. Front. Plant Sci. 2015, 6, 1099. [Google Scholar] [CrossRef]
  16. Li, C.; Bai, G.; Carver, B.F.; Chao, S.; Wang, Z. Single Nucleotide Polymorphism Markers Linked to QTL for Wheat Yield Traits. Euphytica 2015, 206, 89–101. [Google Scholar] [CrossRef]
  17. Li, F.; Wen, W.; He, Z.; Liu, J.; Jin, H.; Cao, S.; Geng, H.; Yan, J.; Zhang, P.; Wan, Y.; et al. Genome-Wide Linkage Mapping of Yield-Related Traits in Three Chinese Bread Wheat Populations Using High-Density SNP Markers. Theor. Appl. Genet. 2018, 131, 1903–1924. [Google Scholar] [CrossRef]
  18. Liu, G.; Jia, L.; Lu, L.; Qin, D.; Zhang, J.; Guan, P.; Ni, Z.; Yao, Y.; Sun, Q.; Peng, H. Mapping QTLs of Yield-Related Traits Using RIL Population Derived from Common Wheat and Tibetan Semi-Wild Wheat. Theor. Appl. Genet. 2014, 127, 2415–2432. [Google Scholar] [CrossRef]
  19. Qu, P.; Wang, J.; Wen, W.; Gao, F.; Liu, J.; Xia, X.; Peng, H.; Zhang, L. Construction of Consensus Genetic Map With Applications in Gene Mapping of Wheat (Triticum aestivum L.) Using 90K SNP Array. Front. Plant Sci. 2021, 12, 727077. [Google Scholar] [CrossRef]
  20. Qu, X.; Li, C.; Liu, H.; Liu, J.; Luo, W.; Xu, Q.; Tang, H.; Mu, Y.; Deng, M.; Pu, Z.; et al. Quick Mapping and Characterization of a Co-Located Kernel Length and Thousand-Kernel Weight-Related QTL in Wheat. Theor. Appl. Genet. 2022, 135, 2849–2860. [Google Scholar] [CrossRef]
  21. Sehgal, D.; Autrique, E.; Singh, R.; Ellis, M.; Singh, S.; Dreisigacker, S. Identification of Genomic Regions for Grain Yield and Yield Stability and Their Epistatic Interactions. Sci. Rep. 2017, 7, 41578. [Google Scholar] [CrossRef] [PubMed]
  22. Su, Q.; Zhang, X.; Zhang, W.; Zhang, N.; Song, L.; Liu, L.; Xue, X.; Liu, G.; Liu, J.; Meng, D.; et al. QTL Detection for Kernel Size and Weight in Bread Wheat (Triticum Aestivum L.) Using a High-Density SNP and SSR-Based Linkage Map. Front. Plant Sci. 2018, 9, 1484. [Google Scholar] [CrossRef]
  23. Sun, C.; Zhang, F.; Yan, X.; Zhang, X.; Dong, Z.; Cui, D.; Chen, F. Genome-Wide Association Study for 13 Agronomic Traits Reveals Distribution of Superior Alleles in Bread Wheat from the Yellow and Huai Valley of China. Plant Biotechnol. J. 2017, 15, 953–969. [Google Scholar] [CrossRef] [PubMed]
  24. Vitale, P.; Fania, F.; Esposito, S.; Pecorella, I.; Pecchioni, N.; Palombieri, S.; Sestili, F.; Lafiandra, D.; Taranto, F.; De Vita, P. QTL Analysis of Five Morpho-Physiological Traits in Bread Wheat Using Two Mapping Populations Derived from Common Parents. Genes 2021, 12, 604. [Google Scholar] [CrossRef] [PubMed]
  25. Wang, Z.; Hu, H.; Jiang, X.; Tao, Y.; Lin, Y.; Wu, F.; Hou, S.; Liu, S.; Li, C.; Chen, G.; et al. Identification and Validation of a Novel Major Quantitative Trait Locus for Plant Height in Common Wheat (Triticum aestivum L.). Front. Genet. 2020, 11, 602495. [Google Scholar] [CrossRef] [PubMed]
  26. Xie, X.; Li, S.; Liu, H.; Xu, Q.; Tang, H.; Mu, Y.; Deng, M.; Jiang, Q.; Chen, G.; Qi, P.; et al. Identification and Validation of a Major QTL for Kernel Length in Bread Wheat Based on Two F3 Biparental Populations. BMC Genomics 2022, 23, 386. [Google Scholar] [CrossRef]
  27. Yang, L.; Zhao, D.; Meng, Z.; Xu, K.; Yan, J.; Xia, X.; Cao, S.; Tian, Y.; He, Z.; Zhang, Y. QTL Mapping for Grain Yield-Related Traits in Bread Wheat via SNP-Based Selective Genotyping. Theor. Appl. Genet. 2020, 133, 857–872. [Google Scholar] [CrossRef]
  28. Yang, Y.; Dhakal, S.; Chu, C.; Wang, S.; Xue, Q.; Rudd, J.C.; Ibrahim, A.M.H.; Jessup, K.; Baker, J.; Fuentealba, M.P.; et al. Genome Wide Identification of QTL Associated with Yield and Yield Components in Two Popular Wheat Cultivars TAM 111 and TAM 112. PLoS ONE 2020, 15, e0237293. [Google Scholar] [CrossRef]
  29. Zhai, H.; Feng, Z.; Li, J.; Liu, X.; Xiao, S.; Ni, Z.; Sun, Q. QTL Analysis of Spike Morphological Traits and Plant Height in Winter Wheat (Triticum aestivum L.) Using a High-Density SNP and SSR-Based Linkage Map. Front. Plant Sci. 2016, 7, 1617. [Google Scholar] [CrossRef]
  30. Berkman, P.J.; Lai, K.; Lorenc, M.T.; Edwards, D. Next-Generation Sequencing Applications for Wheat Crop Improvement. Am. J. Bot. 2012, 99, 365–371. [Google Scholar] [CrossRef]
  31. Poland, J.A.; Rife, T.W. Genotyping-by-Sequencing for Plant Breeding and Genetics. Plant Genome 2012, 5, 92–102. [Google Scholar] [CrossRef]
  32. Zhou, Y.; Conway, B.; Miller, D.; Marshall, D.; Cooper, A.; Murphy, P.; Chao, S.; Brown-Guedira, G.; Costa, J. Quantitative Trait Loci Mapping for Spike Characteristics in Hexaploid Wheat. Plant Genome 2017, 10, plantgenome2016.10.0101. [Google Scholar] [CrossRef] [PubMed]
  33. Pang, Y.; Liu, C.; Wang, D.; St. Amand, P.; Bernardo, A.; Li, W.; He, F.; Li, L.; Wang, L.; Yuan, X.; et al. High-Resolution Genome-Wide Association Study Identifies Genomic Regions and Candidate Genes for Important Agronomic Traits in Wheat. Mol. Plant 2020, 13, 1311–1327. [Google Scholar] [CrossRef]
  34. Juliana, P.; Poland, J.; Huerta-Espino, J.; Shrestha, S.; Crossa, J.; Crespo-Herrera, L.; Toledo, F.H.; Govindan, V.; Mondal, S.; Kumar, U.; et al. Improving Grain Yield, Stress Resilience and Quality of Bread Wheat Using Large-Scale Genomics. Nat. Genet. 2019, 51, 1530–1539. [Google Scholar] [CrossRef] [PubMed]
  35. Ehdaie, B.; Mohammadi, S.A.; Nouraein, M. QTLs for Root Traits at Mid-Tillering and for Root and Shoot Traits at Maturity in a RIL Population of Spring Bread Wheat Grown under Well-Watered Conditions. Euphytica 2016, 211, 17–38. [Google Scholar] [CrossRef]
  36. The International Wheat Genome Sequencing Consortium (IWGSC); Appels, R.; Eversole, K.; Stein, N.; Feuillet, C.; Keller, B.; Rogers, J.; Pozniak, C.J.; Choulet, F.; Distelfeld, A.; et al. Shifting the Limits in Wheat Research and Breeding Using a Fully Annotated Reference Genome. Science 2018, 361, eaar7191. [Google Scholar] [CrossRef]
  37. Spindel, J.; Wright, M.; Chen, C.; Cobb, J.; Gage, J.; Harrington, S.; Lorieux, M.; Ahmadi, N.; McCouch, S. Bridging the Genotyping Gap: Using Genotyping by Sequencing (GBS) to Add High-Density SNP Markers and New Value to Traditional Bi-Parental Mapping and Breeding Populations. Theor. Appl. Genet. 2013, 126, 2699–2716. [Google Scholar] [CrossRef]
  38. Hussain, W.; Baenziger, P.S.; Belamkar, V.; Guttieri, M.J.; Venegas, J.P.; Easterly, A.; Sallam, A.; Poland, J. Genotyping-by-Sequencing Derived High-Density Linkage Map and Its Application to QTL Mapping of Flag Leaf Traits in Bread Wheat. Sci. Rep. 2017, 7, 16394. [Google Scholar] [CrossRef]
  39. Verma, S.; Gupta, S.; Bandhiwal, N.; Kumar, T.; Bharadwaj, C.; Bhatia, S. High-Density Linkage Map Construction and Mapping of Seed Trait QTLs in Chickpea (Cicer arietinum L.) Using Genotyping-by-Sequencing (GBS). Sci. Rep. 2015, 5, 17512. [Google Scholar] [CrossRef]
  40. Zanke, C.D.; Ling, J.; Plieske, J.; Kollers, S.; Ebmeyer, E.; Korzun, V.; Argillier, O.; Stiewe, G.; Hinze, M.; Neumann, F.; et al. Analysis of Main Effect QTL for Thousand Grain Weight in European Winter Wheat (Triticum aestivum L.) by Genome-Wide Association Mapping. Front. Plant Sci. 2015, 6, 644. [Google Scholar] [CrossRef] [Green Version]
  41. Griffiths, S.; Simmonds, J.; Leverington, M.; Wang, Y.; Fish, L.; Sayers, L.; Alibert, L.; Orford, S.; Wingen, L.; Snape, J. Meta-QTL Analysis of the Genetic Control of Crop Height in Elite European Winter Wheat Germplasm. Mol. Breed. 2012, 29, 159–171. [Google Scholar] [CrossRef]
  42. Zanke, C.D.; Ling, J.; Plieske, J.; Kollers, S.; Ebmeyer, E.; Korzun, V.; Argillier, O.; Stiewe, G.; Hinze, M.; Neumann, K.; et al. Whole Genome Association Mapping of Plant Height in Winter Wheat (Triticum aestivum L.). PLoS ONE 2014, 9, e113287. [Google Scholar] [CrossRef] [PubMed]
  43. Mathews, K.L.; Malosetti, M.; Chapman, S.; McIntyre, L.; Reynolds, M.; Shorter, R.; van Eeuwijk, F. Multi-Environment QTL Mixed Models for Drought Stress Adaptation in Wheat. TAG Theor. Appl. Genet. Theor. Angew. Genet. 2008, 117, 1077–1091. [Google Scholar] [CrossRef] [PubMed]
  44. Isham, K.; Wang, R.; Zhao, W.; Wheeler, J.; Klassen, N.; Akhunov, E.; Chen, J. QTL Mapping for Grain Yield and Three Yield Components in a Population Derived from Two High-Yielding Spring Wheat Cultivars. TAG Theor. Appl. Genet. Theor. Angew. Genet. 2021, 134, 2079–2095. [Google Scholar] [CrossRef]
  45. Zhang, K.; Tian, J.; Zhao, L.; Wang, S. Mapping QTLs with Epistatic Effects and QTL × Environment Interactions for Plant Height Using a Doubled Haploid Population in Cultivated Wheat. J. Genet. Genomics 2008, 35, 119–127. [Google Scholar] [CrossRef]
  46. Ain, Q.-U.; Rasheed, A.; Anwar, A.; Mahmood, T.; Imtiaz, M.; Mahmood, T.; Xia, X.; He, Z.; Quraishi, U.M. Genome-Wide Association for Grain Yield under Rainfed Conditions in Historical Wheat Cultivars from Pakistan. Front. Plant Sci. 2015, 6, 743. [Google Scholar] [CrossRef]
  47. Zhang, H.; Chen, J.; Li, R.; Deng, Z.; Zhang, K.; Liu, B.; Tian, J. Conditional QTL Mapping of Three Yield Components in Common Wheat (Triticum aestivum L.). Crop J. 2016, 4, 220–228. [Google Scholar] [CrossRef]
  48. Rizza, F.; Badeck, F.W.; Cattivelli, L.; Lidestri, O.; Di Fonzo, N.; Stanca, A.M. Use of a Water Stress Index to Identify Barley Genotypes Adapted to Rainfed and Irrigated Conditions. Crop Sci. 2004, 44, 2127–2137. [Google Scholar] [CrossRef]
  49. Sukumaran, S.; Dreisigacker, S.; Lopes, M.; Chavez, P.; Reynolds, M.P. Genome-Wide Association Study for Grain Yield and Related Traits in an Elite Spring Wheat Population Grown in Temperate Irrigated Environments. Theor. Appl. Genet. 2015, 128, 353–363. [Google Scholar] [CrossRef]
  50. Perez-Lara, E.; Semagn, K.; Chen, H.; Iqbal, M.; N’Diaye, A.; Kamran, A.; Navabi, A.; Pozniak, C.; Spaner, D. QTLs Associated with Agronomic Traits in the Cutler × AC Barrie Spring Wheat Mapping Population Using Single Nucleotide Polymorphic Markers. PLoS ONE 2016, 11, e0160623. [Google Scholar] [CrossRef] [Green Version]
  51. Acuña-Galindo, M.A.; Mason, R.E.; Subramanian, N.K.; Hays, D.B. Meta-Analysis of Wheat QTL Regions Associated with Adaptation to Drought and Heat Stress. Crop Sci. 2015, 55, 477–492. [Google Scholar] [CrossRef]
  52. Wang, S.-X.; Zhu, Y.-L.; Zhang, D.-X.; Shao, H.; Liu, P.; Hu, J.-B.; Zhang, H.; Zhang, H.-P.; Chang, C.; Lu, J.; et al. Genome-Wide Association Study for Grain Yield and Related Traits in Elite Wheat Varieties and Advanced Lines Using SNP Markers. PLoS ONE 2017, 12, e0188662. [Google Scholar] [CrossRef] [PubMed]
  53. Huang, X.Q.; Kempf, H.; Ganal, M.W.; Röder, M.S. Advanced Backcross QTL Analysis in Progenies Derived from a Cross between a German Elite Winter Wheat Variety and a Synthetic Wheat (Triticum Aestivum L.). TAG Theor. Appl. Genet. Theor. Angew. Genet. 2004, 109, 933–943. [Google Scholar] [CrossRef]
  54. Gagne, J.M.; Smalle, J.; Gingerich, D.J.; Walker, J.M.; Yoo, S.-D.; Yanagisawa, S.; Vierstra, R.D. Arabidopsis EIN3-Binding F-Box 1 and 2 Form Ubiquitin-Protein Ligases That Repress Ethylene Action and Promote Growth by Directing EIN3 Degradation. Proc. Natl. Acad. Sci. USA 2004, 101, 6803–6808. [Google Scholar] [CrossRef]
  55. Strader, L.C.; Ritchie, S.; Soule, J.D.; McGinnis, K.M.; Steber, C.M. Recessive-Interfering Mutations in the Gibberellin Signaling Gene SLEEPY1 Are Rescued by Overexpression of Its Homologue, SNEEZY. Proc. Natl. Acad. Sci. USA 2004, 101, 12771–12776. [Google Scholar] [CrossRef]
  56. Lechner, E.; Achard, P.; Vansiri, A.; Potuschak, T.; Genschik, P. F-Box Proteins Everywhere. Curr. Opin. Plant Biol. 2006, 9, 631–638. [Google Scholar] [CrossRef] [PubMed]
  57. Jain, M.; Nijhawan, A.; Arora, R.; Agarwal, P.; Ray, S.; Sharma, P.; Kapoor, S.; Tyagi, A.K.; Khurana, J.P. F-Box Proteins in Rice. Genome-Wide Analysis, Classification, Temporal and Spatial Gene Expression during Panicle and Seed Development, and Regulation by Light and Abiotic Stress. Plant Physiol. 2007, 143, 1467–1483. [Google Scholar] [CrossRef] [PubMed]
  58. Mao, X.; Zhang, H.; Tian, S.; Chang, X.; Jing, R. TaSnRK2.4, an SNF1-Type Serine/Threonine Protein Kinase of Wheat (Triticum aestivum L.), Confers Enhanced Multistress Tolerance in Arabidopsis. J. Exp. Bot. 2010, 61, 683–696. [Google Scholar] [CrossRef]
  59. Wang, W.; Vinocur, B.; Shoseyov, O.; Altman, A. Role of Plant Heat-Shock Proteins and Molecular Chaperones in the Abiotic Stress Response. Trends Plant Sci. 2004, 9, 244–252. [Google Scholar] [CrossRef]
  60. Feki, K.; Brini, F. Role of Proteins in Alleviating Drought Stress in Plants. In Water Stress and Crop Plants; Ahmad, P., Ed.; John Wiley & Sons, Ltd.: Chichester, UK, 2016; pp. 165–176. ISBN 978-1-119-05445-0. [Google Scholar]
  61. Chini, A.; Grant, J.J.; Seki, M.; Shinozaki, K.; Loake, G.J. Drought Tolerance Established by Enhanced Expression of the CC-NBS-LRR Gene, ADR1, Requires Salicylic Acid, EDS1 and ABI1. Plant J. 2004, 38, 810–822. [Google Scholar] [CrossRef]
  62. Liu, Q.; Kasuga, M.; Sakuma, Y.; Abe, H.; Miura, S.; Yamaguchi-Shinozaki, K.; Shinozaki, K. Two Transcription Factors, DREB1 and DREB2, with an EREBP/AP2 DNA Binding Domain Separate Two Cellular Signal Transduction Pathways in Drought- and Low-Temperature-Responsive Gene Expression, Respectively, in Arabidopsis. Plant Cell 1998, 10, 1391–1406. [Google Scholar] [CrossRef] [PubMed]
  63. Song, C.-P.; Agarwal, M.; Ohta, M.; Guo, Y.; Halfter, U.; Wang, P.; Zhu, J.-K. Role of an Arabidopsis AP2/EREBP-Type Transcriptional Repressor in Abscisic Acid and Drought Stress Responses. Plant Cell 2005, 17, 2384–2396. [Google Scholar] [CrossRef] [PubMed]
  64. Li, N.; Xu, C.; Li-Beisson, Y.; Philippar, K. Fatty Acid and Lipid Transport in Plant Cells. Trends Plant Sci. 2016, 21, 145–158. [Google Scholar] [CrossRef]
  65. Siegel, D.; Gustafson, D.L.; Dehn, D.L.; Han, J.Y.; Boonchoong, P.; Berliner, L.J.; Ross, D. NAD(P)H:Quinone Oxidoreductase 1: Role as a Superoxide Scavenger. Mol. Pharmacol. 2004, 65, 1238–1247. [Google Scholar] [CrossRef]
  66. Simova-Stoilova, L.; Vaseva, I.; Grigorova, B.; Demirevska, K.; Feller, U. Proteolytic Activity and Cysteine Protease Expression in Wheat Leaves under Severe Soil Drought and Recovery. Plant Physiol. Biochem. PPB 2010, 48, 200–206. [Google Scholar] [CrossRef] [PubMed]
  67. Zhang, X.; Liu, S.; Takano, T. Two Cysteine Proteinase Inhibitors from Arabidopsis Thaliana, AtCYSa and AtCYSb, Increasing the Salt, Drought, Oxidation and Cold Tolerance. Plant Mol. Biol. 2008, 68, 131–143. [Google Scholar] [CrossRef]
  68. Tamiru, M.; Undan, J.R.; Takagi, H.; Abe, A.; Yoshida, K.; Undan, J.Q.; Natsume, S.; Uemura, A.; Saitoh, H.; Matsumura, H.; et al. A Cytochrome P450, OsDSS1, Is Involved in Growth and Drought Stress Responses in Rice (Oryza sativa L.). Plant Mol. Biol. 2015, 88, 85–99. [Google Scholar] [CrossRef]
  69. Wan, X.; Mo, A.; Liu, S.; Yang, L.; Li, L. Constitutive Expression of a Peanut Ubiquitin-Conjugating Enzyme Gene in Arabidopsis Confers Improved Water-Stress Tolerance through Regulation of Stress-Responsive Gene Expression. J. Biosci. Bioeng. 2011, 111, 478–484. [Google Scholar] [CrossRef]
  70. Poland, J.A.; Brown, P.J.; Sorrells, M.E.; Jannink, J.-L. Development of High-Density Genetic Maps for Barley and Wheat Using a Novel Two-Enzyme Genotyping-by-Sequencing Approach. PLoS ONE 2012, 7, e32253. [Google Scholar] [CrossRef]
  71. Mascher, M.; Wu, S.; Amand, P.S.; Stein, N.; Poland, J. Application of Genotyping-by-Sequencing on Semiconductor Sequencing Platforms: A Comparison of Genetic and Reference-Based Marker Ordering in Barley. PLoS ONE 2013, 8, e76925. [Google Scholar] [CrossRef] [Green Version]
  72. Ooijen, J.; Ooijen, J.; van ’t Verlaat, J.; Ooijen, J.; Tol, J.; Dalén, J.; Buren, J.; Meer, J.M.; Krieken, J.V.; Ooijen, J.; et al. JoinMap® 4, Software for the Calculation of Genetic Linkage Maps in Experimental Populations; Kyazma BV: Wageningen, The Netherlands, 2006. [Google Scholar]
  73. Kosambi, D.D. The Estimation of Map Distances from Recombination Values. Ann. Eugen. 1943, 12, 172–175. [Google Scholar] [CrossRef]
  74. WinQTLCart. Available online: https://brcwebportal.cos.ncsu.edu/qtlcart/WQTLCart.htm (accessed on 19 August 2022).
  75. Voorrips, R.E. MapChart: Software for the Graphical Presentation of Linkage Maps and QTLs. J. Hered. 2002, 93, 77–78. [Google Scholar] [CrossRef] [PubMed] [Green Version]
Figure 1. Frequency distribution of averaged phenotypic data of three locations and two years for all traits recorded: under irrigated (a); and water deficit (b) conditions. #49 and Yecora Rojo are shown by a filled and unfilled arrow, respectively.
Plants 11 02533 g001
Figure 2. Linkage map constructed from genotyping-by-sequencing in a RIL population derived from a cross between #49 and Yecora Rojo. The genetic distances (cM) of markers are shown on the left side.
Plants 11 02533 g002
Figure 3. Location of QTLs on the genetic linkage map of wheat developed from the cross #49 × Yecora Rojo under irrigated (solid filled box) and water deficit (stripes filled box) conditions in (a) A genome, (b) B genome and (c) D genome. Each chromosome is represented by map positions by cM (on the left) and identified QTLs (on the right). QTL names indicate the trait, trail (water condition + environment) and chromosome name along with different colors: GY (red), PH (green), SM (yellow), TKW (pink), GNS (blue), SL (light blue), BIO (black), HI (brown).
Plants 11 02533 g003aPlants 11 02533 g003b
Table 1. Pearson’s correlation coefficients between studied traits under irrigated and water deficit conditions.
Water ConditionPHSLSMGNSTKWBIOGYHI
PHirrigated1
water deficit1
SLirrigated0.269 **1
water deficit0.358 **1
SMirrigated−0.197 *−0.238 **1
water deficit−0.088−0.1411
GNSirrigated0.321 **0.517 **−0.174 *1
water deficit0.242 **0.486 **−0.1031
TKWirrigated0.165 *0.1410.0570.170 *1
water deficit0.1120.027−0.0380.0731
BIOirrigated0.439 **0.354 **0.253 **0.336 **0.346 **1
water deficit0.344 **0.290 **0.351 **0.322 **0.244 **1
GYirrigated0.276 **0.261 **0.330 **0.451 **0.423 **0.640 **1
water deficit0.1490.207 *0.295 **0.385 **0.421 **0.561 **1
HIirrigated0.0080.10.198 *0.314 **0.281 **0.0190.755 **1
water deficit−0.0860.0580.0820.217 **0.292 **−0.1020.742 **1
Correlation coefficients between the averaged traits across three locations and two years are shown on top for irrigated condition and on bottom for water deficit condition. * and ** significant at a = 0.05 and a = 0.01 level (2-tailed).
Table 2. Summary of the GBS markers mapped to the 21 chromosomes based on 148 recombinant inbred lines derived from a cross between #49 and Yecora Rojo.
ChromosomeNo. SNPNo. SNP after FilteringMapped Loci to Linkage GroupLength of Linkage Group (cM)Distance between Two Adjacent MarkersSNP per cM
1A2080476399189.220.472.11
2A1868451356231.320.651.54
3A1447342267208.690.781.28
4A2135396335220.390.661.52
5A1767424343276.680.811.24
6A1305323254179.480.711.42
7A2730630500260.880.521.92
A genome13,332304224541566.64
1B2520548419190.720.462.20
2B3384785570268.490.472.12
3B3516707540257.190.482.10
4B1164222180131.500.731.37
5B2499492380281.990.741.35
6B2926636422162.630.392.59
7B2828587422227.190.541.86
B genome18,837397729331519.70
1D601159101115.381.140.88
2D837237126152.111.210.83
3D268432983.702.890.35
4D134271512.890.861.16
5D276492918.170.631.60
6D498128499.190.195.33
7D62212695164.361.730.58
D genome3236769444555.80
Total35,405778858313642.140.621.60
Table 3. List of significant QTL detected for grain yield (GY), plant height (PH), spike number per squared meters (SM), thousand kernel weight (TKW), grain number per spike (GNS), spike length (SL), biomass (BIO), and harvest index (HI) in the Iran #49 × Yecora Rojo RIL population under irrigated and water deficit conditions.
TraitWater ConditionEnvironmentQTLClosest MarkerPosition (cM)LODR2 (%) aAdd b
GYIrrigatedMahabadQgy-Irr.mah-4Achr4A_614700608823.928.5712.94
Qgy1-Irr.mah-6Bchr6B_33629751433.808.8711.76
Qgy2-Irr.mah-6Bchr6B_34082536493.658.5011.51
MiandoabQgy-Irr.mia-2Achr2A_30568266433.989.21−12.01
Mean of 3 PlacesQgy1-Irr.3P-6Bchr6B_33629751434.229.909.63
Qgy2-Irr.3P-6Bchr6B_34340678494.069.509.39
Water deficitMiandoabQgy-Wd.mia-2Achr2A_24214196344.2110.50−9.10
Mean of 3 PlacesQgy-Wd.3P-2Achr2A_24214196343.498.30−5.97
PHIrrigatedMahabadQph-Irr.mah-3Dchr3D_453986741243.599.782.42
MiandoabQph1-Irr.mia-6Bchr6B_5677658861093.648.6−3.62
Qph2-Irr.mia-6Bchr6B_6595893761294.6111.424.43
TabrizQph1-Irr.tab-4Bchr4B_28735878447.2114.00−2.96
Qph2-Irr.tab-4Bchr4B_373472025010.6019.00−3.45
Qph-Irr.tab-4Dchr4D_120094414510.2218.60−3.40
Qph-Irr.tab-7Achr7A_837767931133.796.20−1.97
Mean of 3 PlacesQph-Irr.3P-2Bchr2B_7702208402393.829.301.61
Qph-Irr.3P-3Achr3A_35421232623.608.30−1.51
Qph-Irr.3P-7Bchr7B_6506195901403.658.301.54
Water deficitMahabadQph-Wd.mah-7Dchr7D_4855170601104.2414.00−2.65
MiandoabQph1-Wd.mia-7Achr7A_16302867163.889.10−1.86
Qph2-Wd.mia-7Achr7A_22919790263.818.90−1.83
TabrizQph-Wd.tab-4Bchr4B_28735878446.1312.70−2.60
Qph-Wd.tab-4Dchr4D_12009441424.679.04−2.20
Mean of 3 PlacesQph-Wd.3P-4Achr4A_614700608764.069.301.48
Qph1-Wd.3P-7Achr7A_16302867164.2710.00−1.42
Qph2-Wd.3P-7Achr7A_18775675224.9011.40−1.50
Qph3-Wd.3P-7Achr7A_22919790274.2410.50−1.40
SMIrrigatedMahabadQsm1-Irr.mah-6Bchr6B_33629751433.819.469.49
Qsm2-Irr.mah-6Bchr6B_34340678493.819.469.47
TabrizQsm-Irr.tab-5Achr5A_5892874611668.0117.6024.26
Mean of 3 PlacesQsm1-Irr.3P-2Bchr2B_7772970322473.688.80−8.68
Qsm2-Irr.3P-2Bchr2B_7805902402524.029.50−8.50
Qsm-Irr.3P-5Achr5A_5814886511655.8113.8010.45
Water deficitTabrizQsm-Wd.tab-2Bchr2B_5132847371283.978.70−14.64
TKWIrrigatedMahabadQtkw1-Irr.mah-1Bchr1B_6405597741455.1714.61−3.91
Qtkw2-Irr.mah-1Bchr1B_6426971161504.7812.04−3.42
MiandoabQtkw-Irr.mia-1Bchr1B_6426971161504.6211.57−3.67
TabrizQtkw1-Irr.tab-5Bchr5B_339425357645.7313.001.29
Qtkw2-Irr.tab-5Bchr5B_378853109744.4410.001.09
Qtkw-Irr.tab-6Bchr6B_6689667881393.407.900.93
Water deficitMahabadQtkw-Wd.mah-3Bchr3B_21770957444.1811.592.51
MiandoabQtkw-Wd.mia-3Bchr3B_20721650423.398.601.79
TabrizQtkw1-Wd.tab-4Bchr4B_21573529374.3511.60−1.08
Qtkw2-Wd.tab-4Bchr4B_37347202503.798.40−0.90
Qtkw1-Wd.tab-5Bchr5B_412238630774.4811.001.08
Qtkw2-Wd.tab-5Bchr5B_430752407853.328.300.92
Qtkw-Wd.tab-7Bchr7B_7016492371733.908.80−0.91
GNSIrrigatedMahabadQgns-Irr.mah-3Achr3A_6956625121504.198.13−0.65
TabrizQgns1-Irr.tab-4Achr4A_6322360001227.5819.251.61
Qgns2-Irr.tab-4Achr4A_6838744921296.2714.601.40
Water deficitMahabadQgns1-Wd.mah-7Dchr7D_94715776852.826.600.65
Qgns2-Wd.mah-7Dchr7D_180083703984.0410.00−0.77
MiandoabQgns-Wd.mia-1Achr1A_11934211224.2911.10−0.68
Mean of 3 PlacesQgns-Wd.3P-4Achr4A_6838744921303.649.100.51
SLIrrigatedTabrizQsl-Irr.tab-3Achr3A_6976152721584.7411.92−0.26
Qsl1-Irr.tab-4Achr4A_6399944341243.457.400.21
Qsl2-Irr.tab-4Achr4A_6816831601324.6110.430.25
Qsl1-Irr.tab-7Dchr7D_89732435804.019.10−0.23
Qsl2-Irr.tab-7Dchr7D_104889647894.619.70−0.24
Water deficitMahabadQsl-Wd.mah-3Bchr3B_43100457763.808.80−0.21
Qsl-Wd.mah-7Achr7A_66641918947.1519.18−0.25
MiandoabQsl-Wd.mia-2Bchr2B_26987136463.9711.640.17
Mean of 3 PlacesQsl-Wd.3P-2Achr2A_24111229253.278.20−0.11
BIOIrrigatedMahabadQbio-Irr.mah-4Achr4A_614700608773.779.4217.03
MiandoabQbio-Irr.mia-1Dchr1D_34011022553.6510.7818.86
Mean of 3 PlacesQbio-Irr.3P-4Achr4A_614700608783.9810.7015.66
Water deficitMahabadQbio-Wd.mah-5Achr5A_5525232571283.8410.38−16.00
MiandoabQbio1-Wd.mia-1Bchr1B_969109593.679.3013.95
Qbio2-Wd.mia-1Bchr1B_15368052173.849.6014.41
Mean of 3 PlacesQbio-Wd.3P-5Achr5A_5525232571314.4310.95−11.43
HIIrrigatedMahabadQhi-Irr.mah-3Dchr3D_197992771233.729.702.14
MiandoabQhi1-Irr.mia-2Achr2A_397544453.678.10−2.20
Qhi2-Irr.mia-2Achr2A_6269139145.0211.77−2.61
Qhi-Irr.mia-6Achr6A_5918838331226.4314.20−2.91
TabrizQhi1-Irr.tab-1Bchr1B_420591625774.8711.60−2.71
Qhi2-Irr.tab-1Bchr1B_498063961875.0912.10−2.64
Mean of 3 PlacesQhi-Irr.3P-6Achr6A_5918838331224.429.70−1.47
Water deficitMahabadQhi-Wd.mah-2Dchr2D_6181500121422.556.061.96
Qhi1-Wd.mah-3Bchr3B_1782663881092.867.252.32
Qhi2-Wd.mah-3Bchr3B_4195607451174.5711.542.98
Qhi3-Wd.mah-3Bchr3B_4921056701255.0612.473.19
Qhi4-Wd.mah-3Bchr3B_7289224121593.578.90−2.54
MiandoabQhi-Wd.mia-5Achr5A_52357876635.3313.00−3.85
TabrizQhi1-Wd.tab-1Bchr1B_420591625774.8911.50−2.74
Qhi2-Wd.tab-1Bchr1B_427069393814.8911.50−2.74
a: Phenotypic variance explained (%) for each QTL; b: Negative and positive additive effects for detected QTLs are indicating the Yecora Rojo and #49 contributes alleles to increase the traits respectively.
Table 4. List of putatively drought-related genes underlying QTL detected in the RIL population of #49 × Yecora Rojo population under irrigated and water deficit conditions.
QTL NameFlanking Markers aGene-IDAnnotation
Qtkw1-Irr.mah-1Bchr1B_637810003-chr1B_641627897TraesCS1B01G415500.1Ubiquitin-conjugating enzyme E2
Qtkw-Irr.mia-1Bchr1B_639448207-chr1B_642697116
Qtkw-Wd.mia-3Bchr3B_20439595-chr3B_22054094TraesCS3B01G041700.1Alpha-glucosidase
Qtkw-Wd.mah-3Bchr3B_20439595-chr3B_22054094TraesCS3B01G042400.1AP2-EREBP transcription factor
Qtkw-Wd.tab-7Bchr7B_692926289-chr7B_702176728TraesCS7B01G434600.1FBD-associated F-box protein
Qgy-Wd.mia-2Achr2A_20237446-chr2A_33006222TraesCS2A01G057700.1NBS-LRR disease resistance protein
Qgy-Wd.3P-2A
Qgy-Irr.mia-2A
Qgy2-Irr.3P-6Bchr6B_28012560-chr6B_35789585TraesCS6B01G053900.1Cysteine proteinase
Qsm2-Irr.mah-6B
Qgy2-Irr.mah-6B
Qgns2-Irr.tab-4Achr4A_681683121-chr4A_684909655TraesCS4A01G411500.1NAD(P)H-quinone oxidoreductase subunit H
Qgns-Wd.3P-4A
Qgns2-Irr.tab-4A
Qsl1-Irr.tab-4Achr4A_632236000-chr4A_640906743TraesCS4A01G366600.1F-box family protein
Qsl-Wd.3P-2Achr2A_15816001-chr2A_21812312TraesCS2A01G056900.1Multidrug resistance protein, ABC transporter family protein
Qsl-Wd.mia-2Bchr2B_25477352-chr2B_26987136TraesCS2B01G055300.1NBS-LRR disease resistance protein-like
Qsm-Wd.tab-2Bchr2B_485443263-chr2B_565076231TraesCS2B01G359800.1Mitochondrial inner membrane protease ATP23
Qsm2-Irr.3P-2Bchr2B_779912793-chr2B_785208751TraesCS2B01G596900.1Acyl-CoA-binding domain-containing protein
Qsm-Irr.3P-5Achr5A_581488651-chr5A_589302806TraesCS5A01G383800.1Heat shock transcription factor
Qph2-Irr.mia-6Bchr6B_659809861-chr6B_662562269TraesCS6B01G384600.1Stigma-specific protein Stig1
Qph1-Irr.tab-4Bchr4B_21573518-chr4B_37529724TraesCS4B01G042200.2Serine/threonine-protein kinase
Qph-Wd.tab-4B
Qph1-Irr.mia-6Bchr6B_569936355-chr6B_623369219TraesCS6B01G320500.1F-box family protein
Qph-Irr.tab-7Achr7A_82949085-chr7A_85912154TraesCS7A01G130300.1Protein DETOXIFICATION
Qph1-Wd.mia-7Achr7A_13905540-chr7A_19958972TraesCS7A01G036200.160 kDa chaperonin
Qph1-Wd.3P-7A
Qph-Wd.mah-7Dchr7D_451622823-chr7D_554279150TraesCS7D01G375100.1Phosphatidylcholine:diacylglycerol cholinephosphotransferase 1
Qbio-Wd.3P-5Achr5A_549192141-chr5A_555596100TraesCS5A01G349500.1Plant regulator RWP-RK family protein
Qbio-Wd.mah-5A
Qhi2-Irr.mia-2Achr2A_2810448-chr2A_13880947TraesCS2A01G015400.1Cytochrome P450
Qhi2-Irr.tab-1Bchr1B_402043386-chr1B_516951252TraesCS1B01G286300.1Cytochrome P450
Qhi1-Wd.mah-3Bchr3B_122826152-chr3B_190473903TraesCS3B01G156900.1B-box zinc finger family protein
Qhi2-Wd.mah-3Bchr3B_411269889-chr3B_452490772TraesCS3B01G264100.1Protein CHUP1
a: chromosome name_chromosome position in bp
Publisher’s Note: MDPI stays neutral with regard to jurisdictional claims in published maps and institutional affiliations.

