Abstract
Understanding genetic diversity and structure in natural populations and their suitable habitat response to environmental changes is critical for the protection and utilization of germplasm resources. We evaluated the genetic diversity and structure of 24 A. chinensis populations using simple sequence repeat (SSR) molecular markers. The potential suitable distribution of tetraploid A. chinensis estimated under the current climate and predicted for the future climate was generated with ecological niche modeling (ENM). The results indicated that the polyploid populations of A. chinensis have high levels of genetic diversity and that there are distinct eastern and western genetic clusters. The population structure of A. chinensis can be explained by an isolation-by-distance model. The results also revealed that potentially suitable areas of tetraploids will likely be gradually lost and the habitat will likely be increasingly fragmented in the future. This study provides an extensive overview of tetraploid A. chinensis across its distribution range, contributing to a better understanding of its germplasm resources. These results can also provide the scientific basis for the protection and sustainable utilization of kiwifruit wild resources.
1. Introduction
Kiwifruit is a perennial, dioecious economic fruit that is native to China. It is one of the best examples of the successful domestication and commercialization of crops in the early 20th century [1]. Kiwifruit is not only rich in vitamin C and minerals but also has medicinal and ornamental value [2,3]. In recent years, the value of kiwifruit in the international market is becoming more and more prominent [4]. The total output of cultivated kiwifruit in the world is about 3 million tons, of which China accounts for about half [1]. The chromosome ploidy of kiwifruit is complex, with intertaxon ploidy variation having so far been detected in at least 13 Actinidia species (2n = 2x = 58, 2x, 3x, 4x, 5x, 6x, 7x, 8x, etc.). Previous studies have shown that Actinidia has experienced at least eight interspecific hybridization events in the process of evolution [5]. With the rapid evolution of kiwifruit backbone lineages caused by frequent interspecific hybridization and the formation of hybrid populations derived from these lineages, reticulate species is an important mechanism for the maintenance of biodiversity [6]. Actinidia chinensis is the species with the highest domestication level and the greatest economic benefit among the species of Actinidia [7]. Although the germplasm resources are abundant, their genetic diversity is also being threatened and challenged [8]. The effective evaluation of germplasm will be needed to ensure the sustainable and healthy development of the kiwifruit industry globally [9].
In recent years, the number of studies on the genetic diversity of A. chinensis has been increasing, providing us with a better understanding of this fruit crop [10,11]. Crossbreeding between different chromosome ploidy levels of A. chinensis can produce fertile offspring, which is often accompanied by excellent traits for crop improvement [5,9]. The most obvious example is that tetraploid varieties have better resistance to canker than diploid varieties [12]. Tetraploids also yield bigger fruits and better quality, and also have a better adaptability and faster growth speed [13]. Among the current cultivars, tetraploid varieties are most prevalent [9]; therefore, it is desirable to evaluate the genetic variation of tetraploid individuals from natural populations. However, population genetic studies of tetraploid A. chinensis are scarce, and the origin of tetraploid A. chinensis remains unclear [8]. In previous studies, researchers either focused on the analysis of genetic diversity and the population structure of A. chinensis in limited regions [14] or focused on diploid populations [8]. Neither the population structure nor genetic diversity of tetraploid A. chinensis have been reported.
Simple sequence repeat (SSR) markers, which are based on genome sequences, are easy to use, relatively low in cost, and have high polymorphism and extensive genetic information. It is the most widely used type of DNA molecular marker to characterize genetic germplasms, with many alleles at each locus [15]. Previous studies have indicated that climate is the main environmental factor affecting species distribution at a regional scale [16]. Ecological niche modeling (ENM) has played an important role in studying the effects of climate change on species distribution. The Maxent model has been shown to have the best predictive accuracy and stability [17,18] for revealing the effects of global climate change on species distribution [19]. In this study, we investigated the genetic diversity of natural populations of A. chinensis dominated by tetraploid individuals based on 40 microsatellite markers. In addition, 52 distribution points of tetraploid A. chinensis were used for niche simulation. The objectives of this study were to (1) evaluate the genetic diversity of the tetraploid component of A. chinensis; (2) describe the tetraploid population structure; (3) predict the potential suitable distribution for tetraploid A. chinensis in both current and future climate; and (4) provide breeding and conservation strategies for kiwifruit germplasm.
2. Results
2.1. Genetic Diversity of A. chinensis Populations
We detected 758 alleles for 24 A. chinensis populations. The average number of alleles per locus was 18.9, of which, the minimum number of alleles detected at each locus was 9 (at UDK96-009 locus) and the maximum number was 28 (at UDK96-034 locus). The polymorphism information content (PIC) varied from 0.213 (UDK96-028) to 0.924 (UDK96-019), with an average of 0.808 (Table S1). Most of the alleles were shared by the diploid and tetraploid populations, whereas 239 alleles were unique for the tetraploid populations and only 6 alleles were unique for the diploid populations (Table S2). At the population level, the effective number of alleles (Ne) ranged from 3.037 in ZG to 6.437 in ZY, averaging 5.124 alleles per population. The inbreeding coefficients (Fis) were all greater than zero, ranging from 0.080 (LA) to 0.389 (DN), with an average of 0.024 (Table 1). The expected heterozygosity (He) as estimated using GENODIVE ranged from 0.670 (NL) to 0.855 (DN), whereas the He estimated using POLYGENE ranged from 0.636 (ZY) to 0.795 (DN). However, the value of observed heterozygosity (Ho) calculated using POLYGENE ranged from 0.681 (NL) to 0.808 (LA), and the same trend has been observed in GENODIVE. The observed gene heterozygosity was lower than the expected gene heterozygosity. On average, the genetic diversity of the tetraploid population was higher than that of the diploid population, although it was different in some populations such as LA and PN. (Figure 1).

Table 1.
Genetic diversity of 24 A. chinensis populations based on 40 SSR markers.
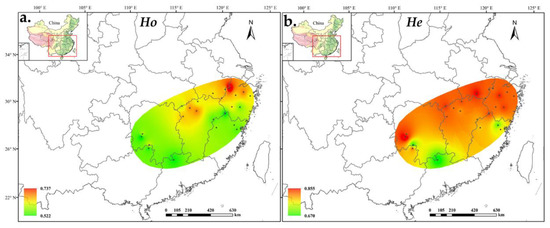
Figure 1.
Distribution of A. chinensis population diversity based on (a) observed heterozygosity and (b) expected heterozygosity.
2.2. Genetic Structure and Differentiation of A. chinensis
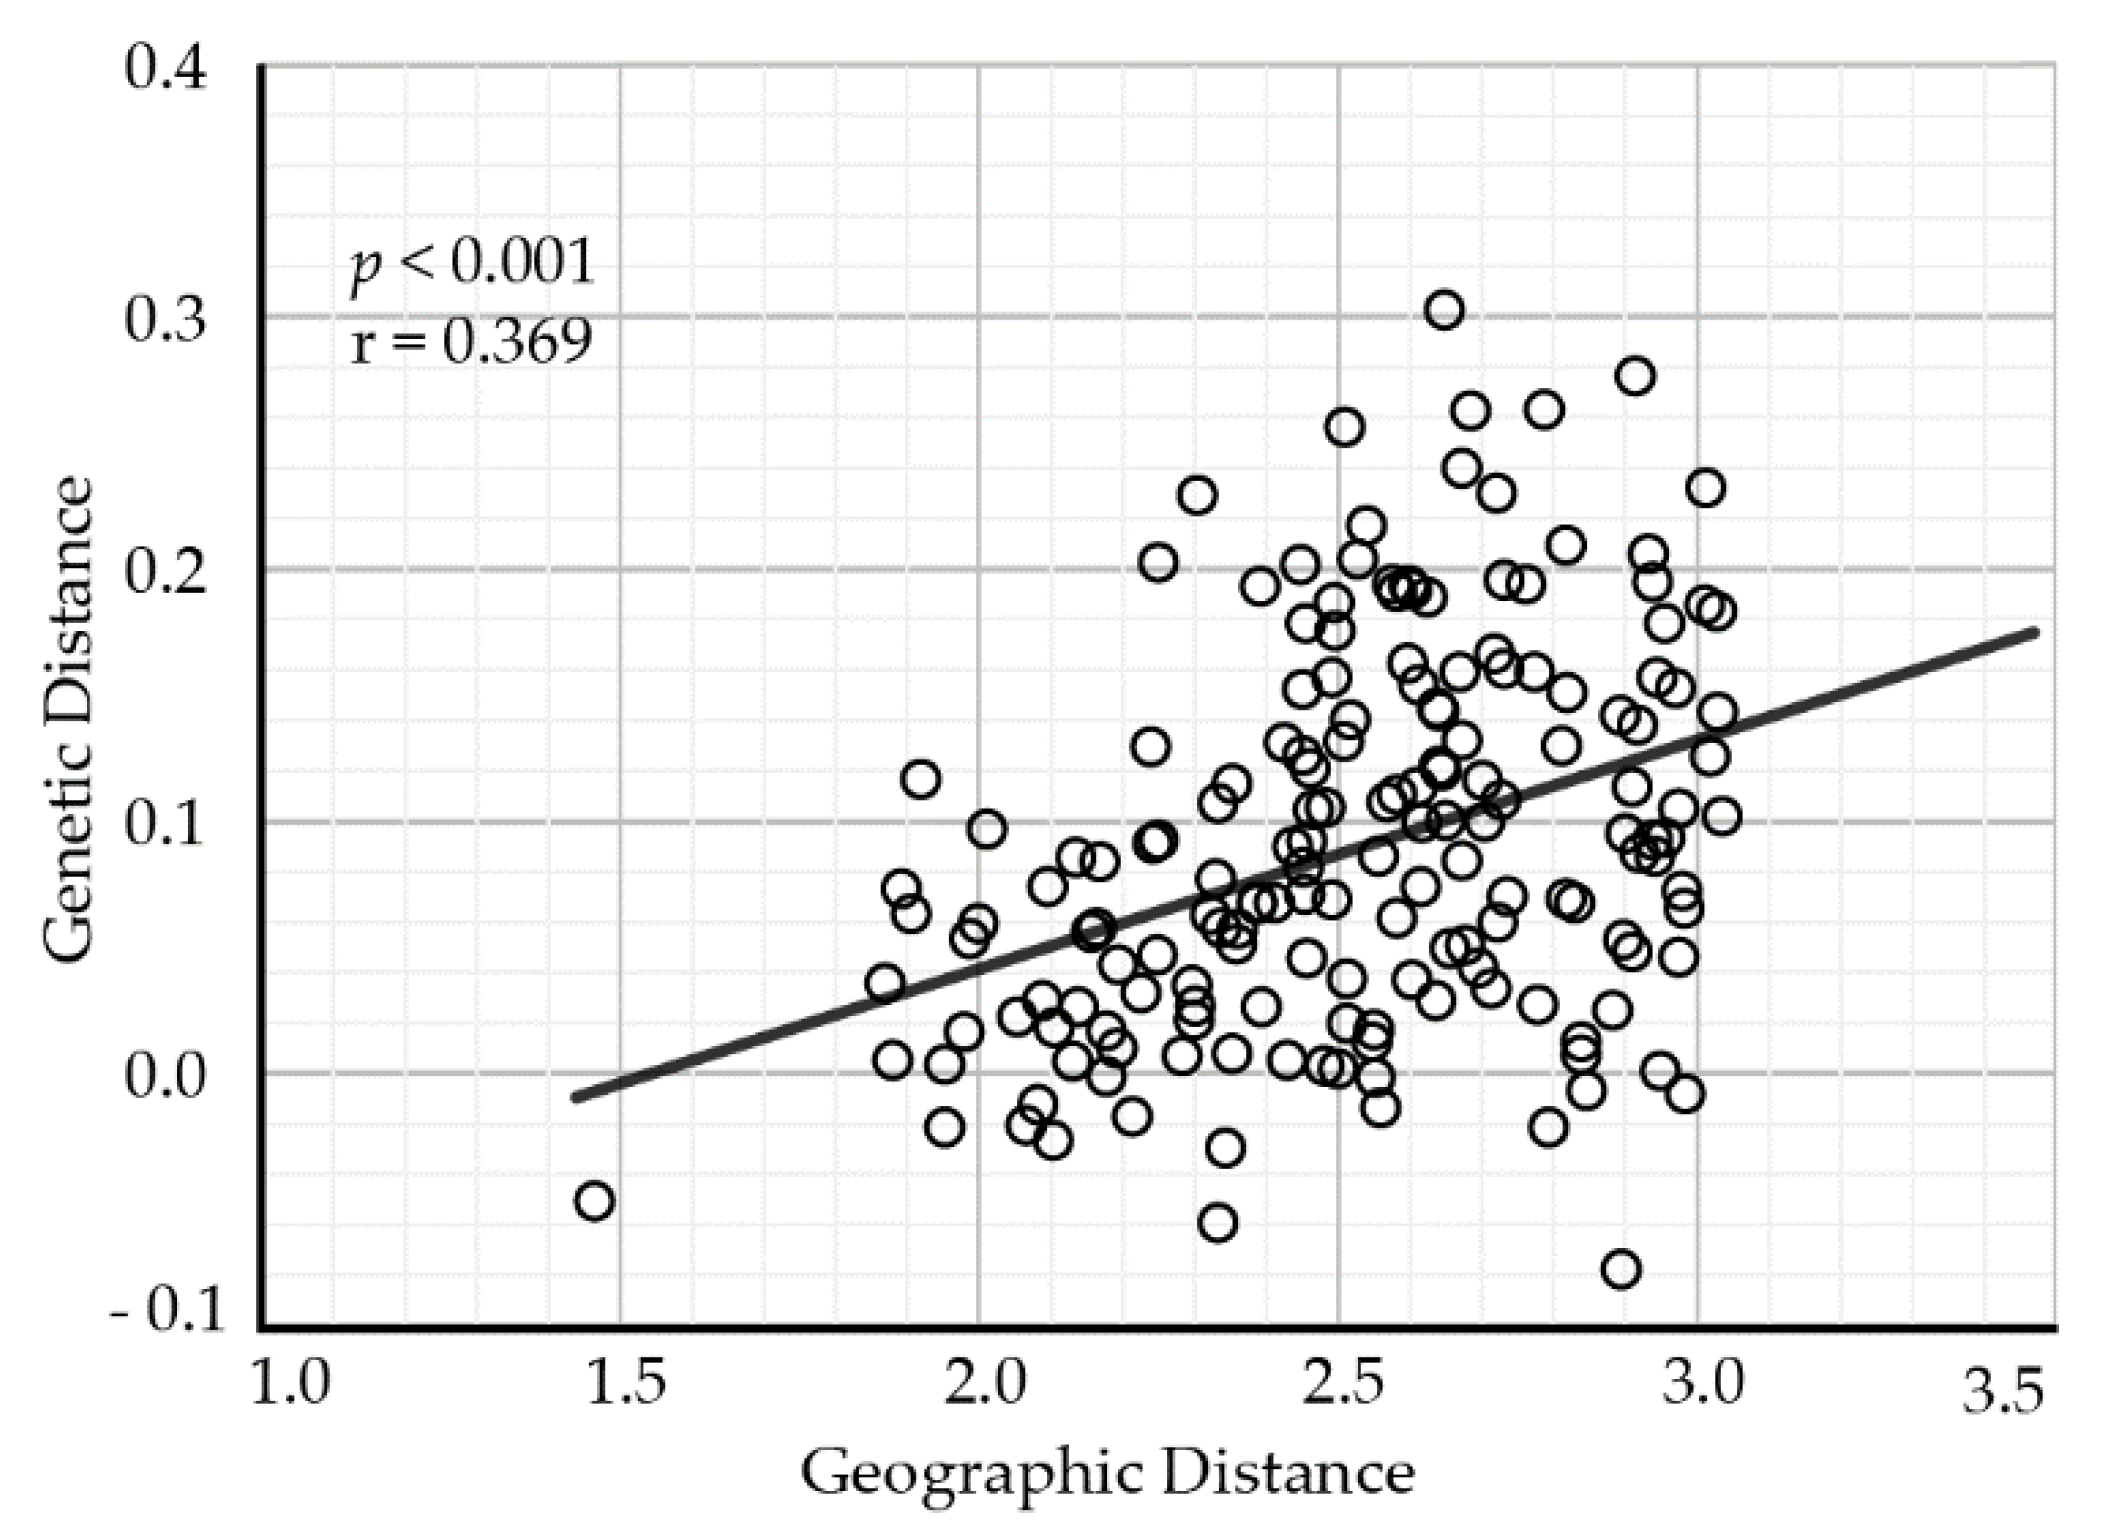
The pairwise comparisons of genetic differentiation between populations showed that GST ranged from 0.0002 between populations XN and TT to 0.176 between populations ZG and NL. Some populations, for example JX, QM, and XN, were less divergent from the other populations (Table S3). The results of the Mantel test revealed that geographical distance (the natural logarithm-transformed) was positively related to genetic distance (as measured by Slatkin’s linearized FST) among populations (Mantel test: r = 0.369, p < 0.001), indicating the presence of an isolation-by-distance effect (Figure 2).
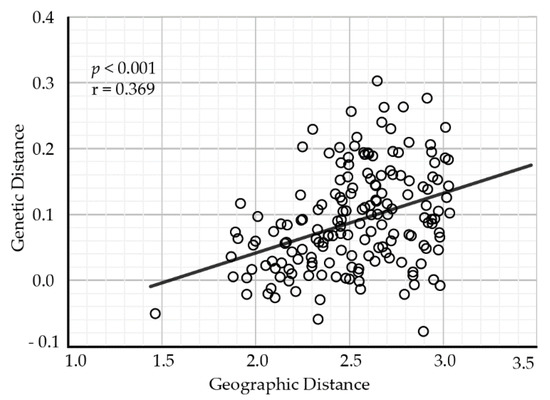
Figure 2.
The relationship between genetic differentiation and geographical distance for A. chinensis populations.
The purpose of the analysis of molecular variance (AMOVA) was to see if there was any genetic variation across populations as well as within populations. According to our results (Table 2), the AMOVA revealed that the genetic variation is mostly within populations (90.99%), whereas only 9.01% of variance was attributed to among-population differentiation. When the ploidy level was analyzed, only 3.17% of the genetic variation was distributed among diploids and tetraploids, whereas 96.83% of the total variation occurred within ploidy types.
Table 2.
Analysis of molecular variance (AMOVA) for A. chinensis populations.
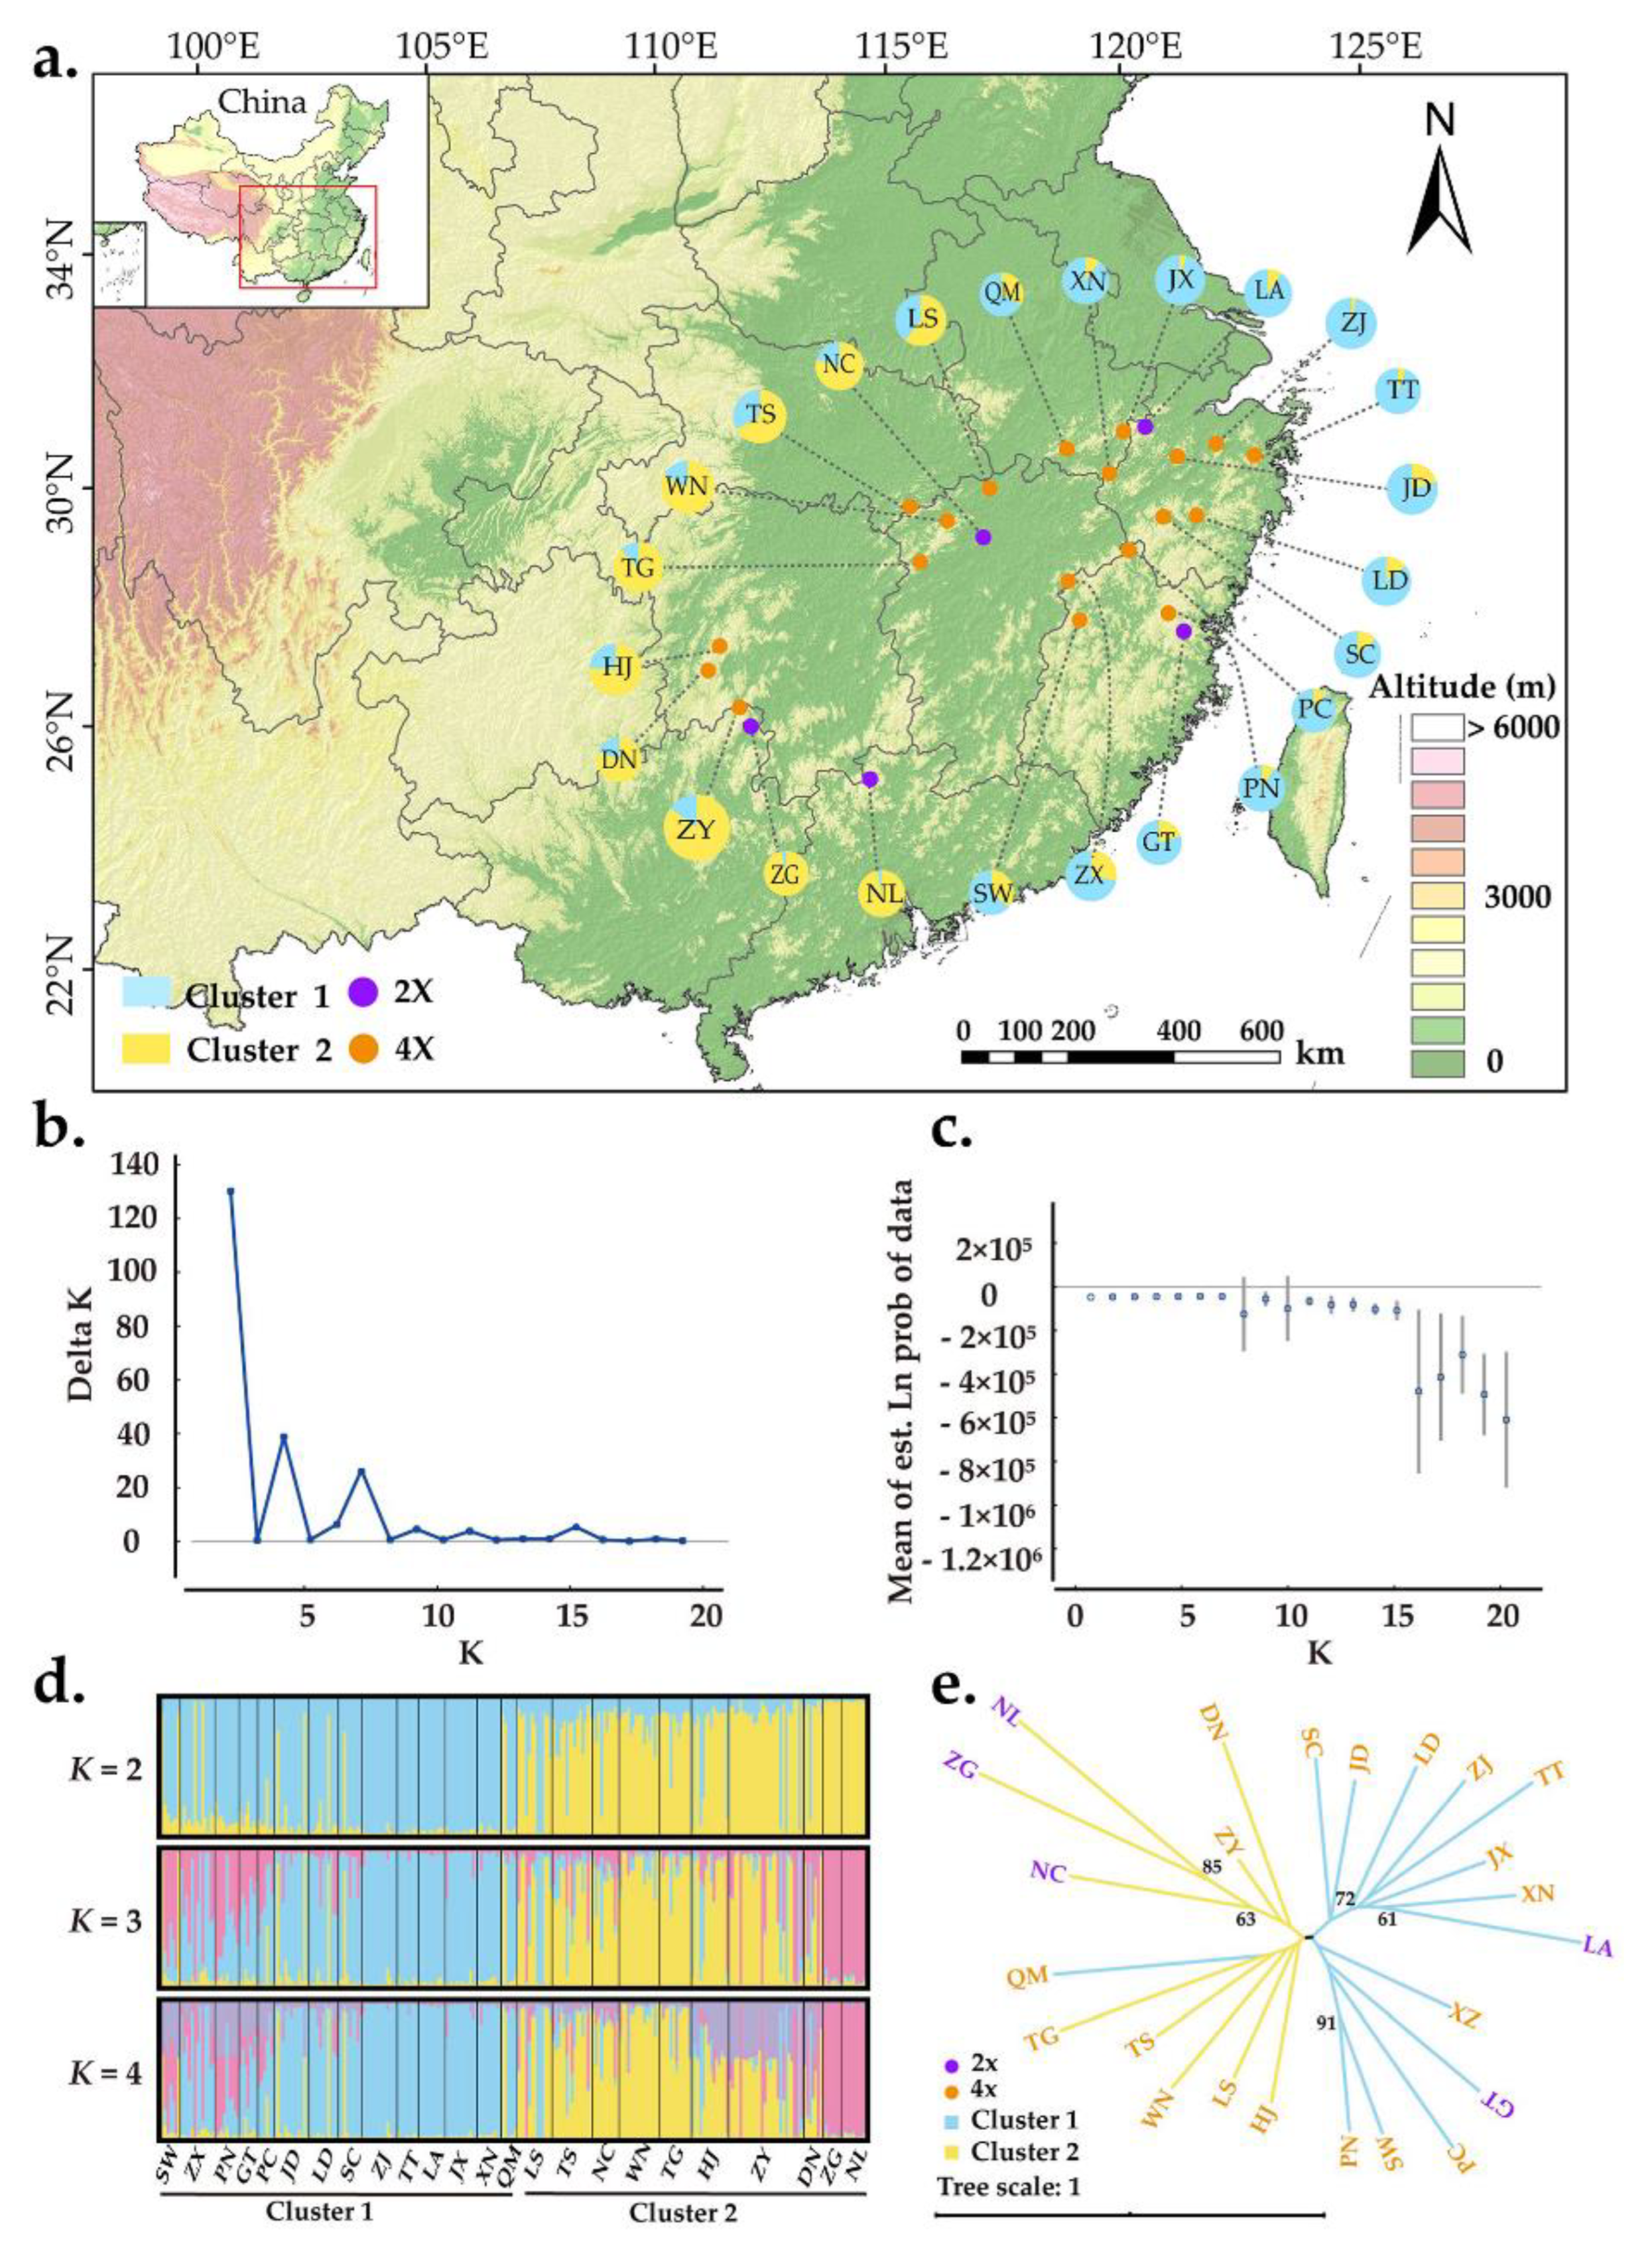
The Bayesian assignment revealed that K = 2 was the best value when LnP(K) was found to increase and ΔK was maximized (Figure 3b,c). This result suggested that there are two distinct genetic clusters: cluster 1 (eastern population) and cluster 2 (western population) (Figure 3a). Although the two clusters were relatively easy to distinguish, more individuals were shared between them (Figure 3d). As the K value increased, more and more individuals were found to have mixed ancestry from multiple genetic clusters (Figure 3d). Geographically, individuals sampled from the same location did not fully cluster together (Figure 3a). However, the populations in cluster 1 were generally distributed in eastern China, whereas populations from cluster 2 were distributed westward. The genetic relationships among A. chinensis individuals were further explored with principal coordinate analysis (PCoA), and the results were generally consistent with those of STRUCTURE (Figure S1). Furthermore, a neighbor-joining tree was constructed with genetic distances where populations were also divided into two groups, consistent with results of both STRUCTURE and PCoA. Diploid and tetraploid populations were mixed in both genetic groups.
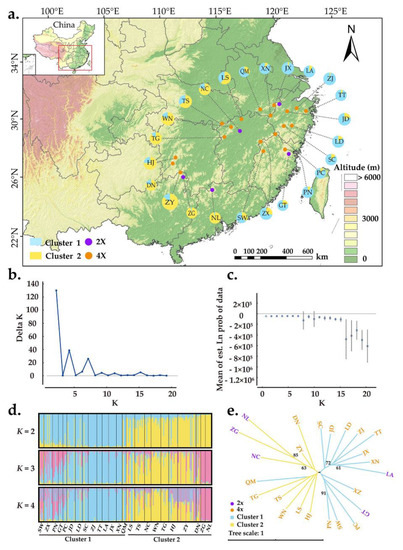
Figure 3.
Population genetic structure of A. chinensis. (a) Geographic distribution of the 24 populations. Each population is color-coded in different clusters according to the results of STRUCTURE analysis. The purple and orange dots represent diploid and tetraploid populations, respectively; (b) the ΔK values are presented for K = 1–20; (c) the likelihood L(K) values presented for K = 1–20; (d) histogram of the Bayesian assignment for 263 individuals in 24 populations of A. chinensis. STRUCTURE plots are presented for K = 2 to K = 4, respectively. Each vertical bar represents one individual and the capital letters on the abscissa represent different populations; (e) neighbor-joining tree based on genetic distances for 24 natural populations of A. chinensis. The robustness of each node was evaluated by 1000 bootstrap replicate.
2.3. Environmental Niche of Tetraploid A. chinensis
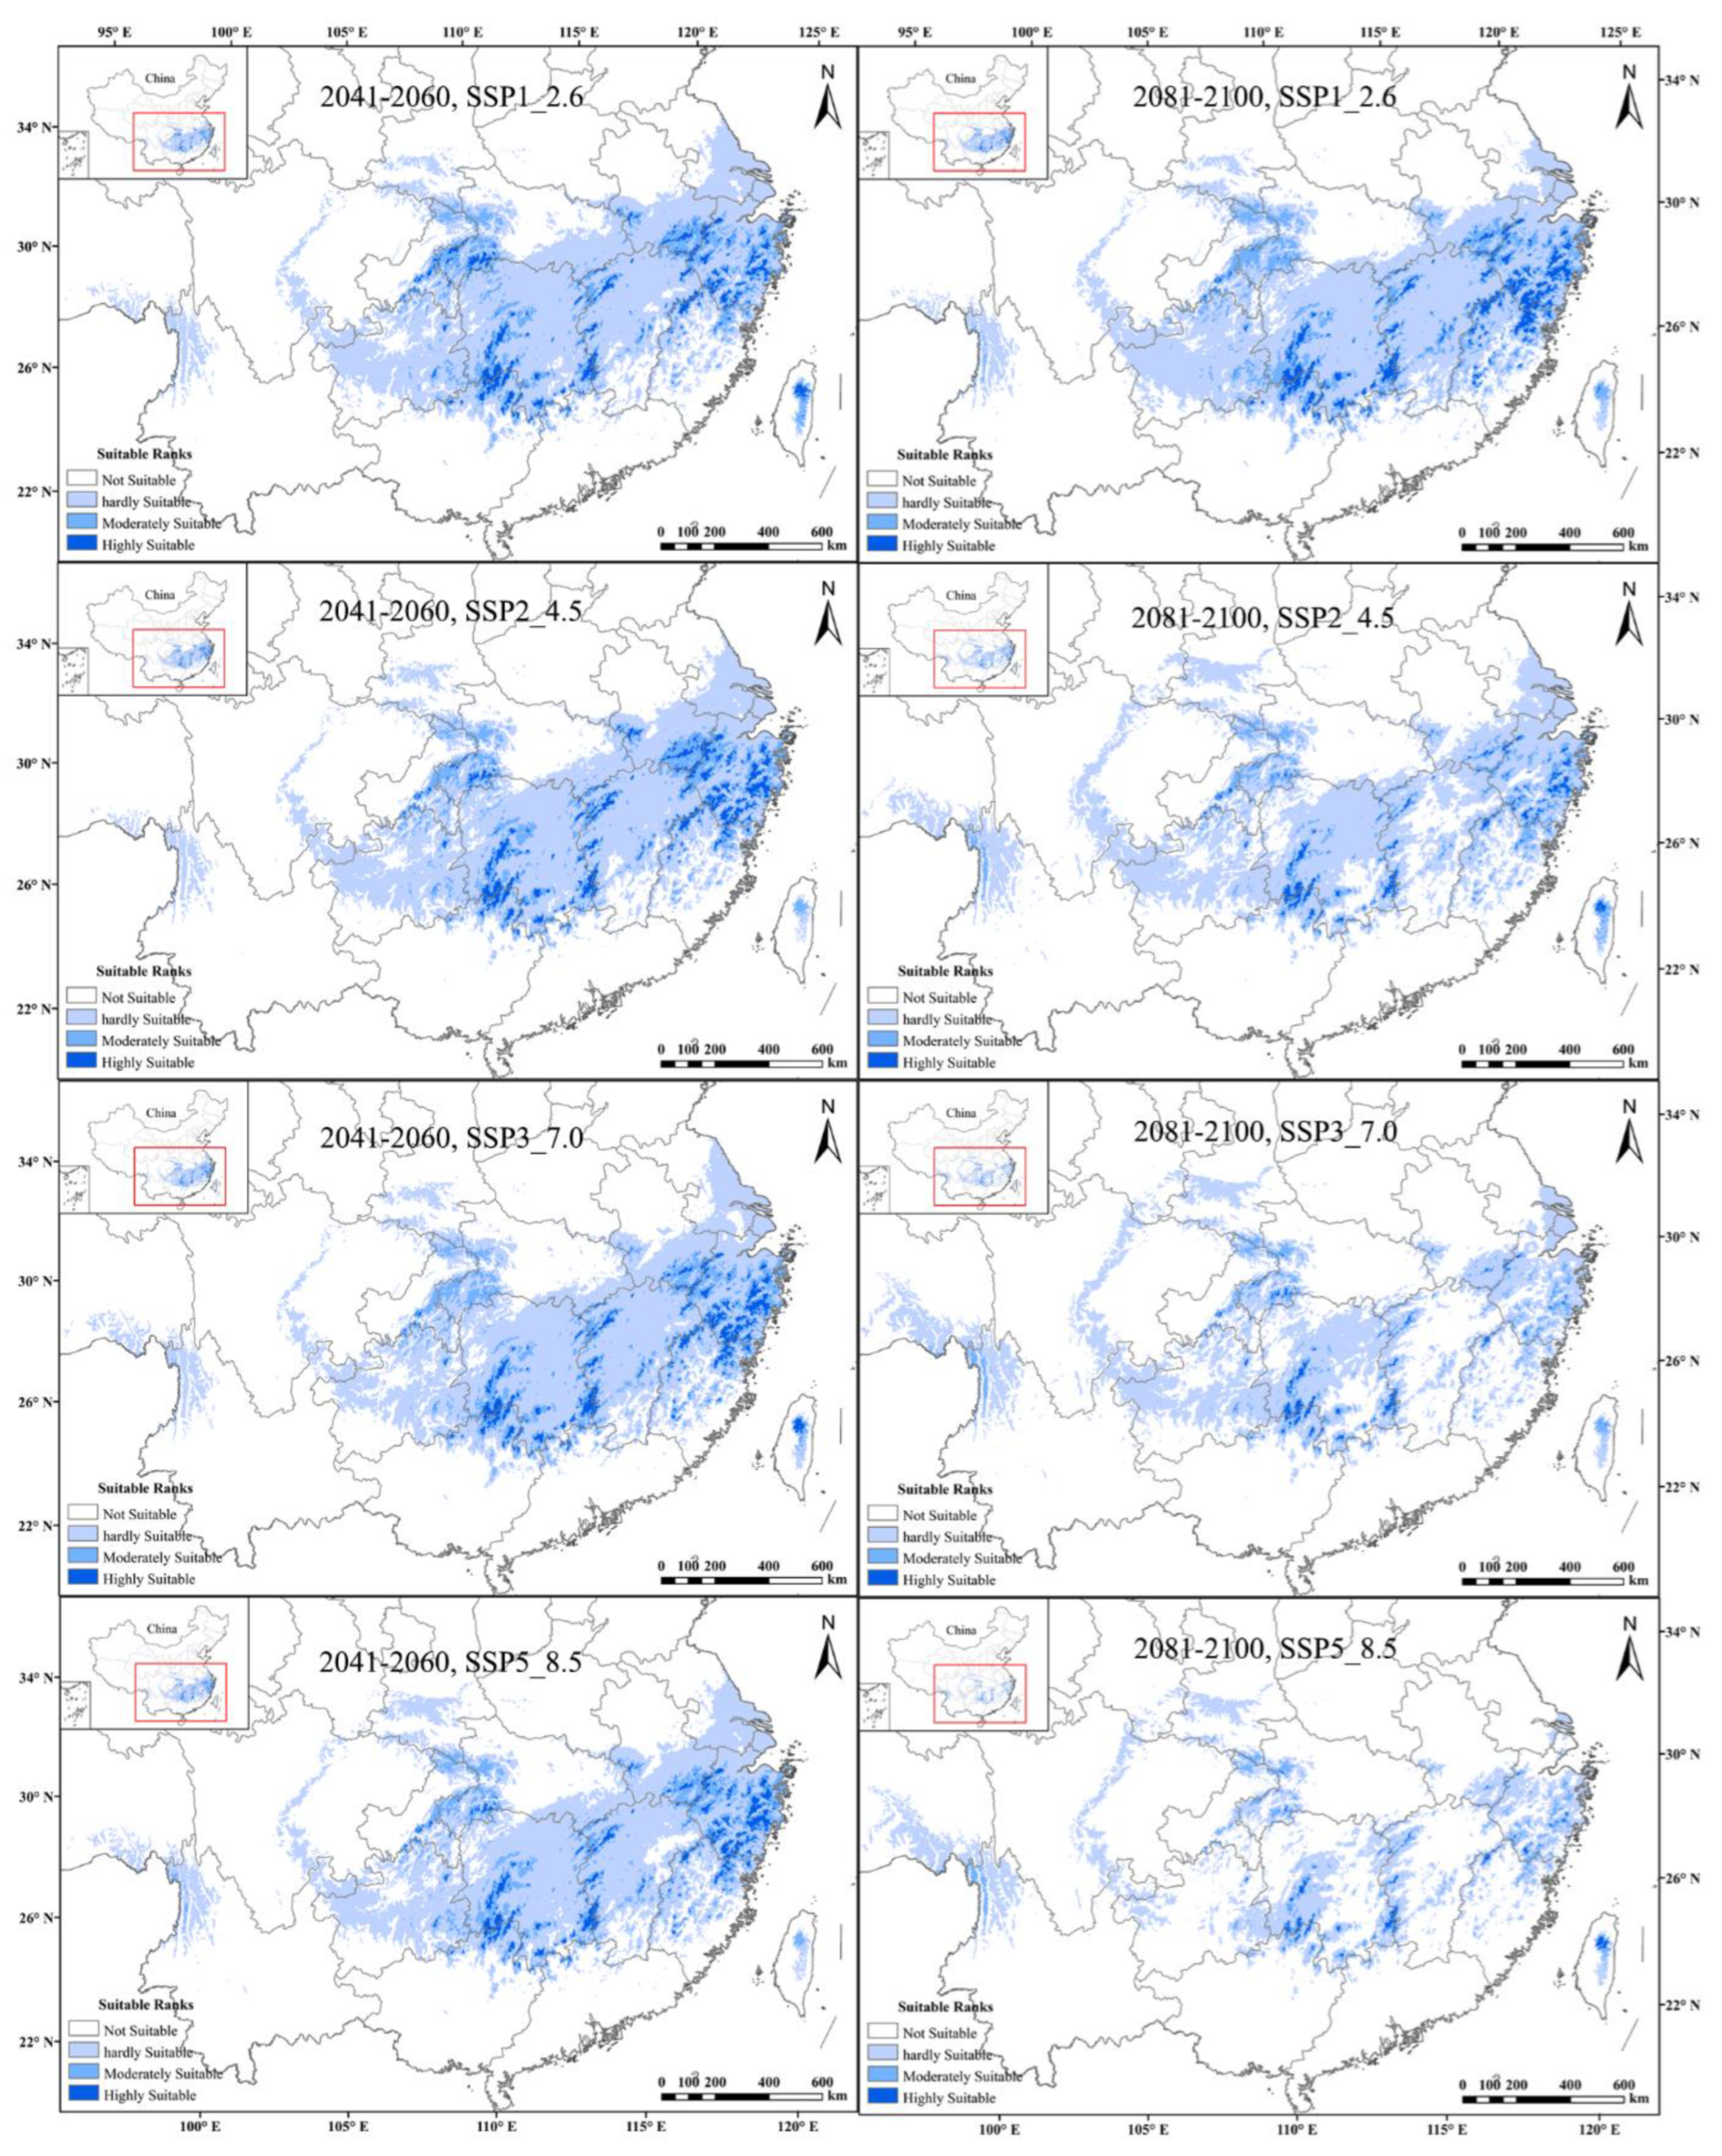
The AUC values of ENM for tetraploids with each climate scenario were high (i.e., a greater than 0.9), indicating that all models performed well in predicting the suitable habitat under all climate scenarios. Under the current climatic scenarios, the potentially suitable area was a good representation of the actual distribution of tetraploid A. chinensis. The results of prediction and reclassification showed that the potentially suitable area of tetraploid A. chinensis accounted for 11.3% of the total land area of China. In addition, the suitable habitats could be subdivided into hardly suitable habitats, moderately suitable habitats, and highly suitable habitats, and they accounted for 46.6, 38.2, and 15.5 % of the total suitable area, respectively (Figure 4).
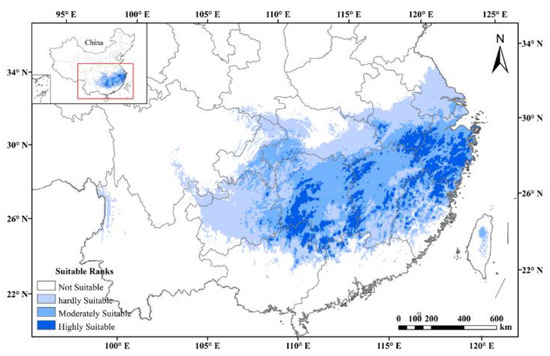
Figure 4.
Potential distributions of tetraploid A. chinensis under current climatic scenarios in China.
From the predictions of future global warming scenarios, it was found that the potential distribution area of tetraploid A. chinensis decreased substantially under eight different future climate scenarios. The tetraploids’ highly suitable habitats were predicted to decrease by up to about 95.3% under the 2081–2100, SSP5_8.5 scenario, the highest level of the greenhouse gas emission scenarios. Additionally, the moderately and hardly suitable distribution of tetraploid A. chinensis showed the same decreasing trend. Additionally, under the 2081–2100, SSP5_8.5 scenario, the reduction rate of tetraploids’ moderately and hardly suitable habitats was found to be the highest, with a total of 50.8% (Figure 5). In conclusion, with the intensification of global climate change, the potentially suitable area of tetraploid A. chinensis will be gradually lost, and their habitat will be increasingly fragmented.
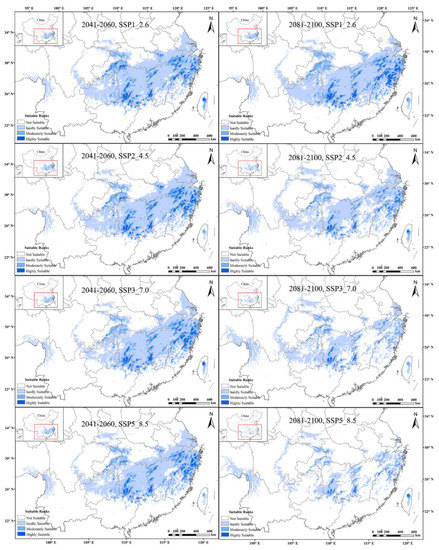
Figure 5.
Comprehensive habitat suitability of tetraploid A. chinensis under different future scenarios in China.
3. Discussion
3.1. Genetic Diversity of Diploids and Tetraploids
Our results reveal the existence of the high genetic diversity of tetraploid A. chinensis in subtropical China. The average PIC of the tetraploid populations in this study was also greater than the average of the diploid populations. This is consistent with the results of Wang et al. [14], where the average PIC of wild A. chinensis populations from several hexaploid populations in the Qinling Mountains was higher than the values of present tetraploid populations. These results imply that polyploid populations generally have a higher level of genetic diversity compared to diploid populations. The same evidence can also be found in our Ho or He values of diploids and tetraploids in this study.
In general, the level of genetic diversity possessed by a species reflects its prepared evolutionary potential. Therefore, species with low levels of genetic diversity are more likely to become extinct [20]. During the process of production and cultivation, the comprehensive performance of tetraploid kiwifruit is often better than that of diploid germplasms, especially in stress resistance. For example, tetraploid varieties have stronger resistance to PSA (Pseudomonas syringae pv. actinidiae) than diploid varieties, which has been observed in many orchards.
3.2. Population Genetic Structure and Differentiation
In this study, A. chinensis individuals formed two genetic groups in both principal coordinate analysis (PCoA) and Bayesian model-based clustering (Figure S1 and Figure 3d). In addition, the clustering results of STRUCTURE and PCoA were corroborated by the topology of a neighbor-joining tree (Figure 3e). Although some individuals were shared between these two clusters, it is still easy to distinguish their east/west pattern of geographical distribution (Figure 3a). In addition, the Mantel test revealed a positive correlation between genetic divergence (as Slatkin’s linearized FST) and geographical distance (Figure 2), suggesting that genetic differentiation in tetraploid A. chinensis followed a pattern of isolation by distance. This result is consistent with the previous IBD analysis of A. chinensis diploid populations [8], indicating an isolation-by-distance effect. The above results suggest that physical barriers play an additional role in shaping patterns of gene flow between clusters [21], although the genetic differentiation between these two clusters is low (FST = 0.025) (Table 2). The differentiation between clusters 1 and 2 could be explained by climatic and geological changes since the Pliocene, which led to the fragmentation of the habitat of A. chinensis and the development of a geographical barrier, as revealed in our studies [22].
In the present study, of the total genetic variation partitioned, 9.01% was attributed to the differences among populations, and 90.99% to the differences among individuals within populations, in agreement with the findings of previous studies on A. chinensis [8,14]. The low level of genetic differentiation among populations indicated that gene flow among populations was not limited. The fruit of A. chinensis is a desirable food source for frugivory animals. Additionally, the seeds of A. chinensis can germinate readily upon maturation and are potentially capable of establishing a new population. Thus, high levels of gene flow among A. chinensis population are expected.
3.3. Occurrence of Tetraploids in A. chinensis
Polyploidy is widely distributed in plants, and polyploidization is regarded as a major force driving plant evolution and speciation [23,24,25]. Polyploid plants often originate from diploid ancestors, so they usually exhibit increased vigor and competitiveness [26,27] and show a preference for distinct habitats with niche expansion [28,29,30]. This study is the first report of tetraploid population genetic diversity and structure in A. chinensis. Although previous studies [22,31] have also involved a few tetraploidy individuals, none have been able to focus on tetraploidy populations. Tetraploid A. chinensis is generally considered to be an autopolyploid, and diploid A. chinensis was one of its ancestors [32,33]. All tetraploid populations in this study did not form a single cluster in the STRUCTURE or PCA analyses. However, the tetraploid populations always clustered into the same groups as geographically adjacent diploid populations. This suggests that polyploid populations likely originated polyphyletically from their neighboring diploid populations and coexisted with their diploid parents within a certain geographic range. A similar inference has also been found in previous studies of Galax urceolata [34] and G. pentaphyllum [35]. More definitive assessment as to whether polyploidization in A. chinensis arose once or multiple times will require other data such as high-throughput DNA sequence methods.
3.4. Implications for Conservation and Utilization
A. chinensis is listed in the list of the national key protected wild plants. From a conservation perspective, genetic diversity estimates can be used in making decisions about the management of extant populations of endangered species. In the present study, the high level of genetic diversity maintained within wild populations of A. chinensis is encouraging. However, the result of the ENM showed significant decreases in the area of the potential distribution of tetraploid A. chinensis under various future climate scenarios. This suggests that climate change will shrink the potential suitable habitat of tetraploid A. chinensis under future different emission scenarios. This mainly results from changes in the distribution of temperature and precipitation, which directly affects the boundaries and trends of plant growth [36]. With climatic change in the future, the distribution area of tetraploid A. chinensis will tend to migrate to high elevations, and its habitat will be more fragmented. Under these scenarios, there will be more pressure on the conservation and management of tetraploid A. chinensis resources in the future.
The high genetic diversity observed in tetraploid A. chinensis populations suggests their great potential for kiwifruit breeding. For example, the yellow flesh cultivars “Jintao” is a tetraploid, which is a Chinese selection from wild resources and is widely planted in Europe, South America, and China. Moreover, two genetic clusters were revealed in the A. chinensis populations, suggesting that intraspecies crosses using the individuals from each of these clusters would be useful in cultivar development of kiwifruit.
4. Materials and Methods
4.1. Sample Collection
We obtained 263 A. chinensis individuals from the National Actinidia Germplasm Repository of China, which were collected from 24 wild populations (Figure 3a, Table S4) in 2014–2019. The germplasm samples consisted of 43 diploids and 220 tetraploids. The ploidy levels of most samples were determined in previous studies [22] except 15 individuals from TS, which were determined in this study (Figure S2) using a flow cytometric measurement (FCM) with a CyFlow Ploidy Analyser (Partec, Munich, Germany), as per the protocol in Li et al. [37].
4.2. DNA Extraction and Microsatellite Genotyping
Total genomic DNA was extracted from the silica-gel-dried leaves with the cetyltrimethylammonium bromide (CTAB) method [38]. The polyphenols and polysaccharides in kiwifruit leaves were removed at the beginning of extraction. A NanoDrop 8000 spectrophotometer (Thermo Fisher Scientific, Waltham, MA, USA) and 1% agarose gels were used to detect the concentration and quality of the DNA extracted. To assess nuclear DNA polymorphism, 263 individuals were genotyped at 40 nuclear microsatellite loci. These microsatellite polymorphic primer pairs used were a subset of those from Huang et al. [39]. All forward primers were labeled with four kinds of 5′-fluorescein bases (FAM, HEX, TRAMA, or ROX). PCR amplification followed the protocol derived from Huang et al. [39]. Fluorescent-labeled PCR products were supplemented with the internal size standard GeneScan 500 LIZ and separated on a 3730xl DNA Analyzer (Applied Biosystems, Waltham, MA, USA). The detection bands of 40 markers were scored with Genemapper version 4.1. Microsatellite quality was checked for the presence of scoring errors, and large allele dropout was examined with MSAnalyser.
Genotyping microsatellite data corresponding to polyploids can be problematic because of the difficulties in assigning the correct allele dosage for each locus and individual [40,41,42]. In addition, it was also difficult to estimate the allele copy number in tetraploids based on electropherogram peak height, as in Esselink et al. [41,43]. Thus, we created two different format datasets for the next analysis. For those analyses (GENODIVE, POLYGENE, and STRUCTURE) which allow codominant data or ambiguous genotypes, we used genotypic data that were exported from Geneious in the GeneMapper format. Others used the ‘marker phenotypes’ or ‘allelic phenotypes’ dataset which was a binary matrix created by recording the presence (1) or absence (0) of alleles for each microsatellite locus per accession [44,45,46].
4.3. SSR Data Analysis
The standard population genetic diversity statistics (such as FST) in this study could not be calculated using traditional analytics software [41] because of the tetraploid nature of most A. chinensis samples and the dosage effect of polyploid alleles. Therefore, we used POLYSAT 1.5-0 [47] and GENODIVE version 3.04 [44], which can handle genetic data from polyploids or mixed-ploidy datasets and corrects for the unknown dosage of alleles in partial heterozygotes.
Genetic diversity was evaluated through the following descriptive statistics: the number of alleles (Na), effective number of alleles (Ne), and observed (Ho) and expected (He) heterozygosity and inbreeding coefficient (Fis), all of which were calculated with GENODIVE. As software developed specifically for the analysis of polyploid genetic data, POLYGENE v1.2 can take into account both polyploid genotypic ambiguities and double reduction [48] and can also infer possible genotypes and their posterior probabilities based on allelic phenotype and inheritance models. To take advantage of these benefits, the observed (Ho) and expected (He) heterozygosity, polymorphic information content (PIC), and Shannon diversity index (I) were also estimated for each population and locus in POLYGENE v1.2. Differentiation among A. chinensis populations was assessed with GST [49]. In addition, to investigate the extent of genetic differentiation among A. chinensis populations, analysis of molecular variance (AMOVA) [50] was implemented in POLYGENE. We used AMOVA to examine genetic variation among populations, ploidy, and the two groups separately. To assess the effect of geographic conditions on genetic divergence, the isolation by distance (IBD) was tested with a Mantel test of 10,000 permutations to detect the relationship between geographic distance and genetic distance among populations. To accommodate the existence of polyploid populations, Slatkin’s linearized FST was adopted as the measure of genetic distance [51]. Principal coordinate analysis (PCoA) was performed with the Cavalli-Sforza (1967) chordal distance [52]. Previous studies have shown that in the absence of dose information, principal coordinate analysis is the distance measure with the least bias [46].
To reveal the number of clusters, a Bayesian analysis under an admixture model with correlated allele frequencies was performed with the program STRUCTURE 2.3.4 [53,54]. The potential number of genetic clusters (K) varied from 1 to 20. Ten independent simulations were run for each value of K with 100,000 burn-in steps followed by 1,000,000 Markov chain Monte Carlo (MCMC) steps. The optimum K was inferred with the online program STRUCTURE HARVESTER [55,56]. The program CLUMPP v1.1.2 [57] was used to permute the independent replicates for the optimum value of K. The final bar and pie charts for the populations was plotted with District v1.1 [58] and ArcMap v10.3 (ESRI, Redlands, CA, USA). To evaluate genetic relationships, a neighbor-joining tree based on DA genetic distance was established for A. chinensis populations with POPTREE v.2 [59].
4.4. Species Distribution Models (SDMs)
Ecological niche modeling (ENM) was used to predict suitable current and future distribution ranges of tetraploid A. chinensis with Maxent v.3.4.0 [60,61]. The present geographic distribution of tetraploid A. chinensis was represented by 52 data points extracted from previous studies [22]. In addition, six bioclimatic parameters were identified for ENM, which were the same variables used in a previous study [22]. These parameters with identical spatial resolution were downloaded from the WorldClim Databases (http://www.worldclim.org/, accessed on 1 December 2021) [62]. The future data (i.e., 2041–2060 and 2081–2100) were downloaded from the BCC-CSM2-MR climate change modeling data under the shared socio-economic pathway (SSP). The 1–2.6, 2–4.5, 3–7.0, and 5–8.5 scenarios will be ultimately released by IPCC Assessment Report 6 (AR6). Unlike representative concentration pathways (RCPs), SSPs take into account the socioeconomic and land use impacts on the development of regional climate change when projecting greenhouse gas (GHG) emission scenarios for different climate policies in the future [63]. In this study, the model quality was assessed with cross-validation comprising 10 replicates with 75% of the data for model training and 25% of the data for model testing. The maximum number of background points was 10,000. To calibrate the model goodness of fit, the area under the receiver operating characteristics curve (AUC) was examined to verify the model precision [64]. For further analysis, the result of ENM was imported into ArcGIS 10.3 (ESRI) and classified as four possible habitat types, including “not” (<0.1), “hardly” (0.1–0.35), “moderately” (0.35–0.65), and “highly” (>0.65) suitable habitats.
5. Conclusions
This study revealed the genetic diversity and structure of 19 tetraploid populations in A. chinensis. It also compared the genetic diversity and structure between two cytotypes within the A. chinensis. In addition, changes in potentially suitable regions for tetraploid A. chinensis were modeled with ENM. Based on the results of our analyses, considerable levels of genetic diversity exist among tetraploids in A. chinensis, and its potential suitable area will likely be reduced in the future. These results can serve as basic information by providing options to breeders to develop, through selection and breeding, new and more productive varieties that are adapted to changing environments. In addition, this will also provide a reference basis for the protection of wild tetraploid A. chinensis resources.
Supplementary Materials
The following supporting information can be downloaded at: https://www.mdpi.com/article/10.3390/plants11091154/s1, Figure S1: Principal coordinate analysis (PCoA) of A. chinensis based on 40 SSR markers; Figure S2: Schematic diagram of flow cytometric histogram of DAPI-stained nuclei of tetraploid A. chinensis (4x) analyzed simultaneously with the internal standard Actinidia chinensis cv. ‘Hongyang’ (2x). Table S1: Summary statistics for the 40 SSR markers across all A. chinensis populations with metrics of genetic diversity estimated using GENODIVE 3.04 and POLYGENE version 1.2b.; Table S2: 758 SSR alleles of 263 A. chinensis individuals sampled from 24 populations; Table S3: Pairwise divergence among A. chinensis populations based on Nei’s GST; Table S4: Sampling information for A. chinensis populations.
Author Contributions
Conceptualization, X.Y. and Z.L.; Software, Z.W. and G.H.; Resources Investigation and Collection, Z.L., Z.W., and G.H.; Data Curation, Z.W. and G.H.; Writing—Original Draft Preparation, Z.W., and G.H.; Writing—Review and Editing, X.Y., Z.W., C.Z., and Z.L.; Funding Acquisition, Z.L., and C.Z. All authors have read and agreed to the published version of the manuscript.
Funding
The work was supported by grants from the National Key Research and Development Program of China (2019YFD1000200) and the National Natural Science Foundation of China (31370251).
Institutional Review Board Statement
Not applicable.
Informed Consent Statement
Not applicable.
Data Availability Statement
Data are contained within the article.
Acknowledgments
We are grateful to Peter W. Fritsch for his assistance and advice.
Conflicts of Interest
The authors declare no conflict of interest.
References
- Testolin, R.; Huang, H.W.; Ferguson, A.R. (Eds.) The Kiwifruit Genome; Springer: Cham, Switzerland, 2016. [Google Scholar]
- Richardson, D.P.; Ansell, J.; Drummond, L.N. The nutritional and health attributes of kiwifruit: A review. Eur. J. Nutr. 2018, 57, 2659–2676. [Google Scholar] [CrossRef] [Green Version]
- Wang, S.; Qiu, Y.; Zhu, F. Kiwifruit (Actinidia spp.): A review of chemical diversity and biological activities. Food Chem. 2021, 350, 128469. [Google Scholar] [CrossRef] [PubMed]
- Sanz, V.; López-Hortas, L.; Torres, M.D.; Domínguez, H. Trends in kiwifruit and byproducts valorization. Trends Food Sci. Technol. 2021, 107, 401–414. [Google Scholar] [CrossRef]
- Huang, H.; Liu, Y. Natural hybridization, introgression breeding, and cultivar improvement in the genus Actinidia. Tree Genet. Genomes 2014, 10, 1113–1122. [Google Scholar] [CrossRef]
- Liu, Y.; Li, D.; Zhang, Q.; Song, C.; Zhong, C.; Zhang, X.; Wang, Y.; Yao, X.; Wang, Z.; Zeng, S.; et al. Rapid radiations of both kiwifruit hybrid lineages and their parents shed light on a two-layer mode of species diversification. New Phytol. 2017, 215, 877–890. [Google Scholar] [CrossRef] [PubMed] [Green Version]
- Huang, H.; Ferguson, A.R. Kiwifruit in China. N. Z. J. Crop. Hort. 2001, 29, 1–14. [Google Scholar] [CrossRef]
- Yu, W.; Wu, B.; Wang, X.; Yao, Z.; Li, Y.; Liu, Y. Scale-dependent effects of habitat fragmentation on the genetic diversity of Actinidia chinensis populations in China. Hortic. Res. 2020, 7, 172. [Google Scholar] [CrossRef]
- Li, D.; Liu, Y.; Li, X.; Rao, J.; Yao, X.; Zhong, C. Genetic diversity in kiwifruit polyploid complexes: Insights into cultivar evaluation, conservation, and utilization. Tree Genet. Genomes 2014, 10, 1451–1463. [Google Scholar] [CrossRef]
- Zhou, J.; Liu, Y.; Huang, H. Characterization of 15 novel single nucleotide polymorphisms (SNPs) in the Actinidia chinensis species complex (Actinidiaceae). Am. J. Bot. 2011, 98, e100–e102. [Google Scholar] [CrossRef]
- Bogačiovienė, S.; Česonienė, L.; Ercisli, S.; Valatavičius, A.; Jakštys, B.; Šatkauskas, S.; Paulauskas, A. Ploidy levels and genetic diversity of Actinidia arguta (Sieboldand Zucc.) Planch. ex Miq.; A. kolomikta (Rupr.and Maxim.) Maxim.; A. callosa Lindl.; and A. melanandra Franch.; accessions. Genet. Resour. Crop. Ev. 2019, 66, 1107–1118. [Google Scholar] [CrossRef]
- Tahir, J.; Brendolise, C.; Hoyte, S.; Lucas, M.; Thomson, S.; Hoeata, K.; McKenzie, C.; Wotton, A.; Funnell, K.; Morgan, E.; et al. Qtl mapping for resistance to cankers induced by Pseudomonas Syringae pv. Actinidiae (psa) in a tetraploid Actinidia chinensis kiwifruit population. Pathogens 2020, 9, 967. [Google Scholar] [CrossRef] [PubMed]
- Li, S.; Liu, X.; Liu, H.; Zhang, X.; Ye, Q.; Zhang, H. Induction, identification and genetics analysis of tetraploid Actinidia chinensis. R. Soc. Open Sci. 2019, 6, 191052. [Google Scholar] [CrossRef] [PubMed] [Green Version]
- Wang, Y.C.; Liao, L.; Li, Z.Z. Genetic differentiation of Actinidia chinensis and analysis of gene flow barriers in the Qinling Mountains, the species’ northern distribution boundary. Genet. Resour. Crop. Ev. 2018, 65, 881–895. [Google Scholar] [CrossRef]
- Van Inghelandt, D.; Melchinger, A.E.; Lebreton, C.; Stich, B. Population structure and genetic diversity in a commercial maize breeding program assessed with SSR and SNP markers. Theor. Appl. Genet. 2010, 120, 1289–1299. [Google Scholar] [CrossRef] [Green Version]
- Birch, E.L. A Review of “Climate Change 2014: Impacts, Adaptation, and Vulnerability” and “Climate Change 2014: Mitigation of Climate Change”. J. Am. Plan. Assoc. 2014, 80, 184–185. [Google Scholar] [CrossRef]
- Li, G.; Du, S.; Wen, Z. Mapping the climatic suitable habitat of oriental arborvitae (Platycladus orientalis) for introduction and cultivation at a global scale. Sci. Rep. 2016, 6, 30009. [Google Scholar] [CrossRef] [Green Version]
- Zhang, K.; Yao, L.; Meng, J.; Tao, J. Maxent modeling for predicting the potential geographical distribution of two peony species under climate change. Sci. Total Environ. 2018, 634, 1326–1334. [Google Scholar] [CrossRef]
- Wei, B.; Wang, R.; Hou, K.; Wang, X.; Wu, W. Predicting the current and future cultivation regions of Carthamus tinctorius L. using MaxEnt model under climate change in China. Glob. Ecol. Conserv. 2018, 16, e00477. [Google Scholar] [CrossRef]
- Knox, J.S.; Bezold, K.; Cabe, P.R.; Williams, S.; Simurda, M.C. Genetic diversity and population structure of the endemic disjunct species, Helenium virginicum (Asteraceae). Am. Midl. Nat. 2016, 175, 242–260. [Google Scholar] [CrossRef]
- Diniz-Filho, J.A.F.; Soares, T.N.; Lima, J.S.; Dobrovolski, R.; Landeiro, V.L.; Telles, M.P.D.C.; Rangel, T.F.; Bini, L.M. Mantel test in population genetics. Genet. Mol. Biol. 2013, 36, 475–485. [Google Scholar] [CrossRef] [Green Version]
- Wang, Z.; Zhong, C.; Li, D.; Yan, C.; Yao, X.; Li, Z. Cytotype distribution and chloroplast phylogeography of the Actinidia chinensis complex. BMC Plant Biol. 2021, 21, 325. [Google Scholar] [CrossRef] [PubMed]
- Grant, V. Plant Speciation; Columbia University Press: New York, NY, USA, 1981. [Google Scholar]
- Soltis, P.S.; Marchant, D.B.; Van de Peer, Y.; Soltis, D.E. Polyploidy and genome evolution in plants. Curr. Opin. Genet. Dev. 2015, 35, 119–125. [Google Scholar] [CrossRef] [Green Version]
- Han, T.S.; Zheng, Q.J.; Onstein, R.E.; Rojas-Andrés, B.M.; Hauenschild, F.; Muellner-Riehl, A.N.; Xing, Y.W. Polyploidy promotes species diversification of Allium through ecological shifts. New Phytol. 2020, 225, 571–583. [Google Scholar] [CrossRef] [PubMed] [Green Version]
- Schlaepfer, D.R.; Edwards, P.J.; Billeter, R. Why only tetraploid Solidago gigantea (Asteraceae) became invasive: A common garden comparison of ploidy levels. Oecologia 2010, 163, 661–673. [Google Scholar] [CrossRef] [PubMed] [Green Version]
- Wei, N.; Cronn, R.; Liston, A.; Ashman, T.L. Functional trait divergence and trait plasticity confer polyploid advantage in heterogeneous environments. New Phytol. 2019, 221, 2286–2297. [Google Scholar] [CrossRef] [Green Version]
- Ramsey, J.; Ramsey, T.S. Ecological studies of polyploidy in the 100 years following its discovery. Philos. Trans. R. Soc. Lond. B Biol. Sci. 2014, 369, 20130352. [Google Scholar] [CrossRef] [PubMed]
- Li, J.; Wan, Q.; Guo, Y.P.; Abbott, R.J.; Rao, G.Y. Should I stay or should I go: Biogeographic and evolutionary history of a polyploid complex (Chrysanthemum indicum complex) in response to Pleistocene climate change in China. New Phytol. 2014, 201, 1031–1044. [Google Scholar] [CrossRef]
- López-Jurado, J.; Mateos-Naranjo, E.; Balao, F. Niche divergence and limits to expansion in the high polyploid Dianthus broteri complex. New Phytol. 2019, 222, 1076–1087. [Google Scholar] [CrossRef]
- Liu, Y.; Li, D.; Yan, L.; Huang, H. The microgeographical patterns of morphological and molecular variation of a mixed ploidy population in the species complex Actinidia chinensis. PLoS ONE 2015, 10, e0117596. [Google Scholar] [CrossRef]
- Crowhurst, R.N.; Gleave, A.P.; MacRae, E.A.; Ampomah-Dwamena, C.; Atkinson, R.G.; Beuning, L.L.; Bulley, S.M.; Chagne, D.; Marsh, K.B.; Matich, A.J.; et al. Analysis of expressed sequence tags from Actinidia: Applications of a cross species EST database for gene discovery in the areas of flavor, health, color, and ripening. BMC Genom. 2008, 9, 351. [Google Scholar] [CrossRef] [Green Version]
- Zheng, Y.Q.; Li, Z.Z.; Huang, H.W. Preliminary study on SSR analysis in kiwifruit cultivars. J. Wuhan Bot. Res. 2003, 21, 444–448. [Google Scholar]
- Servick, S.; Visger, C.J.; Gitzendanner, M.A.; Soltis, P.S.; Soltis, D.E. Population genetic variation, geographic structure, and multiple origins of autopolyploidy in Galax urceolata. Am. J. Bot. 2015, 102, 973–982. [Google Scholar] [CrossRef] [PubMed] [Green Version]
- Zhang, X.; Su, H.; Yang, J.; Feng, L.; Li, Z.; Zhao, G. Population genetic structure, migration, and polyploidy origin of a medicinal species Gynostemma pentaphyllum (Cucurbitaceae). Ecol. Evol. 2019, 9, 11145–11170. [Google Scholar] [CrossRef] [PubMed] [Green Version]
- Zhong, L.; Ma, Y.; Salama, M.; Su, Z. Assessment of vegetation dynamics and their response to variations in precipitation and temperature in the Tibetan Plateau. Clim. Chang. 2010, 103, 519–535. [Google Scholar] [CrossRef]
- Li, D.; Liu, Y.; Zhong, C.; Huang, H. Morphological and cytotype variation of wild kiwifruit (Actinidia chinensis complex) along an altitudinal and longitudinal gradient in central-west China. Bot. J. Linn. Soc. 2010, 164, 72–83. [Google Scholar] [CrossRef] [Green Version]
- Rogers, S.O.; Bendich, A.J. Extraction of DNA from milligram amount of fresh, herbarium and mummified plant tissues. Plant Mol. Biol. 1985, 5, 69–76. [Google Scholar] [CrossRef]
- Huang, W.G.; Cipriani, G.; Morgante, M.; Testolin, R. Microsatellite DNA in Actinidia chinensis: Isolation, characterization, and homology in related species. Theor. Appl. Genet. 1998, 97, 1269–1278. [Google Scholar] [CrossRef]
- Sampson, J.F.; Byrne, M. Genetic diversity and multiple origins of polyploid Atriplex nummularia Lindl. (Chenopodiaceae). Biol. J. Linn. Soc. 2012, 105, 218–230. [Google Scholar] [CrossRef] [Green Version]
- Obbard, D.J.; Harris, S.A.; Pannell, J.R. Simple allelic-phenotype diversity and differentiation statistics for allopolyploids. Heredity 2006, 97, 296–303. [Google Scholar] [CrossRef] [PubMed] [Green Version]
- García-Verdugo, C.; Calleja, J.A.; Vargas, P.; Silva, L.; Moreira, O.; Pulido, F. Polyploidy and microsatellite variation in the relict tree Prunus lusitanica L.: How effective are refugia in preserving genotypic diversity of clonal taxa? Mol. Ecol. 2013, 22, 1546–1557. [Google Scholar] [CrossRef]
- Esselink, G.D.; Nybom, H.; Vosman, B. Assignment of allelic configuration in polyploids using the MAC-PR (microsatellite DNA allele counting-peak ratios) method. Theor. Appl. Genet. 2004, 109, 402–408. [Google Scholar] [CrossRef] [PubMed]
- Meirmans, P.G. GENODIVE version 3.0: Easy-to-use software for the analysis of genetic data of diploids and polyploids. Mol. Ecol. Resour. 2020, 20, 1126–1131. [Google Scholar] [CrossRef] [PubMed] [Green Version]
- Dufresne, F.; Stift, M.; Vergilino, R.; Mable, B.K. Recent progress and challenges in population genetics of polyploid organisms: An overview of current state-of-the-art molecular and statistical tools. Mol. Ecol. 2014, 23, 40–69. [Google Scholar] [CrossRef] [PubMed] [Green Version]
- Meirmans, P.G.; Liu, S.; van Tienderen, P.H. The analysis of polyploid genetic data. J. Hered. 2018, 109, 283–296. [Google Scholar] [CrossRef]
- Clark, L.V.; Jasieniuk, M. POLYSAT: An R package for polyploid microsatellite analysis. Mol. Ecol. Resour. 2011, 11, 562–566. [Google Scholar] [CrossRef]
- Huang, K.; Dunn, D.W.; Ritland, K.; Li, B.G. POLYGENE: Population genetics analyses for autopolyploids based on allelic phenotypes. Methods Ecol. Evol. 2020, 11, 448–456. [Google Scholar] [CrossRef] [Green Version]
- Nei, M. Analysis of gene diversity in subdivided populations. Proc. Natl. Acad. Sci. USA 1973, 70, 3321–3323. [Google Scholar] [CrossRef] [Green Version]
- Excoffier, L.; Smouse, P.E.; Quattro, J.M. Analysis of molecular variance inferred from metric distances among DNA haplotypes: Application to human mitochondrial DNA restriction data. Genetics 1992, 131, 479–491. [Google Scholar] [CrossRef]
- Rousset, F. Genetic differentiation and estimation of gene flow from F-statistics under isolation by distance. Genetics 1997, 145, 1219–1228. [Google Scholar] [CrossRef] [PubMed]
- Cavalli-Sforza, L.L.; Edwards, A.W.F. Phylogenetic analysis: Models and estimation. Evolution 1967, 21, 550–570. [Google Scholar] [CrossRef]
- Pritchard, J.K.; Stephens, M.; Donnelly, P. Inference of population structure using multilocus genotype data. Genetics 2000, 155, 945–959. [Google Scholar] [CrossRef] [PubMed]
- Falush, D.; Stephens, M.; Pritchard, J.K. Inference of population structure using multilocus genotype data: Linked loci and correlated allele frequencies. Genetics 2003, 164, 1567–1587. [Google Scholar] [CrossRef] [PubMed]
- Earl, D.A.; Vonholdt, B.M. STRUCTURE HARVESTER: A website and program for visualizing STRUCTURE output and implementing the Evanno method. Conserv. Genet. Resour. 2012, 4, 359–361. [Google Scholar] [CrossRef]
- Evanno, G.; Regnaut, S.; Goudet, J. Detecting the number of clusters of individuals using the software STRUCTURE: A simulation study. Mol. Ecol. 2005, 14, 2611–2620. [Google Scholar] [CrossRef] [Green Version]
- Jakobsson, M.; Rosenberg, N.A. CLUMPP: A cluster matching and permutation program for dealing with label switching and multimodality in analysis of population structure. Bioinformatics 2007, 23, 1801–1806. [Google Scholar] [CrossRef] [PubMed] [Green Version]
- Rosenberg, N.A. DISTRUCT: A program for the graphical display of population structure. Mol. Ecol. Notes 2004, 4, 137–138. [Google Scholar] [CrossRef]
- Takezaki, N.; Nei, M.; Tamura, K. Poptree 2: Software for constructing population trees from allele frequency data and computing other population statistics with Windows interface. Mol. Biol. Evol. 2010, 27, 747–752. [Google Scholar] [CrossRef] [Green Version]
- Phillips, S.J.; Anderson, R.P.; Schapire, R.E. Maximum entropy modeling of species geographic distributions. Ecol. Model. 2006, 190, 231–259. [Google Scholar] [CrossRef] [Green Version]
- Phillips, S.J.; Dudík, M. Modeling of species distributions with Maxent: New extensions and a comprehensive evaluation. Ecography 2008, 31, 161–175. [Google Scholar] [CrossRef]
- Fick, S.E.; Hijmans, R.J. WorldClim 2: New 1-km spatial resolution climate surfaces for global land areas. Int. J. Climatol. 2017, 37, 4302–4315. [Google Scholar] [CrossRef]
- Van Vuuren, D.P.; Riahi, K. A proposal for a new scenario framework to support research and assessment in different climate research communities. Glob. Environ. Chang. 2012, 22, 21–35. [Google Scholar] [CrossRef] [Green Version]
- Fawcett, T. An introduction to ROC analysis. Pattern Recogn. Lett. 2006, 27, 861–874. [Google Scholar] [CrossRef]


Publisher’s Note: MDPI stays neutral with regard to jurisdictional claims in published maps and institutional affiliations. |
© 2022 by the authors. Licensee MDPI, Basel, Switzerland. This article is an open access article distributed under the terms and conditions of the Creative Commons Attribution (CC BY) license (https://creativecommons.org/licenses/by/4.0/).