Article

Optimization of the Green Chemistry-like Extraction of Phenolic Compounds from Grape (Vitis labrusca L.) and Blackberry (Rubus fruticosus L.) Seeds with Concomitant Biological and Antioxidant Activity Assessments

by
Tufy Kabbas Junior
1,
Cristiane de Moura
1,
Thiago Mendanha Cruz
1,
Mariza Boscacci Marques
1,
Mariana Araújo Vieira do Carmo
2,
Carolina Turnes Pasini Deolindo
3,
Heitor Daguer
3,
Luciana Azevedo
2 and
Daniel Granato
4,*
1
Department of Chemistry, State University of Ponta Grossa (UEPG), Av. Carlos Cavalcanti, 4748, Ponta Grossa 84030-900, Parana, Brazil
2
Nutrition Faculty, Federal University of Alfenas, Rua Gabriel Monteiro da Silva, 714, Alfenas 37130-000, Minas Gerais, Brazil
3
Brazilian Ministry of Agriculture, Livestock, and Food Supply (MAPA), Federal Agricultural Defense Laboratory, São José 88102-600, Santa Catarina, Brazil
4
Bioactivity and Applications Laboratory, Department of Biological Sciences, Faculty of Science and Engineering, School of Natural Sciences, University of Limerick, V94 T9PX Limerick, Ireland
*
Author to whom correspondence should be addressed.
Plants 2023, 12(14), 2618; https://doi.org/10.3390/plants12142618
Submission received: 27 June 2023 / Revised: 3 July 2023 / Accepted: 6 July 2023 / Published: 11 July 2023

Abstract

:
The objective of this work was to determine the phenolic composition, chemical and cellular antioxidant activity, cytotoxicity in human cells, and peroxidative inhibition of the defatted fraction of grape (Vitis labrusca) and blackberry (Rubus fruticosus) seeds. Soxhlet extraction (Sox) was used to extract the fat and obtain the degreased material. A statistical optimization study was developed to maximize the extraction of bioactive compounds and antioxidant activity from defatted grape and blackberry seeds. Simultaneous optimization was applied with a combination of 35.9 min of extraction and a solid-to-solvent ratio of 1 g of defatted grape seed to 61.28 mL of an extracting solvent (60% ethanol) and 62.1 min of extraction and a solid-to-solvent ratio of 1 g of defatted blackberry seed to 64.1 mL of an extracting solvent (60% ethanol). In the cell viability assay, HepG2 cancer cells seemed more sensitive to grape and blackberry extracts, while Ea.hy926 hybrid cells showed more resistance to their effects. In general, the extracts presented low/no cytotoxicity, exhibited a protective effect against H2O2-induced ROS production, and demonstrated antioxidant activity and a protective effect on the erythrocytes when subjected to hypotonic and isotonic conditions not presenting hemolytic behavior (5.0 to 10.0 μg GAE/mL). Thus, the results provided a broad assessment of the bioactivity of the extracts obtained using a simple and low-cost process developed by employing non-toxic solvents and with the potential to be used in technological applications.

1. Introduction

Agro-industrial activity generates millions of tons of by-products and plant residues, which could be repurposed in the production chain to reduce their environmental impact and gain additional value in the processes [1]. This is achieved by employing the biorefinery concept, where each component of the production chain is considered a potential product. In addition, the bioactive agents found in the biomass have many potential applications as nutraceuticals due to the possibility of reducing the risk of diseases [2].
In wine production, large amounts of waste are generated, around 20% of the total weight (bagasse—skin, seed, etc.), which is increasingly used to recover essential oils, phenolic compounds, and fibers, becoming a sustainable waste management strategy. In addition, their reuse avoids problems arising from this waste disposal, which might promote a circular bioeconomy [3,4,5,6]. Studies carried out by Gómez-Mejía et al. [7] demonstrated that grape seeds, after extraction of the oil fraction, contain catechin, gallic acid, and quercetin, in addition to presenting antioxidant activity, which has led to their use for technological purposes. However, many studies have investigated potentially toxic organic solvents such as methanol and HCl used in such processes [8]. For this reason, generating technology for producing these extracts, such as green chemistry methods, becomes vital to produce grape seed extracts with potential applications in the food and pharmaceutical industries.
Blackberry seeds are considered agricultural waste since they are usually discarded in processing industries (20% in weight). Pap et al. [9] reviewed various types of berries, including blackberries, and showed that the aqueous extract of blackberries (the pulp plus the seeds) showed antioxidant, hypertensive, antihyperglycemic, and anti-inflammatory in vitro activity. Junior et al. [10] studied blackberry seeds’ non-polar extract (hexane). They observed cytotoxic and antimicrobial activity, even suggesting using blackberry seeds as a source of antioxidant lipids. Few studies on blackberry seeds were reported, and even fewer on defatted seeds, highlighting the gap in the literature and the need to study natural resources.
Flavonoids, such as flavanols and flavonols, stilbenes, such as trans-resveratrol and phenolic acids, such as gallic acid, and vanillic, syringic, and caffeic acids, form the basis of the phenolic composition of grapes and their derivatives, as shown in Figure 1 [11]. In studies carried out by Fiume et al. [12], extractable phenolics in grapes are arranged as follows: about 10% are present in the pulp, 28–35% in the skin, and 60–70% in the seeds.
Antioxidant, anti-inflammatory, anticancer, neuroprotective, and antihypertensive effects, among other functions, are some of the various biological activities, both in vitro and in vivo, determined in previous studies [14,15,16,17,18]. Studies performed by Hakimuddin et al. [19], Singh et al. [20], Schlachterman et al. [21], and Singletary et al. [22] showed anticancer and antimetastatic activity when tested in vivo and in vitro against cancer cells using specific phenolic compounds (anthocyanidins, proanthocyanidins, and resveratrol) extracted from wines and seeds.
A broad spectrum of phytochemical compounds has been reported in blackberries, including phenolic acids, flavonoids, carotenoids, and organic acids, as illustrated in Figure 2 [23,24]. The anthocyanin subgroup of flavonoids is among the main components in blackberries [25,26]. The main anthocyanins reported in blackberries consist of cyanidin-based anthocyanins, including cyanidin-3-glucoside, followed by cyanidin-3-xyloside, cyanidin-3-malonylglucoside, cyanidin-3-dioxalylglucoside, and cyanidin-3-sambubioside [27].
Biological activities related to blackberries have been described in different studies, such as their protective effects against oxidative stress, endotoxicity, age-related neurodegenerative diseases, obesity, cancer, and cardiovascular diseases [28,29,30].
As important as the chemical composition and reuse of blackberry and grape by-products is, the use of non-toxic solvents in the extraction of bioactive compounds from this type of waste is for the possible use of their extracts in the food industry. The use of solvents approved by regulatory agencies, such as the EFSA (European Food Safety Authority), is highly relevant to obtain extracts that can be used to produce food with bioactive properties. Deolindo et al. [31] studied the extract of Bordeaux grape seeds (60% ethanol) and used it to produce Petit Suisse cheese, a source of phenolic compounds. Karnopp et al. [32] investigated the extract of Bordeaux grape seed skin (ethanol 70%) to prepare functional yogurt with antioxidant activity.
In an attempt to contribute to the knowledge about the association between the chemical composition and the biological activity of extracts obtained from agro-industrial residues, this study aims to optimize a system to extract bioactive compounds from defatted grape (Vitis labrusca) and blackberry seeds (Rubus fruticosus) and evaluate their bioactivity in chemical and biological systems in vitro. Notably, the study of oil (degreasing) is described by Junior et al. [10].

2. Results and Discussion

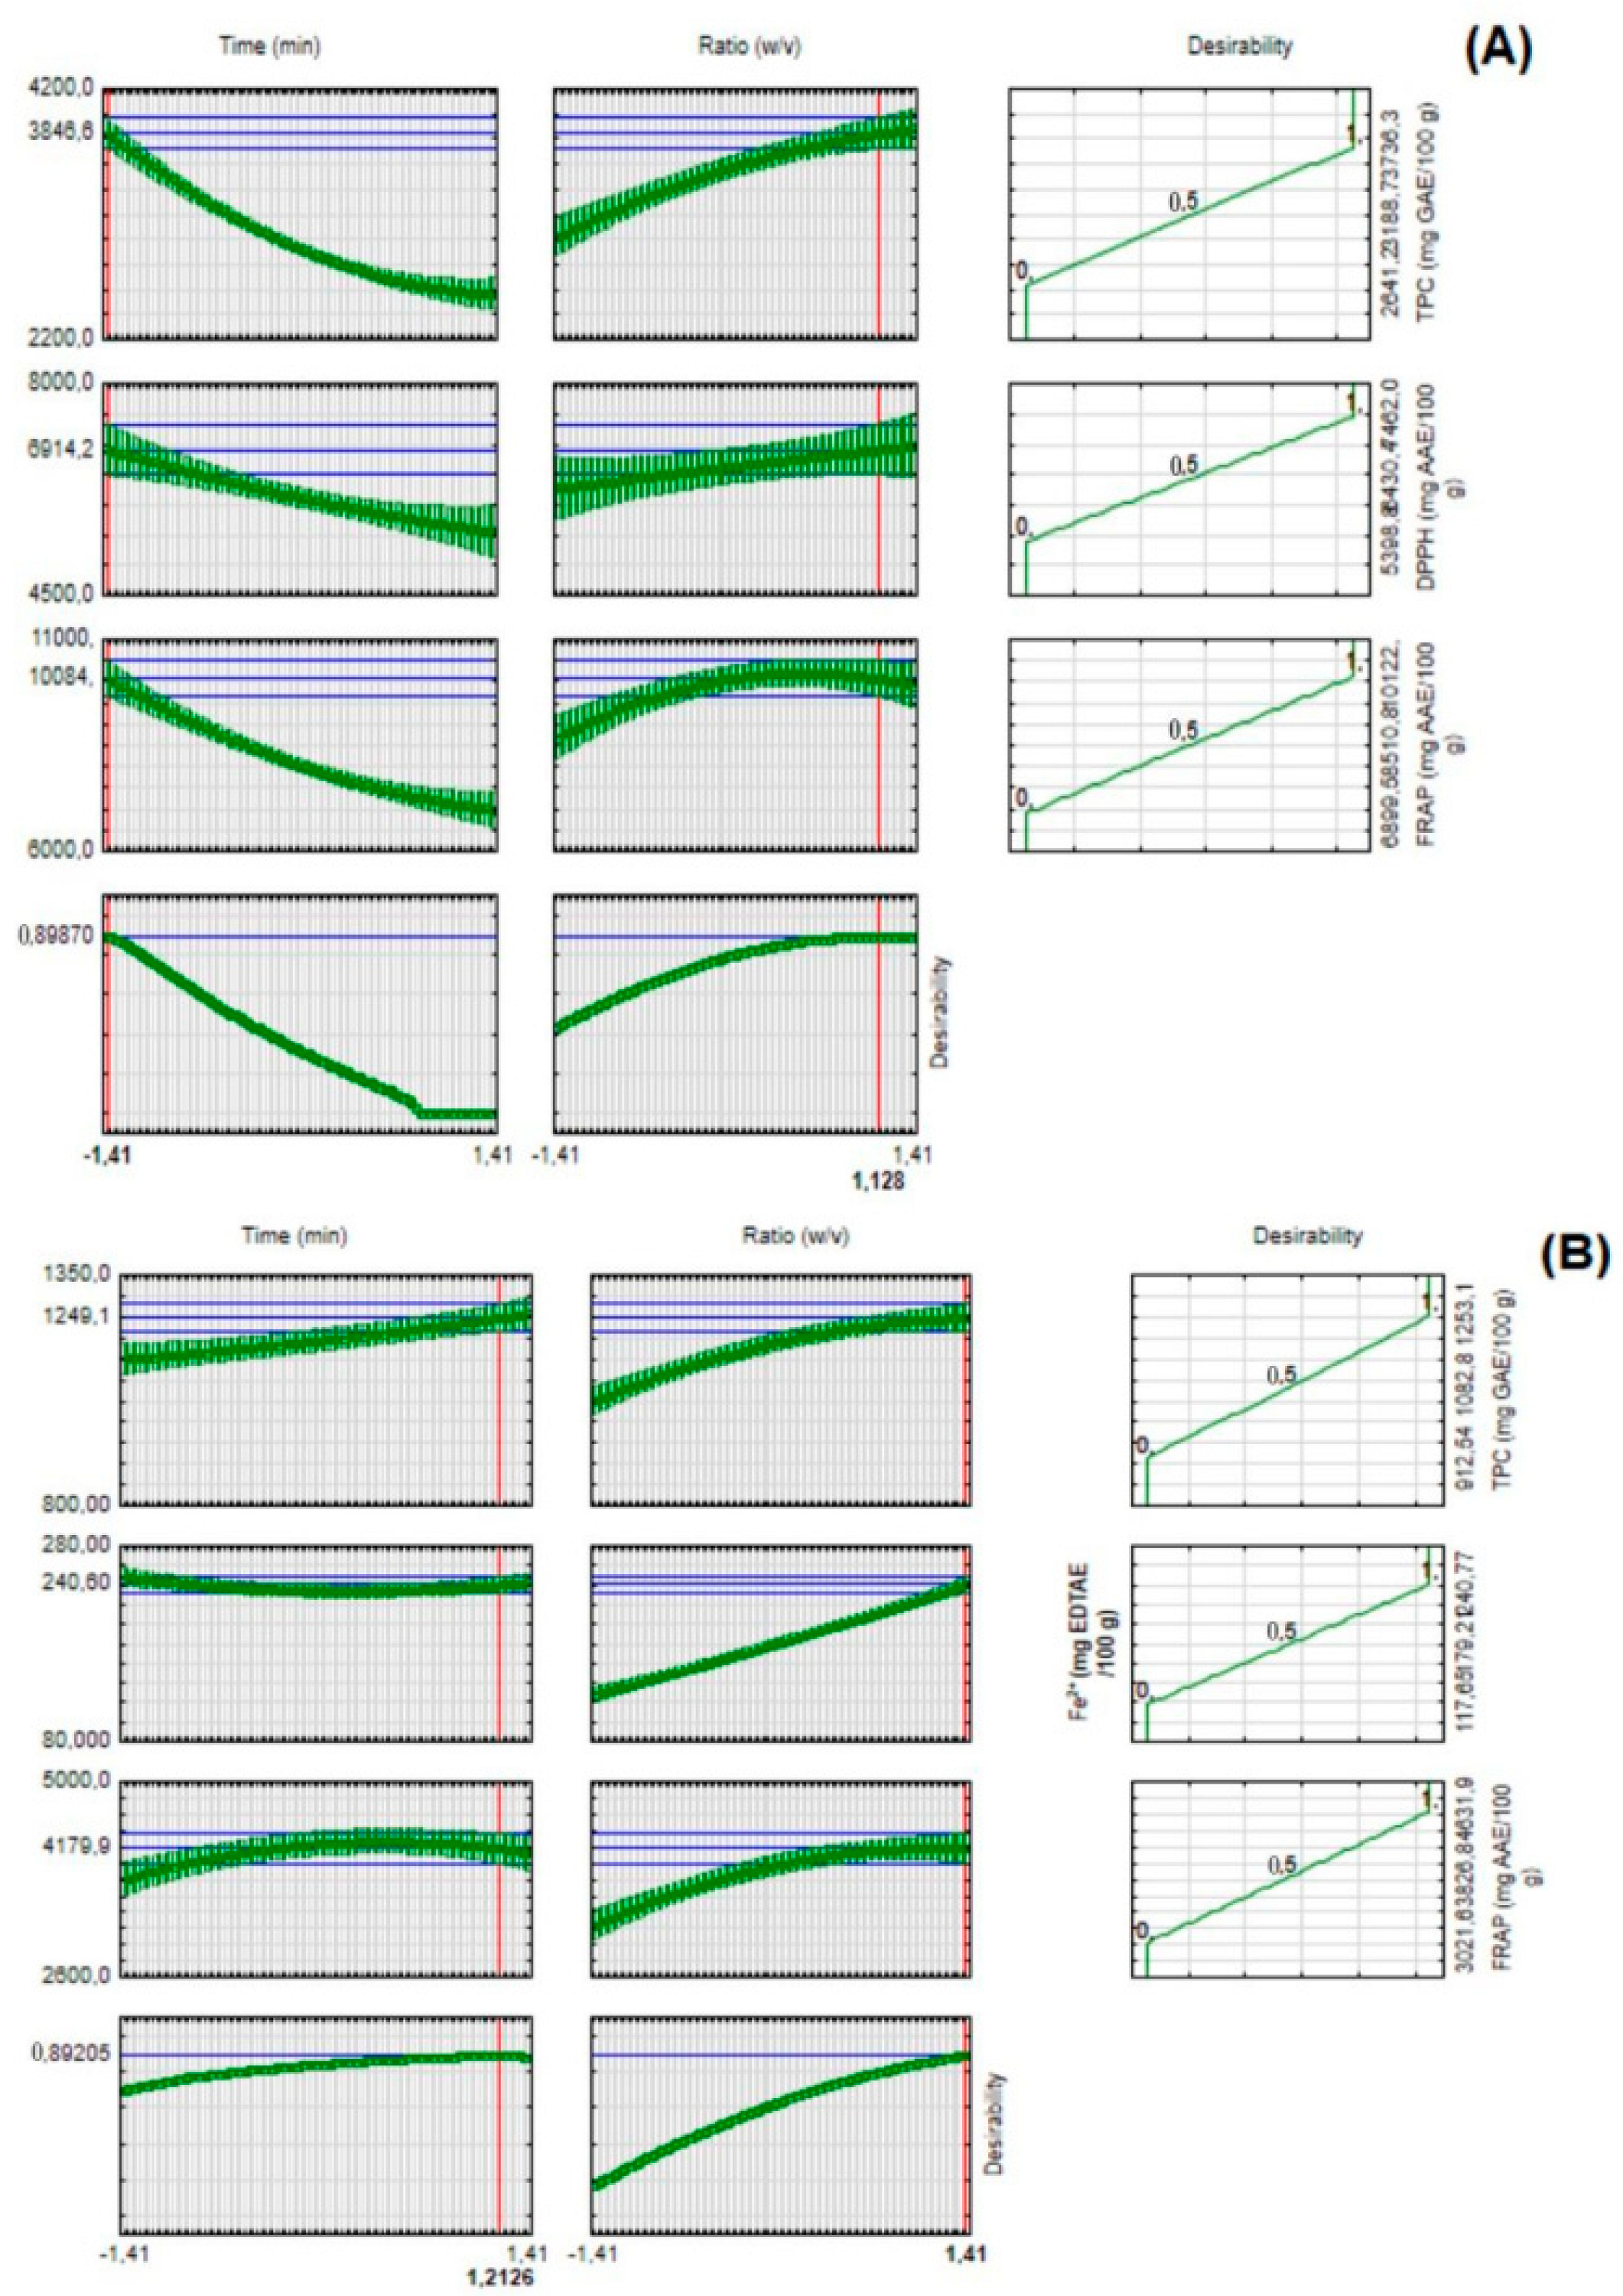
2.1. Effect of Extraction Time and Solid-to-Solvent Ratio on the Total Phenolic Composition and Antioxidant Activity

When the mean values of the total phenolic composition (TPC), antioxidant activity, flavonoids, tannins, and ortho-diphenols in grape (Table 1) and blackberry (Table 2) were analyzed, a significant difference was observed in all the responses (p < 0.05). The TPC content ranged between 2747 and 3623 mg of gallic acid equivalent per 100 g of the sample (GAE/100 g) in defatted grape seeds and between 923 and 1243 mg GAE/100 g in defatted blackberry seeds. The highest (p < 0.05) TPC content was obtained with a 35.9 min extraction time and 1:50 w/v solid-to-solvent ratio with grape seeds, not presenting a significant difference in relation to the extraction in 40 min with a 1:60 w/v solid-to-solvent ratio or 60 min with a 1:60 w/v solid-to-solvent ratio with defatted blackberry seeds.
Table 3 shows that the multiple regression model (e.g., MRM, Table 4) for the TPC explained 89% of the grape data variability (R2adj = 0.888) and 66% of the blackberry data variability (R2adj = 0.664), revealing that the TPC (grape) mathematical model can be used for predictive purposes.
The antioxidant activity in relation to the 2,2-diphenyl-1-picrylhydrazyl (DPPH) radical and ferric-reducing antioxidant power (FRAP) values of defatted grape seeds ranged between 5676 and 7069 mg of ascorbic acid equivalent per 100 g of the sample (AAE/100 g) and from 7294 to 10,023 mg AAE/100 g, respectively. For both responses, the extraction performed with a time of 40 min and a 1:60 w/v solid-to-solvent ratio showed higher mean values (p < 0.05), with no significant difference in relation to the extraction performed with a time of 35.9 min and a 1:50 w/v ratio. The models explain 68% and 76% of the data variability, respectively, for DPPH and FRAP (R2adj = 0.680 and R2adj = 0.765). Deolindo et al. [31] studied Bordeaux grape seeds and reported DPPH and FRAP values of 12,872 mg AAE/100 g and 7733 mg AAE/100 g, respectively, using a 1:50 w/v ratio (60% ethanol) and obtaining a FRAP value close to that found in this study.
The values obtained for defatted blackberry seeds regarding Fe2+ and FRAP chelation ranged from 144 to 235 mg of ethylenediamine tetraacetic acid equivalent per 100 g of the sample (EDTA/100 g) and 3060 to 4295 mg AAE/100 g, respectively. The extraction that presented the highest mean values (p < 0.05) was performed for 50 min with a 1:64.1 w/v solid-to-solvent ratio for both responses. The models explained 96% and 68% of the data variability for Fe2+ and FRAP (R2adj = 0.963 and R2adj = 0.679), respectively. Junior et al. [10], studying non-polar blackberry seed extract, reported Fe2+ values of 261 mg EDTA/100 g, which is also close to the value found in this study.
It is relevant to emphasize the importance of evaluating the antioxidant activity of natural products using different methods since bioactive compounds can display one or more mechanisms of action, such as hydrogen atom transfer, single electron transfer, and the capacity to chelate transition metals [33]. Phenolic compounds are recognized as potential antioxidants because they capture ROS, reducing and chelating ions and thus decreasing lipidic peroxidation in vivo.
This study used simultaneous optimization based on the desirability function to determine the best experimental conditions to obtain a high phenolic content and significant antioxidant activity (Appendix A Figure A1). With a 0.899 desirability function (d-value) for grape seeds and 0.892 for blackberry seeds, the following experimental conditions were proposed: 35.9 min of extraction and the solid-to-solvent ratio of 1 g defatted grape seed to 61.28 mL extractor solvent and 62.1 min of extraction and the solid-to-solvent ratio of 1 g defatted blackberry seed to 64.1 mL extractor solvent. The values predicted by the regression models, experimental values, and absolute error percentage are presented below (Table 5). The experimental data are within this prediction band, confirming the suitability of the models since they could predict the phenolic composition and antioxidant activity of the ethanolic extract of defatted grape and blackberry seeds.

2.2. Chemical Composition of the Optimized and Lyophilized Extracts

The chemical composition and antioxidant activity values of the optimized extracts are shown in Table 6. The contents of flavonoids, condensed tannins, and ortho-diphenols in defatted grape seeds were 61 ± 0.05 mg QE/100 g, 2609 ± 257 mg CTE/100 g, and 729 ± 81 mg ACE/100 g, respectively. As regards blackberry seeds, the values found were 38.1 ± 0.06 mg QE/100 g (flavonoids), 409 ± 154 mg CTE/100 g (tannins), and 233 ± 37 mg ACE/100 g (ortho-diphenols). Deolindo et al. [31] studied grape seed hydroalcoholic extract (60% ethanol) and obtained higher values of these compounds, which reached 6736 ± 276 mg QE/100 g (flavonoids), 10,635 ± 753 mg CTE/100 g (tannins), and 1260 ± 9 mg ACE/100 g (ortho-diphenols), respectively.

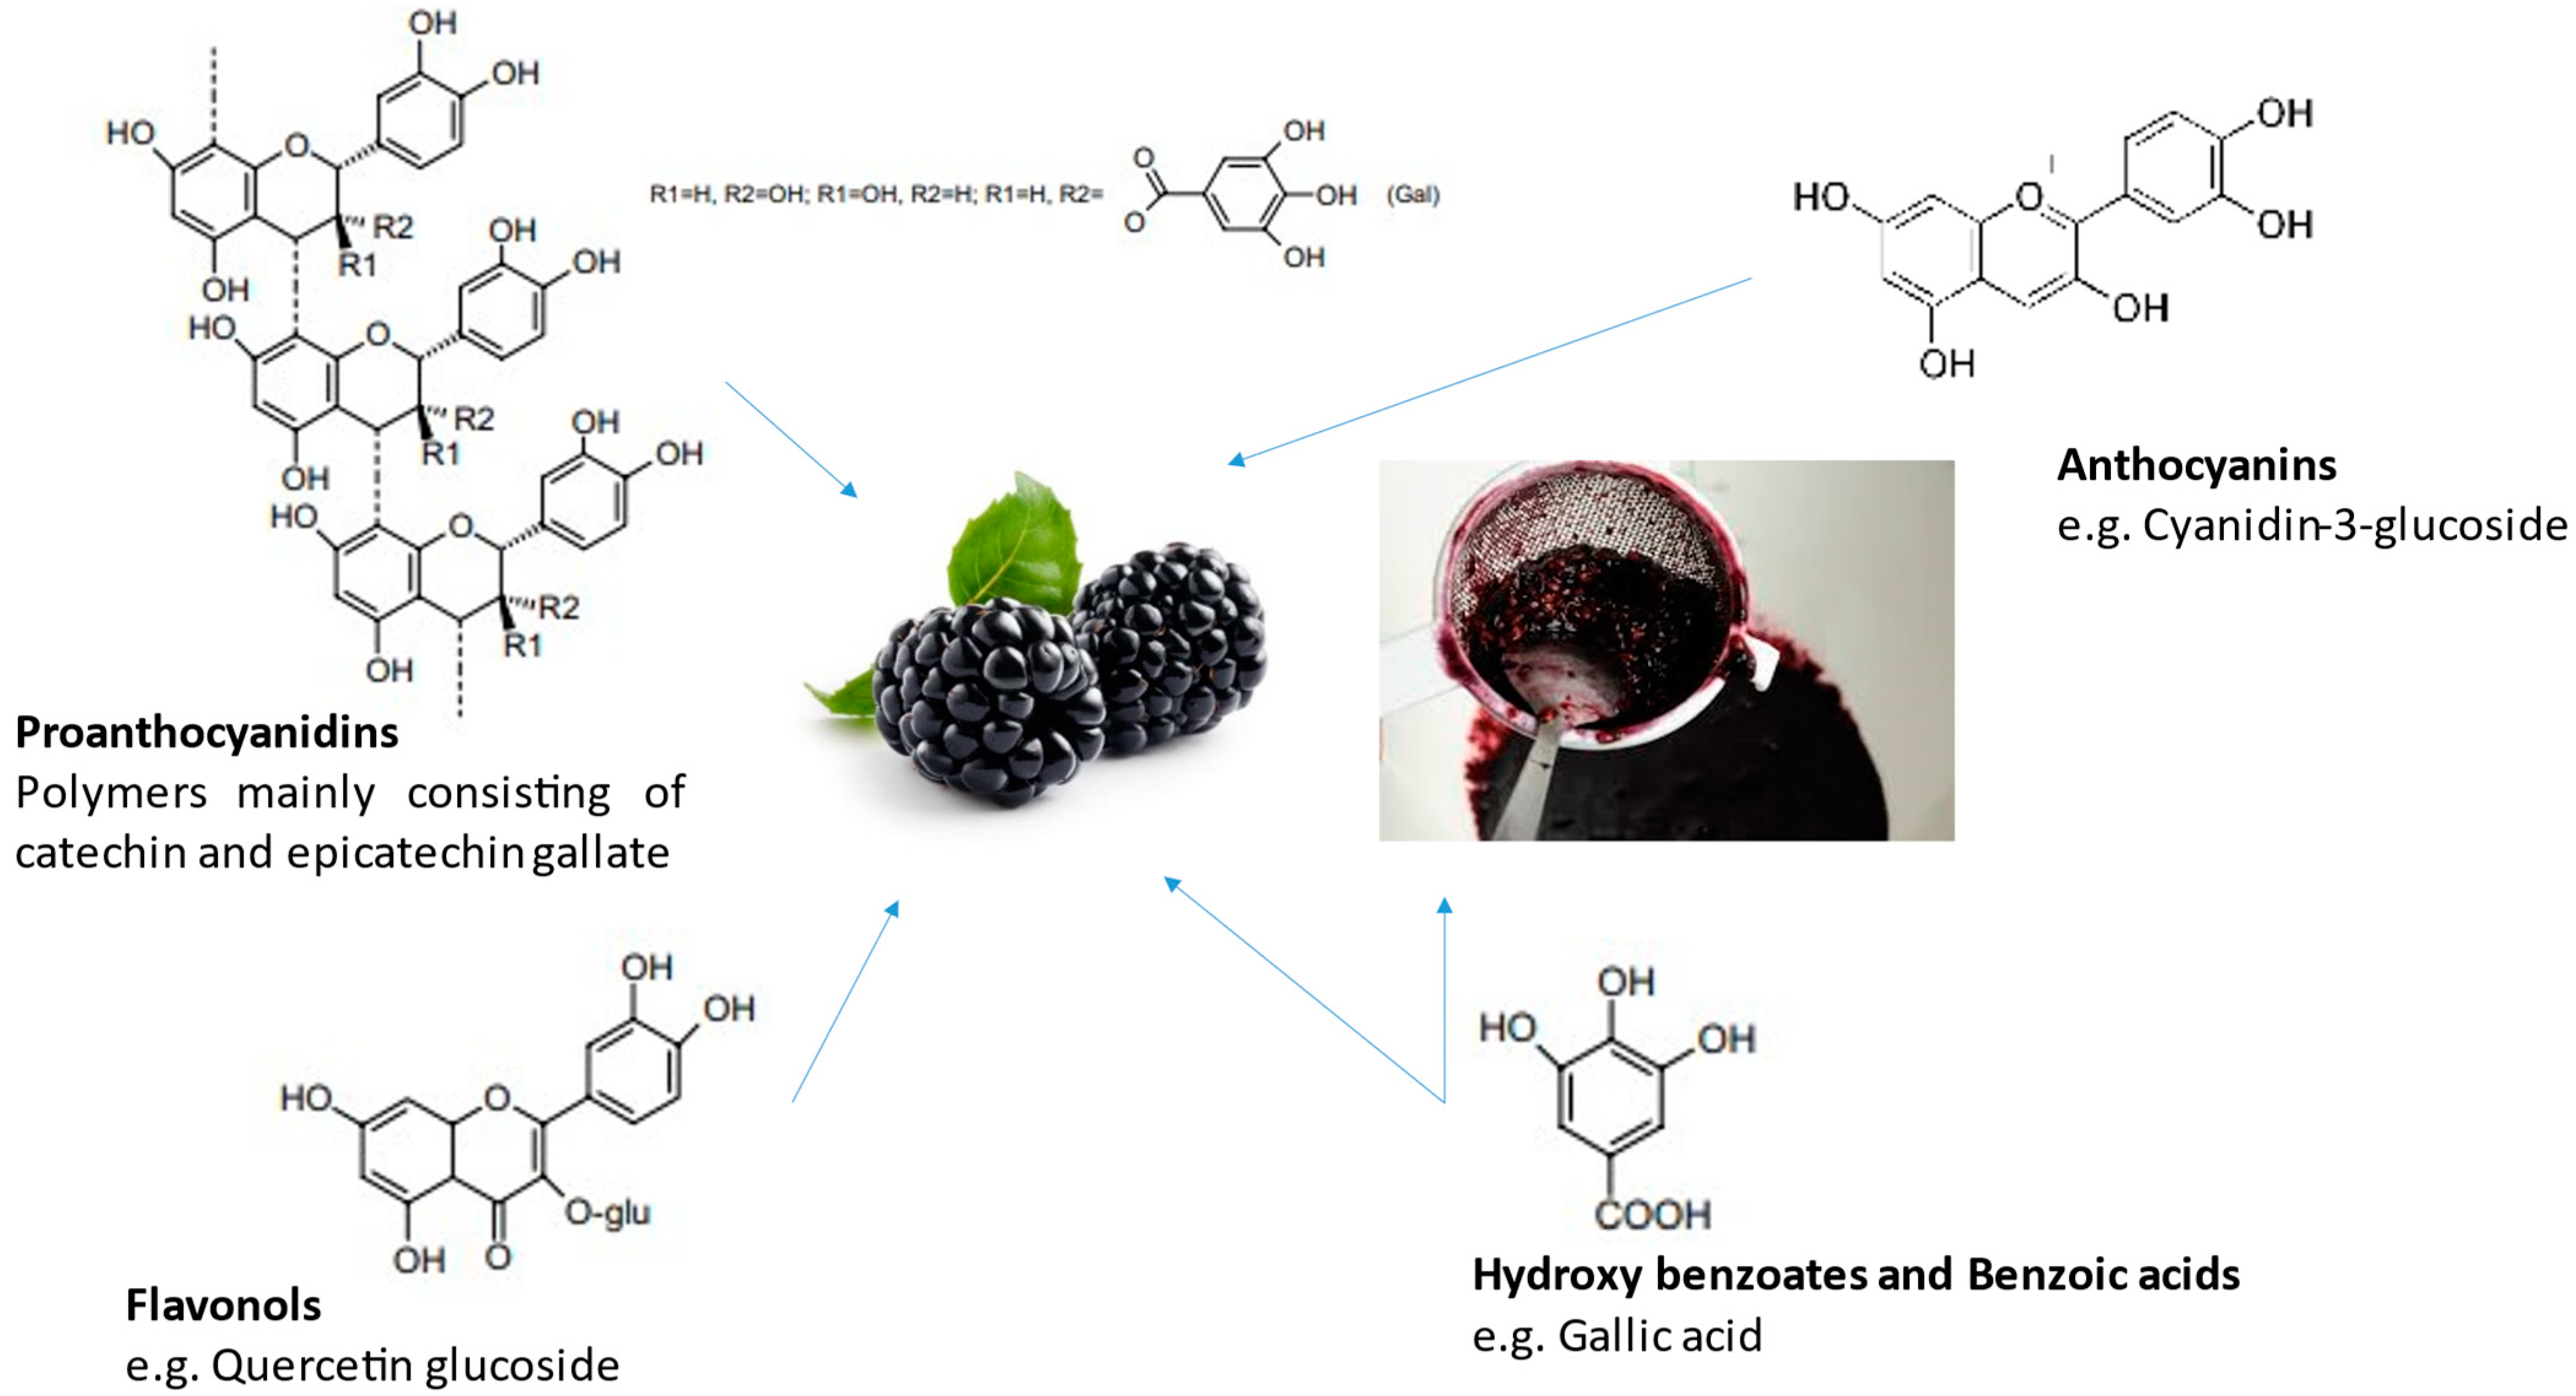
2.3. Phenolic Composition by LC-MS

The compounds identified in the grape- and blackberry-optimized extracts are presented in Table 7. These include 3,4-dihydroxybenzoic acid (5.7 ± 0.1 mg/100 g), catechin (573.8 ± 11.2 mg/100 g), p-coumaric acid (1.2 ± 0.0 mg/100 g), and quercetin (231.7 ± 1.2 mg/100 g), identified in the grape extract. The same compounds were reported in the analyses carried out by Gómez-Mejía et al. [7], 147 ± 5, 295 ± 37, 7.8 ± 0.9, and 112 ± 5 µg/g, respectively. When the blackberry extracts were analyzed, the compounds identified were 3,4-Dihydroxybenzoic acid, catechin, p-coumaric acid, ferulic acid, rutin, epicatechin, and caffeic acid. These were all reported in the study developed by Halin et al. [34], which employed extract (ethanol 80%) taken from various parts of the blackberry.

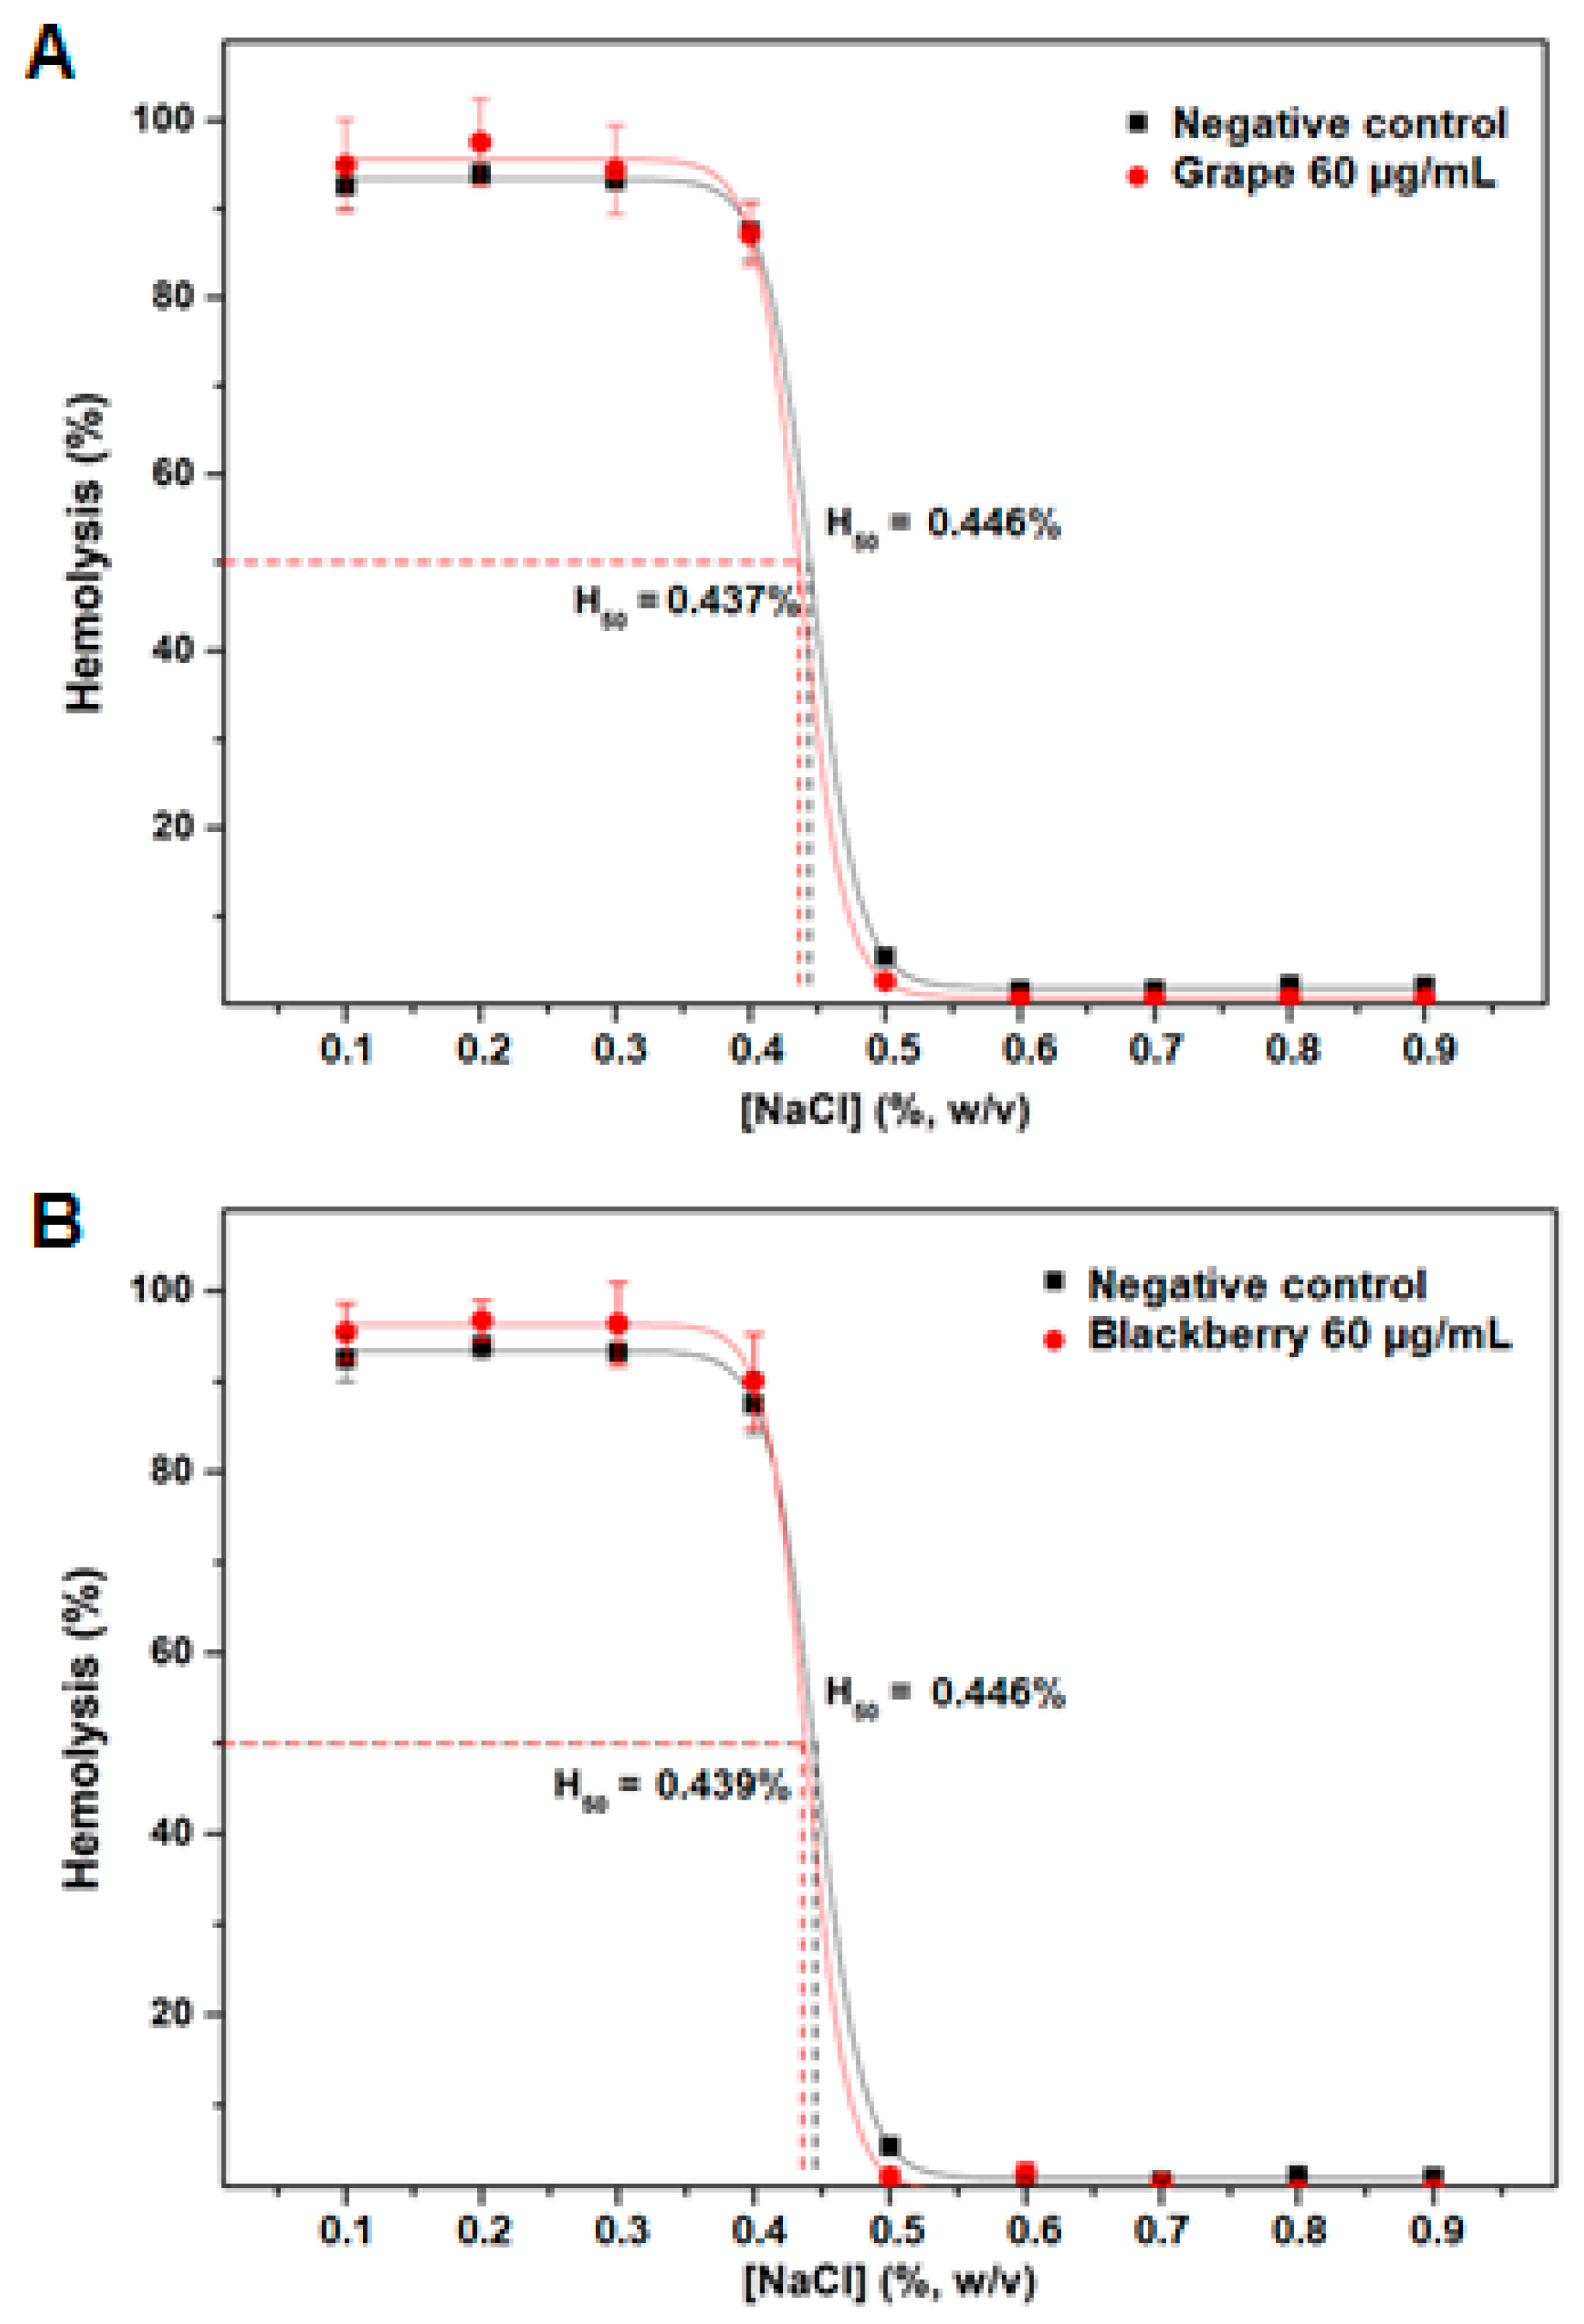
2.4. Antihemolytic Activity

The in vitro antihemolytic activity of the extracts (60 µg/mL) was evaluated under different osmolarity conditions ([NaCl] = 0.1 to 0.9%) (Figure 3). We observed that the extracts either presented a lower percentage of hemolysis or did not differ from the control (the absence of the extract) in all NaCl concentrations, demonstrating a protective effect on the erythrocytes when subjected to hypotonic and isotonic conditions. Moreover, they did not present hemolytic behavior in relation to the tested concentration. The decrease in the concentration of NaCl in the solution causes water absorption by the erythrocyte, making the cells swell and, consequently, provoking leakage of the intracellular content. The presence of phenolic compounds helps reduce the erythrocyte membrane’s fluidity through hydrogen bonds between the membrane phospholipids (polar heads) and phenolic compounds [35,36].
The NaCl concentration needed for the hemolysis of 50% of the erythrocytes (H50) is a way of evaluating the ability of the extract to protect the membrane from hemolysis. In this study, the optimized grape extract (60 µg/mL) obtained 0.437% H50, while the control (the absence of the extract) obtained 0.446% H50. The optimized blackberry extract (60 µg/mL), in turn, obtained 0.439% H50, while the control (the absence of the extract) obtained 0.446% H50. Atrooz, Harb, and Al-Qato [37] investigated the ethanolic extract of various seeds, and their results presented an antihemolytic effect, pointing out that the grape extract obtained better results. Our results reinforce the absence of toxicity in vitro in the extract of these seeds on erythrocytes, despite not presenting a significant protective effect.

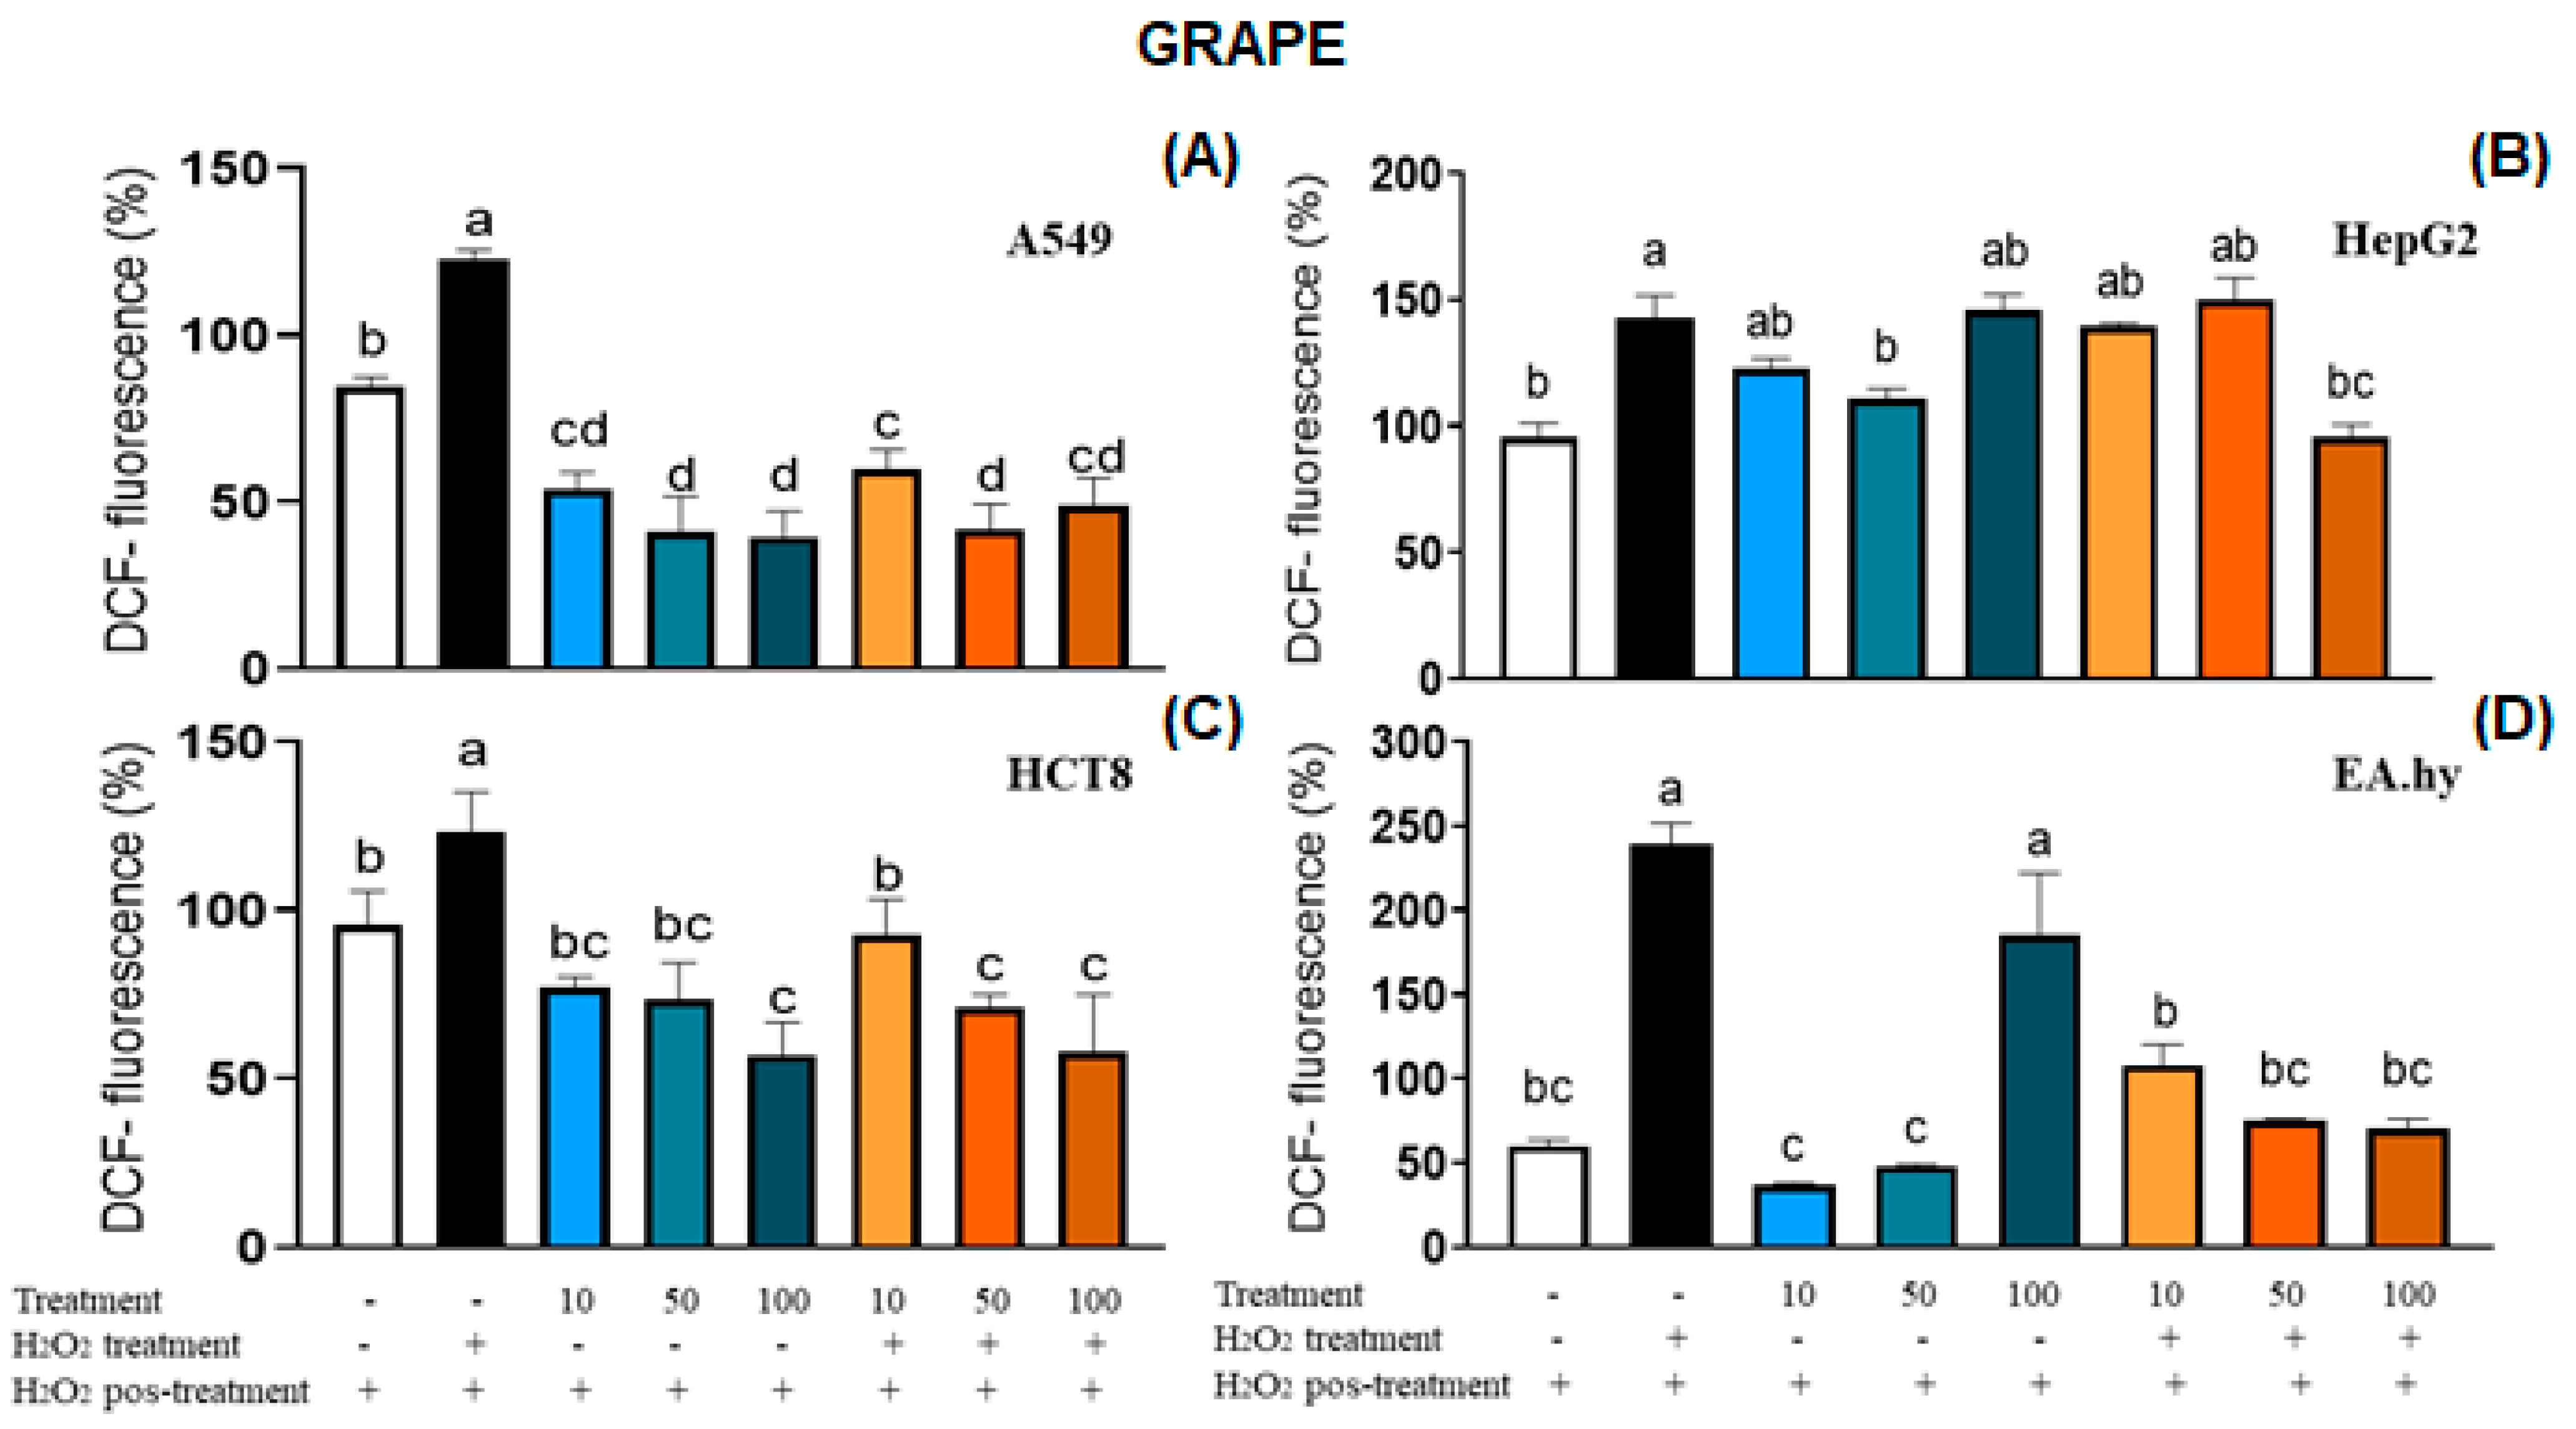
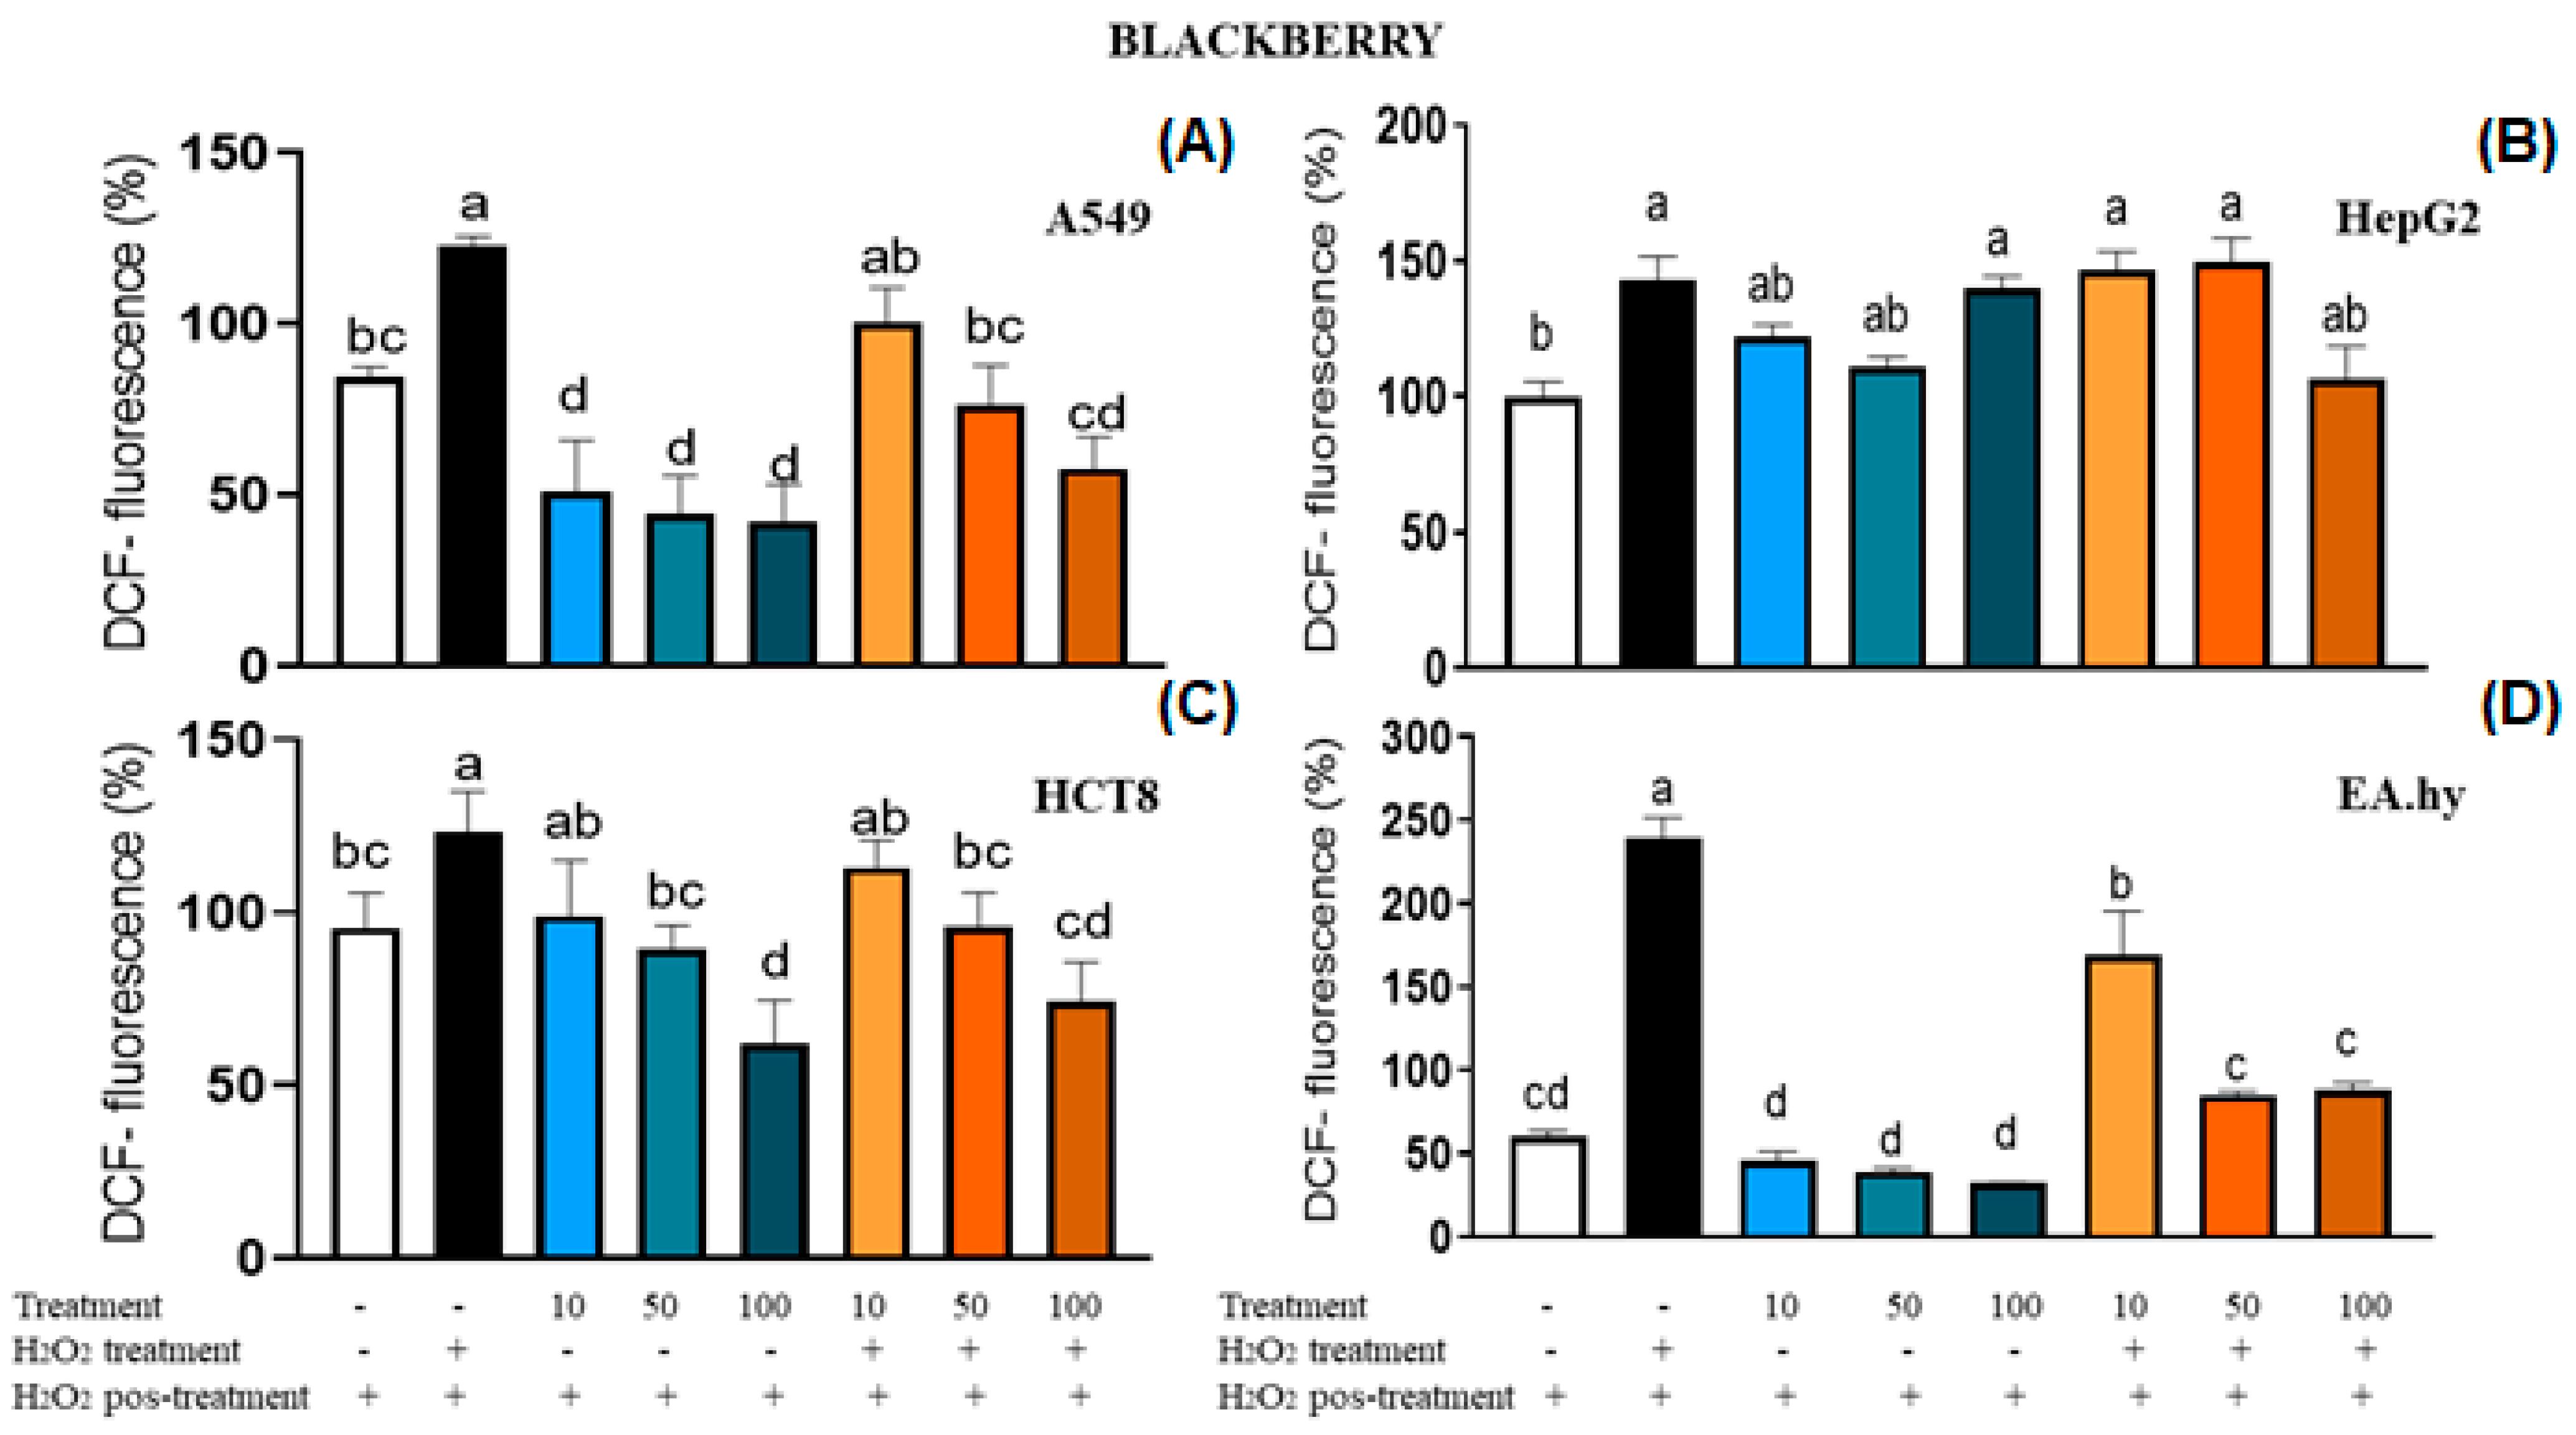
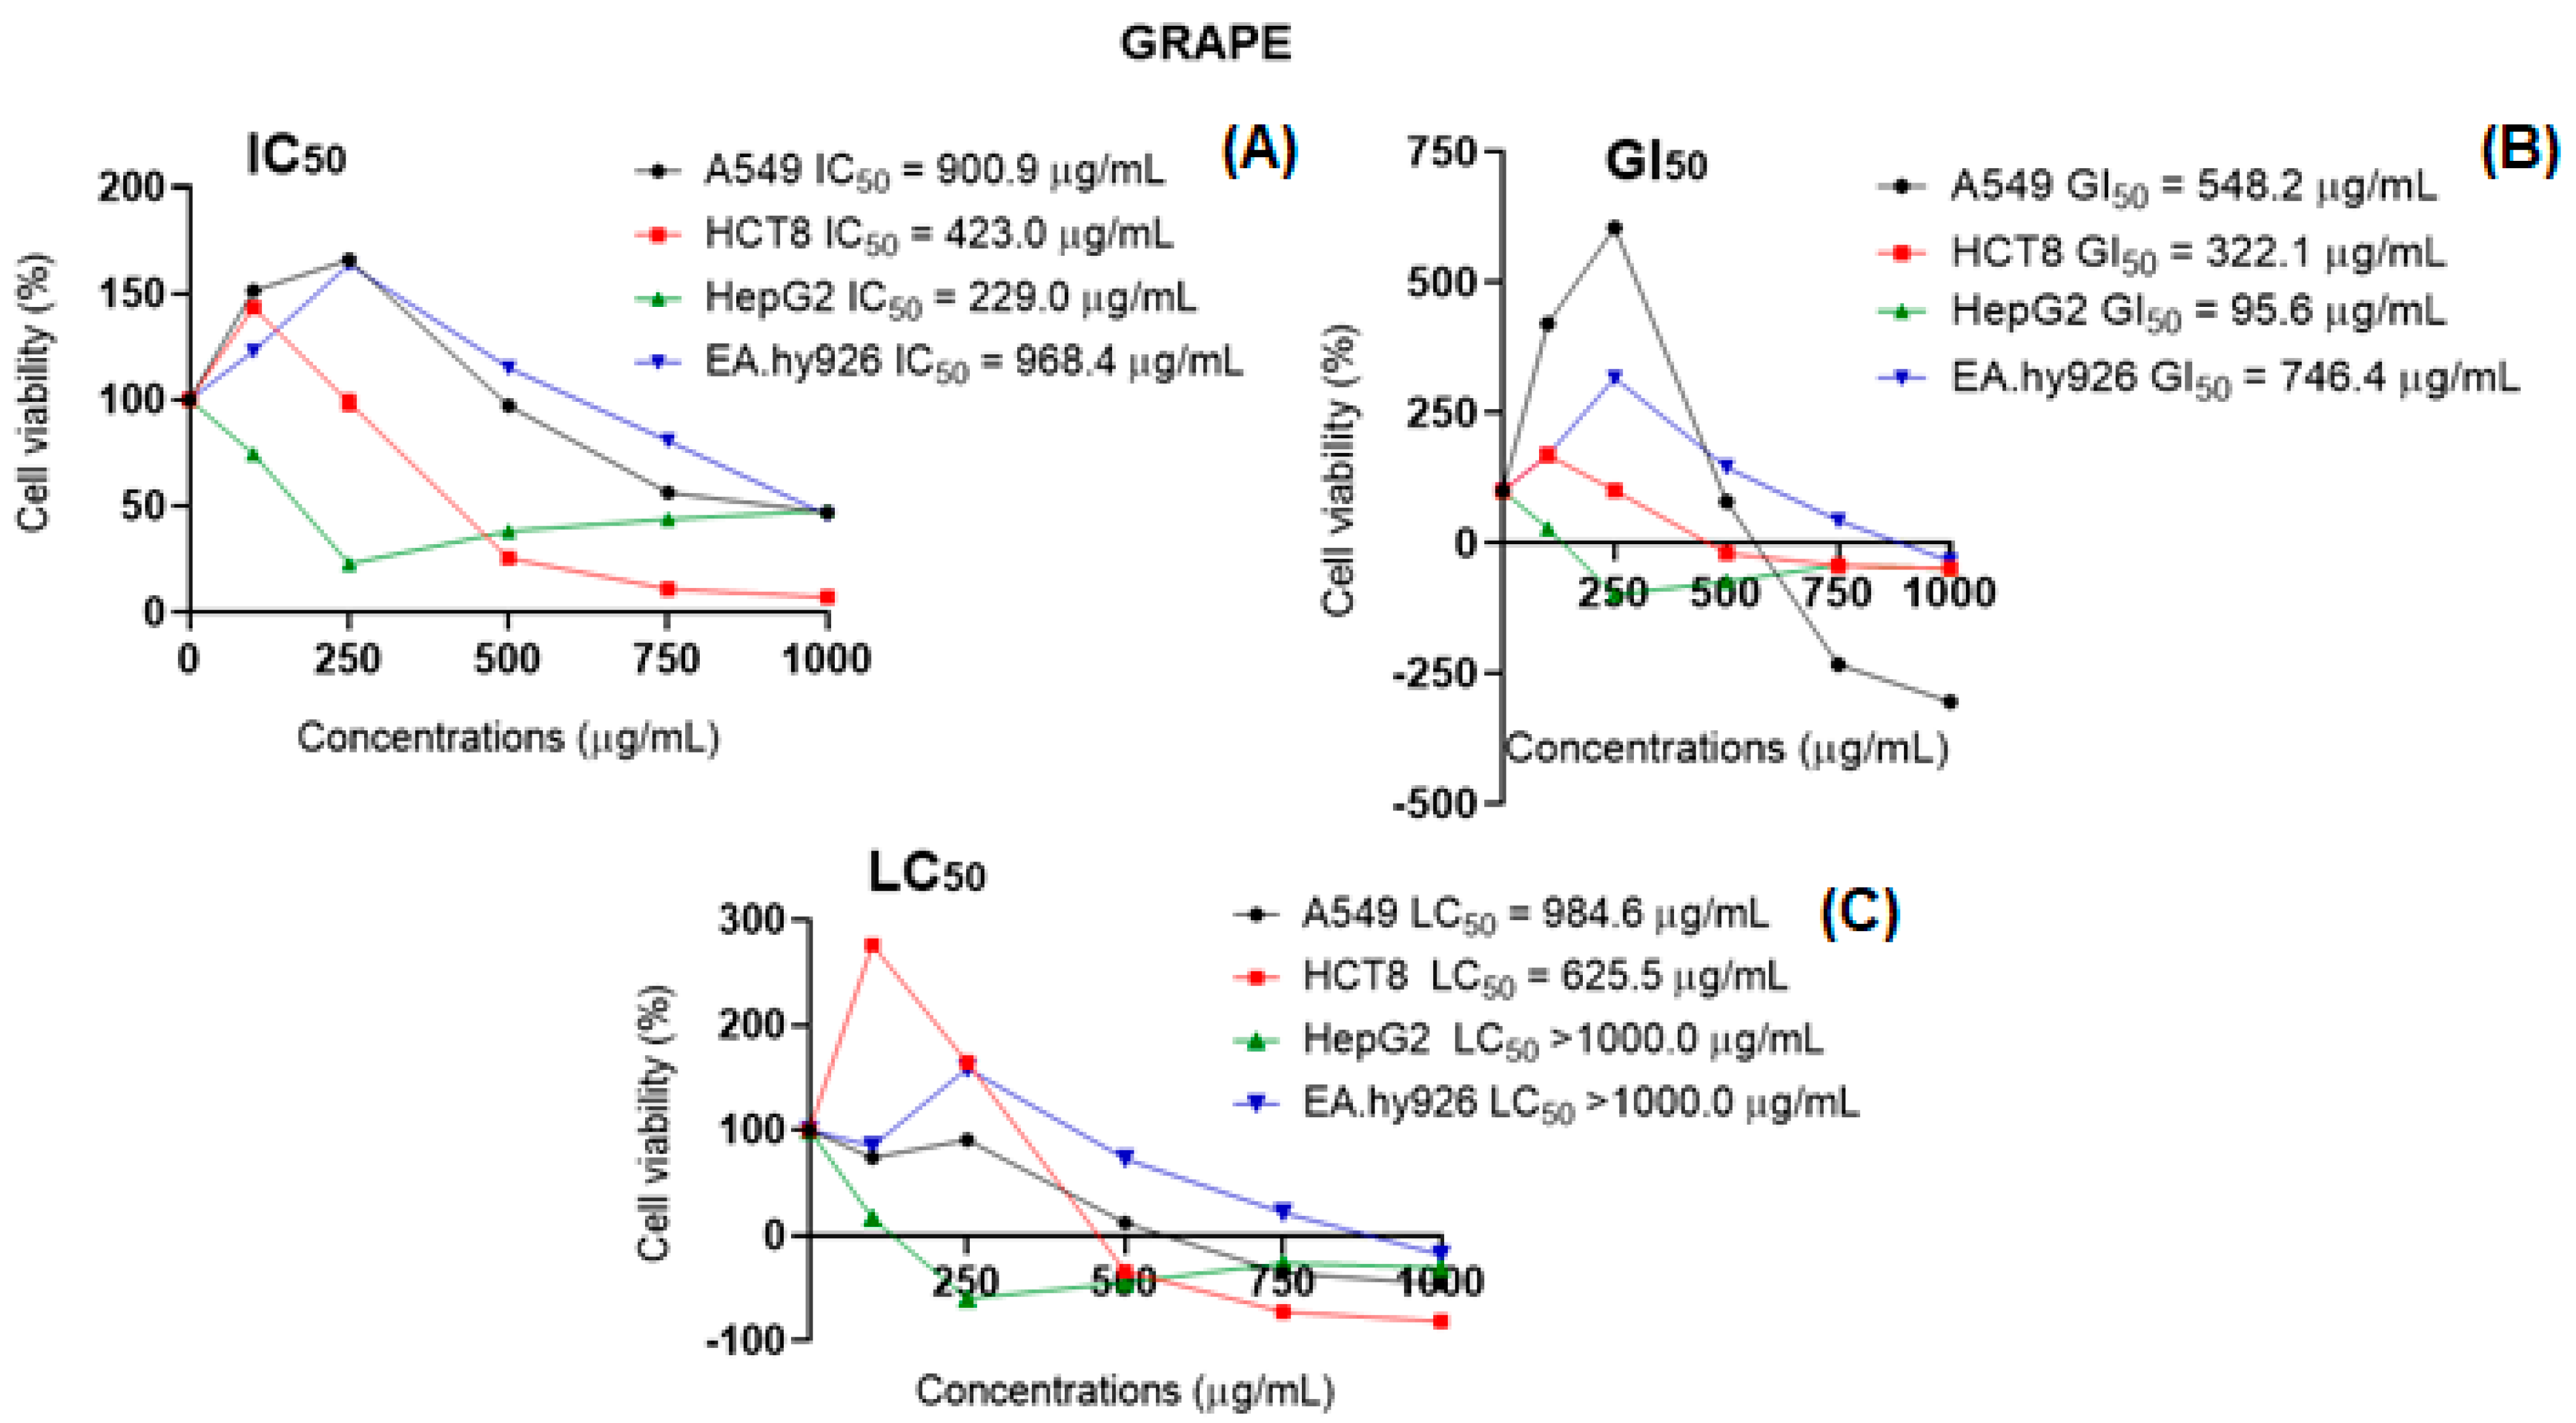
2.5. Intracellular ROS Generation and Cell Viability

Bioactive compounds found in berries, such as phenolic compounds, flavonoids, and tannins, can individually or synergistically protect individuals against several disorders due to their antioxidant properties. Such protective activity includes free radical scavenging, protection from DNA damage, induction of apoptosis, and inhibition of the growth and proliferation of cancer cells, just to name a few [38]. In this study, neither grape nor blackberry extracts induced ROS generation in A549 and HCT8 cancer cells, and they even exhibited a protective effect against H2O2-induced ROS production (Figure 4). This antioxidant activity may affect the pro-tumorigenic cancer cells signaling, interfering with their viability (A549 grape: IC50 = 900.9 µg/mL; blackberry: IC50 = 753.1 µg/mL; HCT8 grape: IC50 = 423.0 µg/mL) and proliferation (A549 grape: GI50 = 548.2 µg/mL; blackberry: GI50 = 100.2 µg/mL; HCT8 grape: GI50 = 322.1 µg/mL; blackberry: GI50 = 714.3 µg/mL), as observed in this study. In a different way, both grape and blackberry induced oxidative stress in HepG2 cancer cells, which can explain the cytotoxicity observed in the cell viability assay (grape: IC50 = 229.0 µg/mL; GI50 = 95.6 µg/mL; blackberry: GI50 = 424.5 µg/mL) (Figure 5). The increase in ROS at toxic levels can activate the JNK pathway, leading to cell death [39,40]. However, in HepG2, the extracts reduced the oxidative stress induced by H2O2, presenting antioxidant activity. The EA.hy926 cell line seemed to be more resistant to the effects of the extracts once it exhibited higher values for all the parameters (blackberry: IC50, GI50, and LC50 > 1000.0 µg/mL; grape: IC50 = 968.4 µg/mL, GI50 = 746.4 µg/mL and LC50 > 1000.0 µg/mL) in comparison with cancer cells (HCT8, HepG2, and A549). Non-cancer cells present specific adaptations to overcome the damaging effects of ROS through the balanced generation of these species, sufficient antioxidant activity, and cellular repair, which leads to low amounts of ROS toward limited cell survival and proliferation [39]. Regarding EA.hy926 hybrid cells, both extracts protected them against peroxide effects, reducing the ROS levels below the baseline, and in general, this effect was also observed in this study, considering the low or no toxicity in the cell viability test. The grape and blackberry antioxidant capacity can be correlated with all antioxidant in vitro assays (FRAP, DPPH, and the TPC), especially their high ability to scavenge hydroxyl radicals.

3. Material and Methods

3.1. Chemical Reagents and Cells

The Folin-Ciocalteu reagent, isobutanol, quercetin (95% purity), sodium hydroxide (NaOH), 2,2-diphenyl-1-picryl-hydrazyl radical (DPPH), pyrocatechol violet (3,3′ acid, 4-trihydroxyfuchsone-2′-sulfonic acid), 2,4,6-tris (2-pyridyl)-S-triazine (TPTZ), hydrogen peroxide, heneicosanoic acid (C:21), cholesterol, dimethyl sulfoxide (DMSO), 2′,7′-dichlorofluorescein diacetate (DCFH-DA), dehydrated ferric chloride, ascorbic acid, and ferrozine 3-(2-Pyridyl)-5,6-di(2-furyl)-1,2,4-triazine-5′,5″-disulfonic acid disodium salt) were obtained from Sigma-Aldrich (São Paulo, Brazil). Anhydrous sodium sulfate, n-hexane, chloroform, and methyl alcohol were obtained from Anidrol (São Paulo, Brazil). Ethyl alcohol was obtained from Neon (São Paulo, Brazil). A549, IMR90, HepG2, and Caco-2 were obtained from the cell bank of Rio de Janeiro/Rio de Janeiro, Brazil.

3.2. Vegetable Material

Blackberry (Rubus fruticosus) and Bordeaux grape (Vitis labrusca cv. Bordeaux) were produced in Vacaria, Rio Grande do sul (29°32′30″ S and 50°54′51″ W) and Garibaldi, Rio Grande do Sul (29°15′22″ S and 51°32′01″ W). The fruit, leaves, and flowers were identified morphologically by Prof. Rosangela Capuano Tardivo, and exsiccates of the vegetable material were deposited at the herbarium of the State University of Ponta Grossa and registered with numbers 22494 and 22495, respectively. The seeds were obtained manually and were subjected to sanitization with 100 mg/L NaOCl for 15 min, washing (current water), and drying (air circulation oven (Tecnical, Modelo TE-393/1, São Paulo, Brazil)) at 35 °C for 48 h and then milled (analytical mill (QUIMIS-6298A21)), standardized (Tyler sieve, mesh 60), and stored under refrigeration.

3.3. Obtaining Hydroalcoholic Extracts and Extraction Optimization

To degrease the seeds, 5.0 g of ground seeds were weighed and transferred to the extraction cartridge. The extractions were carried out for 5 h in a Soxhlet apparatus with n-hexane as the extraction solvent. The temperature was kept constant in the extractor apparatus, within the boiling range of n-hexane (68–70 °C). The degreased material was removed from the cartridge and dried in an oven at 35 °C for 2 h and stored in a refrigerator (5 ºC) until the extraction of the phenolic fraction.
A two-factor rotational central composite design was used for each vegetable material to verify the influence of the extraction time and solid-to-solution ratio on the total phenolic content and chemical antioxidant activity. To achieve this aim, 11 assays were randomly tested (Appendix B Table A1), with minimum extraction time values of 35.9 min and a maximum of 64.1 min, and 1:35.9 g/mL minimum and 1:64.1 g/mL maximum solid-to-solution ratios. The multiple linear regression methodology was used following the recommendations and procedures described by Granato et al. [41].
The proposed mathematical models only included regression coefficients with significance (p < 0.05), and the quality of the models was evaluated by the coefficient of determination (R2), an adjusted R2, and the residue analyzed using the Shapiro–Wilk test. Using RSM, regression models were obtained to describe each functional property and chemical compound extracted as a function of time and the sample/solvent ratio. Data were presented as the mean ± combined standard deviation. To compare the response variables, the data normality and homoscedasticity were initially checked using the Shapiro–Wilk and Brown–Forsythe tests, respectively, and the differences between the mean values were evaluated using one-way variance analysis (ANOVA) followed by the Fisher test. p-values below 5% were considered for rejecting the null hypothesis. TIBCO Statistica 13.3 software (TIBCO Statistica Ltd., Palo Alto, CA, USA) was used for all statistical analyses.

3.4. Phenolic Composition by LC-MS/MS and UV-VIS Spectrophotometry

The TPC was assessed using the Prussian Blue assay [42], and the results were expressed in mg of gallic acid equivalent per 100 g of sample (mg GAE/100 g). The total flavonoid content (TFC) of the samples was determined using the aluminum chloride colorimetric assay described by Aguiar et al. [43], and the results were expressed as mg of catechin equivalent per 100 g (mg CE/100 g) of the sample. The total ortho-diphenolic content (TOC) was determined using a sodium molybdate assay [44], and the results were expressed as mg of chlorogenic acid equivalent per 100 g (mg CAE/100 g). The total condensed tannin content (TCT) was determined using the vanillin-H2SO4 assay, and the results were expressed as (mg CTE/100 g).
In total, 22 phenolic compounds were individually determined by liquid chromatography coupled with tandem mass spectrometry (LC-MS/MS), according to the method described by Seraglio et al. [45]. LC-MS/MS analysis was performed with solvents of chromatographic grade and ultrapure water (minimum resistivity 18.3 MΩ cm). The analyses were performed in an ExionLC chromatograph coupled with a QTRAP 5500 mass spectrometer, both supplied by AB Sciex LLC (Framingham, MA, USA). The LC-MS/MS equipment was used in electrospray ionization source and multiple reaction monitoring (MRM) modes. Analyst software 1.6.2 (AB Sciex, Foster City, CA, USA) and MultiQuant (AB Sciex, Foster City, CA, USA) were used for instrument operation and data processing, respectively.
The chromatographic separation was performed in reversed-phase mode with a Zorbax Eclipse Plus C18 column (3.5 µm, 3.0 × 100 mm) manufactured by Agilent Technologies, Inc. (Santa Clara, CA, USA). The column oven was kept at 40 °C; the sample injection volume was 5 μL, and the mobile phase flow rate was set to 300 μL/min. Liquid chromatography was performed in gradient elution, as follows: 98% A (0–3 min), 80% A (3–10 min), 10% A (10–11 min), and 98% A (11–13 min), plus 4 min for the system to reach equilibrium. Mobile phase A comprised a formic acid aqueous solution (0.1%), and mobile phase B was composed of acetonitrile with 0.1% formic acid. Each sample was injected in triplicate, and the quantitation of each phenolic compound was performed by external standard calibration in the 25–1000 μg/L linear range, except for EGCG, whose linear range was 500–1000 μg/L, and correlation coefficients above 0.9980. The limits of quantitation ranged from 0.20 to 12.8 μg/L, and the description of the method validation is already available in Seraglio et al. [45]. The positive and negative ionization modes were set to 5500 V and −4500 V, respectively; other instrument parameters were set to 25 psi (curtain gas) and 55 psi (nebulizer gas and auxiliary gas) at 400 °C in a nitrogen atmosphere. The mass spectrometry parameters for the analysis of each phenolic compound are shown in Table S1, Supplementary Materials. The results were expressed in the mg of each phenolic compound per 100 g of extract (mg/100 g).

3.5. Antioxidant Activity

To evaluate antioxidant activity, tests assessing distinct action mechanisms were used, and the readings were made using a microplate reader (Synergy™ H1, Biotek, Shoreline, WA, USA), according to the methods proposed by Santos, Brizola, and Granato [46]. The antioxidant activity was evaluated by the Fe2+ chelating capacity using ferrozine as the chromophore, and the results were expressed in mg of the EDTA equivalent (mg EDTAE/100 g sample), DPPH free radical scavenging activity, using a methanolic solution of DPPH at 0.10 mmol/L, and FRAP. For DPPH and FPRA assays, the results were expressed in mg of the ascorbic acid equivalent (mg AAE/100 g sample). To assess the inhibition of induced oxidation, egg yolk was used as the source of phospholipids and triacylglycerols [47]. The analysis was conducted at a pH of 7.4, and quercetin was used as the standard. The results were expressed in mg of QE/100 g. The ability to capture OH radicals was determined by UV-VIS spectrophotometry in the presence of salicylic acid [48]. The hydroxyl radical inhibition rate was calculated using the following equation:
% Inhibition = ((ASample − ABlank)/(AControl − ABlank)) × 100

3.6. Toxicity Profiling and Cellular Antioxidant Activity

To assess the in vitro cytotoxicity of the extract, tetrazolium salt staining was used to evaluate the extract’s effect on cell viability by the parameters IC50, GI50, and LC50, as previously described by Carmo et al. [49]. A549 (lung adenocarcinoma epithelial cells), HepG2 (human hepatoma carcinoma cells), HCT8 (human colon carcinoma), and EA.hy926 (endothelial cell hybrid) were seeded at a density of 1 × 10⁴ cells/well. They were treated with extracts for 48 h, using the following concentrations: 50, 100, 150, 200, 250, and 500 µg of QE/mL. Then, an MTT solution (5 mg/mL) was added, and after 4 h, the insoluble formazan produced was dissolved in 100 μL of DMSO. Absorbance (570 nm) was measured using a microplate reader, and the dose–response analysis was determined by non-linear regression (curve fit).
Reactive oxygen species (ROS) generation impacts oxidation in biological systems. The intracellular amounts of ROS were measured by a fluorometric assay with 2,7-dichlorofluorescein diacetate (DCFH-DA), which detects and quantifies intracellular production of the superoxide radical, hydroxyl radical, and hydrogen peroxide [50]. All cell lines were seeded at 6 × 10⁴/well and treated for 1 h at 37 °C with extracts diluted in a DCFH-DA solution (25 mmol/L) at 10, 50, and 100 µg QE/mL concentrations. The cells were treated with 15 μmol/L of H2O2 for the positive control and for the negative control, only with the culture medium. After incubation, the intracellular production of ROS was measured by fluorometric detection of DCF oxidation using a spectrofluorometer with an excitation wavelength of 485 nm and an emission wavelength of 538 nm [51]. The DCF fluorescence intensity was proportional to the amount of ROS formed intracellularly.

3.7. In Vitro Antihemolytic Effect

Under hypotonic conditions, the antihemolytic activity was evaluated with erythrocytes isolated from O+ blood samples obtained from the Wallace Thadeu de Mello e Silva Regional University Hospital. The assays were performed according to Migliorini et al. [52], with hematocrit 0.8% and [NaCl] = 0.1%, 0.4%, and 0.8% (w/v), and the extract concentrated to 5.0, 7.5, and 10.0 μg GAE/mL, and the hemolysis rate was measured by the absorbance at 540 nm. The hemoglobin oxidation was carried out by the absorbance measure at 630 nm [53]. The entire experimental procedure was previously approved by the State University of Ponta Grossa Ethics Committee (CAAE 94830318.1.0000.0105).

3.8. Statistical Analysis

The experimental data were presented as the means ± sample standard deviation. When appropriate, a comparison of means between groups was performed by one-way variance analysis (ANOVA), followed by Fisher’s multiple comparison test. Before that, the Brown–Forsythe test was employed to verify the homoscedasticity of the entire data set using TIBCO Statistica 13.3 software (TIBCO Statistica Ltd. Pao Alto, CA, EUA) [10].

4. Conclusions

A simultaneous optimization was applied, and a combination of 35.9 min of extraction and a solid-to-solvent ratio of 1 g defatted grape seed to 61.28 mL extracting solvent (60% ethanol) and 62.1 min of extraction and a solid-to-solvent ratio of 1 g defatted blackberry seed to 64.1 mL of a 60% ethanol solution were the combinations that obtained the best results. Grape and blackberry seed extracts did not induce ROS generation in A549 and HCT8 cancer cells and, in addition, exhibited a protective effect against H2O2-induced ROS production and demonstrated antioxidant activity and a protective effect on erythrocytes when subjected to hypotonic and isotonic conditions. Furthermore, the extracts did not present hemolytic behavior in relation to the tested concentration. Considering the requirements of the 2030 Agenda and the need for sustainable ways to produce food ingredients, our results provide a broad assessment of the bioactivity of extracts obtained employing a simple and low-cost process using non-toxic solvents, with potential use in technological applications.

Supplementary Materials

The following supporting information can be downloaded at: https://www.mdpi.com/article/10.3390/plants12142618/s1, Figure S1: Blackberry chromatograms; Figure S2: Grape chromatograms; Table S1: Mass spectrometry parameters for the analysis of each phenolic compound.

Author Contributions

T.K.J.: Data curation, Formal analysis, Investigation, Writing—original draft; D.G.: Project administration, Resources, Software, Supervision; C.d.M., T.M.C., M.B.M., M.A.V.d.C., C.T.P.D., H.D. and L.A.: Methodology, Formal analysis, Investigation, Writing—original draft. All authors have read and agreed to the published version of the manuscript.

Funding

This project was partially funded by the Coordination for the Improvement of Higher Education Personnel, CAPES (Ph.D. grants for T.K.J. and C.d.M.).

Institutional Review Board statement

Not applicable.

Informed Consent Statement

Not available.

Data Availability Statement

Not available.

Acknowledgments

The authors thank CAPES (Coordination for the Improvement of Higher Education Personnel) for the Ph.D. scholarship (T. Kabbas Junior, Technical code 001).

Conflicts of Interest

The authors declare no conflict of interest.

Sample Availability

Samples of the extracts are available from the authors.

Appendix A

Figure A1. Profiles of predicted values and desirability for grape (A) and blackberry (B).
Plants 12 02618 g0a1

Appendix B

Table A1. Randomly tested assays.
Coded ValuesActual Values
Time
(min)
Mass/Volume Ratio
(w/v)
Time
(min)
Mass/Volume Ratio (w/v)
−1−1401:40
−11401:60
1−1601:40
11601:60
−1.41035.91:50
1.41064.11:50
0−1.41501:35.9
01.41501:64.1
00501:50
00501:50
00501:50

References

  1. Zacharof, M.-P. Grape winery waste as feedstock for bioconversions: Applying the biorefinery concept. Waste Biomass Valorization 2017, 8, 1011–1025. [Google Scholar] [CrossRef] [Green Version]
  2. Prasad, C.; Imrhan, V.; Juma, S.; Maziarz, M.; Prasad, A.; Tiernan, C.; Vijayagopal, P. Bioactive plant metabolites in the management of non-communicable metabolic diseases: Looking at opportunities beyond the horizon. Metabolites 2015, 5, 733–765. [Google Scholar] [CrossRef] [PubMed] [Green Version]
  3. Filippi, K.; Georgaka, N.; Alexandri, M.; Papapostolou, H.; Koutinas, A. Valorisation of grape stalks and pomace for the production of bio-based succinic acid by Actinobacillus succinogenes. Ind. Crops Prod. 2021, 168, 113578. [Google Scholar] [CrossRef]
  4. Gómez-Mejía, E.; Mikkelsen, L.H.; Rosales-Conrado, N.; León-González, M.E.; Madrid, Y. A combined approach based on matrix solid-phase dispersion extraction assisted by titanium dioxide nanoparticles and liquid chromatography to determine polyphenols from grape residues. J. Chromatogr. A 2021, 1644, 462128. [Google Scholar] [CrossRef]
  5. İşçimen, E.M.; Hayta, M. Microwave-assisted aqueous two-phase system based extraction of phenolics from pulses: Antioxidant properties, characterization and encapsulation. Ind. Crops Prod. 2021, 173, 114144. [Google Scholar] [CrossRef]
  6. Silva, R.F.M.; Pogačnik, L. Polyphenols from food and natural products: Neuroprotection and safety. Antioxidants 2020, 9, 61. [Google Scholar] [CrossRef] [Green Version]
  7. Gómez-Mejía, E.; Vicente-Zurdo, D.; Rosales-Conrado, N.; León-González, M.E.; Madrid, Y. Screening the extraction process of phenolic compounds from pressed grape seed residue: Towards an integrated and sustainable management of viticultural waste. LWT Food Sci. Technol. 2022, 169, 113988. [Google Scholar] [CrossRef]
  8. Monteiro, G.C.; Minatel, I.O.; Junior, A.P.; Gomez-Gomez, H.A.; de Camargo, J.P.C.; Diamante, M.S.; Basílio, L.S.P.; Tecchio, M.A.; Lima, G.P.P. Bioactive compounds and antioxidant capacity of grape pomace flours. LWT 2020, 135, 110053. [Google Scholar] [CrossRef]
  9. Pap, N.; Fidelis, M.; Azevedo, L.; do Carmo, M.A.V.; Wang, D.; Mocan, A.; Pereira, E.P.R.; Xavier-Santos, D.; Sant’Ana, A.S.; Yang, B.; et al. Berry polyphenols and human health: Evidence of antioxidant, anti-inflammatory, microbiota modulation, and cell-protecting effects. Curr. Opin. Food Sci. 2021, 42, 167–186. [Google Scholar] [CrossRef]
  10. Junior, T.K.; de Moura, C.; do Carmo, M.A.V.; Azevedo, L.; Esmerino, L.A.; Tardivo, R.C.; Kilpeläinen, P.; Granato, D. Chemical Composition, Antioxidant, Antimicrobial and Cytotoxic/Cytoprotective Activity of Non-Polar Extracts of Grape (Vitis labrusca cv. Bordeaux) and Blackberry (Rubus fruticosus) Seeds. Molecules 2021, 26, 4057. [Google Scholar] [CrossRef]
  11. Teixeira, A.; Eiras-Dias, J.; Castellarin, S.D.; Geros, H. Berry phenolics of grapevine under challenging environments. Int. J. Mol. Sci. 2013, 14, 18711–18739. [Google Scholar] [CrossRef] [PubMed] [Green Version]
  12. Fiume, M.M.; Bergfeld, W.F.; Belsito, D.V.; Hill, R.A.; Klaassen, C.D.; Liebler, D.C.; Marks, J.G.; Shank, R.C.; Slaga, T.J.; Snyder, P.W. Safety assessment of Vitis vinifera (Grape)-derived ingredients as used in cosmetics. Int. J. Toxicol. 2014, 33, 48–83. [Google Scholar] [CrossRef] [PubMed]
  13. Pinelo, M.; Arnous, A.; Meyer, A.S. Upgrading of grape skins: Significance of plant cell-wall structural components and extraction techniques for phenol release. Trends Food Sci. Technol. 2006, 17, 579–590. [Google Scholar] [CrossRef]
  14. Yun, S.; Chu, D.; He, X.; Zhang, W.; Feng, C. Protective effects of grape seed proanthocyanidins against iron overload-induced renal oxidative damage in rats. J. Trace Elem. Med. Biol. 2020, 57, 126407. [Google Scholar] [CrossRef] [PubMed]
  15. Wang, Y.; Wang, Y.; Shen, W.; Wang, Y.; Cao, Y.; Nuerbulati, N.; Chen, W.; Lu, G.; Xiao, W.; Qi, R. Grape Seed Polyphenols Ameliorated Dextran Sulfate Sodium-Induced Colitis via Suppression of Inflammation and Apoptosis. Pharmacology 2020, 105, 9–18. [Google Scholar] [CrossRef]
  16. Wang, L.; Huang, W.; Zhan, J. Grape Seed Proanthocyanidins Induce Autophagy and Modulate Survivin in HepG2 Cells and Inhibit Xenograft Tumor Growth in Vivo. Nutrients 2019, 11, 2983. [Google Scholar] [CrossRef] [Green Version]
  17. Arafat, E.A.; Shabaan, D.A. The possible neuroprotective role of grape seed extract on the histopathological changes of the cerebellar cortex of rats prenatally exposed to Valproic Acid: Animal model of autism. Acta Histochem. 2019, 121, 841–851. [Google Scholar] [CrossRef]
  18. Chen, F.; Wang, H.; Zhao, J.; Yan, J.; Meng, H.; Zhan, H.; Chen, L.; Yuan, L. Grape seed proanthocyanidin inhibits monocrotaline-induced pulmonary arterial hypertension via attenuating inflammation: In vivo and in vitro studies. J. Nutr. Biochem. 2019, 67, 72–77. [Google Scholar] [CrossRef]
  19. Hakimuddin, F.; Tiwari, K.; Paliyath, G.; Meckling, K. Grape and wine polyphenols down-regulate the expression of signal transduction genes and inhibit the growth of estrogen receptor–negative MDA-MB231 tumors in nu/nu mouse xenografts. Nutr. Res. 2008, 28, 702–713. [Google Scholar] [CrossRef]
  20. Singh, T.; Sharma, S.D.; Katiyar, S.K. Grape proanthocyanidins induce apoptosis by loss of mitochondrial membrane potential of human non-small cell lung cancer cells in vitro and in vivo. PLoS ONE 2011, 6, e27444. [Google Scholar] [CrossRef]
  21. Schlachterman, A.; Valle, F.; Wall, K.M.; Azios, N.G.; Castillo, L.; Morell, L.; Washington, A.V.; Cubano, L.A.; Dharmawardhane, S.F. Combined Resveratrol, Quercetin, and Catechin Treatment Reduces Breast Tumor Growth in a Nude Mouse Model. Transl. Oncol. 2008, 1, 19–27. [Google Scholar] [CrossRef] [PubMed] [Green Version]
  22. Singletary, K.W.; Stansbury, M.J.; Giusti, M.; Van Breemen, R.B.; Wallig, M.; Rimando, A. Inhibition of rat mammary tumorigenesis by concord grape juice constituents. J. Agric. Food Chem. 2003, 51, 7280–7286. [Google Scholar] [CrossRef] [PubMed]
  23. Moraes, D.P.; Lozano-S’anchez, J.; Machado, M.L.; Vizzotto, M.; Lazzaretti, M.; Leyva-Jimenes, F.J.J. Characterization of a new blackberry cultivar BRS Xingu: Chemical composition, phenolic compounds, and antioxidant capacity in vitro and in vivo. Food Chem. 2020, 322, 126783. [Google Scholar] [CrossRef] [PubMed]
  24. Tomas, M.; Rocchetti, G.; Ghisoni, S.; Giuberti, G.; Capanoglu, E.; Lucini, L. Effect of different soluble dietary fibres on the phenolic profile of blackberry puree subjected to in vitro gastrointestinal digestion and large intestine fermentation. Food Res. Int. 2019, 130, 108954. [Google Scholar] [CrossRef]
  25. Da Fonseca Machado, A.P.; Rezende, C.A.; Rodrigues, R.A.; Barbero, G.F.; De Tarso Vieira e Rosa, P.; Martínez, J. Encapsulation of anthocyanin-rich extract from blackberry residues by spray-drying, freeze-drying and supercritical antisolvent. Powder Technol. 2018, 340, 553–562. [Google Scholar] [CrossRef]
  26. Yamashita, C.; Chung, M.M.S.; Dos Santos, C.; Mayer, C.R.M.; Moraes, I.C.F.; Branco, I.G. Microencapsulation of an anthocyanin-rich blackberry (Rubus spp.) by-product extract by freeze-drying. LWT Food Sci. Technol. 2017, 84, 256–262. [Google Scholar]
  27. Zia-ul-haq, M.; Riaz, M.; De Feo, V.; Jaafar, H.; Moga, M. Rubus fruticosus L.: Constituents, biological activities and health related uses. Molecules 2014, 19, 10998–11029. [Google Scholar] [CrossRef] [Green Version]
  28. Sautebin, L.; Rossi, A.; Serraino, I.; Dugo, P.; Di Paola, R.; Mondello, L.; Genovese, T.; Britti, D.; Peli, A.; Dugo, G.; et al. Effect of Anthocyanins Contained in a Blackberry Extract on the Circulatory Failure and Multiple Organ Dysfunction Caused by Endotoxin in the Rat. Planta Medica 2004, 70, 745–752. [Google Scholar] [CrossRef]
  29. Serraino, I.; Dugo, L.; Dugo, P.; Mondello, L.; Mazzon, E.; Dugo, G.; Caputi, A.P.; Cuzzocrea, S. Protective effects of cyanidin-3-O-glucoside from blackberry extract against peroxynitrite-induced endothelial dysfunction and vascular failure. Life Sci. 2003, 73, 1097–1114. [Google Scholar] [CrossRef]
  30. Kaume, L.; Howard, L.R.; Devareddy, L. The Blackberry Fruit: A Review on Its Composition and Chemistry, Metabolism and Bioavailability, and Health Benefits. J. Agric. Food Chem. 2012, 60, 5716–5727. [Google Scholar] [CrossRef]
  31. Deolindo, C.T.P.; Monteiro, P.I.; Santos, J.S.; Cruz, A.G.; da Silva, M.C.; Granato, D. Phenolic-rich Petit Suisse cheese manufactured with organic Bordeaux grape juice, skin, and seed extract: Technological, sensory, and functional properties. LWT 2019, 115, 108493. [Google Scholar] [CrossRef]
  32. Karnopp, A.R.; Oliveira, K.G.; de Andrade, E.F.; Postingher, B.M.; Granato, D. Optimization of an organic yogurt based on sensorial, nutritional, and functional perspectives. Food Chem. 2017, 233, 401–411. [Google Scholar] [CrossRef]
  33. Granato, D.; Shahidi, F.; Wrolstad, R.; Kilmartin, P.; Melton, L.D.; Hidalgo, F.J.; Miyashita, K.; van Camp, J.; Alasalvar, C.; Ismail, A.B.; et al. Antioxidant activity, total phenolics and flavonoids contents: Should we ban in vitro screening methods? Food Chem. 2018, 264, 471–475. [Google Scholar] [CrossRef]
  34. Halin, M.A.; Kanan, K.A.; Nahar, T.; Rahman, M.J.; Ahmed, K.S.; Hossain, H.; Mozumder, N.H.M.R.; Ahmed, M. Metabolic profiling of phenolics of the extracts from the various parts of blackberry plant (Syzygium cumini L.) and their antioxidant activities. LWT Food Sci. Technol. 2022, 167, 113813. [Google Scholar] [CrossRef]
  35. Zhang, L.; Santos, J.S.; Cruz, T.M.; Marques, M.B.; do Carmo, M.A.V.; Azevedo, L.; Wang, Y.; Granato, D. Multivariate effects of Chinese keemun black tea grades (Camellia sinensis var. sinensis) on the phenolic composition, antioxidant, antihemolytic and cytotoxic/cytoprotection activities. Food Res. Int. 2019, 125, 108516. [Google Scholar] [PubMed]
  36. Cruz, T.M.; Santos, J.S.; do Carmo, M.A.V.; Hellström, J.; Pihlava, J.M.; Azevedo, L.; Granato, D.; Marques, M.B. Extraction optimization of bioactive compounds from ora-pro-nobis (Pereskia aculeata Miller) leaves and their in vitro antioxidant and antihemolytic activities. Food Chem. 2021, 361, 130078. [Google Scholar] [CrossRef] [PubMed]
  37. Atrooz, O.; Harb, M.; Al-Qato, M. The Antioxidant and Antihaemolytic Activities and the Polyphenolic Contents of Some Plants Seeds Extracts. Mu’tah Lil-Buhuth Wad-Dirasat Nat. Appl. Sci. Ser. 2007, 22, 11–23. [Google Scholar]
  38. Baby, B.; Antony, P.; Vijayan, R. Antioxidant and anticancer properties of berries. Crit. Rev. Food Sci. Nutr. 2018, 58, 2491–2507. [Google Scholar] [CrossRef]
  39. do Carmo, M.A.V.; Pressete, C.G.; Marques, M.J.; Granato, D.; Azevedo, L. Polyphenols as potential antiproliferative agents: Scientific trends. Curr. Opin. Food Sci. 2018, 24, 26–35. [Google Scholar] [CrossRef]
  40. Moloney, J.N.; Cotter, T.G. ROS signalling in the biology of cancer. Semin. Cell Dev. Biol. 2018, 80, 50–64. [Google Scholar] [CrossRef]
  41. Granato, D.; Grevink, R.; Zielinski, A.A.F.; Nunes, D.S.; Van Ruth, S.M. Analytical strategy coupled with response surface methodology to maximize the extraction of antioxidants from ternary mixtures of green, yellow, and red teas (Camellia sinensis var. sinensis). J. Agric. Food Chem. 2014, 62, 10283–10296. [Google Scholar] [CrossRef] [PubMed]
  42. Margraf, T.; Karnopp, A.R.; Rosso, N.D.; Granato, D. Comparison between Folin-Ciocalteu and Prussian Blue assays to estimate the total phenolic content of juices and teas using 96-well microplates. J. Food Sci. 2015, 80, C2397–C2403. [Google Scholar] [CrossRef] [PubMed]
  43. Aguiar, J.; Gonçalves, J.L.; Alves, V.L.; Câmara, J.S. Chemical Fingerprint of Free Polyphenols and Antioxidant Activity in Dietary Fruits and Vegetables Using a Non-Targeted Approach Based on QuEChERS Ultrasound-Assisted Extraction Combined with UHPLC-PDA. Antioxidants 2020, 9, 305. [Google Scholar] [CrossRef] [PubMed] [Green Version]
  44. Maestro Durán, R.; Borja Padilla, R.; Martín Martín, A.; Fiestas de Ursinos, J.A.; Alba Mendoza, J. Biodegradación de los compuestos fenólicos presentes en el alpechín. Grasas Y Aceites 1991, 42, 271–276. [Google Scholar] [CrossRef] [Green Version]
  45. Seraglio, S.K.T.; Valese, A.C.; Daguer, H.; Bergamo, G.; Azevedo, M.S.; Gonzaga, L.V.; Fett, R.; Costa, A.C.O. Development and validation of a LC-ESI-MS/MS method for the determination of phenolic compounds in honeydew honeys with the diluted-and-shoot approach. Food Res. Int. 2016, 87, 60–67. [Google Scholar] [CrossRef]
  46. Santos, J.S.; Alvarenga Brizola, V.R.; Granato, D. High-throughput assay comparison and standardization for metal chelating capacity screening: A proposal and application. Food Chem. 2017, 214, 515–522. [Google Scholar] [CrossRef]
  47. Margraf, T.; Santos, É.N.T.; de Andrade, E.F.; van Ruth, S.M.; Granato, D. Effects of geographical origin, variety and farming system on the chemical markers and in vitro antioxidant capacity of Brazilian purple grape juices. Food Res. Int. 2016, 82, 145–155. [Google Scholar] [CrossRef]
  48. Xiong, S.L.; Zheng, Y.; Dai, X.; Wang, Q.; Cao, J.; Xiao, J. Antioxidant and immunoregulatory activity of different polysaccharide fractions from tuber of Ophiopogon japonicus. Carbohydr. Polym. 2011, 86, 1273–1280. [Google Scholar] [CrossRef]
  49. Do Carmo, M.A.V.; Fidelis, M.; Pressete, C.G.; Marques, M.J.; Castro-Gamero, A.M.; Myoda, T.; Granato, D.; Azevedo, L. Hydroalcoholic Myrciaria dubia (camu-camu) seed extracts prevent chromosome damage and act as antioxidant and cytotoxic agents. Food Res. Int. 2019, 125, 108551. [Google Scholar] [CrossRef]
  50. Othmène, Y.B.; Salem, I.B.; Hamdi, H.; Annabi, E.; Abid-Essefi, S. Tebuconazole induced cytotoxic and genotoxic effects in HCT116 cells through ROS generation. Pestic. Biochem. Physiol. 2021, 174, 104797. [Google Scholar] [CrossRef]
  51. Granato, D.; Reshamwala, D.; Korpinen, R.; Azevedo, L.; Vieira do Carmo, M.A.; Cruz, T.M.; Marques, M.B.; Wen, M.; Zhang, L.; Marjomäki, V.; et al. From the forest to the plate—Hemicelluloses, galactoglucomannan, glucuronoxylan, and phenolic-rich extracts from unconventional sources as functional food ingredients. Food Chem. 2022, 381, 132284. [Google Scholar] [CrossRef] [PubMed]
  52. Migliorini, A.A.; Piroski, C.S.; Daniel, T.G.; Cruz, T.M.; Escher, G.B.; Vieira do Carmo, M.A.; Azevedo, L.; Marques, M.B.; Granato, D.; Rosso, N.D. Red Chicory (Cichorium intybus) Extract Rich in Anthocyanins: Chemical Stability, Antioxidant Activity, and Antiproliferative Activity In Vitro. J. Food Sci. 2019, 84, 990–1001. [Google Scholar] [CrossRef] [PubMed]
  53. Morabito, R.; Remigante, A.; Di Pietro, M.L.; Giannetto, A.; La Spada, G.; Marino, A. SO4 = uptake and catalase role in preconditioning after H2O2-induced oxidative stress in human erythrocytes. Pflügers Arch. Eur. J. Physiol. 2017, 469, 235–250. [Google Scholar] [CrossRef] [PubMed]
Figure 1. Main phenolic compounds in different grape fractions [13].
Plants 12 02618 g001
Figure 2. Main phenolic compounds present in different blackberry fractions.
Plants 12 02618 g002
Figure 3. Effect of lyophilized grape (A) and blackberry (B) extracts on the hemolysis of human erythrocytes in the hypotonic medium.
Plants 12 02618 g003
Figure 4. Results of intracellular measurement of ROS in A549 (A), HepG2 (B), HCT8 (C), and EA.hy (D) cells by spectrofluorometry. Optimized treatment and lyophilized extract of grape seeds (Vitis labrusca cv. Bordeaux) and blackberry seeds (Rubus fruticosus) at 10–100 µg/mL. Quantitative data are the mean ± standard deviation. Different letters represent statistically significant differences (p ≤ 0.05).
Plants 12 02618 g004aPlants 12 02618 g004b
Figure 5. Cell viability and evaluation of the concentration-dependent effect after 48-h exposure to lyophilized hydroalcoholic extract in A549, HCT8, HepG2, and Ea.hy926 cell lines. (A) IC50: concentration of the agent that inhibits cell growth by 50%; (B) GI50: concentration of the agent that inhibits growth by 50%, related to untreated cells; (C) LC50: concentration of the agent that results in a net loss of 50% of cells, associated with the number of cells at the start of treatment.
Plants 12 02618 g005aPlants 12 02618 g005b
Table 1. Chemical composition and antioxidant activity of grape extracts in relation to the extraction time and solid-to-volume ratio.
TestsIndependent Variables
(Original and Coded Values)
Total Phenolic Content (mg GAE/100 g)Flavonoids (mg QE/100 g)Condensed Tannins
(mg CTE/100 g)
Ortho-Diphenolics (mg [ACE]/100 g)DPPH (mg AAE/100 g)Fe2+ Chelating Capacity (mg EDTAE/100 g)FRAP (mg AAE/100 g)
Time (min)1:X (g/mL)
140 (−1)1:40 (−1)2916 ± 7 cde62.9 ± 1.7 f3242 ± 95 e554 ± 20 e5870 ± 98 def66.1 ± 1.8 c9032 ± 328 b
240 (−1)1:60 (1)3609 ± 24 a78.8 ± 2.8 b3928 ± 315 de744 ± 24 bc7069 ± 544 a55.5 ± 4.9 d10,023 ± 98 a
360 (1)1:40 (−1)2914 ± 61 de55.9 ± 2.1 g3885 ± 353 de697 ± 40 cd5676 ± 250 f45.4 ± 4.1 e7518 ± 241 de
460 (1)1:60 (1)2747 ± 117 f74,1 ± 1.6 c4982 ± 438 bc700 ± 78 cd6173 ± 36 cde85.3 ± 5.3 a7294 ± 234 e
535.9 (−1.41)1:50 (0)3623 ± 105 a72.7 ± 3.0 cde5561 ± 1092 b963 ± 64 a6650 ± 141 ab46.7 ± 2.6 e9596 ± 308 a
664.1 (1.41)1:50 (0)3036 ± 45 bc69.4 ± 2.6 de5030 ± 538 bc801 ± 54 b5832 ± 79 def65.1 ± 6.5 c8360 ± 190 c
750 (0)1:35.9 (−1.41)2825 ± 12 ef68.5 ± 3.3 e3993 ± 449 de892 ± 11 a5517 ± 80 f36.1 ± 2.4 f7807 ± 166 d
850 (0)1:64.1 (1.41)3010 ± 51 bcd73.6 ± 3.9 cd5695 ± 267 ab753 ± 43 bc6679 ± 511 ab74.2 ± 3.7 b7565 ± 579 de
9C50 (0)1:50 (0)3087 ± 72 b70.1 ± 2.7 cde6384 ± 368 a787 ± 80 b6388 ± 91 bc61.4 ± 1.3 cd8661 ± 342 bc
10C50 (0)1:50 (0)3063 ± 100 b69.2 ± 2.3 de4547 ± 411 cd636 ± 16 d5786 ± 293 ef64.2 ± 7.2 c8305 ± 202 c
11C50 (0)1:50 (0)2884 ± 89 e84.9 ± 3.0 a4022 ± 128 de648 ± 12 d6237 ± 153 bcd61.7 ± 2.9 cd8660 ± 249 bc
p-Value (homocedasticity)0.5030.9990.9420.9140.7090.9540.97
p-Value (one-way ANOVA)<0.001<0.001<0.001<0.001<0.001<0.001<0.001
Note: (C) = central point; 1:X = 1 g vegetable material to X mL extractor solvent; CTE = catechin equivalent; GAE = gallic acid equivalent; QE = quercetin equivalent; AAE = ascorbic acid equivalent; EDTAE = ethylenediaminetetraacetic acid equivalent; ACE = chlorogenic acid equivalent. Different letters in the same column indicate significant differences at the 5% level.
Table 2. Chemical composition and antioxidant activity of blackberry extracts in relation to the extraction time and solid-to-volume ratio.
TestsIndependent Variables
(Original and Coded Values)
Total Phenolic Content (mg GAE/100 g)Flavonoids (mg QE/100 g)Condensed Tannins (mg CTE/100 g)Ortho-Diphenolics
(mg ACE/100 g)
DPPH (mg AAE/100 g)Fe2+ Chelating Capacity (mg EDTAE/100 g)FRAP (mg AAE/100 g)
Time (min)1:X (g/mL)
140 (−1)1:40 (−1)923 ± 11 h46.2 ± 1.6 e579 ± 44 f253 ± 32 e1769 ± 87 f144 ± 8 f3060 ± 53 f
240 (−1)1:60 (1)1167 ± 6 g58.1 ± 1.7 cd637 ± 50 ef258 ± 3 e2246 ± 197 cde227 ± 1 a3823 ± 143 d
360 (1)1:40 (−1)1067 ± 25 cd55.9 ± 1.8 d594 ± 42 f350 ± 35 cd2152 ± 147 de143 ± 4 f3437 ± 92 e
460 (1)1:60 (1)1243 ± 13 a65.7 ± 1.0 a1001 ± 112 ab367 ± 13 bcd1229 ± 190 g215 ± 9 b4258 ± 148 a
535.9 (−1.41)1:50 (0)1143 ± 9 de60.9 ± 0.6 b856 ± 19 cd426 ± 66 a2470 ± 173 bc186 ± 7 c3893 ± 78 cd
664.1 (1.41)1:50 (0)1202 ± 8 b63.8 ± 1.6 a840 ± 40 cd409 ± 31 ab2366 ± 194 cd185 ± 5 c3958 ± 93 bcd
750 (0)1:35.9 (−1.41)1073 ± 26 g59.4 ± 1.6 bc750 ± 45 de420 ± 42 ab2098 ± 93 e120 ± 4 g3551 ± 92 e
850 (0)1:64.1 (1.41)1170 ± 21 cd60.3 ± 0.4 bc1114 ± 141 a326 ± 18 d2760 ± 127 a235 ± 5 a4295 ± 317 a
9C50 (0)1:50 (0)1105 ± 20 f58.4 ± 1.4 c872 ± 112 bcd382 ± 49 abcd2264 ± 78 cde175 ± 2 d3951 ± 80 bcd
10C50 (0)1:50 (0)1187 ± 30 bc59.7 ± 1.1 bc872 ± 20 bcd372 ± 12 abcd2706 ± 94 ab166 ± 5 e4153 ± 166 ab
11C50 (0)1:50 (0)1129 ± 10 ef61.1 ± 0.9 b926 ± 96 bc391 ± 15 abc2634 ± 79 ab183 ± 3 cd4088 ± 209 abc
p-Value (homocedasticity)0.9490.9760.8890.6990.9480.790.879
p-Value (one-way ANOVA)<0.001<0.001<0.001<0.001<0.001<0.001<0.001
Note: (C) = central point; 1:X = 1 g vegetable material to X mL extractor solvent; CTE = catechin equivalent; GAE = gallic acid equivalent; QE = quercetin equivalent; AAE = ascorbic acid equivalent; EDTAE = ethylenediaminetetraacetic acid equivalent; ACE = chlorogenic acid equivalent. Different letters in the same column indicate significant differences at the 5% level.
Table 3. Effects of time and x/s ratio on the extraction of bioactive compounds and antioxidant activity of grape (Vitis labrusca) seeds.
Model ComponentsRegression CoefficientsStandard Errort-Valuep-Value−95%
Confidence
+95% Confidence
Total phenolic content
Mean301229.6102<0.00129513073
(1) Time (min)(L)−21218.1−11.7<0.001−249−175
Time (min)(Q)14021.66.5<0.00195.7185
(2) Ratio (x/s)(L)9918.15.4<0.00161.3136
Ratio (x/s)(Q)−6721.6−3.10.005−112−22.5
1 L to 2 L−21525.6−8.4<0.001−268−162
R20.905
Adjusted R20.888
p-value (normality of residues)0.763
Free radical scavenging activity (DPPH)
Mean.617152.1118<0.00160646279
(1) Time (min)(L)−28161.2−4.6<0.001−408−155
(2) Ratio (x/s)(L)41861.26.8<0.001292544
R20.706
Adjusted R20.680
p-value (normality of residues)0.945
Ferric-reducing antioxidant power (FRAP)
Mean854299.685.8<0.00183368747
(1) Time (min)(L)−75161.1−12.3<0.001−877−624
Time (min)(Q)25472.93.50.002103404
Ra (io/s)(Q)−39672.9−5.4<0.001−546−246
1 L to 2 L−30486.2−3.50.002−482−126
R20.795
Adjusted R20.765
p-value (normality of residues)0.401
Table 4. Effects of time and x/s ratio on the extraction of bioactive compounds and antioxidant activity of blackberry (Rubus fruticosus) seeds.
Model ComponentsRegression CoefficientStandard Errort-Valuep-Value−95%
Confidence
+95% Confidence
Total phenolic content
Mean11456.6173<0.00111311159
(1) Time (min)(L)38.05.66.8<0.00126.549.6
(2) Ratio (x/s)(L)69.75.612.5<0.00158.281.2
Ratio (x/s)(Q)−22.66.4−3.50.002−35.8−9.5
1 L to 2 L−17.37.9−2.20.038−33.6−1.0
R20.706
Adjusted R20.664
p-value (normality of residues)0.648
Fe2+ chelating capacity
Mean1771.6110<0.001173180
Time (min)(Q)5.41.53.50.0022.28.6
(2) Ratio (x/s)(L)39.71.429.3<0.00136.942.5
R20.965
Adjusted R20.963
p-value (normality of residues)0.077
Ferric-reducing antioxidant power (FRAP)
Mean406551.678.8<0.00139594171
(1) Time (min)(L)11331.63.60.00247.9178
Time (min)(Q)−14037.7−3.70.001−218−62.4
(2) Ratio (x/s)(L)33031.610.4<0.001265395
Ratio (x/s)(Q)−14237.7−3.8<0.001−220−63.8
R20.719
Adjusted R20.679
p-value (normality of residues)0.232
Table 5. Predicted and experimental values of the optimized extracts.
Parameters EvaluatedPredicted Mean Values−95% Prediction+95% PredictionExperimental Mean ValuesRelative Error (%)
GrapeTPC (mg GAE/100 g)3847362540683623 ± 405.8
FRAP (mg AAE/100 g)10,084933910,8299395 ± 146.8
DPPH (mg AAE/100 g)6914616776617102 ± 1642.7
BlackberryTPC (mg GAE/100 g)1249118413141295 ± 123.7
FRAP (mg AAE/100 g)4180381145493804 ± 459.0
Fe2+ (mg EDTA/100 g)241225256231 ± 64.1
Note: TPC = total phenolic content; GAE = gallic acid equivalent; FRAP = ferric iron reduction antioxidant power; AAE = ascorbic acid equivalent; EDTAE = ethylenodiaminetetraacetic acid equivalent; DPPH = 2.2-diphenyl-1-picrylhydrazyl.
Table 6. Chemical composition of optimized and lyophilized grape and blackberry extracts.
Total Phenolic Content (mg GAE/100 g)Flavonoids (mg QE/100 g)Condensed Tannins (mg CTE/100 g)Ortho-Diphenols (mg ACE/100 g)DPPH (mg AAE/100 g)Fe2+ Chelating Capacity (mg EDTAE/100 g)FRAP (mg AAE/100 g)OH Radical Capture (mg AAE/100 g)Lipidic Peroxidation Inhibition—IC50 (mg/L)
Grape2778 ± 21861 ± 0.052609 ± 257729 ± 814838 ± 65459 ± 24972 ± 164258,165 ± 17,568124.1
Blackberry981 ± 18538.1 ± 0.06409 ± 154233 ± 371377 ± 117210 ± 81856 ± 164164,279 ± 585630.6
Note: TPC = total phenolic content; GAE = gallic acid equivalent; CTE = catechin equivalent; FRAP = ferric iron reduction antioxidant power; AAE = ascorbic acid equivalent; EDTAE = ethylenodiaminetetraacetic acid equivalent; DPPH = 2,2-diphenyl-1-picrylhydrazyl; QE = quercetin equivalent; ACE = chlorogenic acid equivalent.
Table 7. Phenolic composition of grape and blackberry lyophilized extracts.
Grape (mg/100 g)Blackberry (mg/100 g)
Phenolic acids
Ferulic acid1.3 ± 0.20.8 ± 0.1
2,5- Dihydroxybenzoic acidND33.5 ± 1.6
3,4-Dihydroxybenzoic acid5.7 ± 0.134.5 ± 0.9
Salicylic acidND0.2 ± 0.0
p-Coumaric acid1.2 ± 0.0ND
Caffeic acidND0.1 ± 0.0
Synaptic acid0.6 ± 0.00.9 ± 0.1
SinapaldehydeND1.0 ± 0.0
Flavonoids
(−)-Epicatechin833.1 ± 2.781.5 ± 3.4
(+)-Catechin573.8 ± 11.288.8 ± 3.4
Epigallocatechin-3-gallate785.0 ± 1.68.4 ± 0.1
Quercetin231.7 ± 1.215.2 ± 0.2
Quercetin-3-rutinoside72.6 ± 1.013.1 ± 0.6
Quercetin-3-glucoside2.5 ± 0.135.3 ± 1.6
Hesperidin9.1 ± 0.712.7 ± 0.3
KaempferolND1.8 ± 0.1
Kaempferol-3-rutinoside1.5 ± 0.1ND
Taxifolin0.4 ± 0.1ND
PinocembrineND1.0 ± 0.1
GalangineND0.1 ± 0.0
ApigeninND0.2 ± 0.0
Others
ConiferaldehydeND0.5 ± 0.1
Total identified (mg/100 g)2519329
Note: ND = not detected.
Disclaimer/Publisher’s Note: The statements, opinions and data contained in all publications are solely those of the individual author(s) and contributor(s) and not of MDPI and/or the editor(s). MDPI and/or the editor(s) disclaim responsibility for any injury to people or property resulting from any ideas, methods, instructions or products referred to in the content.

