Abstract
Castanopsis is one of the most common genus of trees in subtropical evergreen broad-leaved forests and tropical monsoon rainforests in China. Castanopsis hainanensis and Castanopsis wenchangensis are endemic to Hainan Island, but they were once confused as the same species due to very similar morphologies. In this study, nuclear microsatellite markers and chloroplast genomes were used to delimit C. hainanensis and C. wenchangensis. The allelic variations of nuclear microsatellites revealed that C. hainanensis and C. wenchangensis were highly genetically differentiated with very limited gene admixture. Both showed higher genetic diversity within populations and lower genetic diversity among populations, and neither had further population genetic structure. Furthermore, C. wenchangensis and C. hainanensis had very different chloroplast genomes. The independent genetic units, very limited gene admixture, different distribution ranges, and distinct habitats all suggest that C. wenchangensis and C. hainanensis are independent species, thus they should be treated as distinct conservation units.
1. Introduction
Accurately identifying species identities and boundaries is necessary for determining conservation and management units [1]. There is much debate on defining species, and dozens of species concepts have been proposed, such as the morphological species concept that highlights intuitive differences in phenotypic characteristics, the biological species concept that emphasizes reproductive isolation, and the evolutionary species concept that considers independent evolutionary histories and ecological niches [2,3]. For trees, the difficulty in defining species is often exacerbated by factors such as longer generation times and larger effective population sizes, which may slow down lineage sorting [4]. In addition, frequent introgression may increase the chance of shared polymorphisms in markers or traits [5]. Although less contentious than taxonomic delimitation and the species-level debate, it is also complex and challenging to define conservation and management units for conservation actions [6,7].
Castanopisis species are dominant trees in subtropical evergreen broad-leaved forests and tropical monsoon rainforests [8]. The leaves of the Castanopsis tree are tough and sclerotized, with a thick cuticula, usually alternate and distichous, or rarely spirally arranged. The inflorescences are usually unisexual; male flowers are common in clusters, but female flowers are often solitary on erect catkins. The bracts are spinelike or rarely scalelike, sparsely or densely covered outside of cupules, and have diagnostic morphological characteristics in different species [9]. Although certain progress has been made in the taxonomy and inventory of Castanopisis, there are still many doubts about the classification and identification of some species [10].
Castanopsis wenchangensis G. A. Fu et Huang was first published in 1989 [11]; however, it is noted that the description of C. wenchangensis in FRPS (Flora Reipublicae Popularis Sinicae) was not the same as the original publication [10,11,12]. Due to this mistake, the identification of this species has been misled for many years. Because C. wenchangensis has highly similar morphologies to C. hainanensis Merr., which caused substantial confusion about the classification and identification of the two species, they were once considered the same species. Although the morphological characteristics of the two species are very similar, they can still be distinguished. C. hainanensis has relatively large cupules with a diameter of 4–5 cm, entirely covered with spines; the leaves are 5–12 cm long and 2.5–5 cm wide, rounded at the apex, acute at the base, and have 10–18 secondary veins on each side of the midvein [9]. In contrast, C. wenchangensis has relatively small cupules with a diameter of 1.4–2.0 cm, sparsely covered with gray pubescent spines; the leaves are 4.5–6.5 cm long and 1.9–3.1 cm wide, acuminate at the apex, obtuse at the base, and have 6–9 secondary veins on each side of the midvein [10,11]. It is worth mentioning that the leaves of C. wenchangensis are abaxially covered with dense pubescences and reddish-brown scales, which makes this species more prominent and recognizable in late autumn. Both C. hainanensis and C. wenchangensis are endemic species of Hainan Island; the former is distributed in the mountainous regions of the central and southern parts of Hainan Island, while the latter is only restricted to a very small area in the coastal lowlands of Wenchang City. Therefore, another question has been raised: Is C. wenchangensis an independent species or is it a distinct population of C. hainanensis? Thus, the investigation of the genetic differentiation between C. hainanensis and C. wenchangensis has critical importance for the full understanding of the delimitation and relationship between the two species.
At present, it has become very common to differentiate and delimit species by using nuclear and chloroplast variation. Simple sequence repeat (SSR) is one of the most commonly used molecular markers and has widespread application in the identification of population structure and conservation units [13,14]. Despite the highly conserved structures of the chloroplast genomes of plants, considerable sequence variations have been revealed within and between species, which has enhanced our understanding of plant diversity and evolutionary relationships [15]. The advances in high-throughput sequencing technologies and bioinformatic tools have facilitated rapid progress in the comparative analysis of chloroplast genomes and allowed species identification [16].
In this study, we used nuclear microsatellite loci and comparative chloroplast genomes to investigate the genetic differentiation between C. hainanensis and C. wenchangensis, with emphasis on delineating the species boundaries of C. hainanensis and C. wenchangensis, assessing the genetic diversity of existing populations, and providing effective conservation guidelines for the two endemic species.
2. Results
2.1. Nuclear SSR (nSSR) Diversity and Genetic Structure
Among the 16 nSSRs, four loci significantly deviated from the Hardy–Weinberg equilibrium (p < 0.01) and were excluded from further analysis. Genetic diversity was estimated for the 12 retained loci (Table 1). The number of alleles (A) per locus ranged from 3 to 11, with an average of 6.167. The expected heterozygosity (He) was 0.169–0.742, and gene diversity in the total population was 0.176–0.823. The mean values of FST, GST, and RST were 0.164, 0.149, and 0.157, respectively.

Table 1.
Genetic diversity parameters at the 12 retained microsatellite loci.
At the population level, the allele richness (AR) was 2.060–2.803 in C. wenchangensis and 2.833–3.331 in C. hainanensis (Table 2). Population SMX harbored the highest genetic diversity (AR = 3.331), while PD had the lowest genetic diversity (AR = 2.060). The expected heterozygosity (He) ranged from 0.329 to 0.466 in C. wenchangensis and 0.433 to 0.476 in C. hainanensis. The mean heterozygosity of C. wenchangensis (He = 0.416) was lower than that of C. hainanensis (He = 0.454). The mean coefficient of inbreeding (FIS) was 0.007 and 0.05 in C. wenchangensis and C. hainanensis, respectively.
Table 2.
Genetic diversity parameters in 11 populations of the two species.
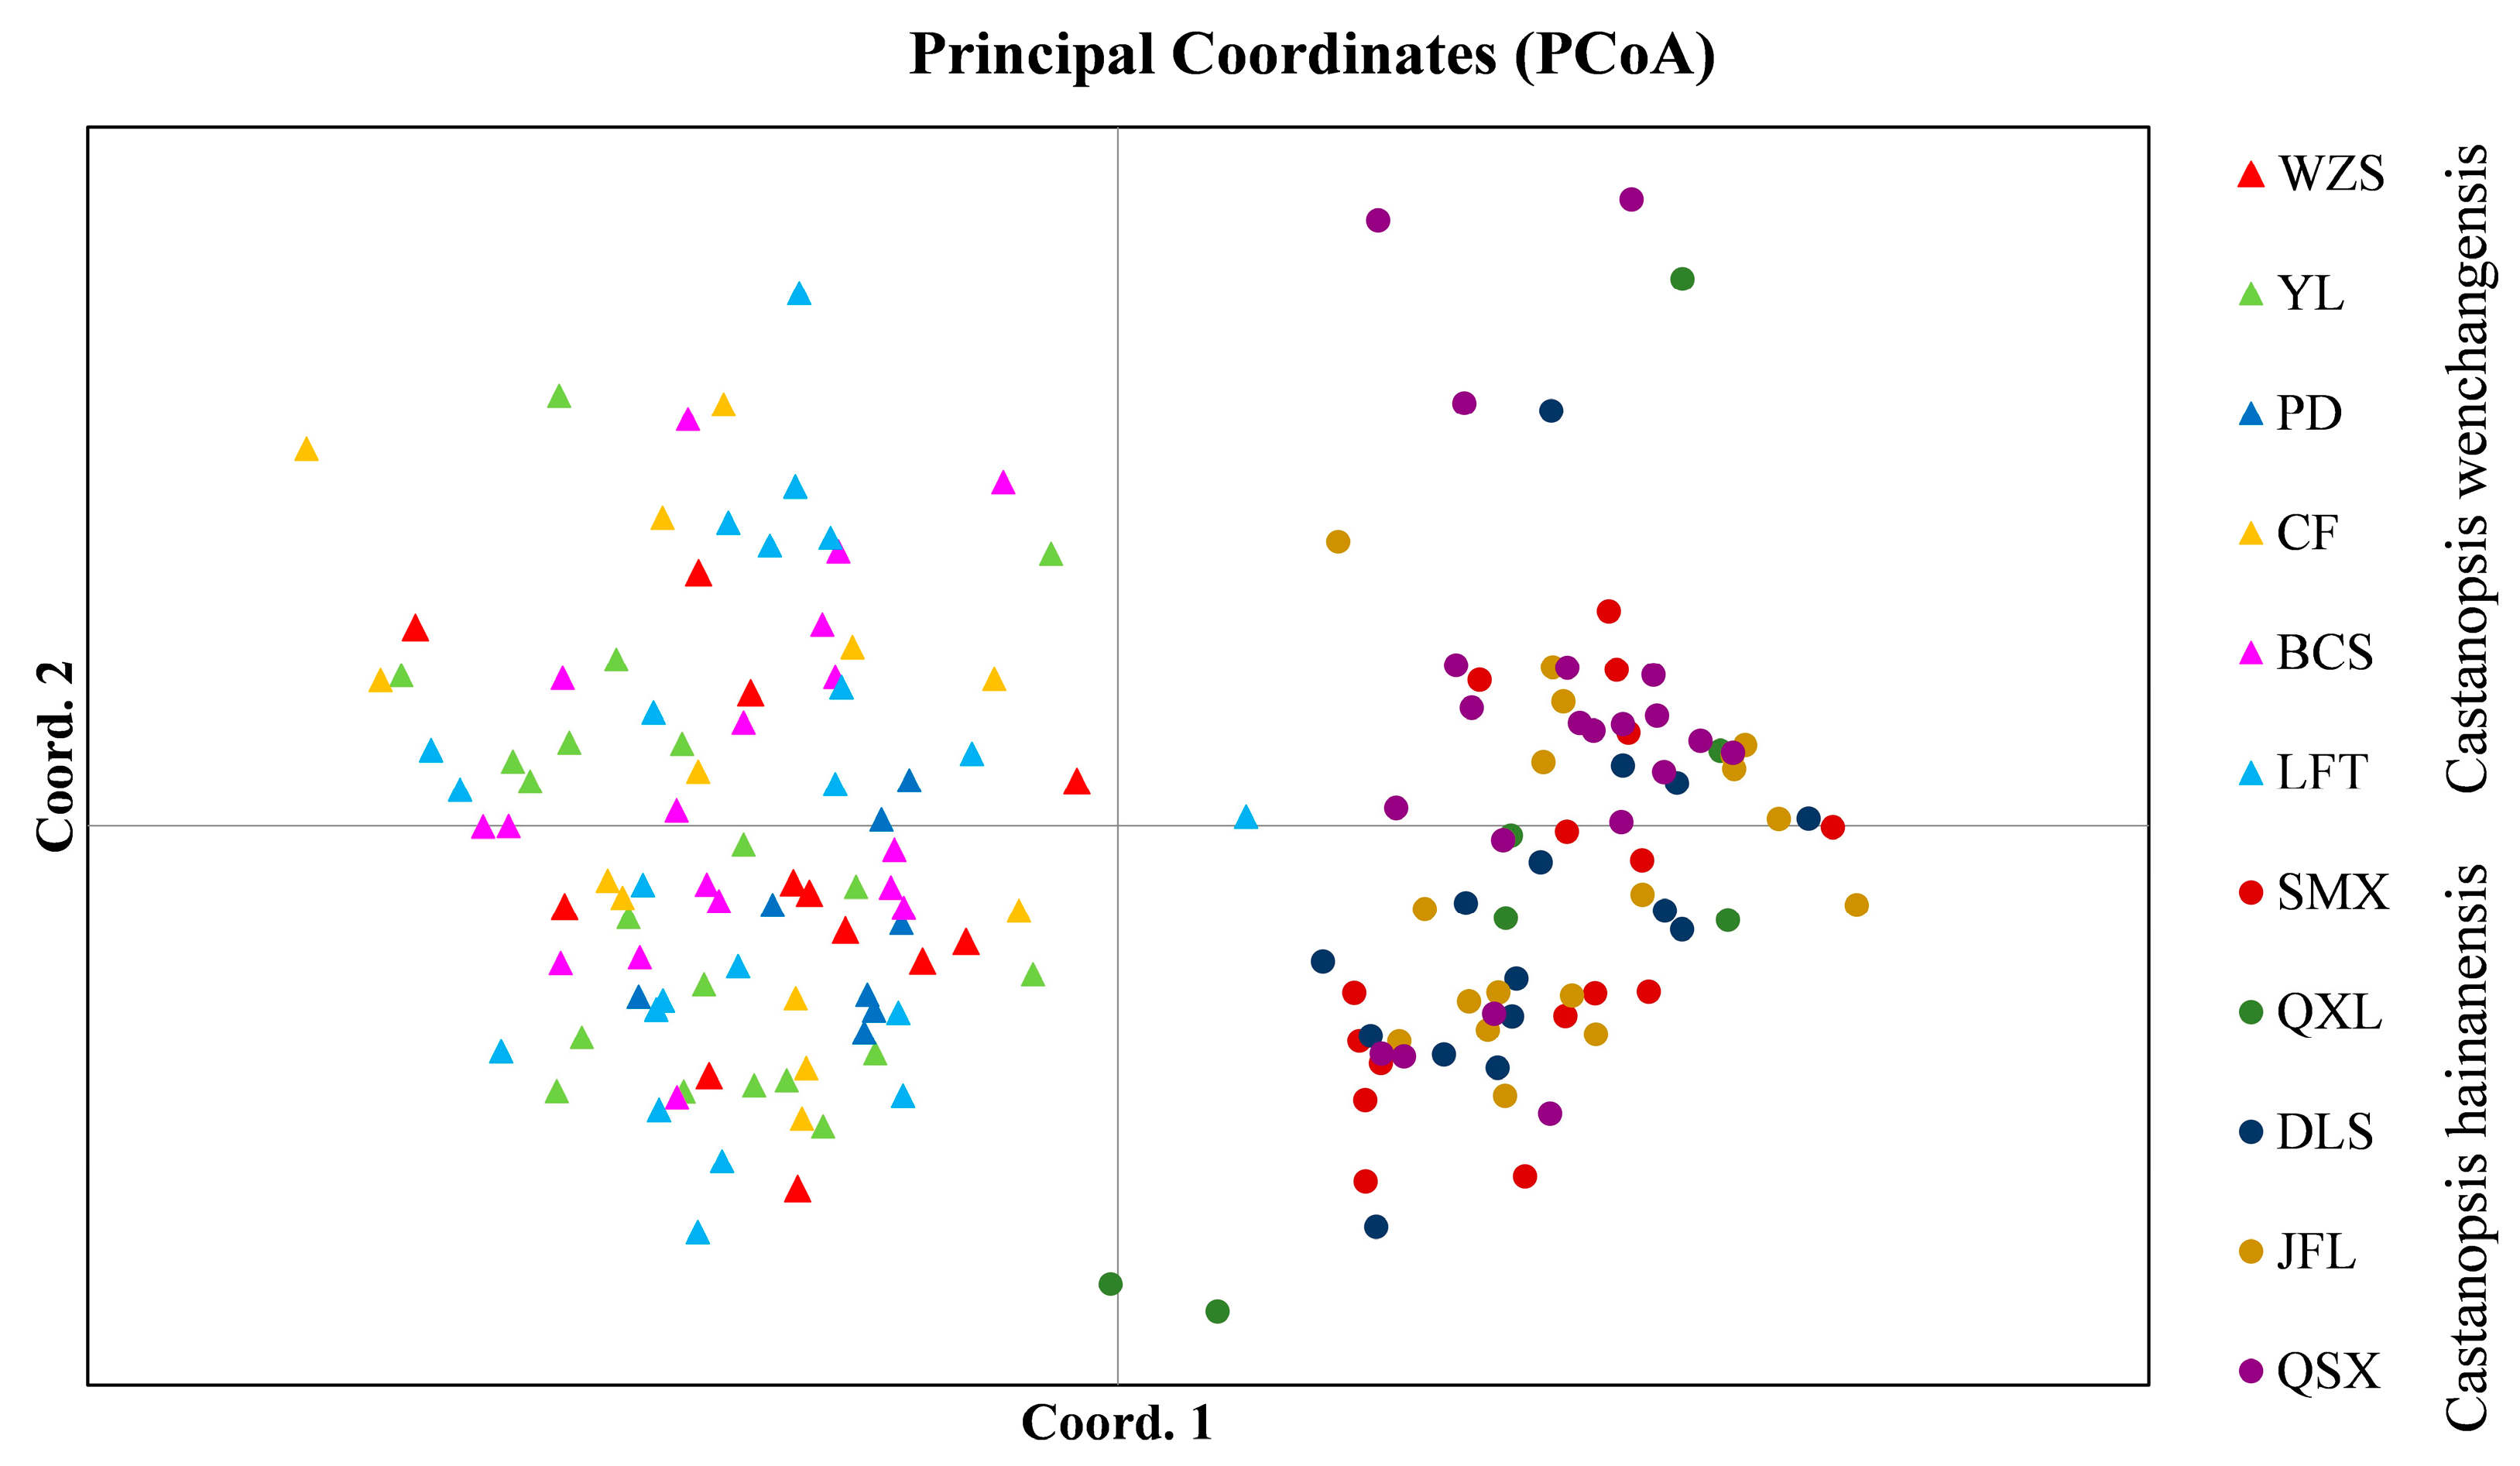
Genetic structure analysis of all samples revealed the optimal number of groups (K) was 2, indicating two genetic clusters that corresponded well to C. wenchangensis and C. hainanensis (Figure 1A). We made further genetic structure analyses for individuals of C. wenchangensis and C. hainanensis separately. There was no further population structure within both species; all individuals were equally admixed, as shown with K = 2, 3, and 4 (Figure 1B,C), suggesting each species was a single genetic cluster. The PCoA analysis showed the same results: the individuals of C. wenchangensis clearly separated from those of C. hainanensis, except for one sample in the LFT population (Figure 2). This individual should not be an introgressant since the two species have very limited gene admixture, as shown in Figure 1A. This is not a misnamed sample either, as the two species can be distinguished morphologically. The inconsistent results may be due to the different approach used, since PCoA is an ordination analysis based on similarity rather than a model-based clustering method.
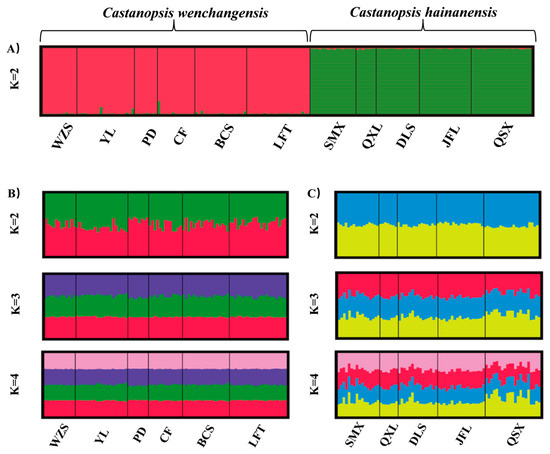
Figure 1.
Bayesian clustering plot for all samples based on 12 nSSRs (A). Individual proportions of the membership in C. wenchangensis are shown when two, three, or four clusters were defined by genetic structure analyses, respectively (B). Individual proportions of the membership in C. hainanensis are shown when two, three, or four clusters were defined by genetic structure analyses, respectively (C).
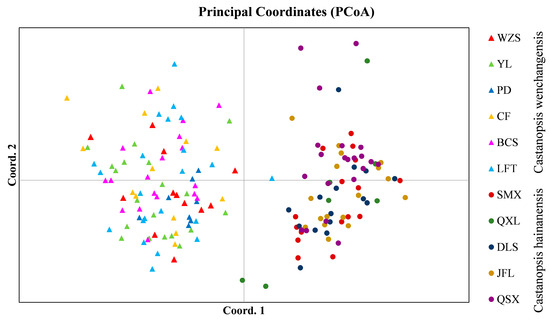
Figure 2.
PCoA analysis for all samples based on 12 nSSRs.
AMOVA analysis of all samples showed that 24.3% of molecular variation existed between species, 2.67% occurred among populations within species, and 73.04% happened within populations (Table 3). In each species, molecular variation mainly existed within populations. The FCT value was 0.24296, indicating a high degree of genetic differentiation between the two species.
Table 3.
AMOVA analyses based on 12 nSSRs.
2.2. Comparative Analysis of Chloroplast Genomes
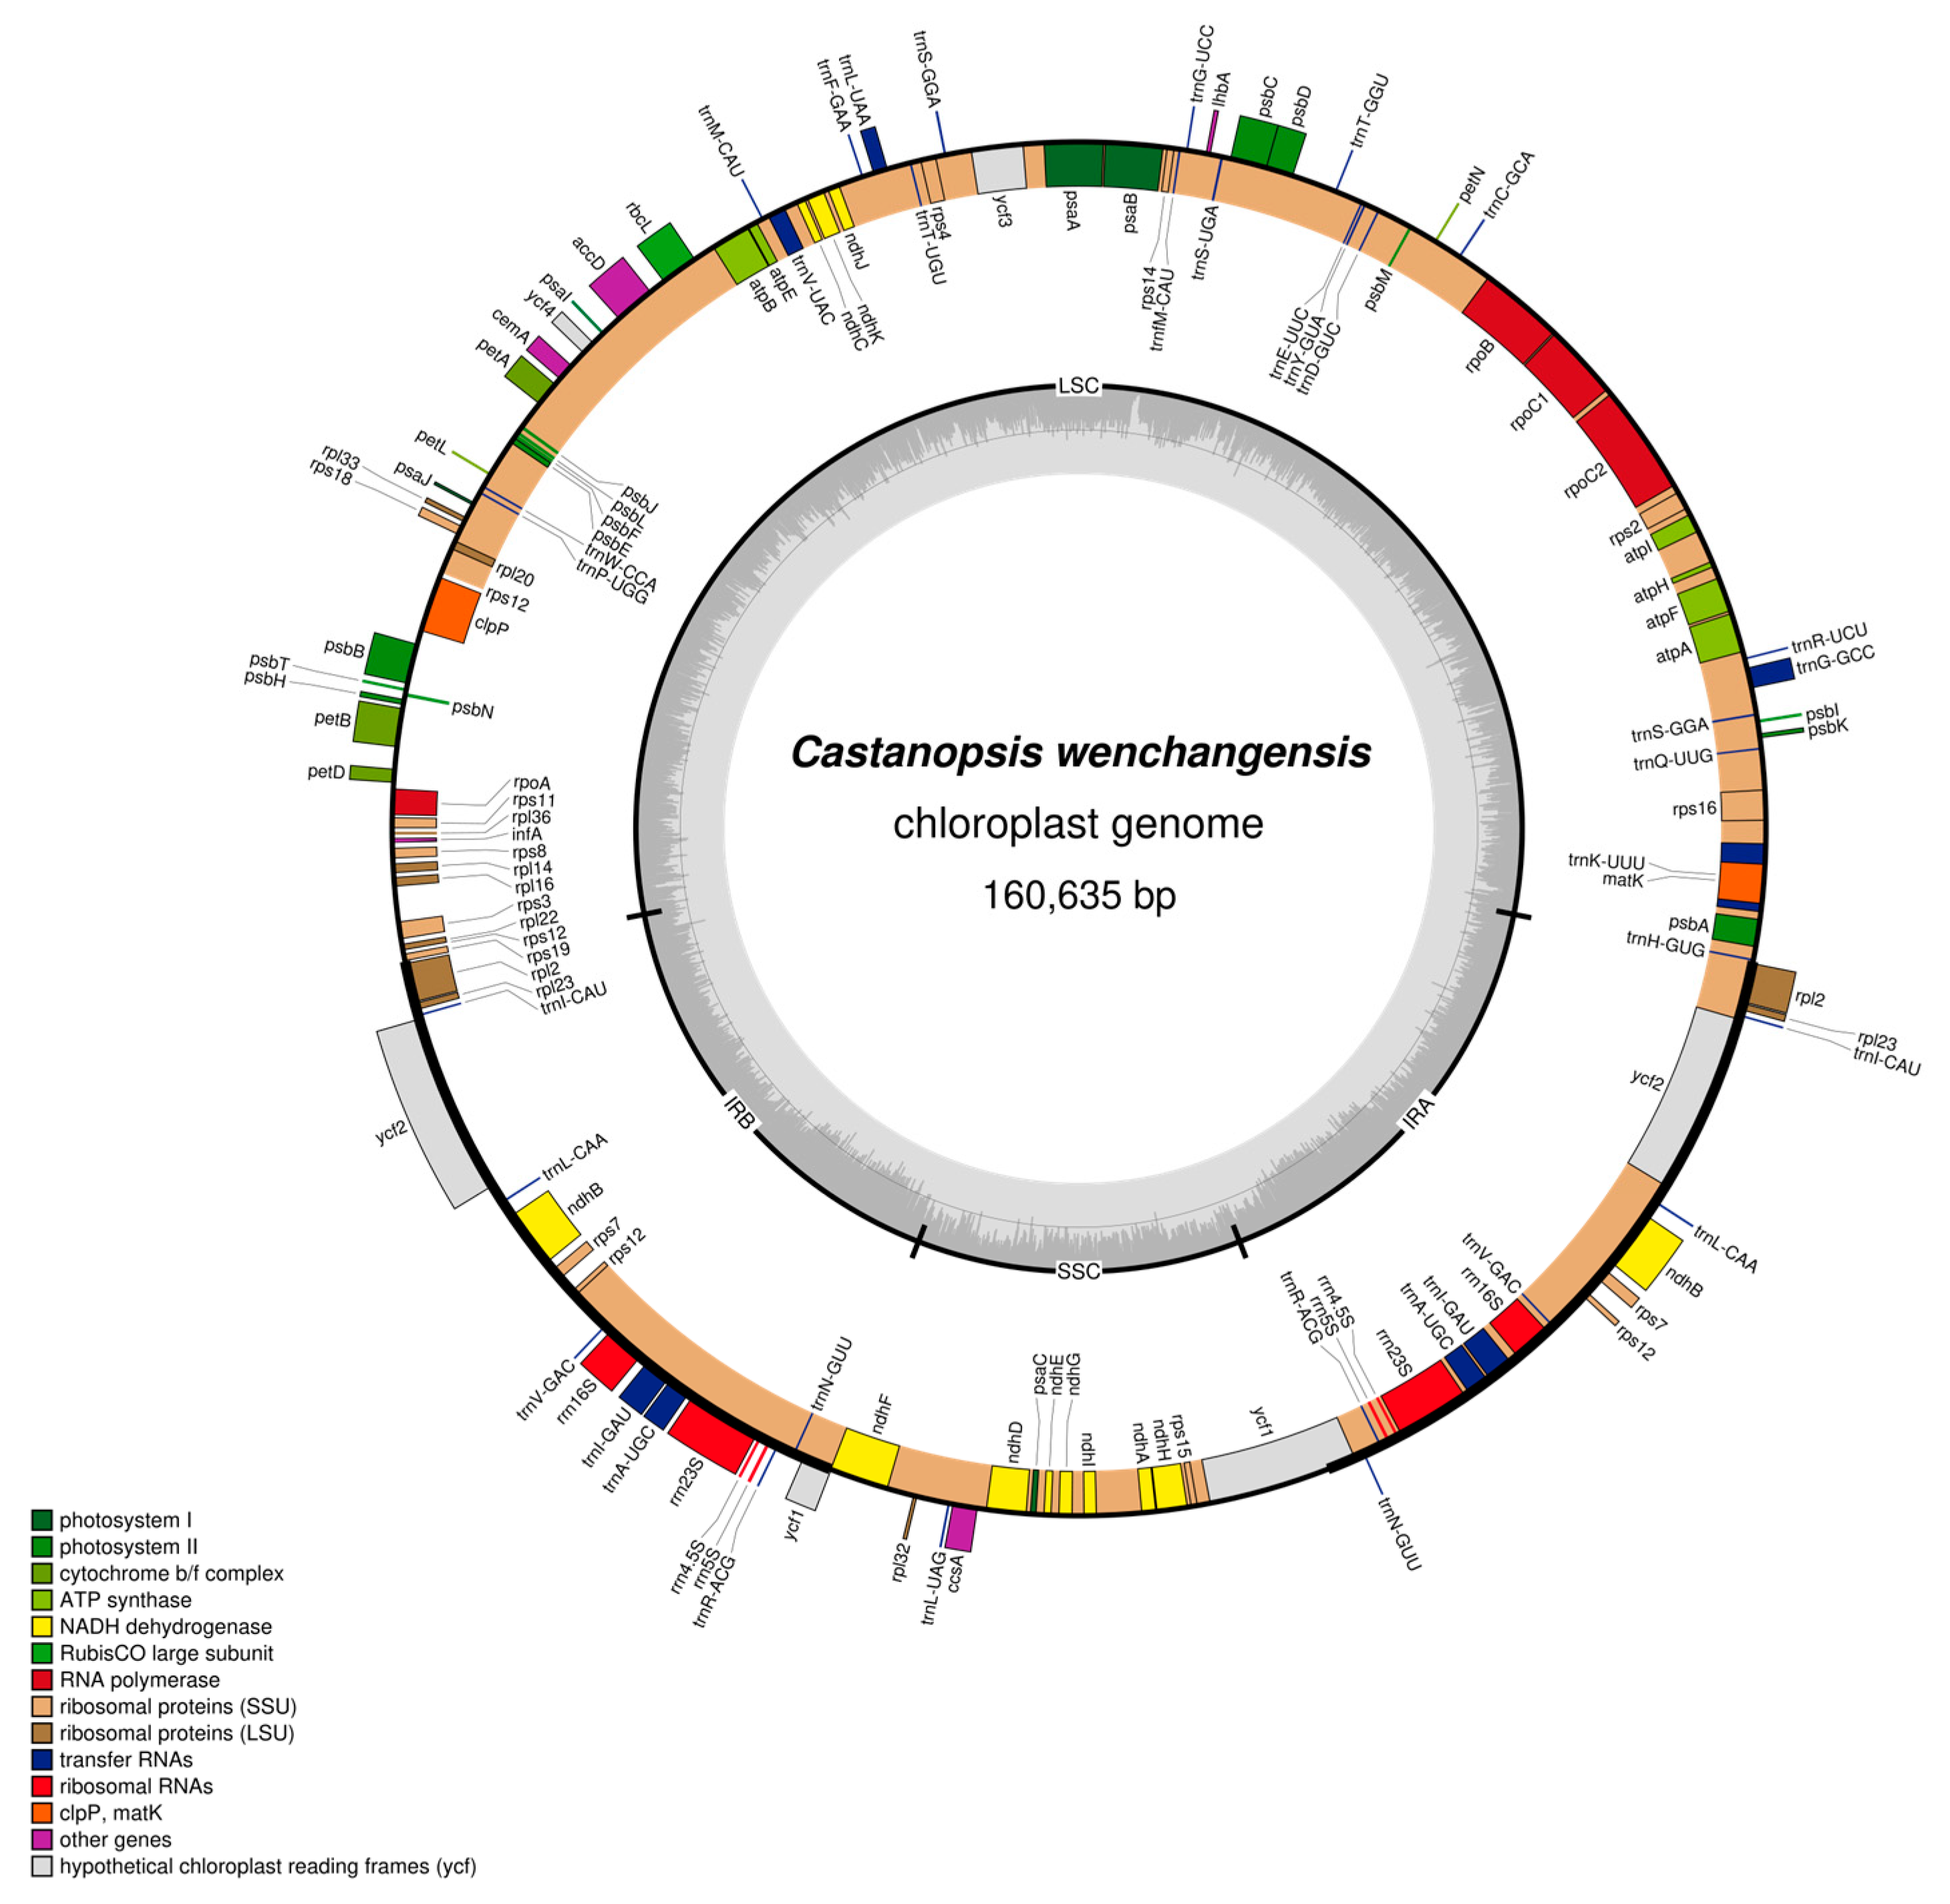
Both chloroplast genomes of C. hainanensis and C. wenchangensis showed a typical quadripartite structure that consisted of the large single copy (LSC) region, the small single copy (SSC) region, and a pair of inverted repeat (IR) regions (IRa and IRb) (Figure 3 and Figure 4). The difference in total chloroplast genome length between C. hainanensis and C. wenchangensis was 229 bp; however, the genome structure and gene composition were highly similar between the two species. The total length of the chloroplast genomes of C. hainanensis and C. wenchangensis was 160,406 and 160,635 bp, respectively (Table 4). The chloroplast genome of each species had a total of 130 chloroplast genes, including 8 rRNA, 37 tRNA, and 85 protein-coding genes. The total GC content was 36.8% for both species, with the highest GC content of 42.8% in the IR region. The GC content of the LSC and SSC regions was slightly different, with 34.7% and 31% in C. hainanensis, and 34.6% and 30.09% in C. wenchangensis.
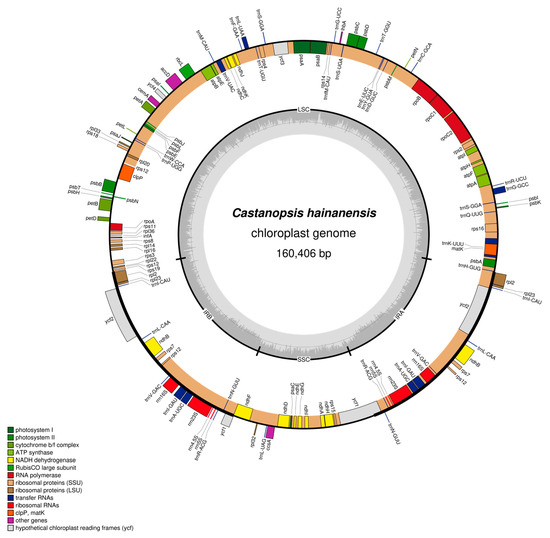
Figure 3.
Physical map of the chloroplast genome of C. hainanensis. Genes inside the circles are transcribed clockwise, and those outside the circles are transcribed counterclockwise. Genes belonging to different functional groups are color-coded. The darker gray in the inner circle corresponds to GC content, while the lighter gray corresponds to AT content.
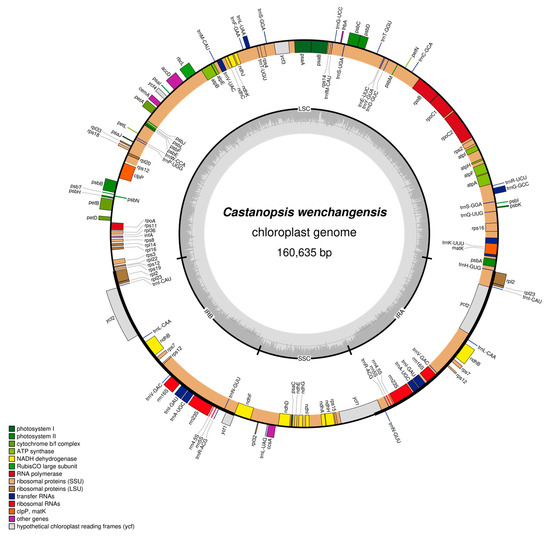
Figure 4.
Physical map of the chloroplast genome of C. wenchangensis. Genes inside the circles are transcribed clockwise, and those outside the circles are transcribed counterclockwise. Genes belonging to different functional groups are color-coded. The darker gray in the inner circle corresponds to GC content, while the lighter gray corresponds to AT content.
Table 4.
Characteristics of the chloroplast genomes of C. hainanensis and C. wenchangensis.
Genes on the four boundaries (LSC/IRb/SSC/IRa) were identical in C. wenchangensis and C. hainanensis (Figure 5). The ycf1 pseudogene straddled the JSB (IRb/SSC) boundary and showed different lengths in C. wenchangensis and C. hainanensis, with 1160 and 1151 bp, respectively. The ndhF gene was 2261 bp in C. wenchangensis and 2255 bp in C. hainanensis. The ycf1 gene spanned the JSA (SSC/IRa) boundary and had different lengths in C. wenchangensis and C. hainanensis, with 5684 and 5672 bp, respectively.
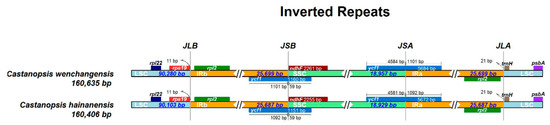
Figure 5.
The four boundaries of the chloroplast genomes of C. hainanensis and C. wenchangensis.
Four kinds of long repeats, including forward repeat, palindromic repeat, reverse repeat, and complement repeat, were detected in the chloroplast genomes of C. hainanensis and C. wenchangensis, but various types of repeats had different numbers in the two species. The chloroplast genome of C. hainanensis had 13 forward repeats, 11 palindromic repeats, 1 reverse repeat, and 1 complement repeat, while the chloroplast genome of C. wenchangensis possessed 22 forward repeats, 12 palindromic repeats, 3 reverse repeats, and 1 complement repeat.
3. Discussion
Nuclear SSR markers have been used to evaluate genetic differentiation among some species of the Fagaceae family, such as between Quercus aquifolioides and Q. spinosa (FCT = 0.26) [17], among Q. aliena, Q. dentata, and Q. variabilis (FCT = 0.21) [18], among Q. acutissima, Q. variabilis, and Q. chenii (FCT = 0.195) [19], and between Castanopsis sieboldii and C. cuspidate (FCT = 0.145) [20]. The genetic differences between different lineages within species have also been evaluated, but they are much lower than the genetic differentiation between species, as revealed by groups within Q. aquifolioides (FCT = 0.04), Q. spinose (FCT = 0.09), C. sieboldii (FCT = 0.014), and C. cuspidata (FCT = 0.095) [17,20]. In this study, we detect high and significant genetic differentiation between C. wenchangensis and C. hainanensis (FCT = 0.243 in AMOVA analysis) based on allelic frequencies of nuclear SSRs, suggesting they are distinct species despite highly morphological similarities. Both the genetic structure and PCoA analyses reveal two distinct clusters, which correspond well to C. wenchangensis and C. hainanensis. The genetic structure analyses revealed only minimal admixture between the two gene pools, which may explain significant genetic differentiation between C. wenchangensis and C. hainanensis and imply their independent evolutionary histories. The demographically independent units characterized by restricted gene flow should be delimited as management units for biodiversity conservation [6,7,21]. So, distinguishing C. wenchangensis from C. hainanensis is of great significance for safeguarding genetic diversity. The distribution range of C. hainanensis and C. wenchangensis does not overlap. C. hainanensis is distributed in the central and southern parts of Hainan Island, while C. wenchangensis is restricted to a coastal area of northeastern Hainan Island. The habitat of C. hainanensis is mountainous red and loess soil, while C. wenchangensis occurs in coastal sandy soil. The independent genetic units, very limited genetic admixture, different distribution ranges, and distinct habitats further enhance the recognition of two independent species [5].
Consistent with this conclusion, we discover that the chloroplast genomes of C. wenchangensis and C. hainanensis are very different. Although the overall structure of the chloroplast genome is highly conserved, appreciable differences exist between C. wenchangensis and C. hainanensis. For example, different numbers of forward, palindromic, and reverse repeats are detected in the two chloroplast genomes, and the lengths of ndhF and ycf1 genes are not the same in the two species. The total length difference between the chloroplast genomes of C. wenchangensis and C. hainanensis is 229 bp. In a previous study, the difference in chloroplast genome length between Fagaceae species can reach 1336 bp, but the length difference between the two species in Castanopsis (C. echidnocarpa and C. concinna) was only 41 bp [22]. The considerable differences that exist in the chloroplast genomes between C. wenchangensis and C. hainanensis lead us to believe that they are two different species [23].
The higher the genetic diversity of a species, the greater its evolutionary potential and ability to adapt to the environment. Such species have a higher probability of long-term survival when environmental conditions change [24]. In this study, the nuclear SSR genetic diversity revealed in C. hainanensis (A = 3.467, AR = 3.062, HO = 0.450, He = 0.454) is slightly higher than that in C. wenchangensis (A = 3.042, AR = 2.626, HO = 0.424, He = 0.416), suggesting that the two species have similar potential for adapting to environmental changes. Compared with other species in the genus Castanopsis such as C. acuminatissima (A = 10.8, He = 0.716) [25] and C. sieboldii (A = 5.226, He = 0.574) [26], the genetic diversity levels of C. hainanensis and C. wenchangensis are relatively low, which may be due to the small geographic range of the two species [27]. This is consistent with the previous results that rare plant species often show a lower level of genetic diversity than widespread congeners [28,29]. This also means that the conservation of the two species needs to be strengthened. Both C. hainanensis and C. wenchangensis are endemic to Hainan Island, but they have different habitats, indicating that they have precious gene resources and underlying ecological adaptations that are worth investigating more in depth. It is interesting to find that C. hainanensis exhibits a high degree of genetic uniformity rather than highly structured isolated populations, although it has a wider distribution than C. wenchangensis. AMOVA analysis reveals only negligible genetic differences among populations within each species (FST = 0.04 in C. hainanensis and FST = 0.05 in C. wenchangensis). Furthermore, in terms of how genetic variation is partitioned within and among populations, there does not appear to be a difference between C. hainanensis and C. wenchangensis; both show higher genetic diversity within populations and lower genetic diversity among populations, which is in accordance with the general patterns of genetic diversity in tree species [27,30] and strengthens our view that C. hainanensis and C. wenchangensis are independent species.
4. Materials and Methods
4.1. Sampling and DNA Extraction
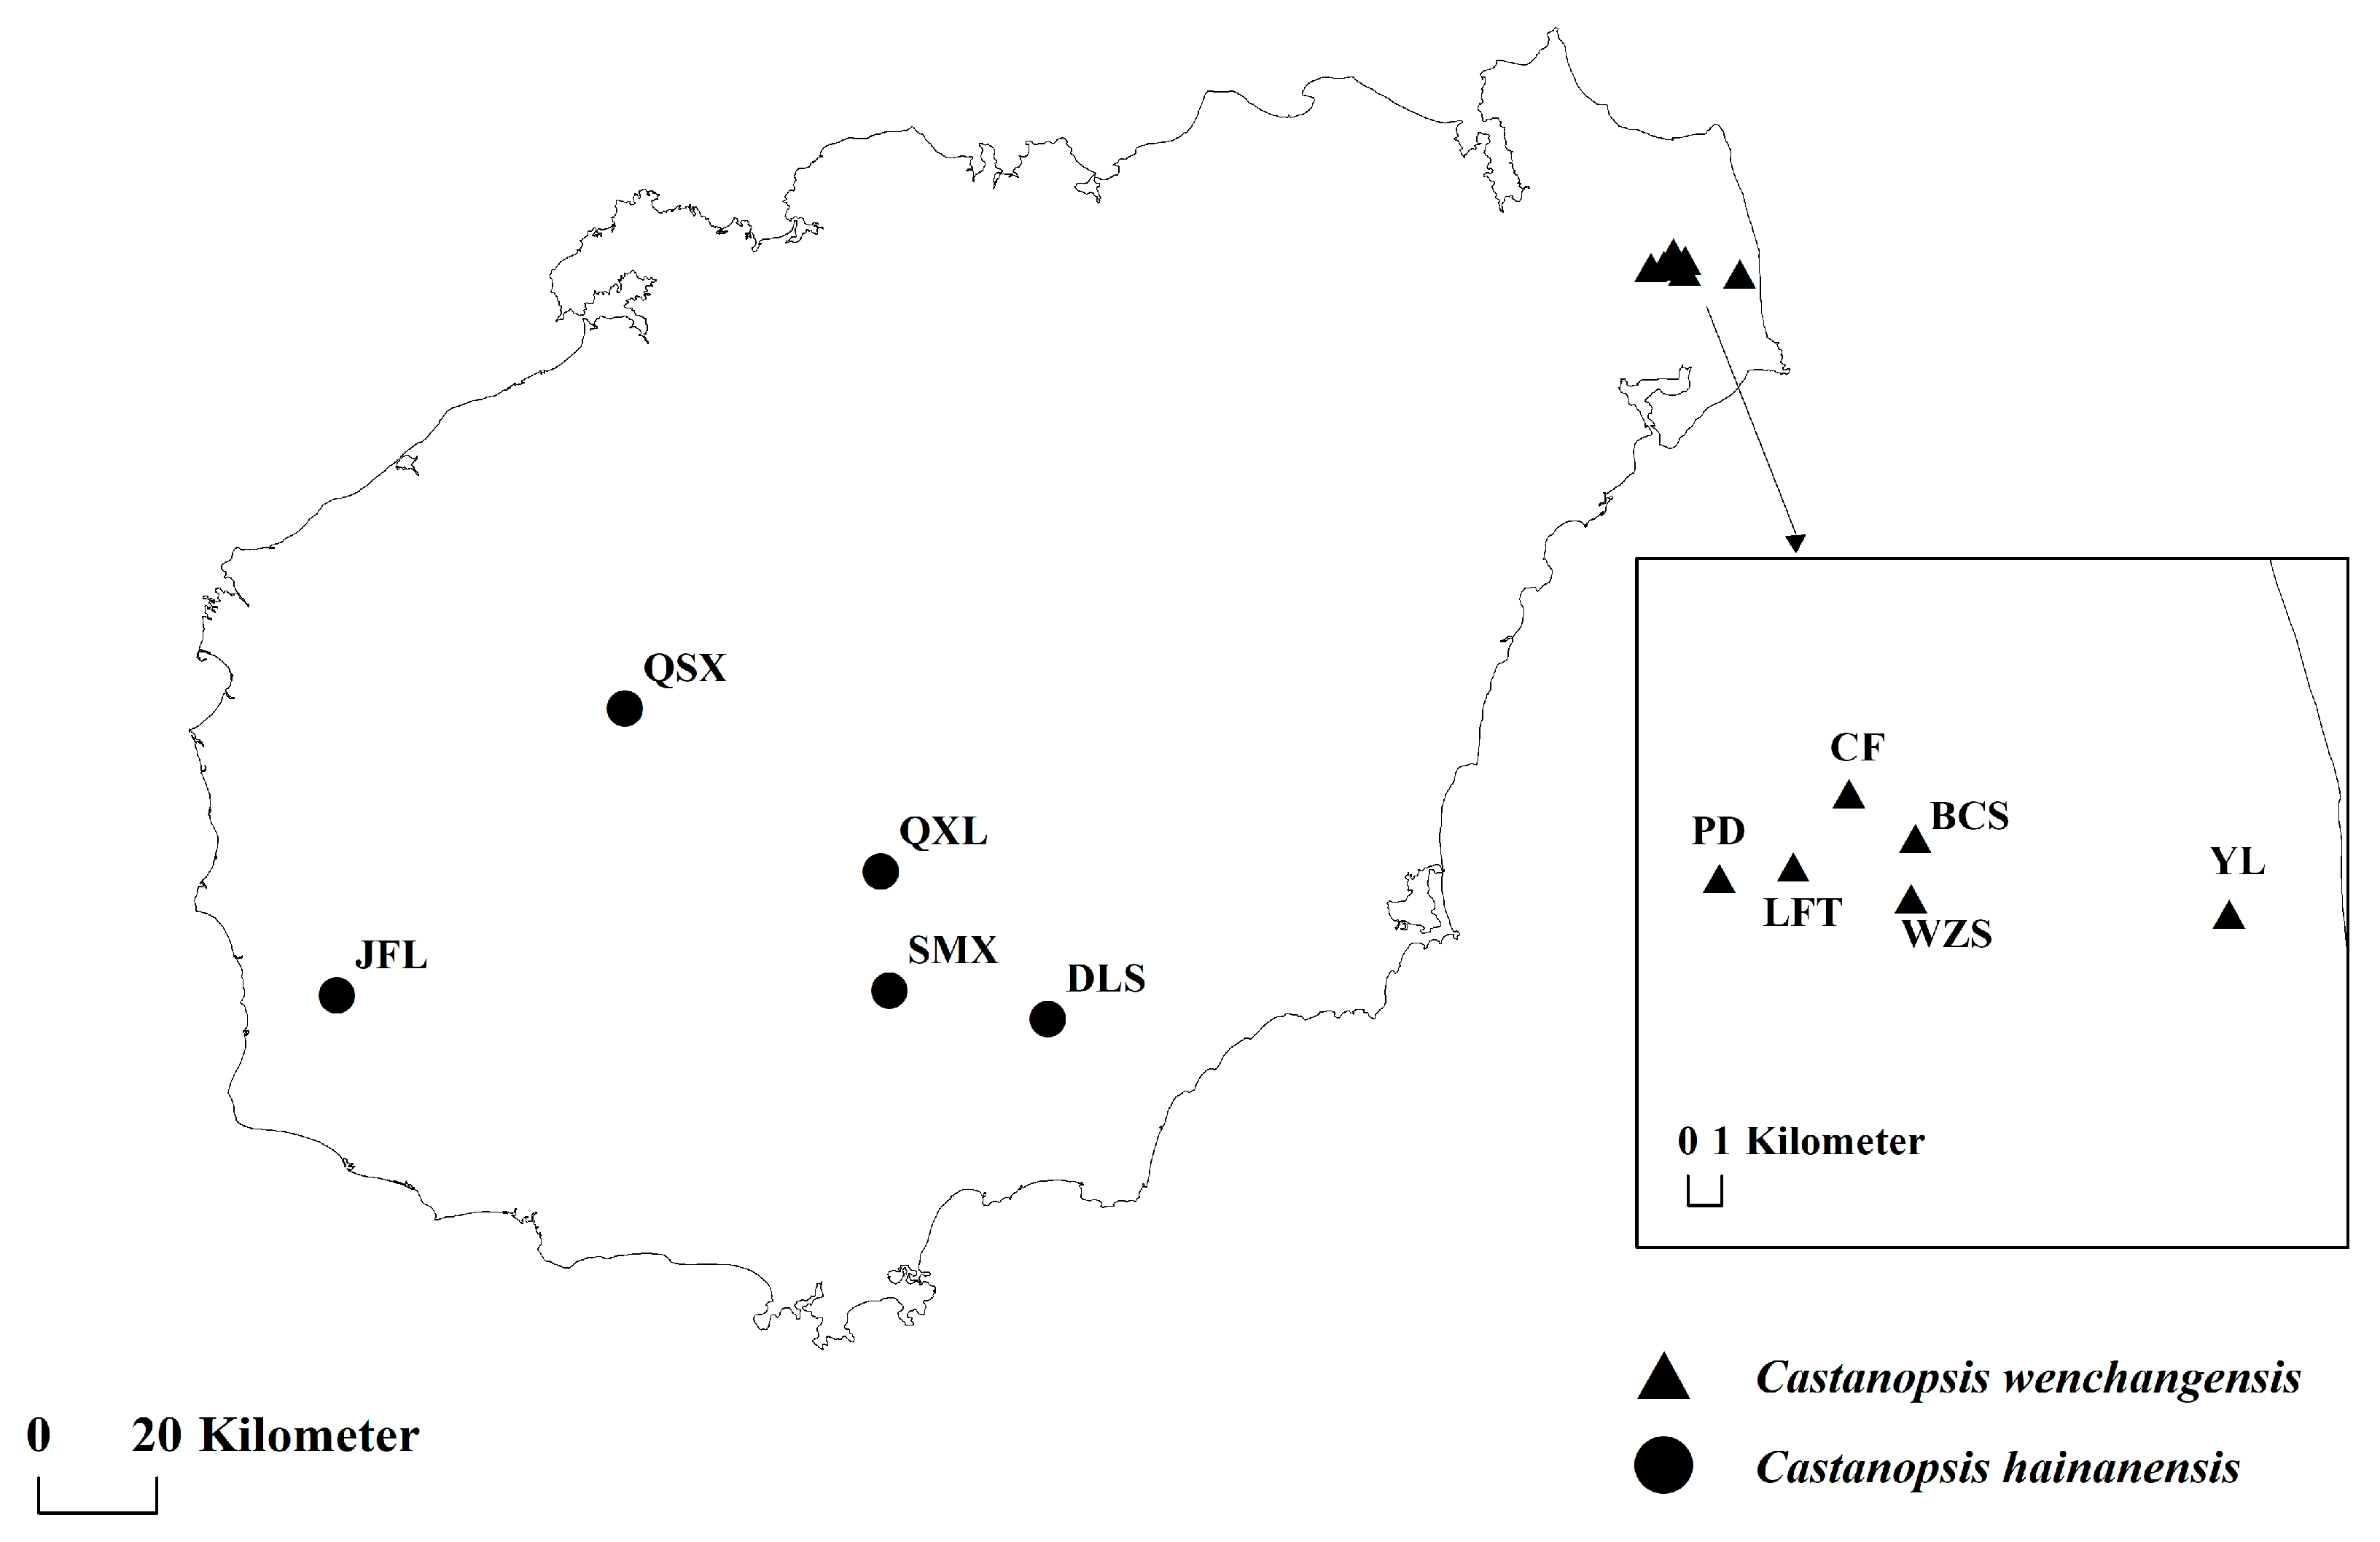
A total of 170 individuals from 11 natural populations of C. hainanensis and C. wenchangensis were collected on Hainan Island (Figure 6; Table 5). Sampling individuals were kept at least 20 m apart to avoid close relatives. Fresh leaves were collected and immediately dried with silica gel. Genomic DNA was extracted from the silica gel-dried leaves using the Tiangen Plant Genomic DNA Extraction Kit (DP320) according to the instructions of the manufacturer. DNA quality was determined by 1.00% (w/v) agarose gel.
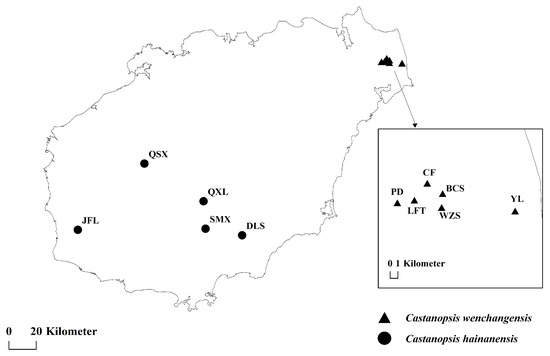
Figure 6.
Sampling locations of C. wenchangensis and C. hainanensis.
Table 5.
Sampling locations and sizes of 11 populations of C. wenchangensis and C. hainanensis.
4.2. Nuclear SSR Genotyping and Genetic Structure Analysis
A total of 16 primer pairs of nuclear SSRs (Table 6) were screened from those reported in Castanopsis and Castanea species [31,32,33]. Quadruple fluorescent polymerase chain reaction (PCR) was amplified using the Type-it microsatellite PCR kit (QIAGEN, Hilden, Germany). PCR was performed in a mixture including 20 ng of genomic DNA, 1× PCR Master Mix, 1× Q-Solution, and 10 μM of each primer (forward and reverse). The forward primers were labeled with different fluorescent dyes. The PCR program was set as follows: 95 °C for 5 min, followed by 28 cycles of 95 °C for 30 s, 57 °C for 90 s, and 72 °C for 30 s, and a final extension at 60 °C for 30 min. The PCR products were separated by capillary electrophoresis with the ABI-3730XL fluorescence sequencer (Applied Biosystems, Foster City, CA, USA), using LIZ500 as the internal standard. Alleles were scored using Genemarker2.2.0 [34].
Table 6.
The 16 nuclear SSR primer pairs used in this study.
FSTAT 2.9.4 [35] and GeneALEx 6.5 [36] were used to calculate the number of alleles (A) observed, allelic richness (AR), observed heterozygosity (HO), expected heterozygosity (He), genetic diversity within populations (HS), total genetic diversity (HT), inbreeding coefficient (FIS), and genetic differentiation among populations (GST, FST, and RST). Deviations from the Hardy–Weinberg equilibrium (HWE) were tested with 1000 permutations, and nSSRs deviating from HWE were excluded from further analysis.
Population genetic structure analysis was performed using STRUCTURE 2.3.4 [37]. The length of the burn-in period was set to 1,000,000, and MCMC replications after the burn-in were set to 500,000. Numbers of assumed clusters (K) were assessed by performing 10 independent runs for each K value from 1 to 11. The optimal K value was selected according to the Evanno method using STRUCTURE HARVESTER [38]. The 10 runs of structure analysis were averaged using CLUMPP1.1.2 [39], and the results were graphically represented using Distruct 1.1 [40]. Principal coordinate analysis (PCoA) was performed to detect genetic distance among populations using GeneALEx 6.5 [36]. Analysis of molecular variance (AMOVA) was performed using ARLEQUIN v3.5 [41] to determine the proportion of genetic variation partitioned at the species, population, and intrapopulation levels.
4.3. Comparative Analysis of Chloroplast Genomes
Whole genome resequencing was performed for one sample of C. wenchangensis and C. hainanensis each. DNA library construction and Illumina paired-end sequencing were conducted by Nextomics Biosciences (Wuhan). The chloroplast genome was assembled using the software GetOrganelle 1.7.5.3 [16], and the parameters were adjusted appropriately to obtain the complete cyclic structure. The chloroplast genome was imported into the NCBI database for comparison and selection of the most suitable reference genome. Protein-coding genes, tRNAs, and rRNAs were annotated using the online software CPGAVAS2 [42]. Geneious v9.0.2 [43] was used to manually correct and complement problematic annotations. Finally, the resulting annotation files were used to generate a physical map of the chloroplast genome using OGDRAW [44].
The junction sites of the chloroplast genome were visualized with the online program IRscope (https://ir-scope.shinyapps.io/irapp/ (accessed on 17 October 2022)) [45]. Long repeats, including forward, reverse, palindrome, and complementary repeats, in chloroplast genomes were identified using REPuter (http://bibiserv.techfak.uni-bielefeld.de/reputer/ (accessed on 29 October 2022)) [46]. The parameters were set at a minimal repeat size of 30 bp and a Hamming distance of 3.
5. Conclusions
C. hainanensis and C. wenchangensis are endemic to Hainan Island; the former is distributed in the mountainous regions of the central and southern parts of Hainan Island, while the latter is restricted to the coastal lowlands of Wenchang City. They were once confused as the same species due to their very similar morphologies. Furthermore, C. wenchangensis has been wrongly identified because its description in FRPS is not the same as the original publication. Correctly identifying C. hainanensis and C. wenchangensis and determining their genetic diversity and genetic relationships is of great significance for the conservation and sustainable utilization of these two species.
In this study, we use nuclear microsatellite markers and comparative chloroplast genomes to determine the delimitation between C. hainanensis and C. wenchangensis. Based on the nuclear microsatellite variations, we demonstrate that C. hainanensis and C. wenchangensis are distinct clusters that are highly genetically differentiated with very limited genetic admixture; both showed higher genetic diversity within populations and lower genetic diversity among populations, and neither has further population genetic structure. Furthermore, this work allows us to distinguish the two species based on their chloroplast genomes. The independent genetic units, extremely limited genetic admixture, different distribution ranges, and distinct habitats make us believe that C. wenchangensis and C. hainanensis are independent species, thus they should be treated as different conservation units.
Author Contributions
Conceptualization, X.W. and Y.S.; methodology, X.C., Y.F., S.C. and Y.S.; software, X.C., Y.F., S.C. and Y.S.; validation, X.C., Y.F., S.C., K.Y. and Y.S.; formal analysis, X.C., Y.F., S.C. and Y.S.; investigation, X.C., Y.F., S.C., K.Y. and Y.S.; resources, Y.F., S.C., K.Y., X.W. and Y.S.; data curation, Y.F. and X.C.; writing—original draft preparation, X.C.; writing—review and editing, X.C., X.W. and Y.S.; visualization, X.C. and Y.S.; supervision, X.W. and Y.S.; project administration, Y.S.; funding acquisition, Y.S. All authors have read and agreed to the published version of the manuscript.
Funding
This research was funded by the Special Fund for Talents of South China Agricultural University.
Data Availability Statement
The chloroplast genome sequences are deposited in the GenBank, accession numbers: OR543091, OR545365.
Acknowledgments
The authors would like to thank Li Chen for the helpful discussion.
Conflicts of Interest
The authors declare no conflict of interest.
References
- Liu, J.; Zhou, W.; Gong, X. Species Delimitation, Genetic Diversity and Population Historical Dynamics of Cycas Diannanensis (Cycadaceae) Occurring Sympatrically in the Red River Region of China. Front. Plant Sci. 2015, 6, 696. [Google Scholar] [CrossRef]
- De Queiroz, K. Species Concepts and Species Delimitation. Syst. Biol. 2007, 56, 879–886. [Google Scholar] [CrossRef] [PubMed]
- Wilkins, J. Species: A History of the Idea; Doak, D., Ed.; University of California Press: Berkley, CA, USA, 2009; ISBN 978-0-520-26085-6. [Google Scholar]
- Daïnou, K.; Mahy, G.; Duminil, J.; Dick, C.W.; Doucet, J.-L.; Donkpégan, A.S.L.; Pluijgers, M.; Sinsin, B.; Lejeune, P.; Hardy, O.J. Speciation Slowing down in Widespread and Long-Living Tree Taxa: Insights from the Tropical Timber Tree Genus Milicia (Moraceae). Heredity 2014, 113, 74–85. [Google Scholar] [CrossRef] [PubMed]
- Zheng, H.L.; Fan, L.Q.; Milne, R.I.; Zhang, L.; Wang, Y.L.; Mao, K.S. Species Delimitation and Lineage Separation History of a Species Complex of Aspens in China. Front. Plant Sci. 2017, 8, 375. [Google Scholar] [CrossRef]
- Palsbøll, P.J.; Bérubé, M.; Allendorf, F.W. Identification of Management Units Using Population Genetic Data. Trends Ecol. Evol. 2007, 22, 11–16. [Google Scholar] [CrossRef] [PubMed]
- Coates, D.J.; Byrne, M.; Moritz, C. Genetic Diversity and Conservation Units: Dealing with the Species-Population Continuum in the Age of Genomics. Front. Ecol. Evol. 2018, 6, 165. [Google Scholar] [CrossRef]
- Chen, X.M.; Yu, B.P. A Review of the Genus of Castanopsis in Guangdong and Hainan. J. South. China Agric. Univ. 1991, 2, 87–95. [Google Scholar]
- Huang, C.J.; Chang, Y.T.; Bruce, B. Fagaceae. In Flora of China; Wu, Z.Y., Raven, P.H., Hong, D.Y., Eds.; Science Press and Missouri Botanical Garden Press: Beijing, China, 1999; pp. 315–333. ISBN 7030075730. [Google Scholar]
- Chen, L.; Li, X.W.; Li, J.Q. Taxonomic notes on Castanopsis (Fagaceae, Castaneoideae) from China. Phytotaxa 2013, 146, 50–60. [Google Scholar] [CrossRef]
- Fu, G.A.; Huang, C.C. A new species of Castanopsis Bl. from Hainan. Acta Phytotaxon. Sin. 1989, 2, 151–152. [Google Scholar]
- Huang, C.J.; Chang, Y.T. Castanopsis. In Flora Reipublicae Popularis Sinicae; Chen, H.Y., Huang, C.J., Eds.; Science Press: Beijing, China, 1998; pp. 13–80. ISBN 703006108X. [Google Scholar]
- Balloux, F.; Lugon-Moulin, N. The Estimation of Population Differentiation with Microsatellite Markers. Mol. Ecol. 2002, 11, 155–165. [Google Scholar] [CrossRef]
- Rossiter, S.J.; Benda, P.; Dietz, C.; Zhang, S.; Jones, G. Rangewide Phylogeography in the Greater Horseshoe Bat Inferred from Microsatellites: Implications for Population History, Taxonomy and Conservation. Mol. Ecol. 2007, 16, 4699–4714. [Google Scholar] [CrossRef] [PubMed]
- Daniell, H.; Lin, C.S.; Yu, M.; Chang, W.J. Chloroplast Genomes: Diversity, Evolution, and Applications in Genetic Engineering. Genome Biol. 2016, 17, 134. [Google Scholar] [CrossRef]
- Jin, J.J.; Yu, W.B.; Yang, J.B.; Song, Y.; dePamphilis, C.W.; Yi, T.S.; Li, D.Z. GetOrganelle: A fast and versatile toolkit for accurate de novo assembly of organelle genomes. Genome Biol. 2020, 21, 241. [Google Scholar] [CrossRef] [PubMed]
- Liu, K.; Qi, M.; Du, F.K. Population and Landscape Genetics Provide Insights into Species Conservation of Two Evergreen Oaks in Qinghai–Tibet Plateau and Adjacent Regions. Front. Plant Sci. 2022, 13, 858526. [Google Scholar] [CrossRef] [PubMed]
- Lyu, J.; Song, J.; Liu, Y.; Wang, Y.; Li, J.; Du, F.K. Species Boundaries Between Three Sympatric Oak Species: Quercus Aliena, Q. Dentata, and Q. Variabilis at the Northern Edge of Their Distribution in China. Front. Plant Sci. 2018, 9, 414. [Google Scholar] [CrossRef] [PubMed]
- Chen, X.-D.; Zhang, X.; Zhang, H.; Zhou, T.; Zhao, Y.-M.; Yang, J.; Zhao, G.-F. Genetic Differentiation and Demographic History of Three Cerris Oak Species in China Based on Nuclear Microsatellite Makers. Forests 2021, 12, 1164. [Google Scholar] [CrossRef]
- Aoki, K.; Ueno, S.; Kamijo, T.; Setoguchi, H.; Murakami, N.; Kato, M.; Tsumura, Y. Genetic Differentiation and Genetic Diversity of Castanopsis (Fagaceae), the Dominant Tree Species in Japanese Broadleaved Evergreen Forests, Revealed by Analysis of EST-Associated Microsatellites. PLoS ONE 2014, 9, e87429. [Google Scholar] [CrossRef]
- Funk, W.C.; McKay, J.K.; Hohenlohe, P.A.; Allendorf, F.W. Harnessing Genomics for Delineating Conservation Units. Trends Ecol. Evol. 2012, 27, 489–496. [Google Scholar] [CrossRef]
- Zhang, Y.T.; Huang, J.; Song, J.; Lin, L.M.; Feng, R.X.; Xing, Z.B. Structure and Variation Analysis of Chloroplast Genomes in Fagaceae. Bull. Bot. Res. 2018, 38, 757–765. [Google Scholar]
- Yu, S.; Dong, W.P.; Liu, B.; Xu, C.; Yao, X.; Gao, J.; Corlett, R.T. Comparative Analysis of Complete Chloroplast Genome Sequences of Two Tropical Trees Machilus Yunnanensis and Machilus Balansae in the Family Lauraceae. Front. Plant Sci. 2015, 6, 662. [Google Scholar] [CrossRef]
- Frankham, R.; Ballou, J.D.; Briscoe, D.A.; McInnes, K.H. Introduction to Conservation Genetics; Cambridge University Press: Cambridge, UK, 2002. [Google Scholar] [CrossRef]
- Blakesley, D.; Pakkad, G.; James, C.; Torre, F.; Elliott, S. Genetic Diversity of Castanopsis Acuminatissima (Bl.) A. DC. in Northern Thailand and the Selection of Seed Trees for Forest Restoration. New For. 2004, 27, 89–100. [Google Scholar] [CrossRef]
- Aoki, K.; Tamaki, I.; Nakao, K.; Ueno, S.; Kamijo, T.; Setoguchi, H.; Murakami, N.; Kato, M.; Tsumura, Y. Approximate Bayesian Computation Analysis of EST-Associated Microsatellites Indicates That the Broadleaved Evergreen Tree Castanopsis Sieboldii Survived the Last Glacial Maximum in Multiple Refugia in Japan. Heredity 2019, 122, 326–340. [Google Scholar] [CrossRef] [PubMed]
- Hamrick, J.L.; Godt, M.J.W.; Sherman-Broyles, S.L. Factors Influencing Levels of Genetic Diversity in Woody Plant Species. New For. 1992, 6, 95–124. [Google Scholar] [CrossRef]
- Gitzendanner, M.A.; Soltis, P.S. Patterns of Genetic Variation in Rare and Widespread Plant Congeners. Am. J. Bot. 2000, 87, 783–792. [Google Scholar] [CrossRef]
- Furches, M.S.; Small, R.L.; Furches, A. Genetic Diversity in Three Endangered Pitcher Plant Species (Sarracenia; Sarraceniaceae) Is Lower than Widespread Congeners. Am. J. Bot. 2013, 100, 2092–2101. [Google Scholar] [CrossRef] [PubMed]
- Moran, G.F. Patterns of Genetic Diversity in Australian Tree Species. In Population Genetics of Forest Trees, Proceedings of the International Symposium on Population Genetics of Forest Trees, Corvallis, OR, USA, 31 July–2 August 1990; Adams, W.T., Strauss, S.H., Copes, D.L., Griffin, A.R., Eds.; Springer: Dordrecht, The Netherlands, 1992; pp. 49–66. ISBN 978-94-011-2815-5. [Google Scholar]
- Shi, Y.-S.; Zhang, J.; Jiang, K.; Cui, M.-Y.; Li, Y.-Y. Development and Characterization of Polymorphic Microsatellite Markers in Castanopsis Sclerophylla (Fagaceae). Am. J. Bot. 2011, 98, e19–e21. [Google Scholar] [CrossRef]
- Li, C.; Sun, Y.; Huang, H.W.; Cannon, C.H. Footprints of Divergent Selection in Natural Populations of Castanopsis Fargesii (Fagaceae). Heredity 2014, 113, 533–541. [Google Scholar] [CrossRef]
- Ye, L.J.; Wang, J.; Sun, P.; Dong, S.P.; Zhang, Z.Y. The Transferability of Nuclear Microsatellite Markers in Four Castanopsis Species to Castanopsis tibetana (Fagaceae). Plant Divers. Resour. 2014, 36, 443–448. [Google Scholar]
- Holland, M.M.; Parson, W. GeneMarker® HID: A Reliable Software Tool for the Analysis of Forensic STR Data. J. Forensic Sci. 2011, 56, 29–35. [Google Scholar] [CrossRef]
- Goudet, J. FSTAT (Version 2.9.3): A Program to Estimate and Test Gene Diversities and Fixation Indices. 2001. Available online: www.Unil.Ch/Izea/Softw./Fstat.Html (accessed on 6 September 2022).
- Peakall, R.; Smouse, P.E. GenAlEx 6.5: Genetic Analysis in Excel. Population Genetic Software for Teaching and Research—An Update. Bioinformatics 2012, 28, 2537–2539. [Google Scholar] [CrossRef]
- Evanno, G.; Regnaut, S.; Goudet, J. Detecting the Number of Clusters of Individuals Using the Software Structure: A Simulation Study. Mol. Ecol. 2005, 14, 2611–2620. [Google Scholar] [CrossRef] [PubMed]
- Earl, D.A.; vonHoldt, B.M. STRUCTURE HARVESTER: A Website and Program for Visualizing STRUCTURE Output and Implementing the Evanno Method. Conserv. Genet. Resour. 2012, 4, 359–361. [Google Scholar] [CrossRef]
- Jakobsson, M.; Rosenberg, N.A. CLUMPP: A Cluster Matching and Permutation Program for Dealing with Label Switching and Multimodality in Analysis of Population Structure. Bioinformatics 2007, 23, 1801–1806. [Google Scholar] [CrossRef] [PubMed]
- Rosenberg, N.A. Distruct: A Program for the Graphical Display of Population Structure. Mol. Ecol. Notes 2004, 4, 137–138. [Google Scholar] [CrossRef]
- Excoffier, L.; Laval, G.; Schneider, S. Arlequin (Version 3.0): An Integrated Software Package for Population Genetics Data Analysis. Evol. Bioinform. Online 2007, 1, 47–50. [Google Scholar] [CrossRef]
- Shi, L.; Chen, H.; Jiang, M.; Wang, L.; Wu, X.; Huang, L.; Liu, C. CPGAVAS2, an Integrated Plastome Sequence Annotator and Analyzer. Nucleic Acids Res. 2019, 47, W65–W73. [Google Scholar] [CrossRef]
- Kearse, M.; Moir, R.; Wilson, A.; Stones-Havas, S.; Cheung, M.; Sturrock, S.; Buxton, S.; Cooper, A.; Markowitz, S.; Duran, C.; et al. Geneious Basic: An Integrated and Extendable Desktop Software Platform for the Organization and Analysis of Sequence Data. Bioinformatics 2012, 28, 1647–1649. [Google Scholar] [CrossRef]
- Lohse, M.; Drechsel, O.; Bock, R. OrganellarGenomeDRAW (OGDRAW): A Tool for the Easy Generation of High-Quality Custom Graphical Maps of Plastid and Mitochondrial Genomes. Curr. Genet. 2007, 52, 267–274. [Google Scholar] [CrossRef]
- Amiryousefi, A.; Hyvönen, J.; Poczai, P. IRscope: An Online Program to Visualize the Junction Sites of Chloroplast Genomes. Bioinformatics 2018, 34, 3030–3031. [Google Scholar] [CrossRef]
- Kurtz, S.; Choudhuri, J.V.; Ohlebusch, E.; Schleiermacher, C.; Stoye, J.; Giegerich, R. REPuter: The Manifold Applications of Repeat Analysis on a Genomic Scale. Nucleic Acids Res. 2001, 29, 4633–4642. [Google Scholar] [CrossRef]


Disclaimer/Publisher’s Note: The statements, opinions and data contained in all publications are solely those of the individual author(s) and contributor(s) and not of MDPI and/or the editor(s). MDPI and/or the editor(s) disclaim responsibility for any injury to people or property resulting from any ideas, methods, instructions or products referred to in the content. |
© 2023 by the authors. Licensee MDPI, Basel, Switzerland. This article is an open access article distributed under the terms and conditions of the Creative Commons Attribution (CC BY) license (https://creativecommons.org/licenses/by/4.0/).