Abstract
Deep sowing is an efficient strategy for maize to ensure the seedling emergence rate under adverse conditions such as drought or low temperatures. However, the genetic basis of deep-sowing tolerance-related traits in maize remains largely unknown. In this study, we performed a genome-wide association study on traits related to deep-sowing tolerance, including mesocotyl length (ML), coleoptile length (CL), plumule length (PL), shoot length (SL), and primary root length (PRL), using 255 maize inbred lines grown in three different environments. We identified 23, 6, 4, and 4 quantitative trait loci (QTLs) associated with ML, CL, PL, and SL, respectively. By analyzing candidate genes within these QTLs, we found a γ-tubulin-containing complex protein, ZmGCP2, which was significantly associated with ML, PL, and SL. Loss of function of ZmGCP2 resulted in decreased PL, possibly by affecting the cell elongation, thus affecting SL. Additionally, we identified superior haplotypes and allelic variations of ZmGCP2 with a longer PL and SL, which may be useful for breeding varieties with deep-sowing tolerance to improve maize cultivation.
1. Introduction
Maize (Zea mays L.) is one of the most productive and high-value crops worldwide and plays a pivotal role in global food security [1]. Achieving uniform and vigorous seedling emergence is essential for increasing maize productivity [2]. Maize emergence is influenced by a multitude of factors including genetic variation in seeds, environmental factors, planting depth, and sowing techniques. Adverse climatic conditions, such as drought and low temperatures, are critical factors limiting maize emergence rates and seedling quality [3,4,5]. However, increasing sowing depth can effectively mitigate the negative effects of environmental stresses such as drought and low temperatures on maize seedling growth [6,7,8,9]. Furthermore, deep sowing can promote the development of deep root systems in maize, which are vital for the later stages of water absorption and utilization in plants; as the root system extends into deeper soil layers, maize plants use deep-soil water resources more effectively and exhibit greater resistance to lodging [10]. Since the 1990s, the Indian maize variety “P1213733 (Komona)” has been widely cultivated in the dryland areas of southwestern United States and western Mexico, because of its ability to be sown at a depth of 30 cm and maintain good emergence rates [11]. In China, through the genetic enhancement of Indian blue corn, breeders have developed maize varieties such as “42107” and “Kang 42”, which not only adapt well to deep-sowing conditions but also exhibit improved drought tolerance and yield [10].
Owing to genetic differences among different varieties of seeds, increasing sowing depth may result in some seeds failing to emerge properly [12]. Therefore, to improve maize emergence and yield through deep sowing, maize seeds should have an elevated level of deep-sowing tolerance, which entails maintaining a high germination rate and good seedling vigor under deep-sowing conditions. Many studies have evaluated the deep-sowing tolerance of maize by measuring traits such as germination rate, mesocotyl length (ML), coleoptile length (CL), plumule length (PL), shoot length (SL), and primary root length (PRL) [13,14,15,16]. Among these traits, the emergence rate is the most straightforward metric for assessing the deep-sowing tolerance of maize, with higher rates corresponding to increased tolerance. In deep-sowing conditions, the emergence rate is primarily and directly correlated with ML, followed by CL and SL [17]. Longer plumules and shoots also indicate the greater vitality of seeds and seedlings [18].
Many deep-sowing tolerance-related quantitative trait loci (QTLs) have been mapped using different populations of rice (Oryza sativa L.) [19,20,21,22], and the functions of several genes related to the deep-sowing tolerance of rice have been reported [23,24,25]. In contrast, only a limited number of deep-sowing tolerance QTLs have been identified in maize [11,17,26]. These maize QTLs predominantly stem from biparental population studies constrained by a limited number of molecular markers. This limitation restricts the precision of QTL localization, often confining QTLs to broader genomic regions, making further mining of candidate genes difficult. Consequently, some studies have combined RNA sequencing and meta-analysis to better dissect the genetics of deep-sowing tolerance in maize. Zhao et al. [16] identified 13 major QTLs and 17 meta-QTLs associated with deep-sowing tolerance, along with 50 differentially expressed candidate genes within these QTLs. Wang et al. [27] used transcriptome analysis to elucidate the molecular mechanisms of maize seed germination under deep-sowing conditions, identifying six candidate genes. In the study of quantitative traits in plants, genome-wide association studies (GWAS) use dense genetic markers to achieve a more precise association with genetic areas relevant to target traits, in contrast to traditional mapping methods [28,29,30]. This method is particularly useful for detecting loci with minor effects, thereby substantially advancing the elucidation of complex trait genetics and the discovery of candidate genes [31,32,33,34,35]. Yang et al. [9] identified 273 single nucleotide polymorphisms (SNPs) significantly associated with deep-sowing tolerance in maize through GWAS and RNA sequencing, selecting one candidate gene related to organ length, auxin, or light response. In summary, these studies have enhanced the comprehension of the genetics underlying maize deep-sowing tolerance. However, the number of high-confidence candidate genes identified in current research on maize deep-sowing tolerance remains limited, and the functions of these genes require further investigation.
In this study, the association population was re-sequenced, and high-density and high-quality SNP markers were obtained. Based on this premise, we performed a genome-wide association analysis of deep-sowing tolerance-related traits in maize, including ML, CL, PL, SL, and PRL. We identified several QTLs associated with deep-sowing tolerance in maize co-localized with the candidate gene ZmGCP2, which was significantly associated with ML, PL, and SL. We then verified the function of ZmGCP2 using an ethyl methanesulfonate (EMS) mutant. We found that ZmGCP2 likely alters PL through its effect on cell elongation, thereby affecting SL. Furthermore, we identified superior haplotypes and allelic variations in ZmGCP2 that may be useful for breeding varieties with deep-sowing tolerance to improve maize cultivation.
2. Results
2.1. Evaluation of Deep-Sowing Tolerance-Related Traits
In the present study, deep-sowing tolerance-related traits were evaluated in an association population grown in three different environments: Chongzhou in 2020 (20CZ), Yunnan in 2020 (20YN), and Chongzhou in 2021 (21CZ) (Table 1). All traits were measured in maize seedlings that had been grown in the dark for 8 d. Abundant phenotypic variations were observed in ML, CL, PL, SL, and PRL, and the results indicated this population was suitable for analyzing the genetic basis of deep-sowing tolerance-related traits (Table 1). The absolute values of skewness and kurtosis for each trait were less than one, indicating that they were normally distributed, which is a typical characteristic of quantitative traits (Table 1). The broad-sense heritability for each trait ranged from 0.82 to 0.91, indicating that deep-sowing tolerance-related traits in maize were mainly influenced by genetic factors (Table S1). Additionally, Pearson correlation analysis of both deep-sowing tolerance-related traits and grain traits (kernel length, kernel width, kernel thickness, hundred-grain weight, area of endosperm, and area of embryo) revealed that ML and PL were significantly positively correlated with SL, whereas the other traits were not significantly correlated (Figure S1). This finding indicates that traits related to deep-sowing tolerance were not affected by grain traits.

Table 1.
Descriptive statistics for the deep-sowing tolerance-related traits of association population grown in three different environments.
2.2. Linkage Disequilibrium and Structure Analysis
The population structure of the association panel was subsequently identified. According to the ∆K calculation results, coupled with breeding experience and pedigree information, the association population could be divided into three, five, or seven groups (Figure 1A). When K = 3, the SS group was clearly separated; however, the other two groups were more difficult to distinguish. For instance, when K = 5, the entire population could be divided into SS, NSS, PA/PB, Iodent, and SPT groups. The PA and PB groups could be separated further, and the Lancaster group could also be divided when K = 7 (Figure 1B). Inbred lines with lower discernibility were allocated to the mixed group. Based on the population division results, we constructed a phylogenetic tree for K = 5 (Figure 1C). The division of different branches within the entire phylogenetic tree was similar to the division of the population structure, and the mixed group was predominantly located in transitional areas between the other groups. Furthermore, linkage disequilibrium (LD) analysis of SNP markers across 10 chromosomes indicated that at a cutoff of r2 = 0.1, the decay distance for LD was approximately 10 kb (Figure 1D). Therefore, the LD threshold used in this research was 10 kb.
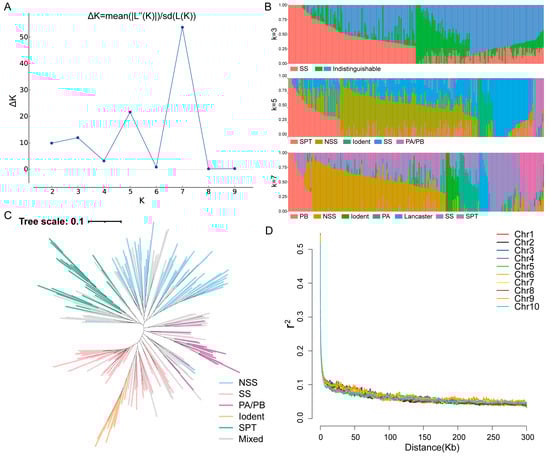
Figure 1.
Linkage disequilibrium (LD) and structure analysis of the association population. (A) Values of ΔK plotted against K = 1–10 based on the structure analysis of the accessions population. (B) Population structure with K = 3, 5, and 7. (C) Phylogenetic tree of the entire panel for K = 5. (D) LD decay across the 10 maize chromosomes. Chr1–Chr10 represent chromosomes 1–10.
2.3. GWAS of Deep-Sowing Tolerance-Related Traits in Maize
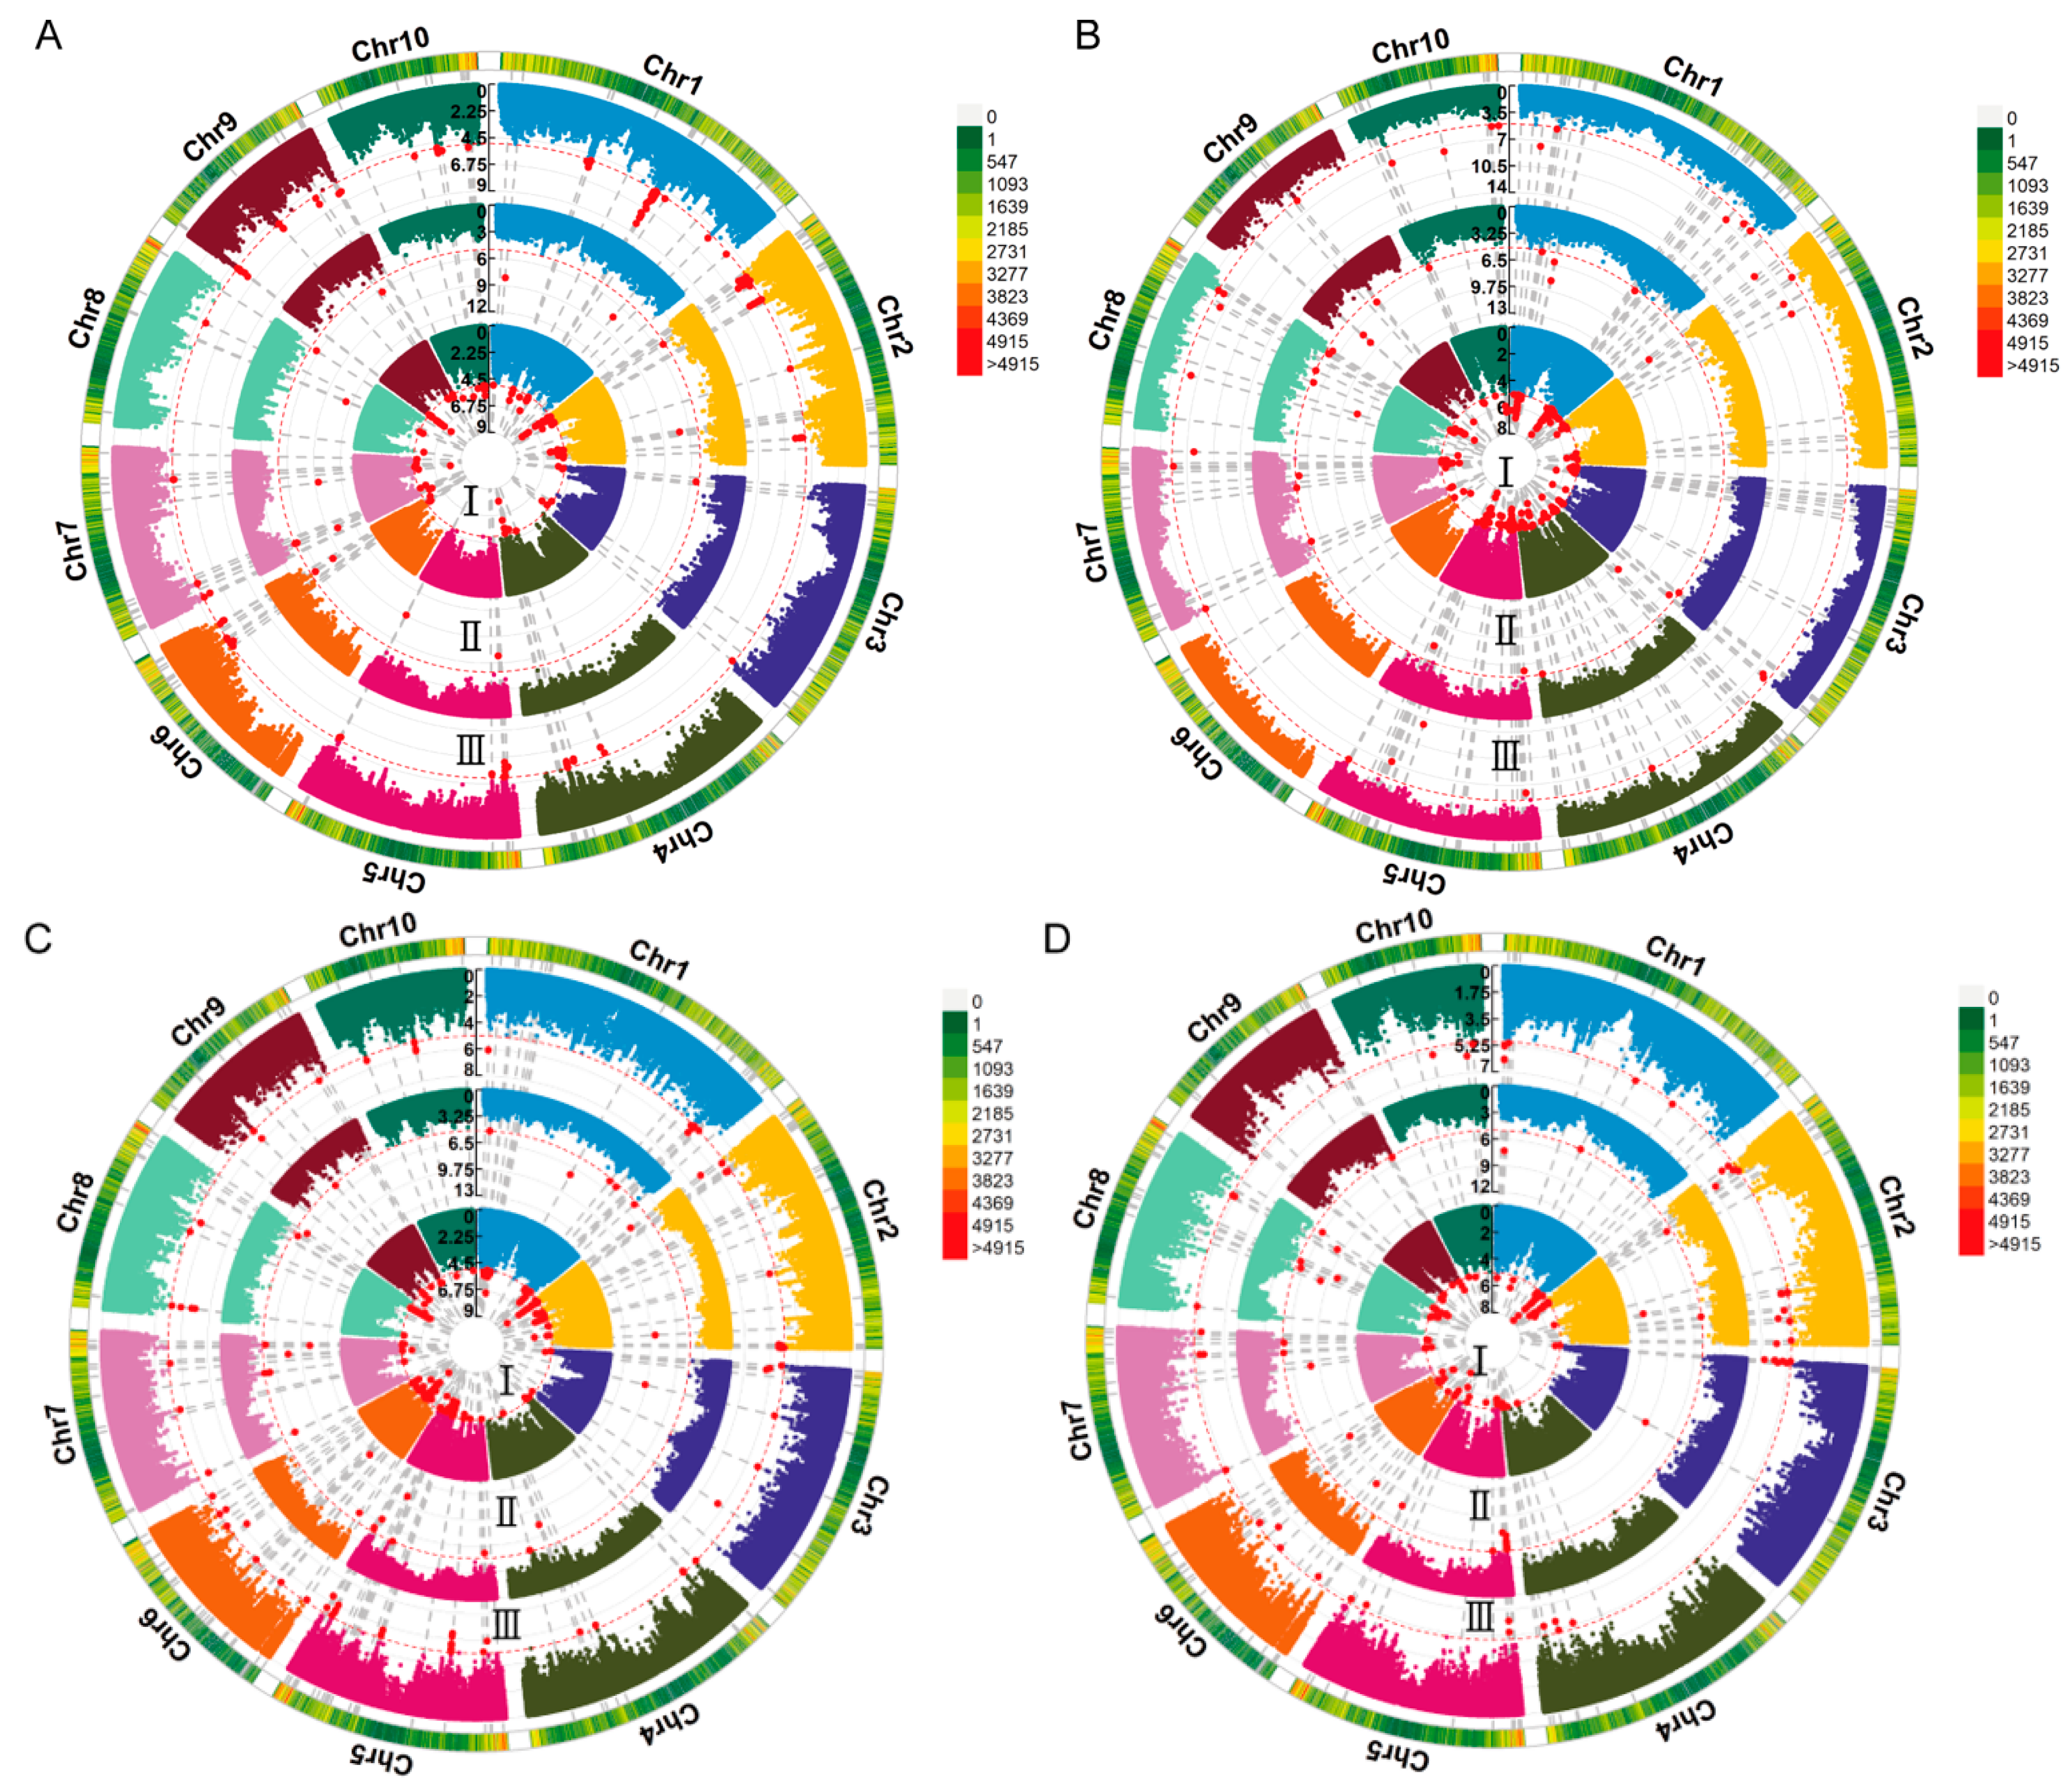
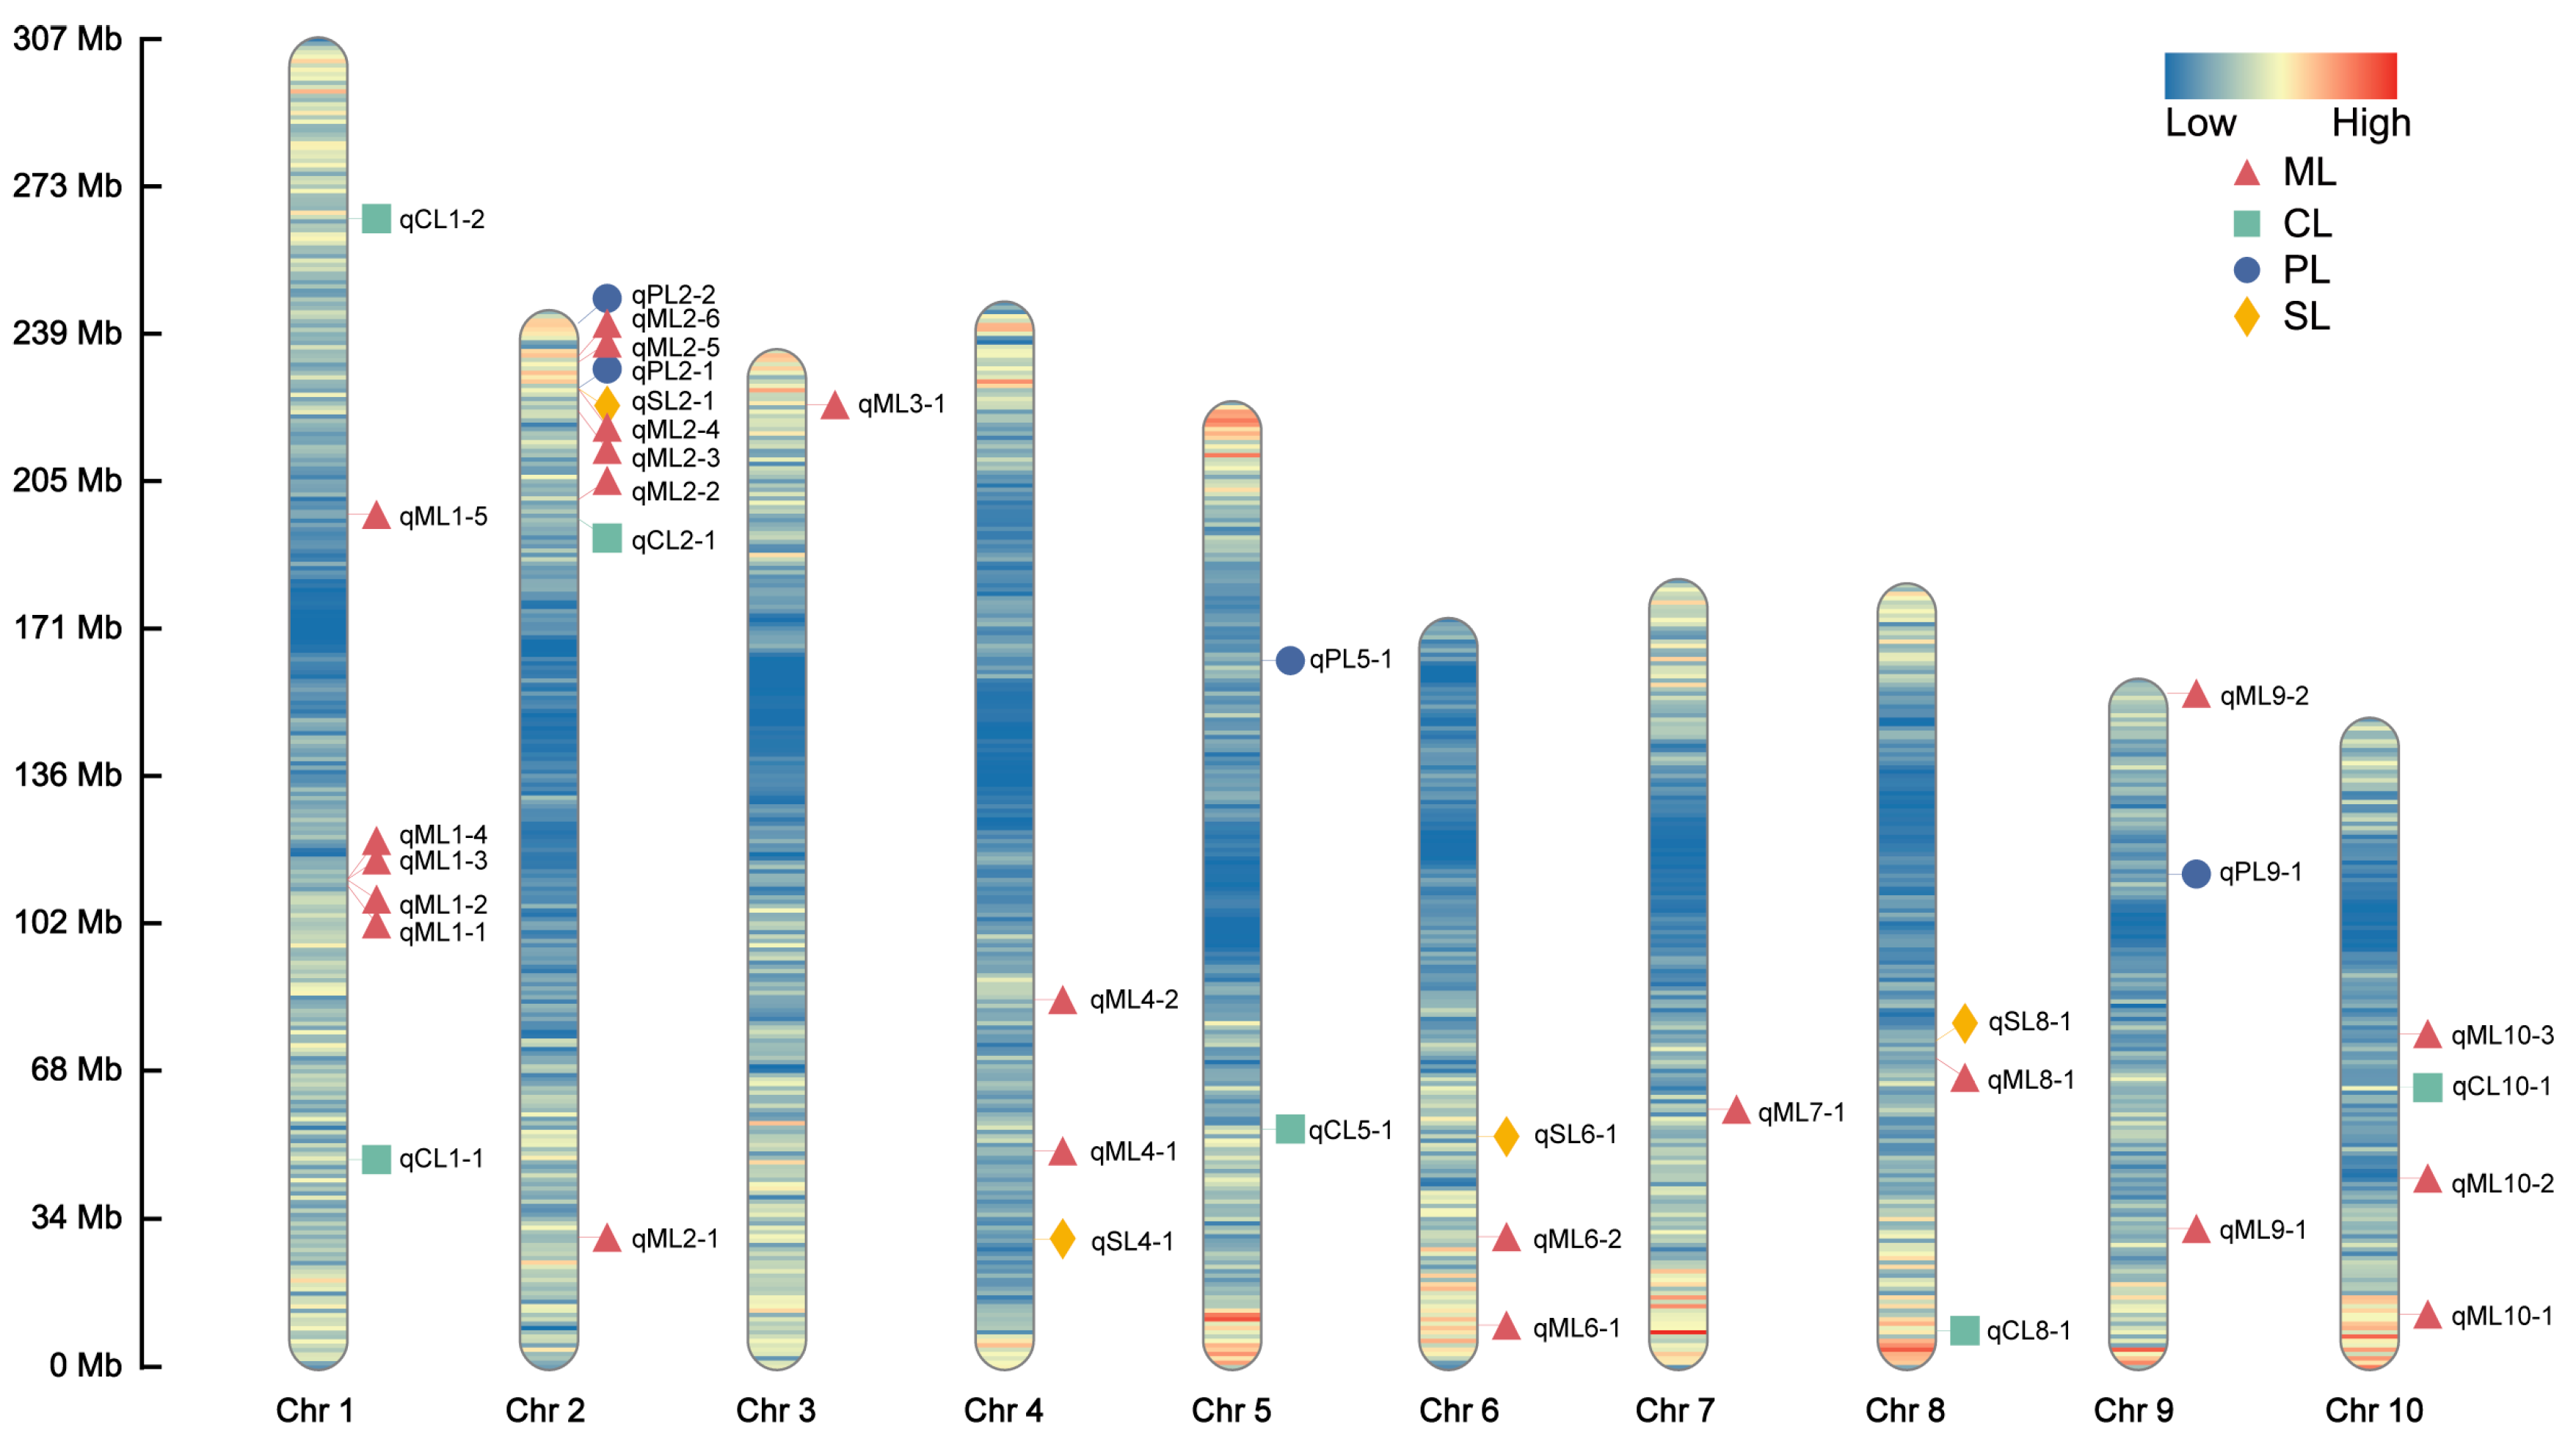
A GWAS of deep-sowing tolerance-related traits was conducted in an association population grown across three environments. The association analysis was performed using the FarmCPU model, with a significance threshold of p = 1 × 10⁻⁵. We identified 38, 6, 4, and 5 SNPs that were significantly associated with ML, CL, PL, and SL, respectively, in at least two environments, each of which we referred to as co-located SNPs (Figure 2 and Figure S2). No significant SNP for PRL was consistently detected in multiple environments (Figure S3). The LD region (10 kb) around these co-located SNPs was defined as a QTL, and the QTLs that overlapped and were related to the same trait were combined into a single QTL. According to this, 23, 6, 4, and 4 QTLs were associated with ML, CL, PL, and SL, respectively. These QTLs were distributed over 10 chromosomes, most of which were located on chromosome 2 (Figure 3). The phenotypic variance explained by these QTLs was mostly less than 10%, indicating that deep-sowing tolerance-related traits were mainly controlled by multiple minor-effect loci (Table S2). Of particular interest were the qML2-3, qPL2-2, and qSL2-1 loci on chromosome 2, which exhibited overlapping regions.
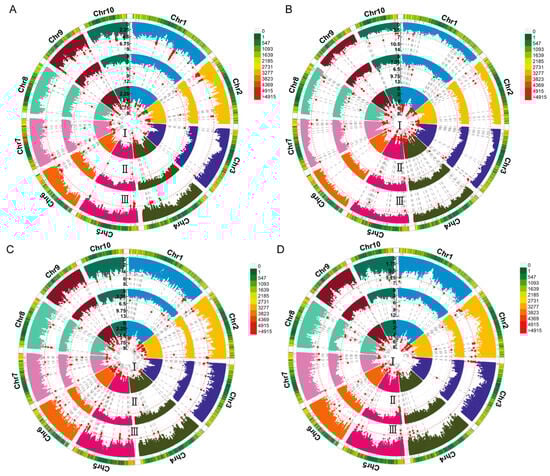
Figure 2.
Circular Manhattan plot of the genome-wide association study (GWAS) for deep-sowing tolerance-related traits. (A–D) Manhattan plots of ML, CL, PL, and SL, respectively. ML, mesocotyl length; CL, coleoptile length; PL, plumule length; SL, shoot length. I–III represent different environments: (I) 2020 Chongzhou, Sichuan; (II) 2020 Xishuangbanna, Yunnan; (III) 2021 Chongzhou, Sichuan. Chr1–Chr10 represent chromosomes 1–10. The red line represents the significance threshold of p = 1 × 10⁻⁵. The red dots indicate single nucleotide polymorphisms (SNPs) significantly associated with deep-sowing tolerance-related traits.
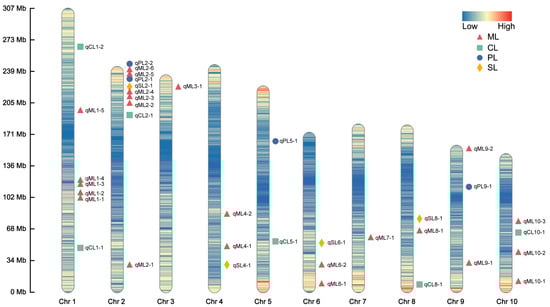
Figure 3.
Chromosomal distributions of the quantitative trait loci (QTLs) for deep-sowing tolerance-related phenotypes in the association population. Chr1–10 represent chromosomes 1–10. The color of the chromosome represents the density of SNPs. The QTL names are indicated according to the following rules: the chromosome number is indicated by the first number following the phenotype name, and the number following the dash is used to identify different QTLs found on the same chromosome for the same trait.
2.4. Candidate Genes Co-Localized by ML, PL, and SL
Within the LD = 10 kb region of significant SNPs, 43, 13, 16, and 10 candidate genes were identified for ML, CL, PL, and SL, respectively, across two environments (Table S3). Additionally, we found that Zm00001d002644 and zma-MIR171h were associated with ML, PL, and SL in different environments. Pearson correlation analysis of deep-sowing tolerance-related traits revealed a strong positive correlation between ML and PL with SL, suggesting interconnected growth processes. Zm00001d002644 encodes the Spc97/Spc98 family of spindle pole body (SBP) components, which are part of the γ-tubulin complex. Microtubules are the main components of the cytoskeleton and are formed by the polymerization of tubulin dimers, which play important roles in maintaining cell morphology, activity, and division [36]. zma-MIR171h was reported to potentially regulate the response to low phosphorus and cadmium stresses in maize and may be associated with the interaction between maize and the pathogen Fusarium verticillioides [37,38,39]. Based on the reported expression data [40,41], we analyzed the expression level of Zm00001d002644 and zma-MIR171h (Figure S4). The results showed that Zm00001d002644 was highly expressed in the coleoptile 6 days after sowing, which included the mesocotyl, coleoptile, and plumule in the early growth stage. In addition, it was also highly expressed in the fast-growth tissues, such as the shoot apical meristem, shoot tip, and primary root. zma-MIR171h was highly expressed in the leaf and seedling but showed lower expression in other tissues. Therefore, we focused on Zm00001d002644 and subsequently named it gamma-tubulin complex protein 2 (ZmGCP2).
2.5. Functional Verification of Candidate Gene ZmGCP2
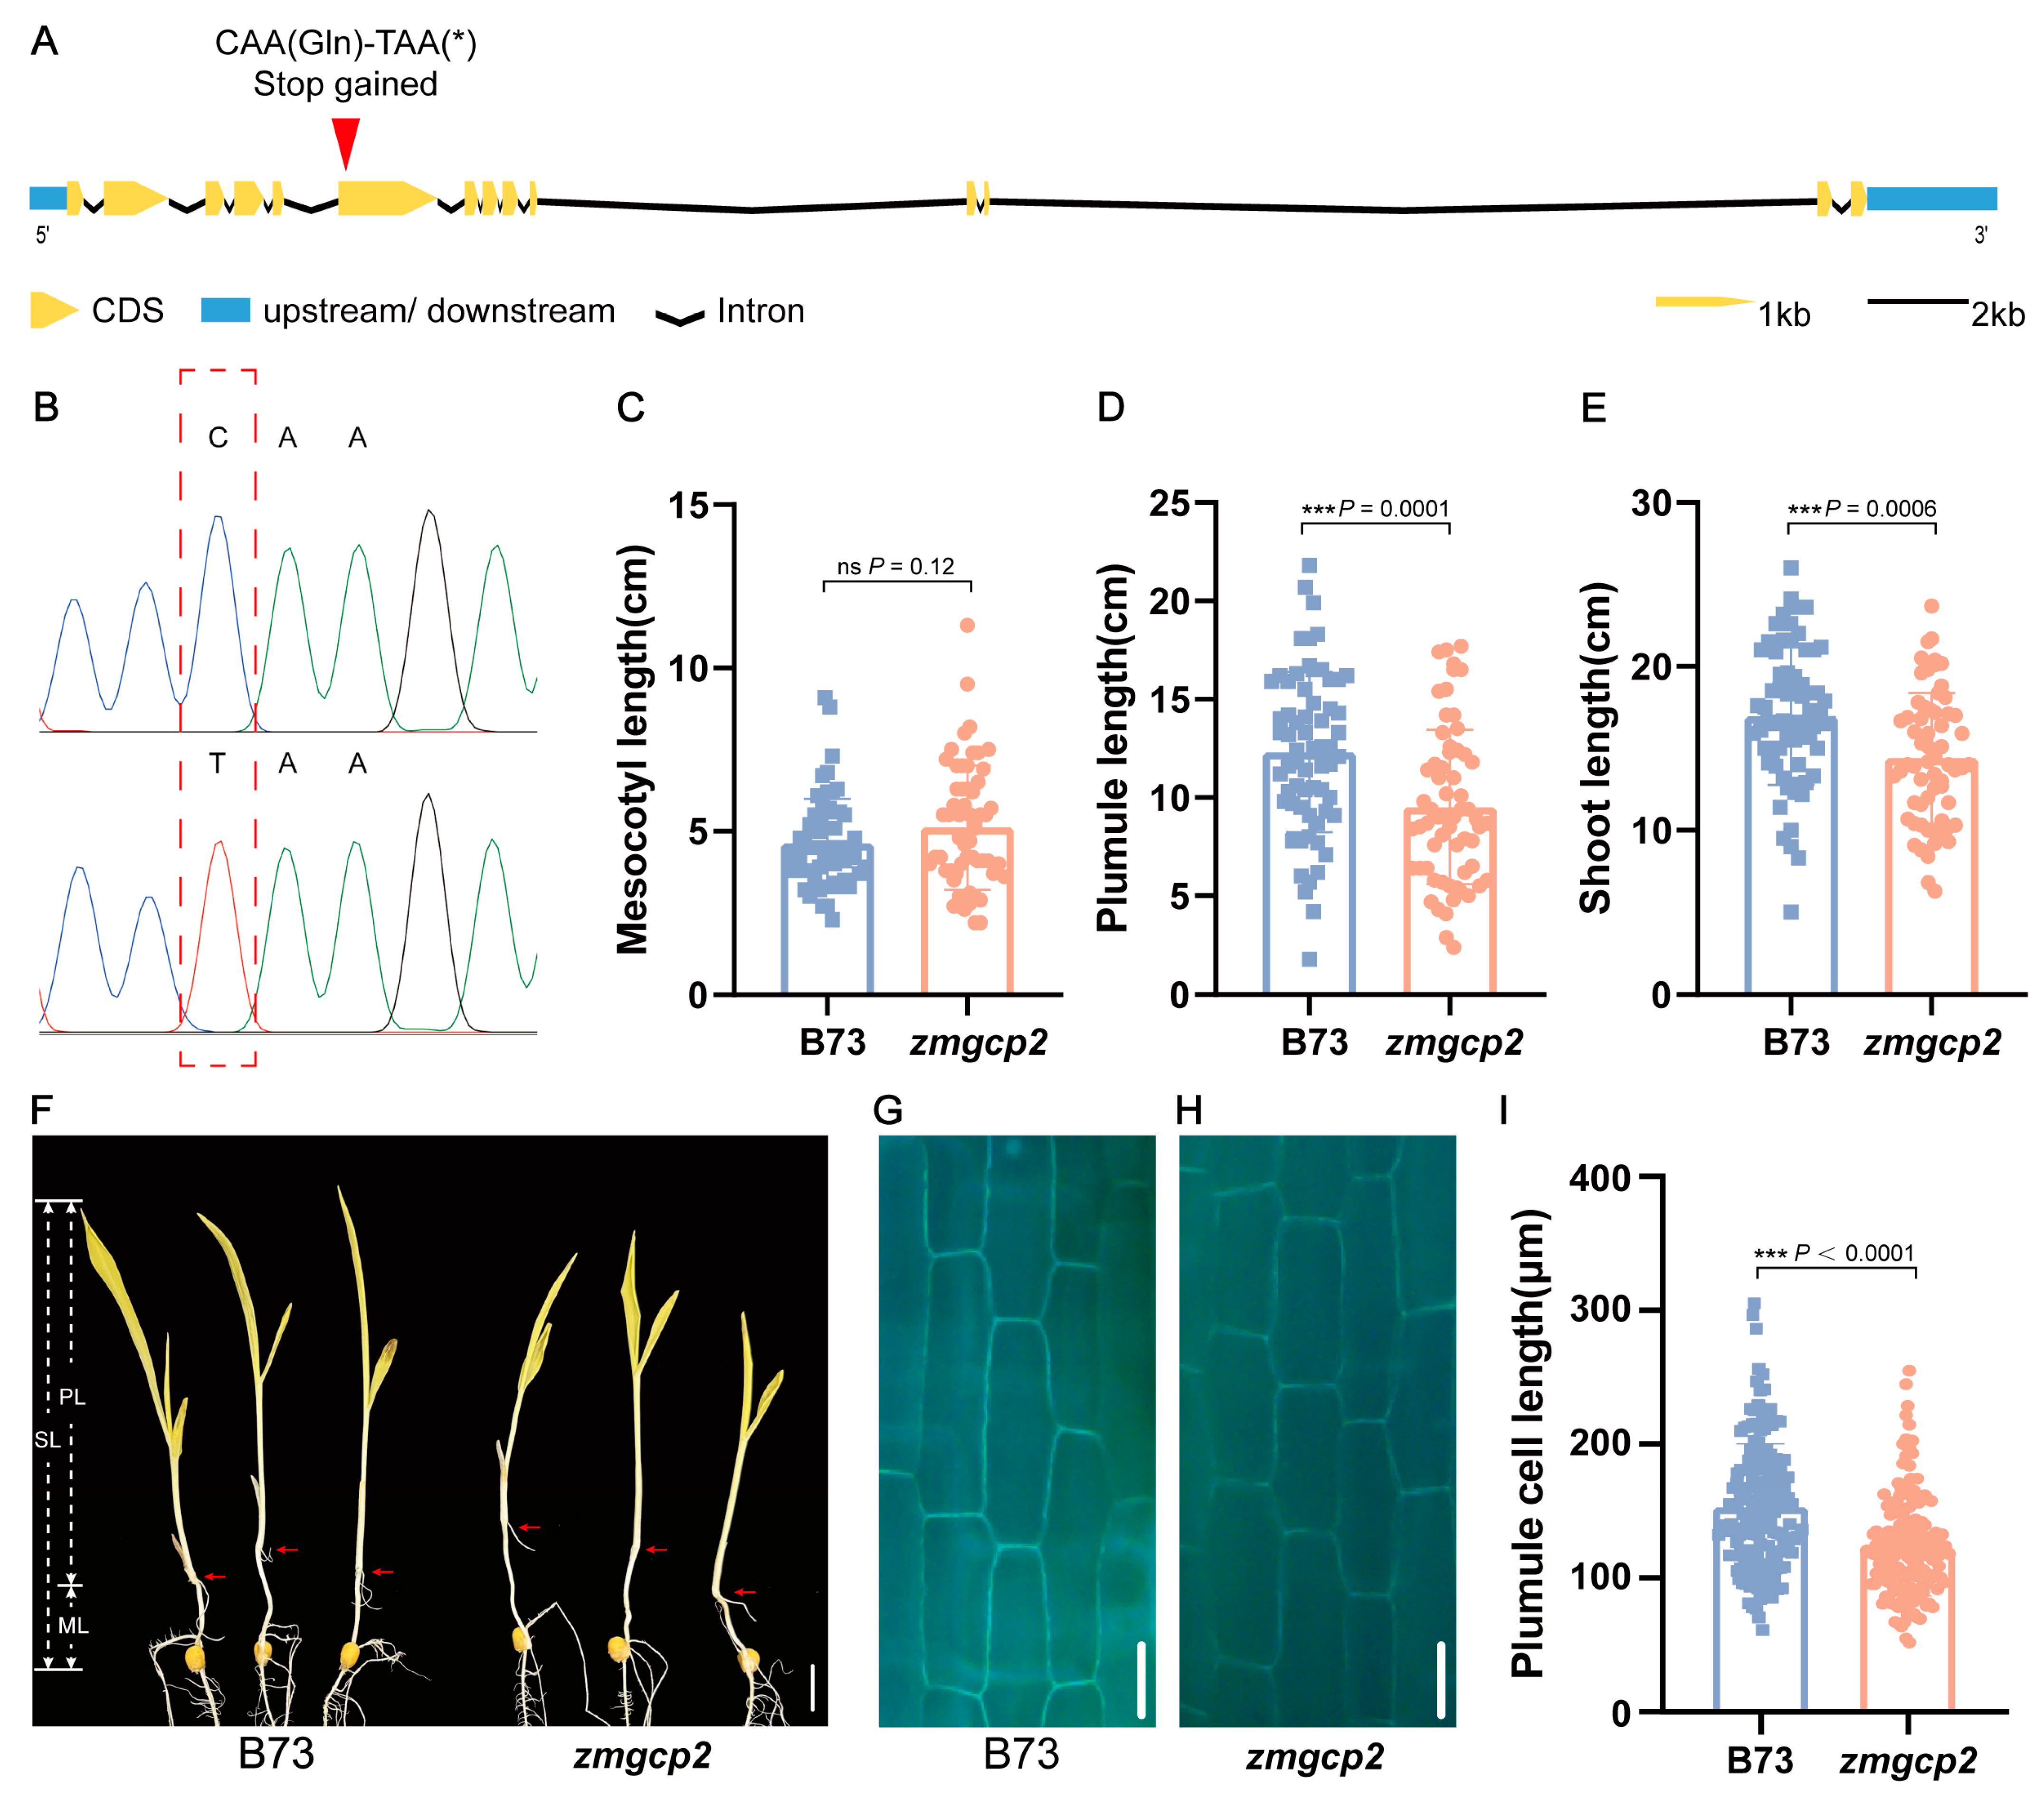
To functionally characterize ZmGCP2, we obtained a B73 EMS mutant (zmgcp2) from the EMS mutant library, which contained a termination mutation in the sixth exon (Figure 4A,B). Comparative phenotypic assessments of zmgcp2 and wild-type B73 revealed no difference in ML, whereas PL and SL were significantly shorter in zmgcp2 than in B73 (Figure 4C–F). Additionally, we observed the plumule cells of the mutant zmgcp2 and B73 and found that the plumule cell length of zmgcp2 was significantly shorter than that of B73 (Figure 4G–I). These findings suggest that ZmGCP2 is a candidate gene that alters PL by affecting cell elongation, thereby affecting SL.
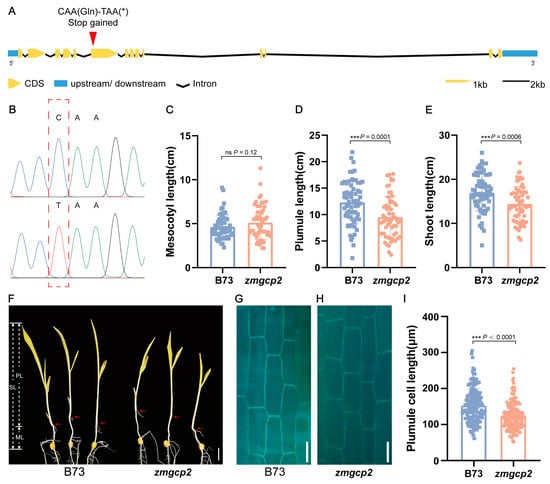
Figure 4.
Mutation and phenotypes of zmgcp2 compared to wild-type B73. (A) Schematic charts of ZmGCP2 gene structure; asterisk stands for stop codon. The red arrowhead indicates the mutation position in zmgcp2. (B) Sequencing results of B73 and zmgcp2 at the mutation position. (C–E) Comparison of ML, PL, and SL between B73 and zmgcp2. (F) Seedling phenotypes of B73 and zmgcp2; scale bars = 2 cm. (G–H) Plumule cells of B73 and zmgcp2 under blue excitation light; scale bars = 50 μm. (I) Comparison of plumule cell length between B73 and zmgcp2; n ≥ 90 cells from 3 seedlings. Student’s t-test; ***, p < 0.001; ns, not significant.
2.6. Natural Variation in ZmGCP2
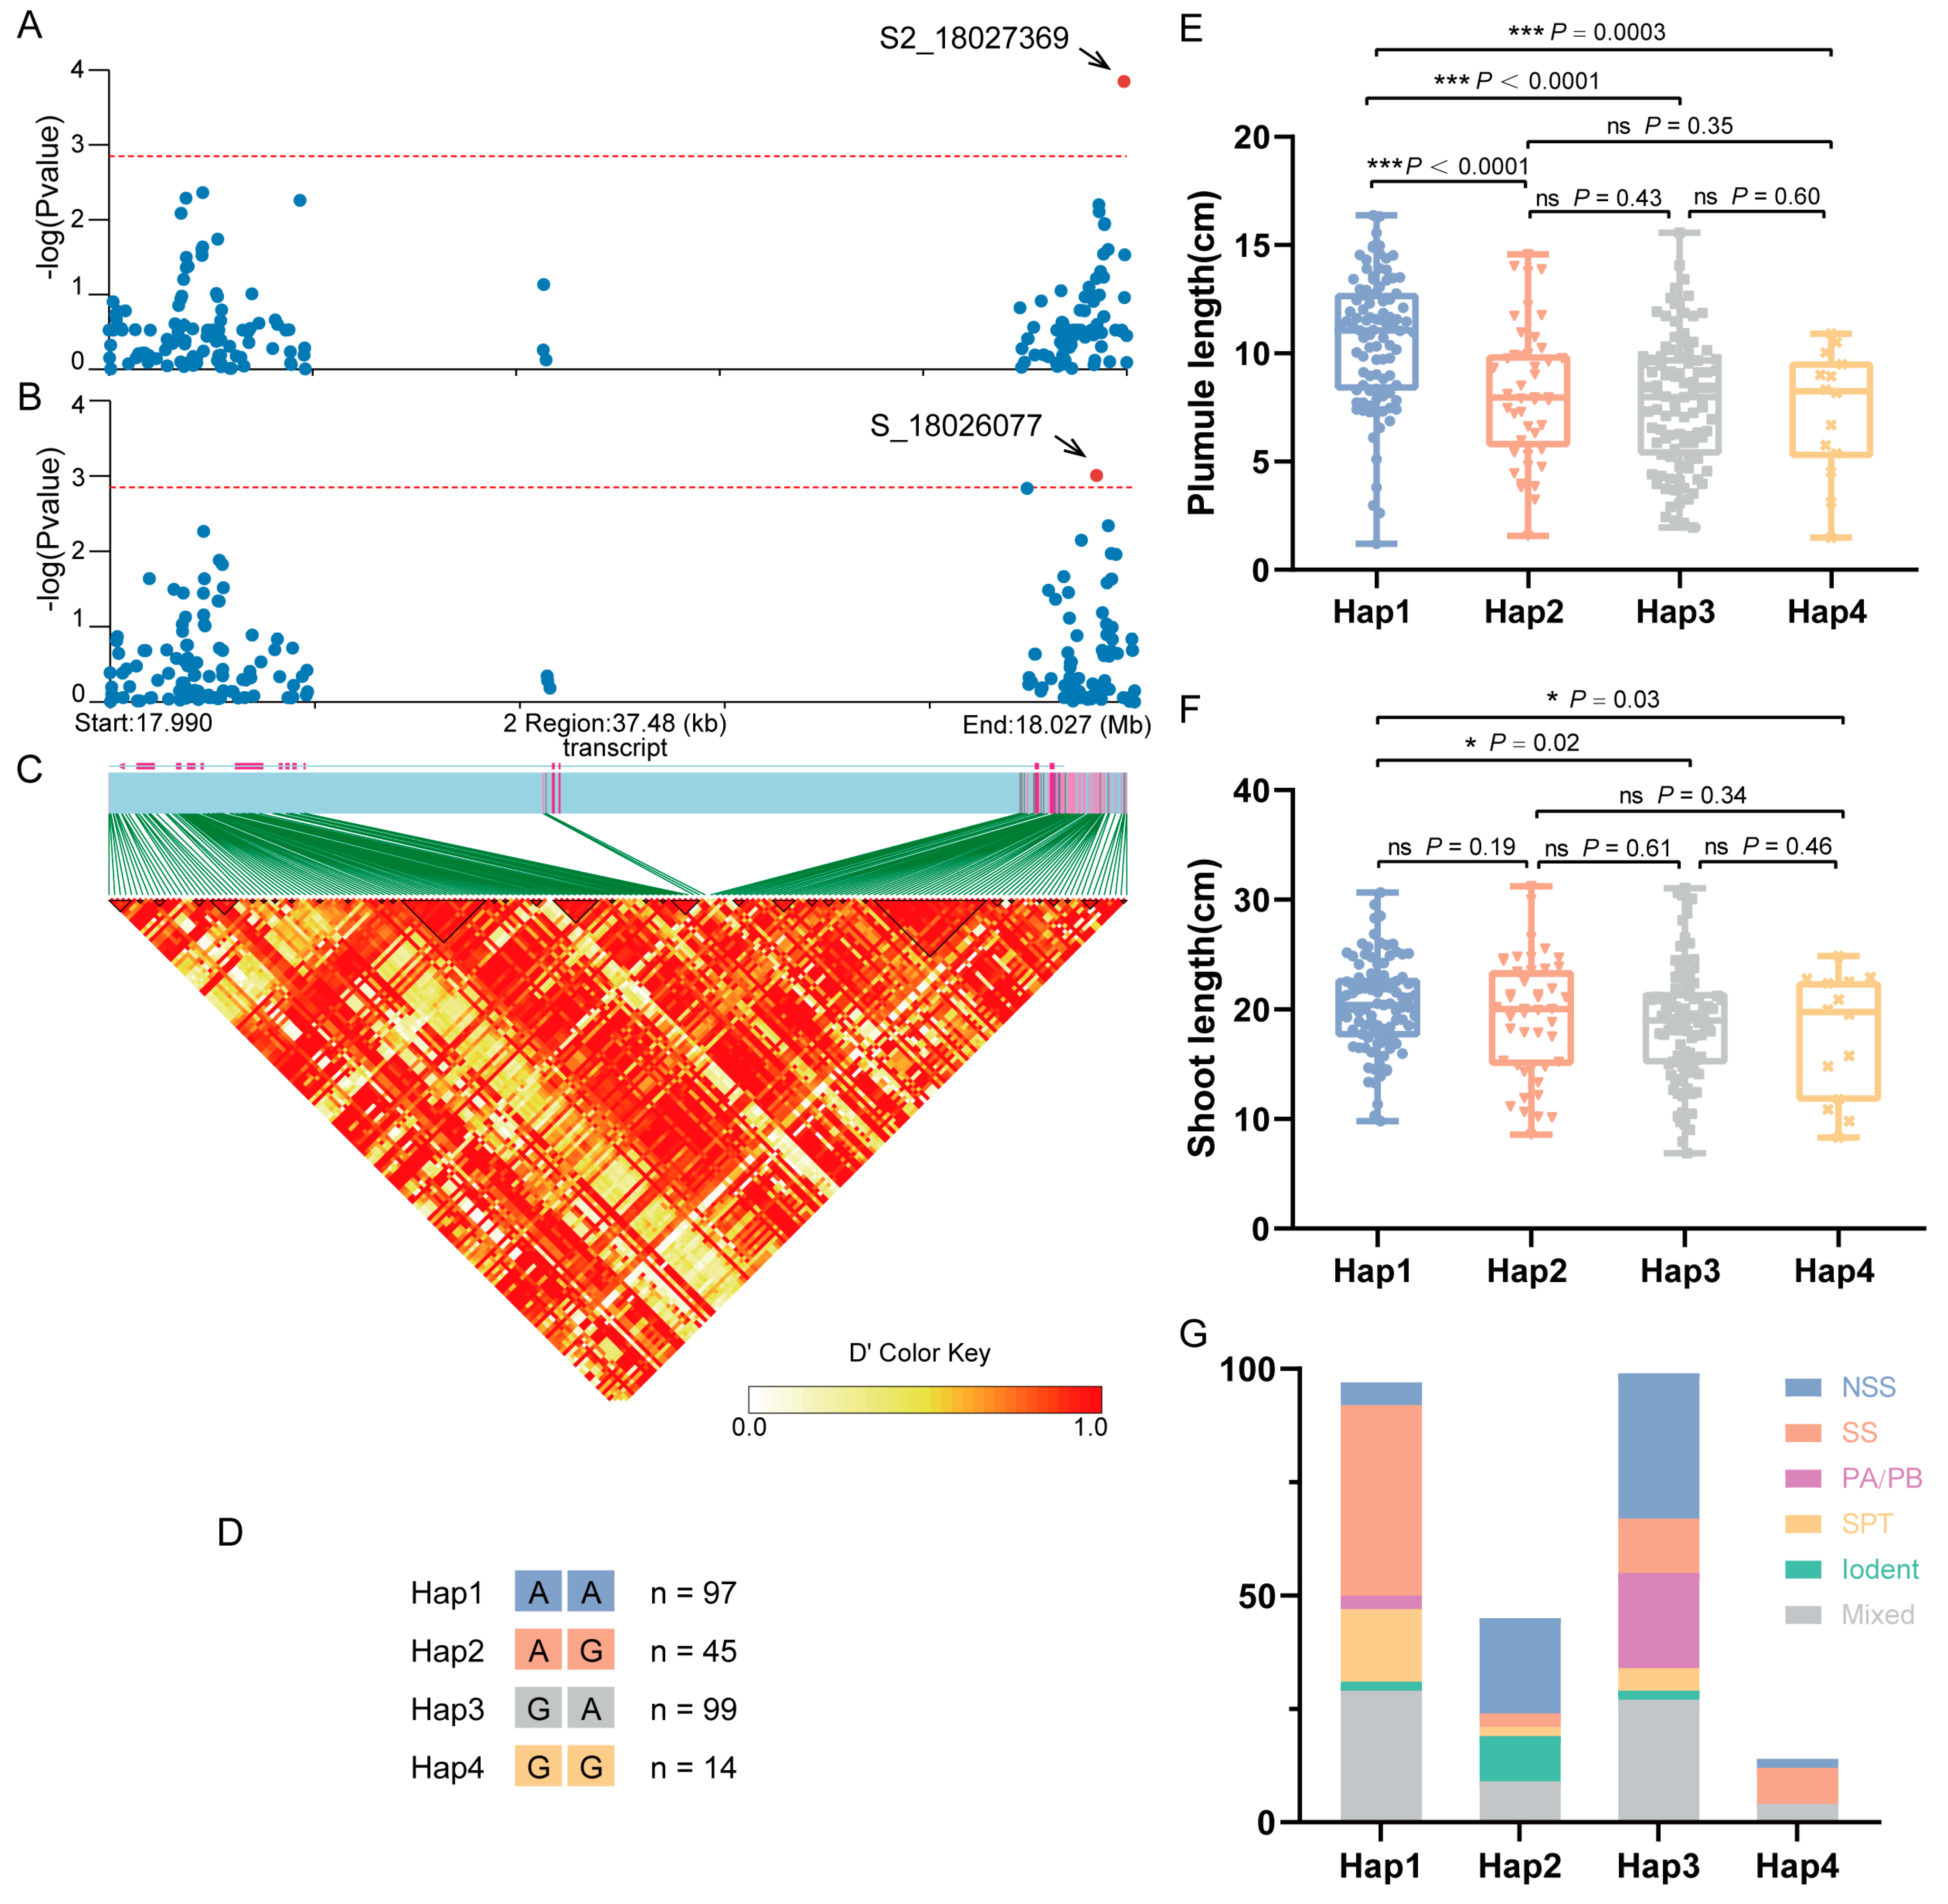
An association analysis was performed on SNPs within the coding sequence (CDS) and 2000 bp upstream/downstream regions of ZmGCP2 based on the PL-best linear unbiased estimate (BLUE) and SL-BLUE values. PL and SL were significantly associated with S2_18027369 and S_18026077, respectively, with S2_18027369 located in the downstream regions of the CDS and S_18026077 located on the exon (Figure 5A–C). Based on the allelic types at these two loci, the association population was divided into four haplotypes (Hap1: AA; Hap2: AG; Hap3: GA; and Hap4: GG) (Figure 5D). Compared to the other three haplotypes, Hap1 exhibited significantly higher PL and SL, with SL being significantly higher than in Hap3 and Hap4, but not significantly higher than in Hap2 (Figure 5E,F). Thus, we deduced that Hap1 was the superior haplotype and that allele A at S_18026077 (S_18026077-A) was the superior allelic variation for controlling PL and SL. Moreover, we analyzed the distribution of different groups of inbred lines among the four haplotypes. The results showed a high prevalence of the SS group within Hap1, followed by the Tang Si Ping Tou (SPT) hybrid advantage group in China. The NSS group and other groups were very limited (Figure 5G). These findings led us to hypothesize that this gene has undergone selection during maize improvement and produces a favorable Hap1 allele that may be useful and suitable for modern breeding programs for maize improvement.
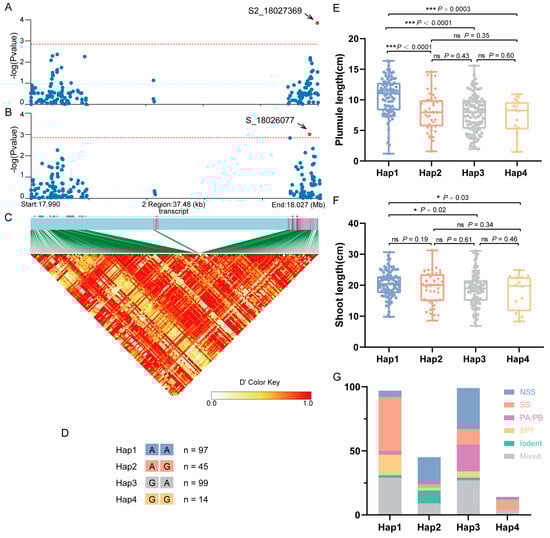
Figure 5.
Association analysis of the candidate gene ZmGCP2. (A) Candidate gene association analysis of ZmGCP2 with PL-best linear unbiased estimate (BLUE). (B) Candidate gene association analysis of ZmGCP2 with SL-BLUE. (C) Pairwise LD between the markers. (D) Details of four haplotypes (Hap1, Hap2, Hap3, and Hap4); n represents the inbred line number of each haplotype. (E,F) Comparison of PL and SL between different haplotypes. Student’s t-test; *, p < 0.05; ***, p < 0.001; ns, not significant. (G) Distribution of inbred lines from different groups in the four haplotypes.
3. Discussion
3.1. GWAS Is Effective for Dissecting the Genetic Basis of Maize Deep-Sowing Tolerance
Uniform and vigorous seedling emergence is an important precondition for improving maize yield [2]. Adverse climatic conditions are important limiting factors for the emergence rate and seedling quality of maize [3,4,5]. Deep sowing can effectively mitigate the negative effects of environmental stresses, such as drought and low temperatures, on the growth of maize seedlings [6,7,8,9]. Furthermore, deep sowing can promote the development of deep root systems and drought and lodging resistance in maize [10]. To increase the production and emergence rate of maize via deep sowing, maize seeds should have an elevated level of deep-sowing tolerance. Genetic analysis and candidate gene mining for deep-sowing tolerance-correlated maize traits can benefit the cultivation of deep-sowing and drought-tolerant maize varieties. Currently, the number of QTLs for deep-sowing tolerance that have been found in maize is limited [11,17,26]. These QTLs are mostly obtained from biparental populations with broad genetic distances, making it difficult to extract candidate genes for use in breeding programs.
GWAS are based on the LD within populations that exhibit wide natural genetic variations. GWAS use statistical methodologies to analyze the relationships between genotypic variations and targeted traits. They have been widely applied to investigate the genetic basis of complex traits and identify SNPs [28,29,30,31,32,33,34,35]. In this study, multiple traits related to deep-sowing tolerance were mapped and genetic variation was analyzed simultaneously using a GWAS. The variability coefficients of deep-sowing tolerance-related traits of the association population ranged from 24% to 40%, which shows that this population had diverse genetic variation and was suitable for analyzing the genetic basis of deep-sowing tolerance-related traits. High-density molecular markers are crucial for identifying superior genetic variants; in this study, 2,432,795 markers were obtained by 10× resequencing of the association population. Based on these results, a genetic structure analysis was performed, and genetic location relevance and candidate gene identification were ensured.
3.2. Comparison of Co-Localized QTLs with Previously Reported QTLs
In the present study, ML, CL, PL, and SL were associated with 38, 6, 4, and 5 significant SNPs, respectively, which were each repeatedly detected in at least two environments. Defining regions by co-localized SNPs ± LD (10 kb), we identified 23, 6, 4, and 4 corresponding QTLs. Zhang et al. [17] identified several deep-sowing tolerance-related QTLs at sowing depths of 10 and 20 cm in the F2 population. The qML4-2, qML6-1, qML6-2, and qML10-3 loci identified in our study overlapped with the qMES20-4, qMES10-6-2, and qMES10-10 loci identified by Zhang et al. [17], and these QTLs were all related to ML. Additionally, qML3-1 for ML overlapped with qSDL20-3 for SL in the same study. Simultaneously, the qML4-1 locus in our study overlapped with qDSSL4-2, which is associated with SL under deep-sowing conditions in the IBM Syn10 DH population, as reported by Liu et al. [26]. Furthermore, the qSL4-1 and qSL6-1 loci, which are related to SL, overlapped with qMES20-4 and qMES10-6-2, which were found to control ML by Zhang et al. [17]. According to the correlation analysis between each trait, ML and SL were significantly and positively correlated; therefore, detecting the same QTL interval between ML and SL was reasonable. Finally, the qCL1-2 locus for CL on Chr1 overlapped with the germination rate QTL qRAT20-1 found at the 20 cm sowing depth and was close to qRAT10-1 at the 10 cm depth, both detected by Zhang et al. [17]. It was also near qDSGR1-1, which was found to be related to germination rate in a study by Liu et al. [26]. In conclusion, the QTLs identified in this study are valid and reliable. Many of these QTLs are novel, providing new information for the genetic analysis of deep-sowing tolerance in maize. The use of high-density SNP markers in this study led to the identification of QTL intervals that were significantly smaller than those found in similar research efforts, which improves the possibility of further mining candidate genes. Moreover, because of genetic variations in different populations, the QTL intervals associated with the same traits will differ, and different traits with correlations are likely to be associated with the same QTL interval.
3.3. Functional Analysis of Candidate Gene ZmGCP2
Under deep-sowing conditions, seeds can maintain a high germination rate, and strong seedling vigor is an important manifestation of their tolerance to deep sowing. The emergence rate of maize under deep-sowing conditions is significantly correlated with ML [13,14,15,16], followed by PL and SL [17]. In fact, longer plumules and shoots also indicate greater vitality of seeds and seedlings [18]. In this study, ML and PL were significantly and positively correlated with SL, and we co-localized a candidate gene, ZmGCP2, which was significantly associated with ML, PL, and SL. ZmGCP2 encodes the Spc97/Spc98 family of SBP components, which are part of the γ-tubulin complex. Microtubules are the main components of the cytoskeleton that exist in all eukaryotic cells and are highly conserved. Tubulin plays important roles in the maintenance of cell morphology, intracellular material transport, cell activity, signal transduction, and cell division during plant growth and development [36]. During cell division, tubulin is crucial in determining the location of cell division and promoting the separation of the nucleus. Additionally, tubulin can affect cellulose deposition by changing its orientation, thus inhibiting cell elongation [42,43,44,45]. In rice, the arrangement of cortical microtubules in the OsTubA1 mutant wg4-D is altered, leading to smaller and shorter cells in the outer lemma, resulting in increased grain width and decreased grain length and 1000-grains weight [46]. Overexpression of the microtubule-associated protein ZmRPH1 from the QWRF family in maize results in shorter and broader mesocotyls, reduced plant height, and decreased root length [47].
In this study, we conducted a phenotypic assessment of a ZmGCP2 mutant with the premature termination of transcription. The findings showed no significant difference in ML between the homozygous mutant and wild type; however, both PL and SL were significantly reduced. The QTL related to ZmGCP2 in the GWAS accounted for approximately 11.81% of the variation in PL and a slightly lower contribution to ML (approximately 8.52%). Therefore, a lower effect may have led to a lack of significant changes in the mesocotyl phenotype of the mutant. Additionally, the plumule cell length was significantly shorter than in wild-type B73 cells. Therefore, we consider ZmGCP2 a candidate gene for PL and SL, likely altering PL through its effect on cell elongation, thereby affecting SL.
Numerous studies have successfully identified superior allelic variants of relevant genes through candidate gene association analyses, which have been integrated into various genetic backgrounds, demonstrating their potential utility in breeding [25,48,49]. In this study, we conducted a candidate gene association analysis of the key gene ZmGCP2 identified in our GWAS. The results showed that Hap1 was the superior haplotype that influenced PL and SL, and S_18026077-A was the superior allelic variation for controlling PL and SL. Moreover, we observed a high prevalence of the SS group within Hap1, followed by the SPT hybrid advantage group in China, with that of the NSS group and other groups being very limited. These findings led us to hypothesize that this gene has undergone selection during maize improvement and produces a favorable Hap1 allele that may be useful and suitable for modern breeding programs for maize improvement.
4. Materials and Methods
4.1. Plant Materials and Growth Conditions
The plant materials used in this study included a maize-association population and EMS mutants. The association population was composed of 255 maize inbred lines, which were used to assess deep-sowing tolerance-related traits in our GWAS. These lines were kindly provided by Professor Zuxin Zhang of Huazhong Agricultural University, Wuhan, China. The pedigree and source information of inbred lines in the association population was listed in Table S4. The association population was planted in three different environments: 20CZ (2020 Chongzhou, Sichuan), 20YN (2020 Xishuangbanna, Yunnan), and 21CZ (2021 Chongzhou, Sichuan). Each line was harvested at full maturity and subsequently used for measuring deep-sowing tolerance-related traits after sufficient drying. The EMS mutants were obtained from the maizeEMSDB mutant library (http://maizeems.qlnu.edu.cn/, accessed on 18 March 2022) [50] and cultivated on a farm at Sichuan Agricultural University, Chongzhou, Sichuan.
4.2. Phenotyping and Statistical Analysis
In the present study, 18 seeds of similar size and disease-free status were selected from each of the 255 maize inbred lines. The seeds were soaked in sterile water for 24 h and then wrapped into rolls in germination paper (Anchor Paper, St. Paul, MN, USA) following the methodology described by Abdel et al. [51]. Briefly, six seeds were placed 6 cm away from the top edge of a double layer of germination papers that had been pre-moistened with sterile water. Seeds were placed 3.5 cm apart and 3.5 cm from the left and right edges, covered with another germination paper, and then wrapped into rolls about 5 cm thick and secured with a rubber band. The rolls were placed vertically in black plastic containers filled with 500 mL of sterile water, and each container was covered with a black plastic bag to ensure darkness and minimize moisture loss. The containers were placed in an incubator at 26 °C with 65% relative humidity in darkness for 8 d. Then, the ML, CL, PL, SL, and PRL of each line were measured three times.
Descriptive statistical analyses of each trait, including range, mean, standard deviation (SD), coefficient of variation (CV), skewness, and kurtosis, were performed using IBM SPSS Statistics 26 software. Broad-sense heritability was calculated using the lme4 package in R (version 4.2.2) with the following Equation (1):
where Vg is the variance of genotype, Ve is the variance of residual, Vge is the interaction of genotype and environment variance, Vgy is the interaction of genotype and year variance, L is the number of environments, Y is the number of years, YRL is number of years × number of repeats × number of environments, and H2 is the broad-sense heritability of a trait. Correlations between traits were analyzed and visualized using the GGally extension (version 2.2.0) of ggplot2 (version 3.4.4). Other statistical analyses and visualizations were performed using the GraphPad Prism 8 software.
4.3. SNP Genotyping
DNA extraction and library construction for sequencing were performed by Chengdu Tiancheng Future Technology Co., Ltd., Chengdu, China. The sequencing results were aligned to the B73 RefGen_v4 (https://download.maizegdb.org/Zm-B73-REFERENCE-GRAMENE-4.0/Zm-B73-REFERENCE-GRAMENE-4.0.fa.gz, accessed on 16 March 2021) reference genome using BWA software (version 0.7.17-r1188) for indexing. Each sequencing file was mapped, and the format was converted using SAMtools (version 1.7). SNP calling was performed using BCFtools (version 1.9) and multiple VCF files were merged. Finally, VCFtools (version 0.1.16) was used to filter out SNPs with a minor allele frequency < 0.05, missing rate > 20%, or heterozygosity > 30%.
4.4. LD and Structure Analysis
FastStructure was used for structural analysis, with K values ranging from 1 to 10 [52]. The ggplot2 (version 3.4.4) package in R (version 4.2.2) was used to generate stacked plots of the associated population structure. The most probable number of groups was determined by calculating the ΔK value with STRUCTURE 2.3.4 software [53]. Genetic distances between lines were calculated using the SNPhylo package (version 20180901) [54] and the resulting tree files were imported into the ITOL website (https://itol.embl.de/, accessed on 9 March 2024) for visualization. According to the ∆K calculation results, and coupled with breeding experience and pedigree information, the associated population was divided into different groups [55,56,57]. The LD analysis of SNP markers across the chromosomes was performed using PopLDdecay (version 3.42) [58]. The LD decay distance was defined as the interval containing an r2 value of less than 0.1 (LD = 10 kb).
4.5. GWAS
The GWAS was conducted using the FarmCPU model within the rMVP package (version 1.0.6) in R (version 4.2.2) [59], with a significance threshold of p = 1 × 10⁻⁵. Significant SNPs identified in at least two environments were referred to as co-located SNPs. The LD region (10 kb) around the co-located SNPs was defined as a QTL, and the QTLs that overlapped and were related to the same trait were combined into a single QTL. All gene models within the LD = 10kb regions of significant SNPs were identified as initial candidate genes from the GWAS. Candidate genes were functionally annotated by referring to B73 RefGen V4 in MaizeGDB (https://www.maizegdb.org/, accessed on 2 January 2024).
4.6. Gene Expression Patterns Analysis
We used reported expression data to analyze the expression patterns of candidate genes Zm00001d002644 and zma-MIR171h. The expression data for Zm00001d002644 were obtained from Schaefer et al. [40], and the expression data for zma-MIR171h were downloaded from the website https://www.pmiren.com/ (accessed on 15 May 2024) [41].
4.7. Candidate Gene Association Study
The BLUE value of the traits was used to conduct a candidate gene association analysis of SNPs within the CDS and 2000 bp upstream/downstream regions of a candidate gene. In the candidate gene association analysis, the General Linear Model available in TASSEL 5.0 [60] was used. The significance threshold was set to p = 1/N, where N represents the number of markers within a specified range. The haplotypes were divided according to the allele type of the significant SNPs. Subsequently, a Student’s t-test was conducted to evaluate the phenotypic variations among these haplotypes, enabling the identification of the most advantageous haplotype. Statistical significance was set at p < 0.05.
4.8. Cell Observation
The plumule cells were stained with calcofluor white (SL7204; Coolaber Technology Co., Ltd., Beijing, China) and observed under blue light excitation; calcofluor white is a nonspecific fluorescent stain that binds to cellulose and chitin in the cell walls of fungi and other organisms. Briefly, a 1 cm section was taken from the middle of uniformly growing plumules (the first true leaf) and placed on a microscope slide. A drop of the calcofluor white stain was added, and a drop of 10% potassium hydroxide was applied before the slide was covered with a coverslip. After staining for 1 min, cells were directly observed and photographed under a fluorescence microscope (CKX53; Olympus Corporation, Tokyo, Japan). The length of the cells was measured using ImageJ software (version 1.53a). Each sample involved measurements of no fewer than 30 cells, with at least three biological replicates used for statistical analysis.
5. Conclusions
In this study, 255 maize inbred lines were used to perform a GWAS on traits related to deep-sowing tolerance. We identified 23, 6, 4, and 4 QTLs associated with ML, CL, PL, and SL, respectively, and co-localized a candidate gene, ZmGCP2, which was significantly associated with ML, PL, and SL. Subsequent functional validation of ZmGCP2 in maize EMS mutants suggested that ZmGCP2 likely alters PL through its effect on cell elongation, thereby affecting SL. Additionally, we identified superior haplotypes and allelic variations of ZmGCP2 with a longer PL and SL, which may be useful for breeding varieties with deep-sowing tolerance to improve maize cultivation.
Supplementary Materials
The following supporting information can be downloaded at: https://www.mdpi.com/article/10.3390/plants13111533/s1, Figure S1: Pearson correlation analysis of both deep-sowing tolerance-related traits and grain traits; Figure S2: Q-Q plots of the GWAS for deep-sowing tolerance-related traits; Figure S3: Circular Manhattan and Q-Q plots of the GWAS for PRL; Figure S4: Expression pattern analysis of the candidate genes; Table S1: Variance analysis for deep-sowing tolerance-related traits in association populations under three environments; Table S2: QTLs identified in association population by a GWAS; Table S3: List of candidate genes; Table S4: Pedigree and source information of inbred lines in association population.
Author Contributions
Conceptualization, Y.H. (Yubi Huang) and K.H.; methodology, J.Y., Z.L., and Y.L. (Yanbo Liu); software, J.Y. and Z.L.; validation, J.Y., Y.L. (Yangping Li) and Y.H. (Yufeng Hu); investigation, J.Y., Z.L., Y.L. (Yanbo Liu), X.F. and L.G.; data curation, J.Y., Z.L. and Y.L. (Yanbo Liu); writing—original draft preparation, J.Y.; writing—review and editing, Y.L. (Yangping Li) and Y.H. (Yufeng Hu); visualization, J.Y. and Z.L.; supervision, Y.H. (Yubi Huang) and K.H.; funding acquisition, Y.H. (Yubi Huang). All authors have read and agreed to the published version of the manuscript.
Funding
This research was funded by the National Key R&D Program of China (2021YFD1200701), the Natural Science Foundation of Sichuan Province (2022NSFSC0150), and the Natural Science Funding Youth Project of Sichuan Province (2022NSFSC1622).
Data Availability Statement
The data presented in this study are available on request from the corresponding author. The data are not publicly available due to restrictions on protected maize lines.
Acknowledgments
We thank Zuxin Zhang of Huazhong Agricultural University for providing the maize association population used in this study. We would also like to express our sincere gratitude to Jingye Fu of Sichuan Agricultural University for her valuable comments, which have greatly improved this manuscript.
Conflicts of Interest
Author Kun Hu is employed by the company “Sinograin Chengdu Storage Research Institute Co., Ltd., Chengdu, China”. The remaining authors declare that the research was conducted in the absence of any commercial or financial relationships that could be construed as a potential conflict of interest.
Abbreviations
| Iodent | Iowa Experiment Station Reid Yellow Dent |
| NSS | Non-Stiff Stalk |
| PA | Group A germplasm derived from modern U.S. hybrids |
| PB | Group B germplasm derived from modern U.S. hybrids |
| SPT | Si Ping Tou |
| SS | Stiff Stalk |
References
- Hubert, B.; Rosegrant, M.; van Boekel, M.A.; Ortiz, R. The Future of Food: Scenarios for 2050. Crop Sci. 2010, 50, 33–50. [Google Scholar] [CrossRef]
- Wang, Y.Z.; Liu, Z.Q.; Wang, G.Q.; Li, Y. Investigation on Relationship between High Yield and Population’s Uniformity in Maize. J. Maize Sci. 2000, 8, 43–45. [Google Scholar]
- Feng, P.; Wang, B.; Harrison, M.T.; Wang, J.; Liu, K.; Huang, M.; Liu, D.L.; Yu, Q.; Hu, K. Soil Properties Resulting in Superior Maize Yields upon Climate Warming. Agron. Sustain. Dev. 2022, 42, 85. [Google Scholar] [CrossRef]
- Fahad, S.; Bajwa, A.A.; Nazir, U.; Anjum, S.A.; Farooq, A.; Zohaib, A.; Sadia, S.; Nasim, W.; Adkins, S.; Saud, S.; et al. Crop Production under Drought and Heat Stress: Plant Responses and Management Options. Front. Plant Sci. 2017, 8, 1147. [Google Scholar] [CrossRef] [PubMed]
- Du, L.; Jiang, H.; Zhao, G.; Ren, J. Gene Cloning of ZmMYB59 Transcription Factor in Maize and Its Expression during Seed Germination in Response to Deep-sowing and Exogenous Hormones. Plant Breed. 2017, 136, 834–844. [Google Scholar] [CrossRef]
- Grzybowski, M.; Adamczyk, J.; Jończyk, M.; Sobkowiak, A.; Szczepanik, J.; Frankiewicz, K.; Fronk, J.; Sowiński, P. Increased Photosensitivity at Early Growth as a Possible Mechanism of Maize Adaptation to Cold Springs. J. Exp. Bot. 2019, 70, 2887–2904. [Google Scholar] [CrossRef] [PubMed]
- Shi, J.; Zhao, X.Q.; Niu, Y.N.; Chen, X.Y.; Ren, X.W. Brassinosteroid Affects the Elongation of Mesocotyl and Coleoptile in Zea mays L. by Regulating the Network of Circadian Rhythm under Severe Stress. Russ. J. Plant Physiol. 2022, 69, 90. [Google Scholar] [CrossRef]
- Leng, B.; Li, M.; Mu, C.; Yan, Z.; Yao, G.; Kong, X.; Ma, C.; Zhang, F.; Liu, X. Molecular Mechanism of Gibberellins in Mesocotyl Elongation Response to Deep-Sowing Stress in Sweet Maize. Curr. Issues Mol. Biol. 2022, 45, 197–211. [Google Scholar] [CrossRef] [PubMed]
- Yang, Y.; Ma, Y.; Liu, Y.; Lyle, D.; Li, D.; Wang, P.; Xu, J.; Zhen, S.; Lu, J.; Peng, Y.; et al. Dissecting the Genetic Basis of Maize Deep-sowing Tolerance by Combining Association Mapping and Gene Expression Analysis. J. Integr. Agric. 2022, 21, 1266–1277. [Google Scholar] [CrossRef]
- Zhong, G.; Bai, Y.; Meng, J. Application and Development of New Maize Varieties with Drought Resistance, Deep-sowing Tolerance and Higher Yield. J. Maize Sci. 1998, 6, 29–31. [Google Scholar]
- Troyer, A.F. The Location of Genes Governing Long First Internode of Corn. Genetics 1997, 145, 1149–1154. [Google Scholar] [CrossRef] [PubMed]
- Zhao, G.W.; Wang, J.H. Effect of Gibberellin and Uniconazole on Mesocotyl Elongation of Dark-Grown Maize under Different Seeding Depths. Plant Prod. Sci. 2015, 11, 423–429. [Google Scholar] [CrossRef]
- Hoshikawa, K. Underground Organs of the Seedlings and the Systematics of Gramineae. Bot. Gaz. 1969, 130, 192–203. [Google Scholar] [CrossRef]
- Dungan, G.H. Response of Corn to Extremely Deep Planting. Agron. J. 1950, 42, 256–257. [Google Scholar] [CrossRef]
- Zhao, G.W.; Ma, P.; Wang, J.H.; Wang, G.Y. Identification of Deep-seeding Tolerance in Different Maize Inbred Lines and Their Physiological Response to Deep-seeding Condition. J. Maize Sci. 2009, 17, 9–13. [Google Scholar]
- Zhao, X.Q.; Niu, Y.N.; Hossain, Z.; Shi, J.; Mao, T.T.; Bai, X.D. Integrated QTL Mapping, Meta-Analysis, and RNA-Sequencing Reveal Candidate Genes for Maize Deep-Sowing Tolerance. Int. J. Mol. Sci. 2023, 24, 6770. [Google Scholar] [CrossRef] [PubMed]
- Zhang, H.; Ma, P.; Zhao, Z.; Zhao, G.; Tian, B.; Wang, J.; Wang, G. Mapping QTL Controlling Maize Deep-seeding Tolerance-related Traits and Confirmation of a Major QTL for Mesocotyl Length. Theor. Appl. Genet. 2012, 124, 223–232. [Google Scholar] [CrossRef] [PubMed]
- Copeland, L.O.; McDonald, M.B. Seed Vigor and Vigor Testing; Copeland, L.O., McDonald, M.B., Eds.; Springer: Berlin/Heidelberg, Germany, 2001; pp. 165–191. ISBN 978-1-4615-1619-4. [Google Scholar]
- Lee, H.; Sasaki, K.; Kang, J.; Sato, T.; Song, W.Y.; Ahn, S.N. Mesocotyl Elongation is Essential for Seedling Emergence under Deep-Seeding Condition in Rice. Rice 2017, 10, 32. [Google Scholar] [CrossRef]
- Lee, H.; Sasaki, K.; Higashitani, A.; Ahn, S.N.; Sato, T. Mapping and Characterization of Quantitative Trait Loci for Mesocotyl Elongation in Rice (Oryza sativa L.). Rice 2012, 5, 13. [Google Scholar] [CrossRef]
- Wu, J.; Feng, F.; Lian, X.; Teng, X.; Wei, H.; Yu, H.; Xie, W.; Yan, M.; Fan, P.; Li, Y.; et al. Genome-wide Association Study (GWAS) of Mesocotyl Elongation based on Re-sequencing Approach in Rice. BMC Plant Biol. 2015, 15, 218. [Google Scholar] [CrossRef]
- Zhao, Y.; Zhao, W.; Jiang, C.; Wang, X.; Xiong, H.; Todorovska, E.G.; Yin, Z.; Chen, Y.; Wang, X.; Xie, J.; et al. Genetic Architecture and Candidate Genes for Deep-Sowing Tolerance in Rice Revealed by Non-syn GWAS. Front. Plant Sci. 2018, 9, 332. [Google Scholar] [CrossRef] [PubMed]
- Xiong, Q.; Ma, B.; Lu, X.; Huang, Y.H.; He, S.J.; Yang, C.; Yin, C.C.; Zhao, H.; Zhou, Y.; Zhang, W.K.; et al. Ethylene-Inhibited Jasmonic Acid Biosynthesis Promotes Mesocotyl/Coleoptile Elongation of Etiolated Rice Seedlings. Plant Cell 2017, 29, 1053–1072. [Google Scholar] [CrossRef] [PubMed]
- Sun, S.; Wang, T.; Wang, L.; Li, X.; Jia, Y.; Liu, C.; Huang, X.; Xie, W.; Wang, X. Natural Selection of a GSK3 Determines Rice Mesocotyl Domestication by Coordinating Strigolactone and Brassinosteroid Signaling. Nat. Commun. 2018, 9, 2523. [Google Scholar] [CrossRef] [PubMed]
- Lv, Y.; Shao, G.; Jiao, G.; Sheng, Z.; Xie, L.; Hu, S.; Tang, S.; Wei, X.; Hu, P. Targeted Mutagenesis of POLYAMINE OXIDASE 5 that Negatively Regulates Mesocotyl Elongation Enables the Generation of Direct-seeding Rice with Improved Grain Yield. Mol. Plant 2021, 14, 344–351. [Google Scholar] [CrossRef] [PubMed]
- Liu, H.; Zhang, L.; Wang, J.; Li, C.; Zeng, X.; Xie, S.; Zhang, Y.; Liu, S.; Hu, S.; Wang, J.; et al. Quantitative Trait Locus Analysis for Deep-Sowing Germination Ability in the Maize IBM Syn10 DH Population. Front. Plant Sci. 2017, 8, 813. [Google Scholar] [CrossRef] [PubMed]
- Wang, Y.; He, J.; Ye, H.; Ding, M.; Xu, F.; Wu, R.; Zhao, F.; Zhao, G. Transcriptome Analysis Revealed the Key Genes and Pathways Involved in Seed Germination of Maize Tolerant to Deep-Sowing. Plants 2022, 11, 359. [Google Scholar] [CrossRef] [PubMed]
- Yan, J.; Warburton, M.; Crouch, J. Association Mapping for Enhancing Maize (Zea mays L.) Genetic Improvement. Crop Sci. 2011, 51, 433–449. [Google Scholar] [CrossRef]
- Yang, Q.; Zhang, D.; Xu, M. A Sequential Quantitative Trait Locus Fine-Mapping Strategy Using Recombinant-Derived Progeny. J. Integr. Plant Biol. 2012, 54, 228–237. [Google Scholar] [CrossRef] [PubMed]
- Li, H.; Peng, Z.; Yang, X.; Wang, W.; Fu, J.; Wang, J.; Han, Y.; Chai, Y.; Gou, T.; Yang, N.; et al. Genome-wide Association Study Dissects the Genetic Architecture of Oil Biosynthesis in Maize Kernels. Nat. Genet. 2013, 45, 43–50. [Google Scholar] [CrossRef]
- Zhang, H.; Zhang, J.; Xu, Q.; Wang, D.; Di, H.; Huang, J.; Yang, X.; Wang, Z.; Zhang, L.; Dong, L.; et al. Identification of Candidate Tolerance Genes to Low-temperature During Maize Germination by GWAS and RNA-seq Approaches. BMC Plant Biol. 2020, 20, 333. [Google Scholar] [CrossRef]
- Zhang, Y.; Hu, Y.; Guan, Z.; Liu, P.; He, Y.; Zou, C.; Li, P.; Gao, S.; Peng, H.; Yang, C.; et al. Combined Linkage Mapping and Association Analysis Reveals Genetic Control of Maize Kernel Moisture Content. Physiol. Plant. 2020, 170, 508–518. [Google Scholar] [CrossRef] [PubMed]
- Rafalski, J.A. Association Genetics in Crop Improvement. Curr. Opin. Plant Biol. 2010, 13, 174–180. [Google Scholar] [CrossRef] [PubMed]
- Zhu, C.; Gore, M.; Buckler, E.S.; Yu, J. Status and Prospects of Association Mapping in Plants. Plant Genome 2008, 1, 5–20. [Google Scholar] [CrossRef]
- Wang, X.; Wang, H.; Liu, S.; Ferjani, A.; Li, J.; Yan, J.; Yang, X.; Qin, F. Genetic variation in ZmVPP1 contributes to drought tolerance in maize seedlings. Nat. Genet. 2016, 48, 1233–1241. [Google Scholar] [CrossRef] [PubMed]
- Wasteneys, G.O.; Yang, Z. New Views on the Plant Cytoskeleton. Plant Physiol. 2004, 136, 3884–3891. [Google Scholar] [CrossRef] [PubMed]
- Li, Z.; Zhang, X.; Liu, X.; Zhao, Y.; Wang, B.; Zhang, J. MiRNA Alterations are Important Mechanism in Maize Adaptations to Low-phosphate Environments. Plant Sci. 2016, 252, 103–117. [Google Scholar] [CrossRef]
- Teng, L.; Zhang, X.; Wang, R.; Lin, K.; Zeng, M.; Chen, H.; Cao, F. MiRNA Transcriptome Reveals Key MiRNAs and Their Targets Contributing to the Difference in Cd Tolerance of Two Contrasting Maize Genotypes. Ecotoxicol. Environ. Saf. 2023, 256, 114881. [Google Scholar] [CrossRef] [PubMed]
- Qu, Q.; Liu, N.; Su, Q.; Liu, X.; Jia, H.; Liu, Y.; Sun, M.; Cao, Z.; Dong, J. MicroRNAs Involved in the Trans-kingdom Gene Regulation in the Interaction of Maize Kernels and Fusarium verticillioides. Int. J. Biol. Macromol. 2023, 242, 125046. [Google Scholar] [CrossRef]
- Stelpflug, S.C.; Sekhon, R.S.; Vaillancourt, B.; Hirsch, C.N.; Buell, C.R.; de Leon, N.; Kaeppler, S.M. An Expanded Maize Gene Expression Atlas based on RNA Sequencing and its Use to Explore Root Development. Plant Genome 2016, 9, 1–16. [Google Scholar] [CrossRef]
- Guo, Z.; Kuang, Z.; Wang, Y.; Zhao, Y.; Tao, Y.; Cheng, C.; Yang, J.; Lu, X.; Hao, C.; Wang, T.; et al. PmiREN: A comprehensive encyclopedia of plant miRNAs. Nucleic Acids Res. 2020, 48, D1114–D1121. [Google Scholar] [CrossRef]
- Schaefer, E.; Belcram, K.; Uyttewaal, M.; Duroc, Y.; Goussot, M.; Legland, D.; Laruelle, D.; de Tauzia-Moreau, M.L.; Pastuglia, M.; Bouchez, D. The Preprophase Band of Microtubules Controls the Robustness of Division Orientation in Plants. Science 2017, 356, 186–189. [Google Scholar] [CrossRef] [PubMed]
- Roudier, F.; Fernandez, A.G.; Fujita, M.; Himmelspach, R.; Borner, G.H.; Schindelman, G.; Song, S.; Baskin, T.I.; Dupree, P.; Wasteneys, G.O.; et al. COBRA, an Arabidopsis Extracellular Glycosyl-phosphatidyl Inositol-anchored Protein, Specifically Controls Highly Anisotropic Expansion through Its Involvement in Cellulose Microfibril Orientation. Plant Cell 2005, 17, 1749–1763. [Google Scholar] [CrossRef] [PubMed]
- Chan, J. Microtubule and Cellulose Microfibril Orientation during Plant Cell and Organ Growth. J. Microsc. 2012, 247, 23–32. [Google Scholar] [CrossRef] [PubMed]
- Yoshikawa, M.; Yang, G.; Kawaguchi, K.; Komatsu, S. Expression Analyses of [beta]-tubulin Isotype Genes in Rice. Plant Cell Physiol. 2003, 44, 1202–1207. [Google Scholar] [CrossRef] [PubMed]
- Liu, Y.; Guo, L.; Qu, G.; Xiang, Y.; Zhao, X.; Yuan, H.; Li, T.; Kang, L.; Tang, S.; Tu, B.; et al. Wide grain 4, Encoding an Alpha-tubulin, Regulates Grain Size by Affecting Cell Expansion in Rice. Crop J. 2023, 11, 1931–1936. [Google Scholar] [CrossRef]
- Li, W.; Ge, F.; Qiang, Z.; Zhang, S.; Chen, L.; Wang, X.; Li, J.; Fu, Y. Maize ZmRPH1 Encodes a Microtubule-associated Protein that Controls Plant and Ear Height. Plant Biotechnol. J. 2020, 18, 1345–1347. [Google Scholar] [CrossRef] [PubMed]
- Yan, P.; Du, Q.; Chen, H.; Guo, Z.; Wang, Z.; Tang, J.; Li, W.X. Biofortification of Iron Content by Regulating a NAC Transcription Factor in Maize. Science 2023, 382, 1159–1165. [Google Scholar] [CrossRef] [PubMed]
- Liu, C.L.; Gao, Z.Y.; Shang, L.G.; Yang, C.H.; Ruan, B.P.; Zeng, D.L.; Guo, L.B.; Zhao, F.J.; Huang, C.F.; Qian, Q. Natural Variation in the Promoter of OsHMA3 Contributes to Differential Grain Cadmium Accumulation between Indica and Japonica Rice. J. Integr. Plant Biol. 2020, 62, 314–329. [Google Scholar] [CrossRef] [PubMed]
- Lu, X.; Liu, J.; Ren, W.; Yang, Q.; Chai, Z.; Chen, R.; Wang, L.; Zhao, J.; Lang, Z.; Wang, H.; et al. Gene-Indexed Mutations in Maize. Mol. Plant 2018, 11, 496–504. [Google Scholar] [CrossRef]
- Abdel-Ghani, A.H.; Sanchez, D.L.; Kumar, B.; Lubberstedt, T. Paper Roll Culture and Assessment of Maize Root Parameters. Bio Protoc. 2016, 6, e1926. [Google Scholar] [CrossRef]
- Raj, A.; Stephens, M.; Pritchard, J.K. fastSTRUCTURE: Variational Inference of Population Structure in Large SNP Data Sets. Genetics 2014, 197, 573–589. [Google Scholar] [CrossRef] [PubMed]
- Evanno, G.; Regnaut, S.; Goudet, J. Detecting the Number of Clusters of Individuals Using the Software STRUCTURE: A Simulation Study. Mol. Ecol. 2005, 14, 2611–2620. [Google Scholar] [CrossRef] [PubMed]
- Lee, T.; Guo, H.; Wang, X.; Kim, C.; Paterson, A.H. SNPhylo: A Pipeline to Construct a Phylogenetic Tree from Huge SNP Data. BMC Genomics 2014, 15, 162. [Google Scholar] [CrossRef] [PubMed]
- Zhang, X.; Zhang, H.; Li, L.; Lan, H.; Ren, Z.; Liu, D.E.; Wu, L.; Liu, H.; Jaqueth, J.; Li, B.; et al. Characterizing the Population Structure and Genetic Diversity of Maize Breeding Germplasm in Southwest China using Genome-wide SNP Markers. BMC Genomics 2016, 17, 697. [Google Scholar] [CrossRef]
- Yang, X.; Gao, S.; Xu, S.; Zhang, Z.; Prasanna, B.M.; Li, L.; Li, J.; Yan, J. Characterization of a Global Germplasm Collection and Its Potential Utilization for Analysis of Complex Quantitative Traits in Maize. Mol. Breed. 2011, 28, 511–526. [Google Scholar] [CrossRef]
- Wang, B.; Hou, M.; Shi, J.; Ku, L.; Song, W.; Li, C.; Ning, Q.; Li, X.; Li, C.; Zhao, B.; et al. De Novo Genome Assembly and Analyses of 12 Founder Inbred Lines Provide Insights into Maize Heterosis. Nat. Genet. 2023, 55, 312–323. [Google Scholar] [CrossRef]
- Zhang, C.; Dong, S.; Xu, J.; He, W.M.; Yang, T.L. PopLDdecay: A Fast and Effective Tool for Linkage Disequilibrium Decay Analysis Based on Variant Call Format Files. Bioinformatics 2019, 35, 1786–1788. [Google Scholar] [CrossRef] [PubMed]
- Yin, L.; Zhang, H.; Tang, Z.; Xu, J.; Yin, D.; Zhang, Z.; Yuan, X.; Zhu, M.; Zhao, S.; Li, X.; et al. rMVP: A Memory-efficient, Visualization-enhanced, and Parallel-accelerated Tool for Genome-wide Association Study. Genom. Proteom. Bioinform. 2021, 19, 619–628. [Google Scholar] [CrossRef]
- Bradbury, P.J.; Zhang, Z.; Kroon, D.E.; Casstevens, T.M.; Ramdoss, Y.; Buckler, E.S. TASSEL: Software for Association Mapping of Complex Traits in Diverse Samples. Bioinformatics 2007, 23, 2633–2635. [Google Scholar] [CrossRef]

Disclaimer/Publisher’s Note: The statements, opinions and data contained in all publications are solely those of the individual author(s) and contributor(s) and not of MDPI and/or the editor(s). MDPI and/or the editor(s) disclaim responsibility for any injury to people or property resulting from any ideas, methods, instructions or products referred to in the content. |
© 2024 by the authors. Licensee MDPI, Basel, Switzerland. This article is an open access article distributed under the terms and conditions of the Creative Commons Attribution (CC BY) license (https://creativecommons.org/licenses/by/4.0/).