Abstract
Triadica sebifera is an important landscaping tree species because of its colorful autumn leaves. In recent years, some cultivars have been bred and licensed, but it can be difficult to identify them from their morphological traits due to their similar phenotypes. To explore the genetic relationships and construct a fingerprint of the cultivars, the licensed T. sebifera cultivars were analyzed using SSR markers. A total of 179 alleles were identified among the 21 cultivars at 16 SSR loci, and these alleles exhibited a high level of genetic diversity (He = 0.86). The genetic variations mainly occurred among cultivars based on an analysis of molecular variance (AMOVA). According to phylogenetic analysis, principal coordinate analysis (PCoA), and Bayesian clustering analysis, the genetic relationships were independent of geographic distances, which may be mainly due to transplantations between regions. Some cultivars with different leaf colors showed obvious genetic differentiation and may be preliminary candidates for cross-breeding. Finally, the fingerprint for the licensed cultivars was constructed with two SSR markers. The results of this study can provide technical support for the application and legal protection of licensed Triadica sebifera cultivars.
1. Introduction
Triadica sebifera is a native tree species of China and is mainly distributed in areas south of the Qinling Mountains and Huaihe River [1]. The seeds have been used for candles, heating oils, and cocoa butter equivalents since the late 1980s [2,3,4]. The leaves and roots can be used for herbal medicines [5]. In addition, T. sebifera is also an important tree with colored leaves and is often used in landscaping. The colors of T. sebifera leaves in autumn are relatively diverse, such as purple, red, orange, and yellow. In recent years, ornamental T. sebifera breeding has been carried out, and some ornamental colored cultivars have been developed [6,7]. There are 21 licensed T. sebifera cultivars in China with different autumn colors and different leaf traits, and these cultivars are also valuable materials for breeding. In general, the parents and the genetic characteristics of the germplasm are very important for ensuring that the target material or gene is passed on through breeding [8]. However, T. sebifera cultivars have mainly been derived from natural crosses, and their genetic backgrounds and relationships are also unclear, which is not conducive to the selection of desirable parents for cross-breeding [9]. Moreover, some cultivars also have similar phenotypes due to their closely related origins, and it is difficult to distinguish them based on morphological traits with obvious seasonal variations. Hence, there are homonyms (different cultivars with the same name) and synonyms (the same cultivar with different names) [10]. In order to apply and protect these cultivars, several questions remain to be resolved, such as the following: What are the genetic relationships and variations among the different T. sebifera cultivars? How can they be precisely identified without seasonal or locational limitations?
DNA-based molecular markers, including random amplified polymorphic DNA (RAPD) [11], intersimple sequence repeat (ISSR) [12], simple sequence repeat (SSR) [13], and single nucleotide polymorphism (SNP) [14], have been used for genetic analysis over the past several decades. Notably, SSRs are more consistent than RAPD, more polymorphic than ISSRs, and more easily genotyped than SNPs, and have been used in the analysis of genetic relationships and in the genetic identification of plants [15,16,17]. DNA fingerprinting is a molecular approach for identifying different cultivars [18]. To date, a series of fingerprinting databases based on SSRs have been established for plant species such as Ginkgo biloba [19], Ailanthus altissima [20], Asparagus officinalis [21], and Juglans regia [22]. These databases are important for cultivar identification and protection of cultivar rights. To date, studies on T. sebifera have focused mainly on phylogenetic relationships, chemical components, and biological activity [2,23,24]. In terms of molecular markers, several SSR markers have been developed and applied in the genetic analysis of T. sebifera populations [1,25,26,27]. Hence, SSR markers may be an effective method to study the genetic relationship and fingerprinting of T. sebifera cultivars.
In this study, SSR markers were selected for the genetic analysis of T. sebifera cultivars. The aim of this study was not only to explore the genetic diversity and genetic differentiation of T. sebifera cultivars but also to construct molecular fingerprinting for the cultivars. The findings of this study can guide the selection of ideal parents for T. sebifera breeding and can provide a technical basis for the protection of cultivar rights.
2. Results
2.1. Genetic Diversity
A total of 179 alleles were detected among the 16 SSR loci, ranging from 7 to 19. The average expected heterozygosity (He) and Shannon’s information index (I) were 0.86 and 2.12, respectively (Table 1). The SSR08 locus had the highest He (0.96), I (2.85), and polymorphism information content (PIC = 0.94) values, which revealed more abundant genetic information than the other loci. There were fewer alleles detected at SSR03 (7) and SSR14 (8) than at the other loci (9~19), and the level of genetic diversity at these two loci was lower than that at the other loci. There was a high proportion of T. sebifera homozygotes at 16 SSR loci. The observed heterozygosity (Ho) at 12 pairs of SSR loci was 0, while the Ho at the other 4 loci was much lower than the He.

Table 1.
Results of the genetic analysis of the 16 SSR loci.
The genetic diversity of the T. sebifera cultivars differed among regions (Table 2). The number of cultivars varied among different regions, and genetic diversity was abundant in regions with a high number of cultivars. There were more cultivars from Jiangsu (8) than from the other areas (2~7), and these cultivars had the highest number of alleles (Na = 6.13), He (0.84), I (1.68), and allelic richness (AR = 3.15) values. There were only two cultivars from Hubei, and their genetic diversity was lower than that of the cultivars from the other areas.
Table 2.
Genetic diversity of the cultivars from different regions.
2.2. Genetic Differentiation
Analysis of molecular variance (AMOVA) revealed significant genetic variation among regions, among cultivars and within cultivars (Table 3; p < 0.01). Most of the genetic variations were detected among cultivars (88%). There was only 4% and 8% genetic variation among regions and within cultivars, respectively.
Table 3.
AMOVA of 21 cultivars from 4 regions.
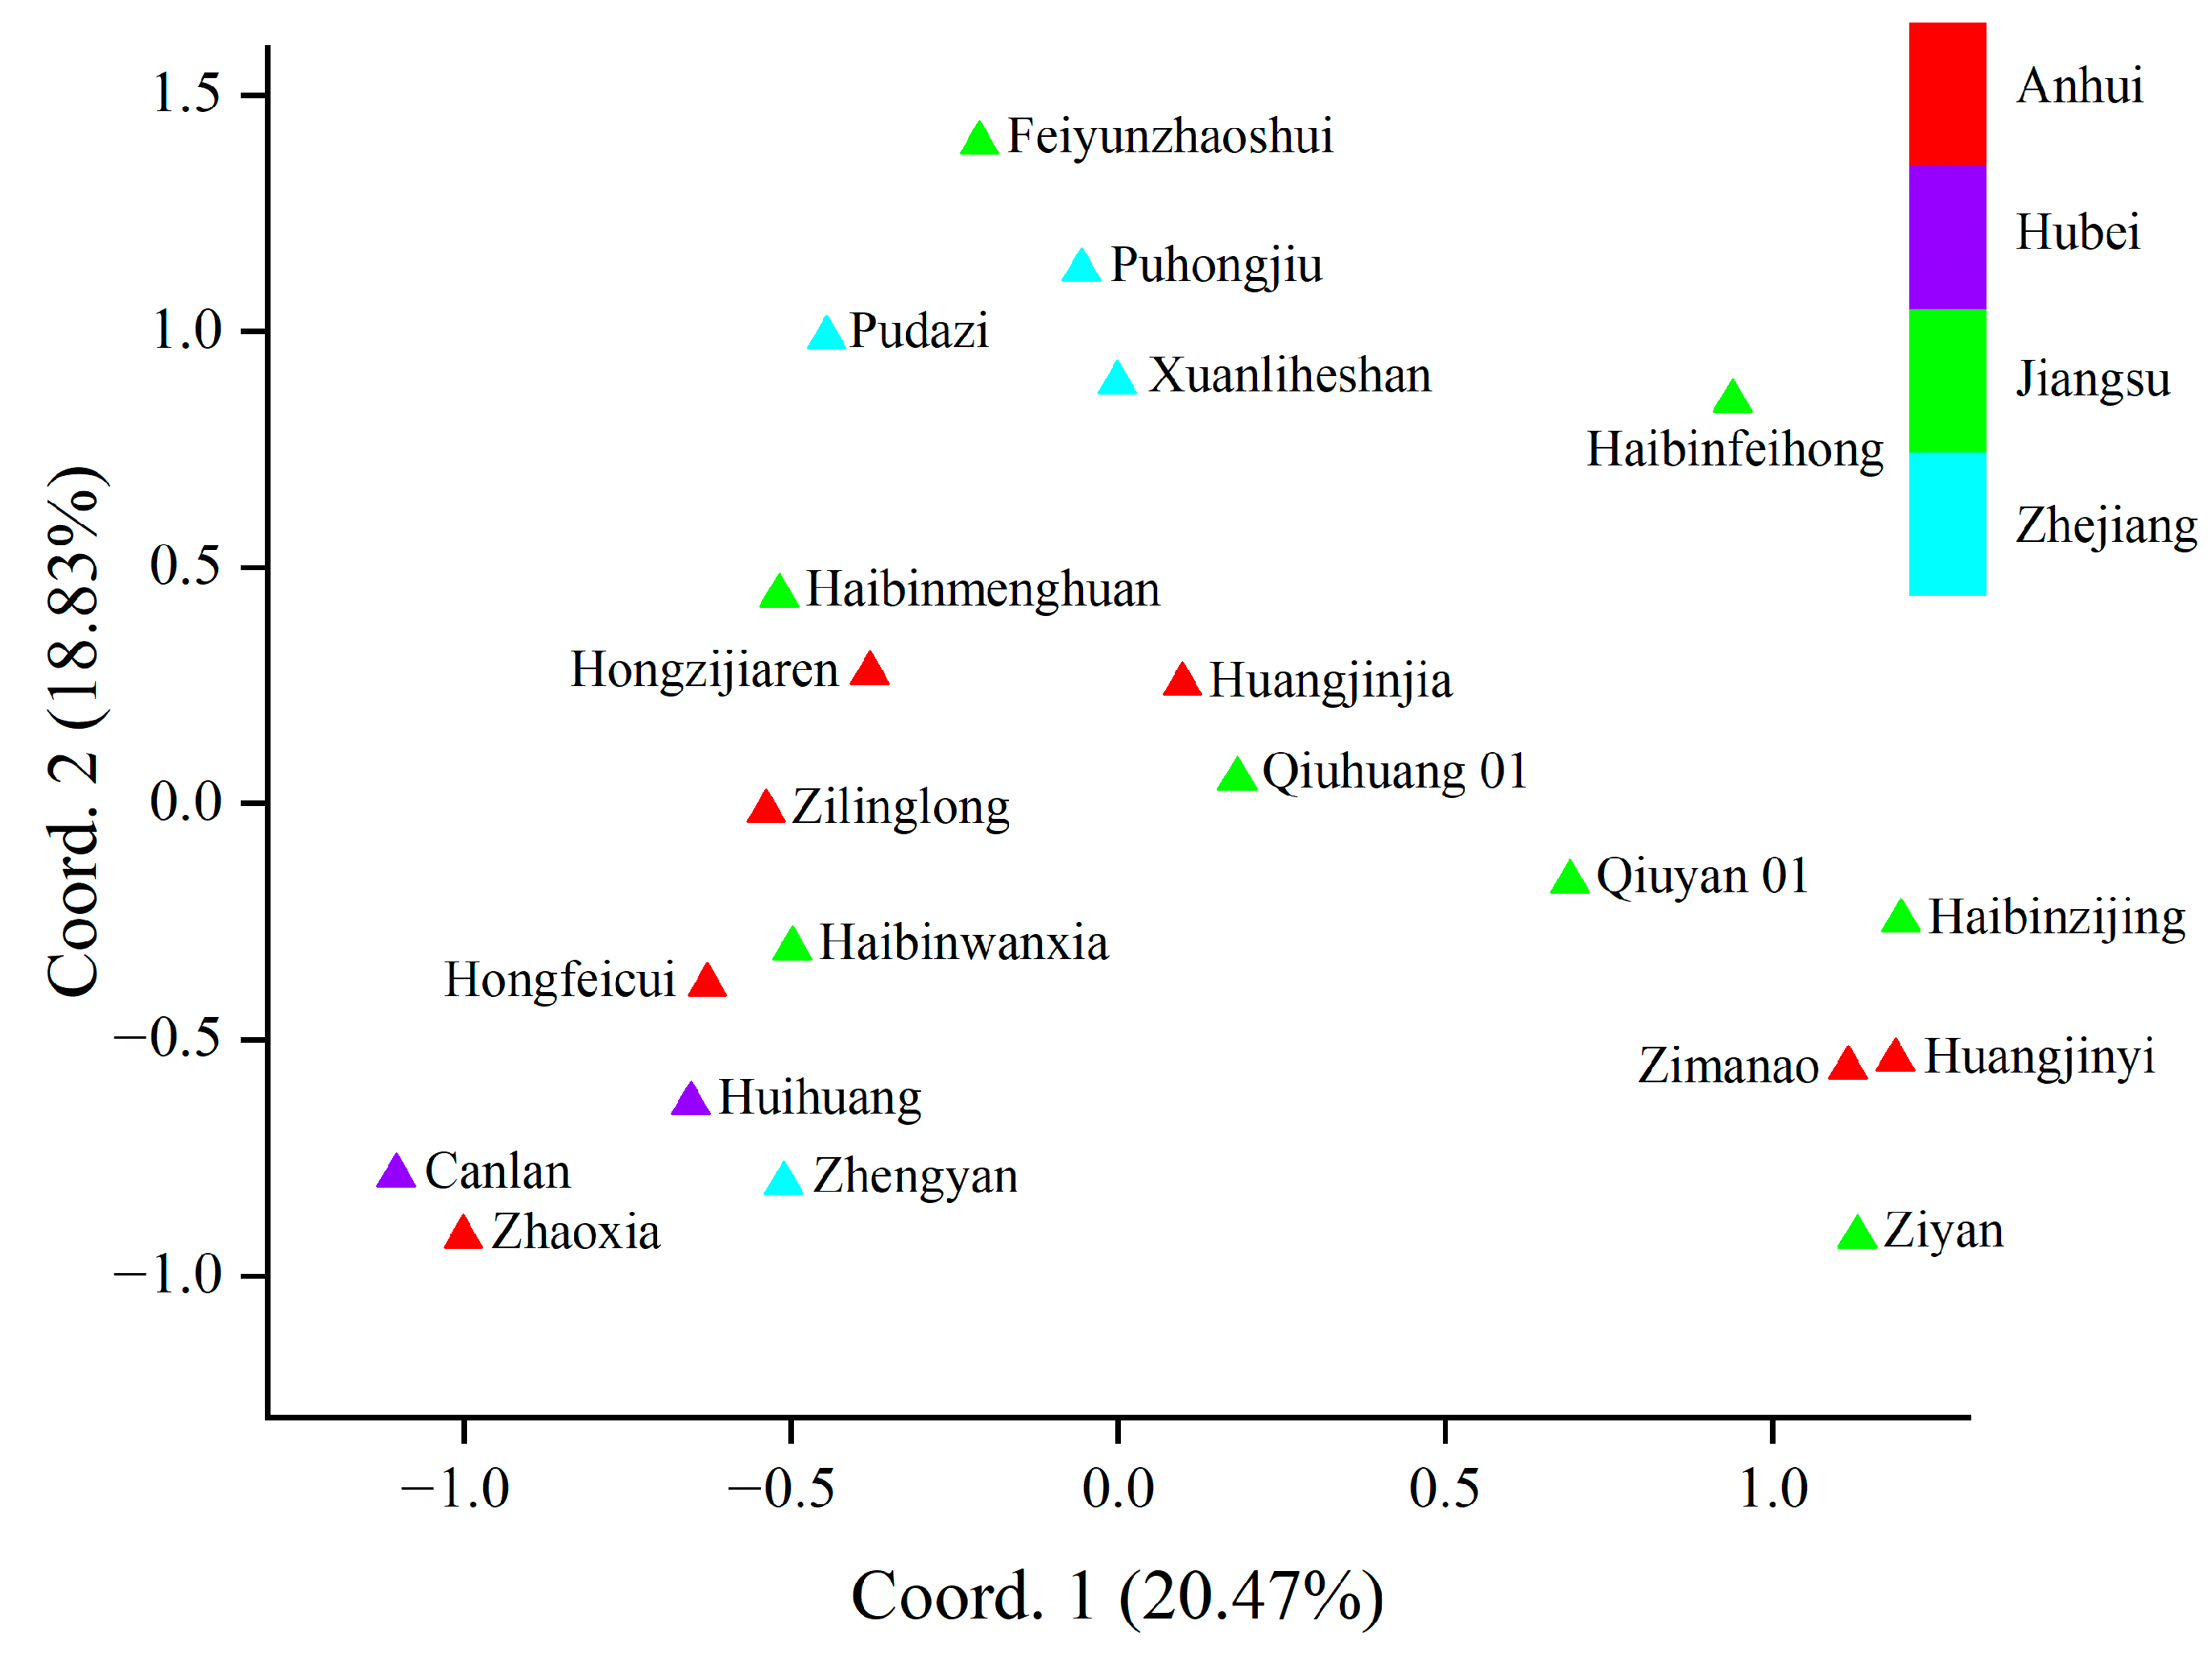
To analyze the genetic relationships among the cultivars, principal coordinate analysis (PCoA) was carried out. The genetic relationships of the T. sebifera cultivars were independent of their origins (Figure 1). Only the cultivars from Hubei (Canlan and Huihuang) showed a close genetic relationship, while there were obvious genetic differences among the cultivars from other shared regions (Anhui, Jiangsu, or Zhejiang). Moreover, Bayesian clustering analysis and phylogenetic tree construction based on the neighbor-joining method were also carried out to analyze the genetic structure (Figure 2). The optimal K value was 4, which indicated that the cultivars were clustered into four groups (Figure S1). Most of the PCoA, Bayesian clustering analysis, and phylogenetic tree results were similar. However, according to the phylogenetic tree, the cultivar ‘Huangjinjia’ showed significant genetic variation and clustered into one group.
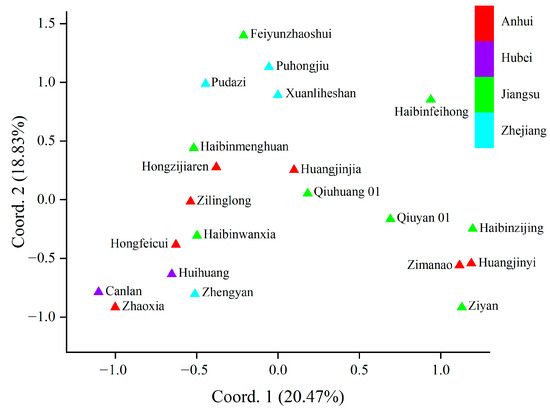
Figure 1.
Results of principal coordinate analysis (PCoA).
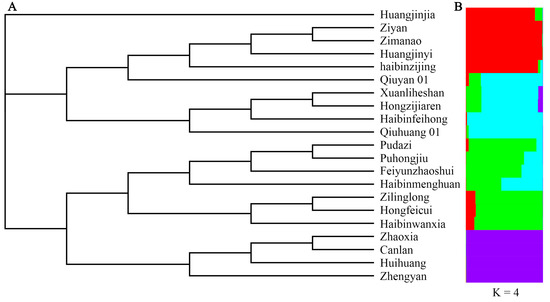
Figure 2.
Phylogenetic clustering based on the neighbor-joining method (A) and Bayesian clustering at K = 4 (B).
2.3. Unique Alleles
The frequencies of the 179 alleles at 16 SSR loci ranged from 0.0238 to 0.4524, and a total of 105 alleles were unique alleles, which were detected in only one cultivar (Table 4). Among the 16 SSR loci, there were 15 unique alleles at SSR08, while SSR03 and SSR14 had only 2 unique alleles. All the T. sebifera cultivars had unique alleles. The cultivar ‘Feiyunzhaoshui’ had the most unique alleles (10) at 10 SSR loci, the cultivars ‘Qiuyan 01’, ‘Qiuhuang 01’, and ‘Puhongjiu’ each had 8 unique alleles, and the cultivar ‘Zimanao’ had only one unique allele (156 bp at SSR12).
Table 4.
The unique alleles of the 21 cultivars at different loci.
2.4. Fingerprinting of Cultivars
To distinguish and identify the T. sebifera cultivars, a fingerprint was constructed based on the alleles at 16 SSR loci. It was not possible to distinguish all the T. sebifera cultivars with only one SSR locus. The PIC of SSR08 and SSR12 were 0.94 and 0.90, respectively, which were higher than those of the other SSR loci. A total of 15 of the 21 T. sebifera cultivars were distinguished when neither SSR08 nor SSR12 was used. In total, the 21 T. sebifera cultivars were successfully distinguished by combining SSR08 and SSR12 (Figure 3).
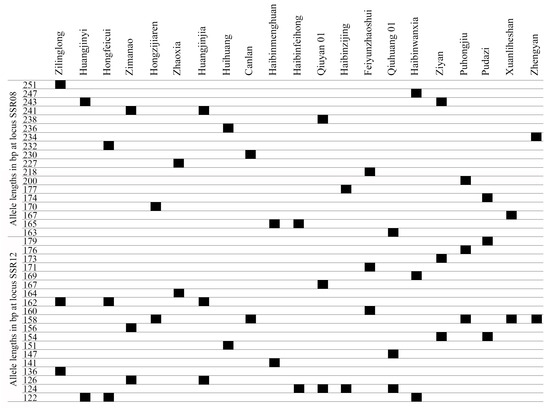
Figure 3.
Fingerprints of the 21 cultivars based on 2 SSR loci (SSR08 and SSR12).
3. Discussion
Genetic diversity contributes to the ability of a species to adapt to environmental changes and is valuable for evolution and conservation [28,29]. In plant breeding, genetic diversity can be described as the range of genetic characteristics and is an important resource for the development of new cultivars [30]. In this study, the 21 T. sebifera cultivars exhibited high genetic diversity (He = 0.86; I = 2.12). The genetic diversity of T. sebifera was greater than that of forest and fruit tree taxa such as Populus [31], Olea europaea [32], Corylus avellana [33], Prunus avium [34], and Malus pumila [35]. Moreover, there were significant differences in the phenotypic traits of the 21 T. sebifera cultivars, which may be a reflection of the high level of genetic diversity [36]. In general, natural populations may contain abundant genetic diversity [37]. The wild Ipomoea batatas individuals have a higher degree of genetic diversity than the cultivars [38]. However, the genetic diversity of widespread T. sebifera populations (He = 0.491) is much lower than that of T. sebifera cultivars [1]. The main reason may be that a wide range of T. sebifera trees have been destroyed or transplanted, which may lead to a loss of both germplasm and genetic diversity. Cross-breeding of plants, including natural and artificial hybrids, is an important approach for the generation of new cultivars. In plant breeding, large numbers of genetically stable and homozygous individuals are necessary, and complete homozygote breeding materials are rapidly obtained with doubled haploid technology, which is currently a routine part of breeding programs [39,40]. In this study, according to the 16 pairs of SSR markers, most of the cultivars had homozygous genotypes, which may be conducive to the inheritance of target genetic information in cross-breeding. In contrast, Prunus armeniaca [41] and Prunus domestica [9] cultivars have a high proportion of heterozygotes, and the Ho are 0.63 and 0.88, respectively. The main reason may be that T. sebifera cultivars have more inbreeding than P. armeniaca and P. domestica cultivars.
Some factors, such as geographic distance and selection, may influence genetic differentiation among populations [42]. Cultivars from different regions can also show genetic differentiation, and the cluster results of pear cultivars show a good fit with geographic distances [43]. However, the AMOVA in this study showed that most of the genetic variation was among cultivars (88%), and only 4% of the genetic variation was detected among regions. There were also limited genetic variations among regions in Panax ginseng and Cajanus cajan cultivars [44,45]. The main reason may be the gene flow between regions. The cultivars within the same region showed obvious genetic differentiation based on the PCoA, Bayesian clustering analysis, and phylogenetic tree results, indicating that the clustering result is independent of geographic distance. The T. sebifera cultivars from different regions also have similar phenotypes [36]. T. sebifera, an important economic tree species, has been widely distributed and transplanted across different regions over the last century due to its strong adaptability, which may be the reason for the low genetic differentiation among regions [1]. Genetic relationships between parents during cross-breeding may influence outcomes in genome-assisted breeding, and the close genetic distance between hybrid parents may cause hybrid disadvantages, including hybrid inactivation and hybrid decline [46,47]. Currently, T. sebifera is mainly used in landscaping because of its colorful leaves in autumn, and the main trait that is targeted in breeding is leaf color. Several cultivars with different leaf colors, such as ‘Puhongjiu’ (red), ‘Haibinfeihong’ (purple), ‘Huangjinjia’ (yellow), and ‘Zhaoxia’ (orange), exhibit great genetic differences and could be selected by strategic breeding of the parents. In contrast, complex genetic relationships may influence the study of the molecular regulation of leaf color via multiple omics analyses [48,49]. Therefore, cultivars with close genetic relationships, such as ‘Huihuang‘ (yellow) and ‘Zhengyan‘ (purple), may be good research materials for multiple omics analyses aimed at revealing the genetic basis of leaf color.
Given that T. sebifera cultivars are sometimes difficult to distinguish based on phenotypes, the inability to accurately identify the cultivars limits their applied use and the protection of cultivar rights. On the one hand, the main difference among T. sebifera cultivars is autumn leaf color, which is difficult to ascertain in other seasons when the leaves have not yet changed color. On the other hand, the phenotype of plants is controlled by both genetic and environmental factors, and a cultivar planted in different environments may have different morphological traits, which may cause misidentification and confusion [50]. When the T. sebifera cultivars were planted under the same conditions, some of them also had similar phenotypes [36]. Here, molecular fingerprinting is an accurate identification method without seasonal or locational limitations that relies on unique alleles and genotypes. In this study, there were 105 unique alleles identified at 16 SSR loci, which suggests that the genetic information among cultivars is noticeably different. In previous studies, fingerprinting of 10 Trifolium repens cultivars was performed using three representative SSR primers [10], while 24 A. officinalis cultivars were fingerprinted using three SSR primers [21]. However, the geographic origins of 110 rice cultivars cannot be fully identified only with SSR markers [51]. In the present study, just one SSR marker (SSR08 or SSR12) enabled approximately 70% of the cultivars (15) to be distinguished. Finally, the fingerprinting was constructed with only two SSR markers (SSR08 and SSR12). Hence, it can be speculated that the large quantity of polymorphic SSR markers and the high level of genetic differentiation among cultivars are important factors for the successful construction of a fingerprint with a small number of markers.
4. Materials and Methods
4.1. Plant Materials
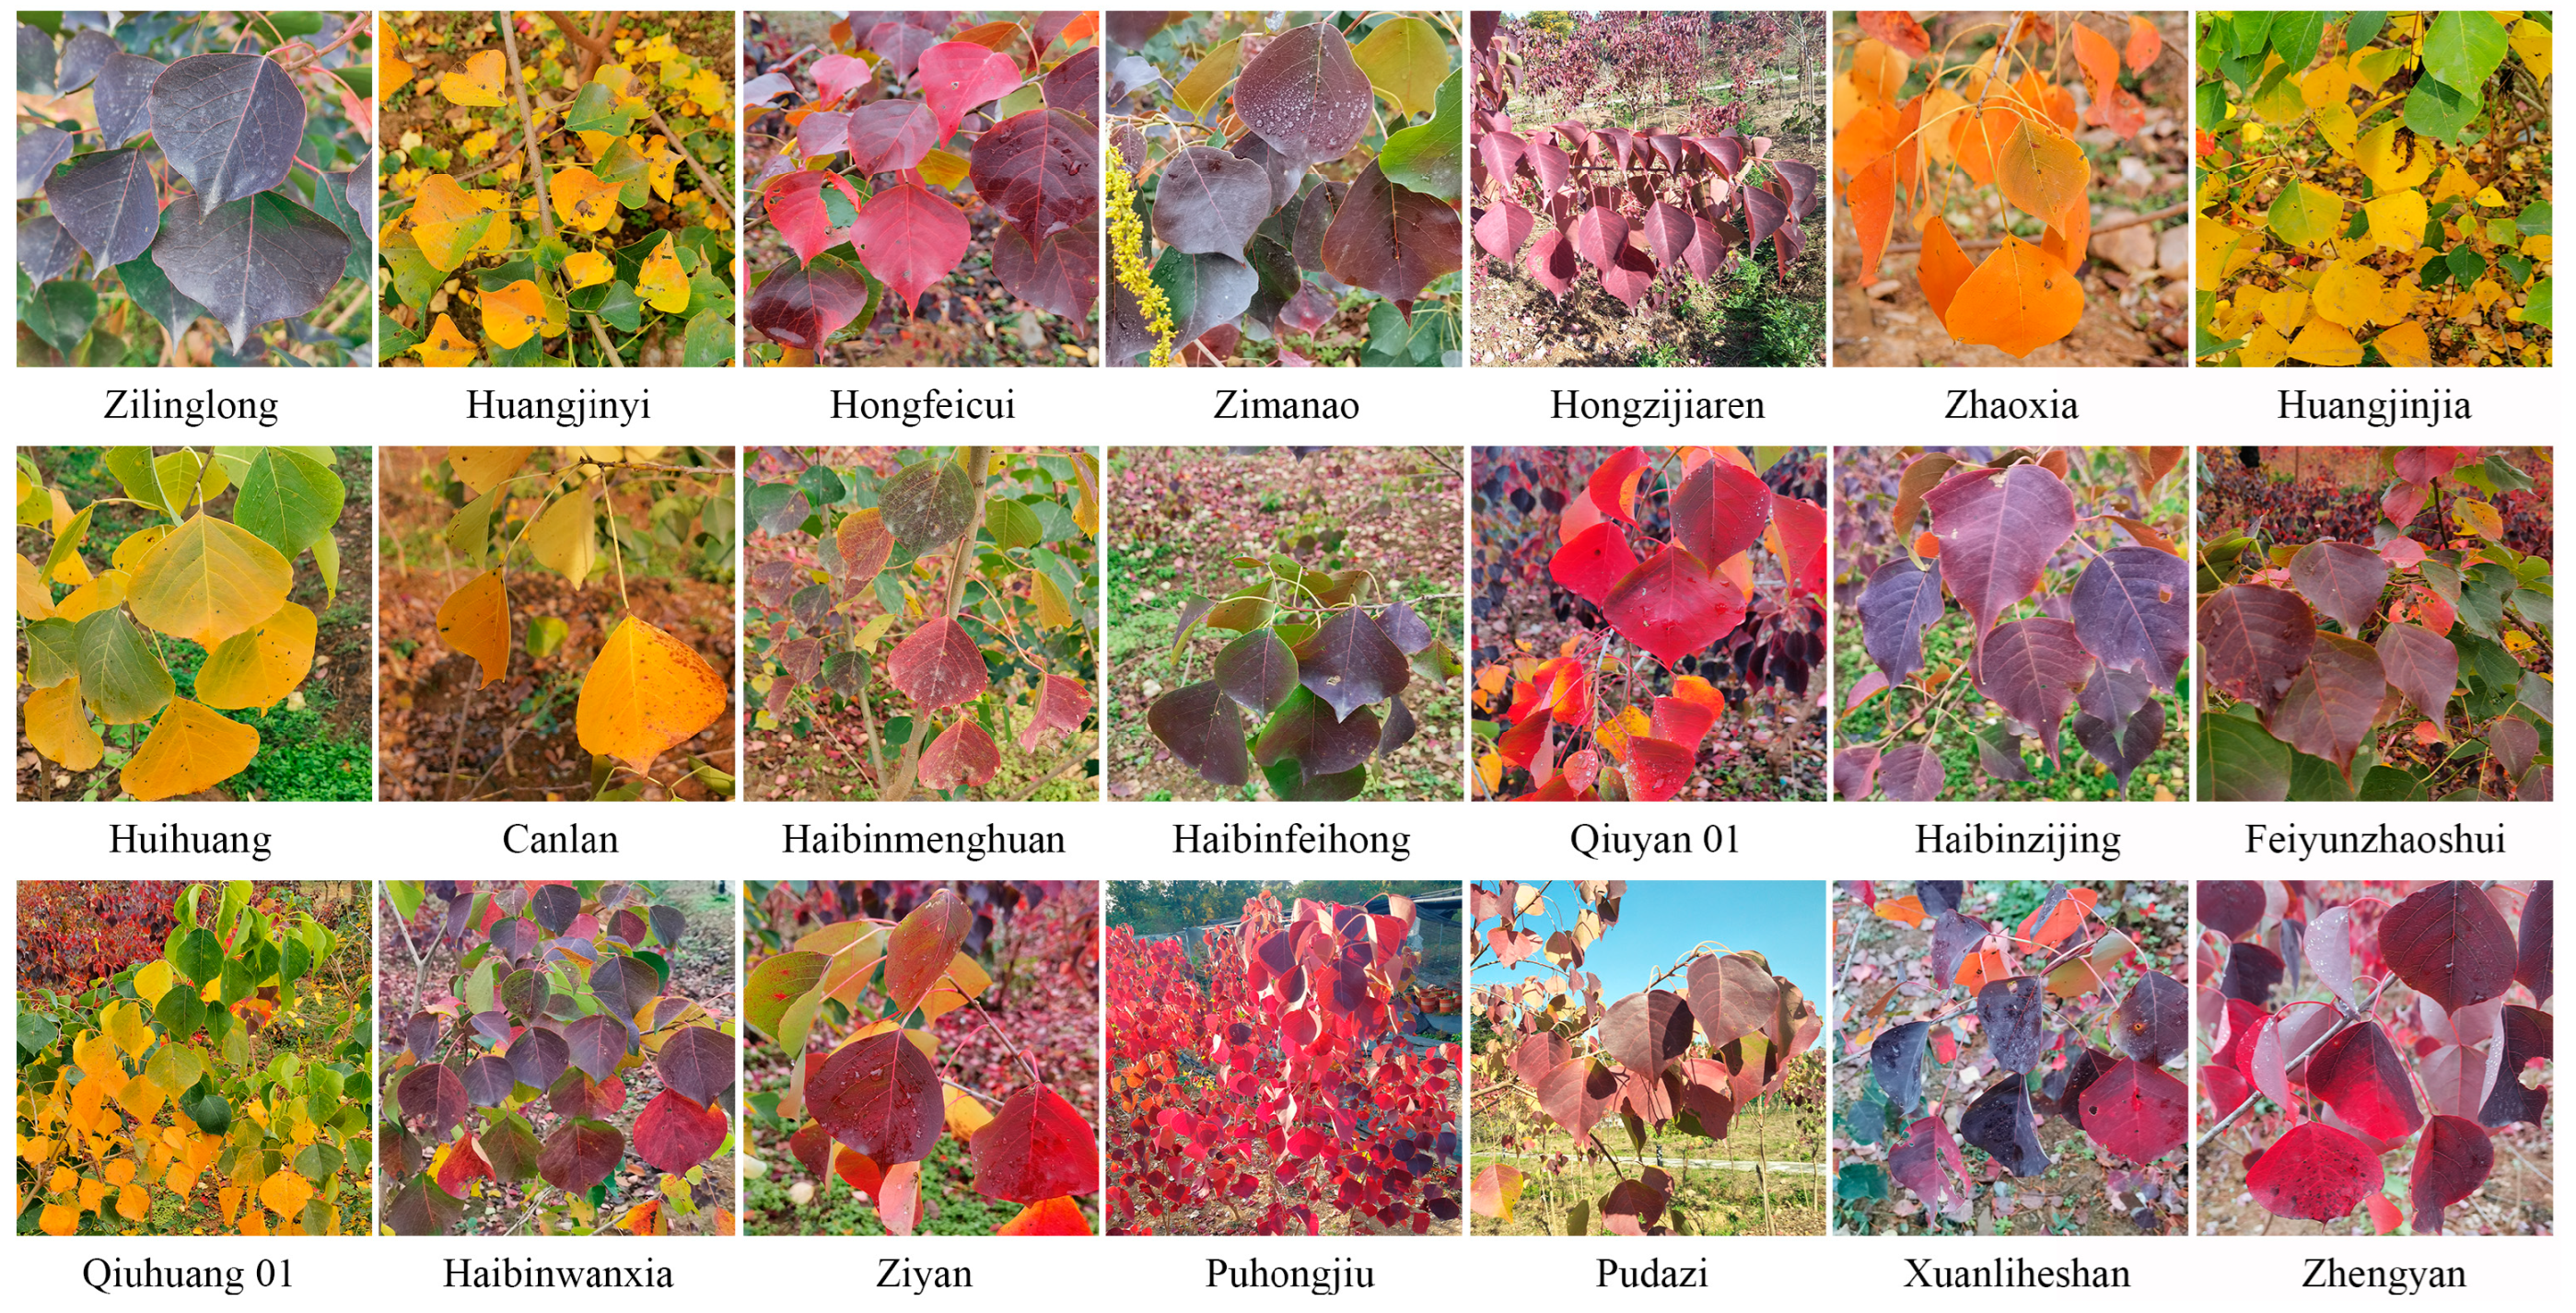
To date, a total of 21 T. sebifera cultivars have been licensed in China [36] (Table 5; Figure 4). The ‘Puhongjiu’ cultivar was approved by the Zhejiang Forestry Administration, while the other 20 cultivars were approved by the National Forestry and Grassland Administration. The scions of these cultivars were grafted onto two-year-old rootstocks, and the clones of these cultivars were cultivated in the T. sebifera germplasm nursery at Zhejiang Academy of Forestry Base (30°13′ N, 120°01′ E, 19 m above sea level). Young leaves of the 21 cultivars were collected and stored at −80 °C for later use.
Table 5.
The origins, regions, and codes of the 21 cultivars.

Figure 4.
Differences in leaves among the 21 cultivars.
4.2. DNA Extraction
Whole-genomic DNA was extracted using the DNeasy Plant Mini Kit (Qiagen, Hilden, NRW, Germany). The DNA was measured with a NanoDrop-1000 spectrophotometer (NanoDrop Technologies, Wilmington, DE, USA) and 1% agarose gel electrophoresis, and DNA with no significant degradation was used for polymerase chain reaction (PCR). Finally, the DNA was diluted to 60 ng/μL and stored at 4 °C for later use.
4.3. Genotyping with SSR Markers
A total of 39 SSR markers were selected from the references and tested via PCR amplification of six random individuals [1,25,27]. Sixteen of these SSR markers yielded clear and polymorphic products, and the upstream primers were fluorescently labeled with 5-Carboxyfluorescein (Table 6). The amplification of all samples at the 16 SSR loci was completed with an ABI Veriti 96 PCR system (Thermo Fisher Scientific, Waltham, MA, USA). The reaction mixtures (20 μL) contained 60 ng of DNA, 10 μL of 2 × TSINGKE Master Mix, and 0.2 μM of each SSR forward and reverse primer. The PCR program involved a predenaturation step of 4 min at 94 °C, followed by 30 cycles at 94 °C for 20 s, the appropriate annealing temperature for 30 s, and 72 °C for 90 s, and an extension step of 1 min at 72 °C. The PCR products of the amplifications were subjected to capillary electrophoresis using an ABI 3730xl instrument (Thermo Fisher Scientific, Waltham, MA, USA), and the fluorescent PCR bands were recognized. Finally, the genotype of each marker was analyzed using Peak Scanner v 1.0 (Thermo Fisher Scientific, Waltham, MA, USA) [52], and the base sizes of the bands were calculated with standard markers. The bands with the same base sizes were the same alleles in each pair of SSR markers. The alleles amplified in only one cultivar were unique alleles.
Table 6.
Information on the 16 polymorphic SSR markers.
4.4. Data Analysis
The number of alleles (Na), effective number of alleles (Ne), observed heterozygosity (Ho), expected heterozygosity (He), Shannon’s information index (I), polymorphism information content (PIC), and phylogenetic analysis were calculated using PowerMarker version 3.25 (North Carolina State University, Raleigh, NC, USA) [53]. The allelic richness (AR) was measured with FSTAT version 2.9.3 (University of Lausanne, Lausanne, VD, Switzerland) [54]. Analysis of molecular variance (AMOVA) and principal coordinate analysis (PCoA) were performed with GenAlEx version 6 (Rutgers University, New Brunswick, NJ, USA) [55]. To study the genetic relationships among the cultivars, Bayesian clustering analysis was performed using Structure version 2.3.1 (Stanford University, San Francisco, CA, USA) [56].
5. Conclusions
The 21 licensed T. sebifera cultivars were analyzed using SSR markers, which revealed a high level of genetic diversity. The licensed cultivars showed homozygous genotypes at most SSR loci, which may be conducive to ensuring the inheritance of target genetic information in cross-breeding. Most of the genetic variation identified occurred among cultivars, and the genetic differentiation between them was independent of geographic distance, which may be mainly due to transplantations of this species across regions. T. sebifera cultivars with different leaf colors and obvious genetic differences were deemed to be important parents for cross-breeding. Finally, a fingerprint of the licensed T. sebifera cultivars was constructed with two markers.
Supplementary Materials
The following supporting information can be downloaded at: https://www.mdpi.com/article/10.3390/plants13131767/s1, Figure S1. Relationships between the number of clusters (K) and the corresponding ΔK.
Author Contributions
Conceptualization, Y.L. and Q.Z.; methodology, B.C. and Q.Z.; software, B.C. and Q.Z.; validation, Q.Z., B.C. and D.J.; formal analysis, F.Z.; investigation, B.C.; resources, Q.Z.; data curation, Q.Z.; writing—original draft preparation, Q.Z.; writing—review and editing, Q.Z.; project administration, Y.L.; funding acquisition, Y.L. All authors have read and agreed to the published version of the manuscript.
Funding
This research was funded by Special Support Funds of Zhejiang for Scientific Research Institutes (2021F1065-12, 2024F1065-5) and Key Scientific and Technological Grant of Zhejiang for Breeding New Agricultural Varieties (2021C02070-7).
Data Availability Statement
Data are contained within the article.
Acknowledgments
We are grateful to Xingchen Lu for the help with the laboratory work.
Conflicts of Interest
The authors declare no conflicts of interest.
References
- Zhou, P.Y.; Zhou, Q.; Dong, F.P.; Shen, X.; Li, Y.G. Study on the genetic variation of Triadica sebifera (Linnaeus) small populations based on SSR markers. Forests 2022, 13, 1330. [Google Scholar] [CrossRef]
- Gao, R.X.; Su, Z.S.; Yin, Y.B.; Sun, L.N.; Li, S.Y. Germplasm, chemical constituents, biological activities, utilization, and control of Chinese tallow (Triadica sebifera (L.) Small). Biol. Invasions 2016, 18, 809–829. [Google Scholar] [CrossRef]
- Dolma, S.K.; Singh, P.P.; Reddy, S.G.E. Insecticidal and enzyme inhibition activities of leaf/bark extracts, fractions, seed oil and isolated compounds from Triadica sebifera (L.) Small against Aphis craccivora Koch. Molecules 2022, 27, 1967. [Google Scholar] [CrossRef] [PubMed]
- Mia, R.; Islam, M.M.; Ahmed, T.; Waqar, M.A.; Khanam, N.J.; Sultana, S.; Bhuiyan, M.S.K.; Uddin, M.N. Natural dye extracted from Triadica sebifera in aqueous medium for sustainable dyeing and functionalizing of viscose fabric. Clean. Eng. Technol. 2022, 8, 100471. [Google Scholar] [CrossRef]
- Fu, R.; Zhang, Y.; Guo, Y.; Chen, F. Chemical composition, antioxidant and antimicrobial activity of Chinese tallow tree leaves. Ind. Crops Prod. 2015, 76, 374–376. [Google Scholar] [CrossRef]
- Huang, L.B.; Dong, X.Y.; Liang, Z.H.; Dou, Q.Q.; Zhang, M. Breeding of new varieties of Sapium sebiferum ‘Qiuyan 1’ autumn leaves. Forest Sci. Technol. 2018, 550, 57–59. [Google Scholar] [CrossRef]
- Li, Y.G.; Shen, F.Q.; Xu, Y.Q.; Jiang, D.Y.; Liu, X.H. A new ornamental Triadica sebifera cultivar ‘Hongzi Jiaren’. Acta Hortic. Sin. 2022, 47 (Suppl. S2), 3137–3138. [Google Scholar] [CrossRef]
- Gaši, F.; Sehic, J.; Grahic, J.; Hjeltnes, S.H.; Ordidge, M.; Benedikova, D.; Blouin-Delmas, M.; Drogoudi, P.; Giovannini, D.; Höfer, M.; et al. Genetic assessment of the pomological classification of plum Prunus domestica L. accessions sampled across Europe. Genet. Resour. Crop Evol. 2020, 67, 1137–1161. [Google Scholar] [CrossRef]
- Antanynienė, R.; Šikšnianienė, J.B.; Stanys, V.; Frercks, B. Fingerprinting of plum (Prunus domestica) genotypes in Lithuania using SSR markers. Plants 2023, 12, 1538. [Google Scholar] [CrossRef]
- Ma, S.N.; Han, C.Y.; Zhou, J.; Hu, R.C.; Jiang, X.; Wu, F.F.; Tian, K.; Nie, G.; Zhang, X.Q. Fingerprint identification of white clover cultivars based on SSR molecular markers. Mol. Biol. Rep. 2020, 47, 8513–8521. [Google Scholar] [CrossRef]
- Chau, T.P.; Samdani, M.S.; Jhanani, G.K.; Sathiyamoorthi, E.; Lee, J. Metal accumulation and genetic adaptation of Oryza sativa to Cadmiun and Chromium heavy metal stress: A hydroponic and RAPD analyses. Environ. Res. 2024, 242, 117793. [Google Scholar] [CrossRef] [PubMed]
- Bisht, V.; Rawat, J.M.; Gaira, K.S.; Purohit, S.; Anand, J.; Sinha, S.; Rawat, B. Assessment of genetic homogeneity of in-vitro propagated apple root stock MM 104 using ISSR and SCoT primers. BMC Plant Biol. 2024, 24, 240. [Google Scholar] [CrossRef] [PubMed]
- Sun, N.; Chen, J.; Wang, Y.; Hussain, I.; Lei, N.; Ma, X.; Li, W.; Liu, K.; Yu, H.; Zhao, K.; et al. Development and utility of SSR markers based on Brassica sp. whole-genome in triangle of U. Front. Plant Sci. 2024, 14, 1259736. [Google Scholar] [CrossRef] [PubMed]
- Santiago, E.; Caballero, A.; Köpke, C.; Novo, I. Estimation of the contemporary effective population size from SNP data while accounting for mating structure. Mol. Ecol. Resour. 2024, 24, e13890. [Google Scholar] [CrossRef] [PubMed]
- Abbasov, M.; Akparov, Z.; Gross, T.; Babayeva, S.; Izzatullayeva, V.; Hajiyev, E.; Rustamov, K.; Gross, P.; Tekin, M.; Akar, T.; et al. Genetic relationship of diploid wheat (Triticum spp.) species assessed by SSR markers. Genet. Resour. Crop Evol. 2018, 65, 1441–1453. [Google Scholar] [CrossRef]
- Zhou, Q.; Mu, K.M.; Ni, Z.X.; Liu, X.H.; Li, Y.G.; Xu, L.A. Analysis of genetic diversity of ancient Ginkgo populations using SSR markers. Ind. Crops Prod. 2020, 145, 111942. [Google Scholar] [CrossRef]
- Testolin, R.; Messina, R.; Cipriani, G.; De Mori, G. SSR-based DNA fingerprinting of fruit crops. Crop Sci. 2023, 63, 390–459. [Google Scholar] [CrossRef]
- Yang, Y.; Lyu, M.; Liu, J.; Wu, J.; Wang, Q.; Xie, T.; Li, H.; Chen, R.; Sun, D.; Yang, Y.; et al. Construction of an SNP fingerprinting database and population genetic analysis of 329 cauliflower cultivars. BMC Plant Biol. 2022, 22, 522. [Google Scholar] [CrossRef] [PubMed]
- Wang, X.X.; Zhou, Q.; Tao, Y.Y.; Xu, M.; Yu, W.W.; Xu, L.A. The fingerprints construction and genetic diversity analysis of 48 fruit-used Ginkgo cultivars based on SSR markers. Mol. Plant Breed. 2017, 15, 1963–1970. [Google Scholar] [CrossRef]
- Zhang, M.; Zheng, C.; Li, J.; Wang, X.; Liu, C.; Li, X.; Xu, Z.; Du, K. Genetic diversity, population structure, and DNA fingerprinting of Ailanthus altissima var. erythrocarpa based on EST-SSR markers. Sci. Rep. 2023, 13, 19315. [Google Scholar] [CrossRef]
- Ahmad, N.; Tian, R.; Lu, J.; Li, G.; Sun, J.; Lin, R.; Zhao, C.; Zhou, C.; Chang, H.; Zhao, S.; et al. DNA fingerprinting and genetic diversity analysis in Asparagus officinalis L. cultivars using microsatellite molecular markers. Genet. Resour. Crop Evol. 2023, 70, 1163–1177. [Google Scholar] [CrossRef]
- Zhang, S.; Li, Y.; Li, Y.; Zhang, Y.; Hao, Y.; Hou, Z.; Qi, J. Development of SSR markers for and fingerprinting of walnut genetic resources. Forests 2024, 15, 405. [Google Scholar] [CrossRef]
- Wang, S.; Chen, Y.; Yang, Y.; Wu, W.; Liu, Y.; Fan, Q.; Zhou, R. Phylogenetic relationships and natural hybridization in Triadica inferred from nuclear and chloroplast DNA analyses. Biochem. Syst. Ecol. 2016, 64, 142–148. [Google Scholar] [CrossRef]
- Zhi, Y.; Taylor, M.C.; Campbell, P.M.; Warden, A.C.; Shrestha, P.; El Tahchy, A.; Rolland, V.; Vanhercke, T.; Petrie, J.R.; White, R.G.; et al. Comparative lipidomics and proteomics of lipid droplets in the mesocarp and seed tissues of Chinese tallow (Triadica sebifera). Front. Plant Sci. 2017, 8, 1339. [Google Scholar] [CrossRef] [PubMed]
- DeWalt, S.J.; Siemann, E.; Rogers, W.E. Microsatellite markers for an invasive tetraploid tree, Chinese tallow (Triadica sebifera). Mol. Ecol. Notes 2006, 6, 505–507. [Google Scholar] [CrossRef]
- DeWalt, S.J.; Siemann, E.; Rogers, W.E. Geographic distribution of genetic variation among native and introduced populations of Chinese tallow tree, Triadica sebifera (Euphorbiaceae). Am. J. Bot. 2011, 98, 1128–1138. [Google Scholar] [CrossRef]
- Zhuang, Y.F.; Wang, Z.F.; Wu, L.F. New set of microsatellites for Chinese tallow tree, Triadica sebifera. Genet. Mol. Res. 2017, 16, 1–6. [Google Scholar] [CrossRef] [PubMed]
- Forcada, J.; Hoffman, J. Climate change selects for heterozygosity in a declining fur seal population. Nature 2014, 511, 462–465. [Google Scholar] [CrossRef] [PubMed]
- Ellegren, H.; Galtier, N. Determinants of genetic diversity. Nat. Rev. Genet. 2016, 17, 422–433. [Google Scholar] [CrossRef] [PubMed]
- Swarup, S.; Cargill, E.J.; Crosby, K.; Flagel, L.; Kniskern, J.; Glenn, K.C. Genetic diversity is indispensable for plant breeding to improve crops. Crop Sci. 2021, 61, 839–852. [Google Scholar] [CrossRef]
- Fossati, T.; Zapelli, I.; Bisoffi, S.; Micheletti, A.; Vietto, L.; Sala, F.; Castiglione, S. Genetic relationships and clonal identity in a collection of commercially relevant poplar cultivars assessed by AFLP and SSR. Tree Genet. Genomes 2005, 1, 11–20. [Google Scholar] [CrossRef]
- Ercisli, S.; Ipek, A.; Barut, E. SSR Marker-Based DNA Fingerprinting and Cultivar Identification of Olives (Olea europaea). Biochem. Genet. 2011, 49, 555–561. [Google Scholar] [CrossRef] [PubMed]
- Gökirmak, T.; Mehlenbacher, S.A.; Bassil, N.V. Characterization of European hazelnut (Corylus avellana) cultivars using SSR markers. Genet. Resour. Crop Evol. 2009, 56, 147–172. [Google Scholar] [CrossRef]
- Ganopoulos, I.V.; Kazantzis, K.; Chatzicharisis, I.; Karayiannis, I.; Tsaftaris, A.S. Genetic diversity, structure and fruit trait associations in Greek sweet cherry cultivars using microsatellite based (SSR/ISSR) and morpho-physiological markers. Euphytica 2011, 181, 237–251. [Google Scholar] [CrossRef]
- Zhang, Q.; Li, J.; Zhao, Y.B.; Korban, S.S.; Han, Y.P. Evaluation of Genetic Diversity in Chinese Wild Apple Species Along with Apple Cultivars Using SSR Markers. Plant Mol. Biol. Rep. 2012, 30, 539–546. [Google Scholar] [CrossRef]
- Chen, B.Q.; Cao, S.J.; Shen, X.; Zhuge, F.; Lu, X.C.; Li, Y.G. Phenotypic diversity analysis and comprehensive evaluation of ornamental Triadica sebiferum varieties. Mol. Plant Breed. 2022, 20, 4108–4120. [Google Scholar] [CrossRef]
- Reim, S.; Lochschmidt, F.; Proft, A.; Höfer, M. Genetic integrity is still maintained in natural populations of the indigenous wild apple species Malus sylvestris (Mill.) in Saxony as demonstrated with nuclear SSR and chloroplast DNA markers. Ecol. Evol. 2020, 10, 11798–11809. [Google Scholar] [CrossRef]
- Amritha, M.S.; Dhanya, O.G.; Nair, A.G.; Vidya, P.; Muthusamy, S.K.; Mohan, C. Genetic diversity studies between Ipomoea wild species and cultivated sweet potato (Ipomoea batatas (L.) Lam.) using SSR markers. S. Afr. J. Bot. 2024, 169, 452–463. [Google Scholar] [CrossRef]
- Impens, L.; Lorenzo, C.D.; Vandeputte, W.; Wytynck, P.; Debray, K.; Haeghebaert, J.; Herwegh, D.; Jacobs, T.B.; Ruttink, T.; Nelissen, H.; et al. Combining multiplex gene editing and doubled haploid technology in maize. New Phytol. 2023, 239, 1521–1532. [Google Scholar] [CrossRef] [PubMed]
- Chen, Y.R.; Lübberstedt, T.; Frei, U.K. Development of doubled haploid inducer lines facilitates selection of superior haploid inducers in maize. Front. Plant Sci. 2024, 14, 1320660. [Google Scholar] [CrossRef]
- Corrado, G.; Forlani, M.; Rao, R.; Basile, B. Diversity and relationships among neglected apricot (Prunus armeniaca L.) landraces using morphological traits and SSR markers: Implications for agro-biodiversity conservation. Plants 2021, 10, 1341. [Google Scholar] [CrossRef]
- Gijbels, P.; De Hert, K.; Jacquemyn, H.; Honnay, O. Reduced fecundity and genetic diversity in small populations of rewarding versus deceptive orchid species: A meta-analysis. Plant Ecol. Evol. 2015, 148, 153–159. [Google Scholar] [CrossRef]
- Erfani, J.; Ebadi, A.; Abdollahi, H.; Fatahi, R. Genetic Diversity of Some Pear Cultivars and Genotypes Using Simple Sequence Repeat (SSR) Markers. Plant Mol. Biol. Rep. 2012, 30, 1065–1072. [Google Scholar] [CrossRef]
- Li, Y.; Li, R.; Zhang, N.; Zhang, J.; Hou, W.; Qu, Z.; Zheng, P. Genetic diversity and population structure of Chinese mountain cultivated Panax ginseng accessions using SSR and KASP markers. Genet. Resour. Crop Evol. 2024, 71, 1493–1506. [Google Scholar] [CrossRef]
- Zavinon, F.G.; Djossou, R.; Gbéto, M.; Fonhan, N.; Kouke, R.; Adoukonou-Sagbadja, H. SSR-marker assisted evaluation of genetic diversity in local and exotic pigeonpea cultivars in Benin for parental genotypes selection. Plant Gene 2024, 37, 100443. [Google Scholar] [CrossRef]
- Habier, D.; Fernando, R.L.; Dekkers, J.C.M. The impact of genetic relationship information on genome-assisted breeding values. Genetics 2007, 177, 2389–2397. [Google Scholar] [CrossRef] [PubMed]
- Birchler, J. Heterosis: The genetic basis of hybrid vigour. Nat. Plants 2015, 1, 15020. [Google Scholar] [CrossRef] [PubMed]
- Williams, R.B.; Chan, E.K.; Cowley, M.J.; Little, P.F. The influence of genetic variation on gene expression. Genome Res. 2007, 17, 1707–1716. [Google Scholar] [CrossRef] [PubMed]
- Zhang, W.; Li, F.; Nie, L. Integrating multiple ‘omics’ analysis for microbial biology: Application and methodologies. Microbiology 2010, 156, 287–301. [Google Scholar] [CrossRef] [PubMed]
- Jiménez-Cantizano, A.; Muñoz-Martín, A.; Amores-Arrocha, A.; Sancho-Galán, P.; Palacios, V. Identification of red grapevine cultivars (Vitis vinifera L.) preserved in ancient vineyards in Axarquia (Andalusia, Spain). Plants 2020, 9, 1572. [Google Scholar] [CrossRef]
- Li, X.; Li, P.; Tang, W.; Zheng, J.; Fan, F.; Jiang, X.; Li, Z.; Fang, Y. Simultaneous determination of subspecies and geographic origins of 110 rice cultivars by microsatellite markers. Food Chem. 2024, 445, 138657. [Google Scholar] [CrossRef]
- Palero, F.; González-Candelas, F.; Pascual, M. MICROSATELIGHT—pipeline to expedite microsatellite analysis. J. Hered. 2011, 102, 247–249. [Google Scholar] [CrossRef] [PubMed]
- Liu, K.J.; Muse, S.V. PowerMarker: An integrated analysis environment for genetic marker analysis. Bioinformatics 2005, 21, 2128–2129. [Google Scholar] [CrossRef] [PubMed]
- Goudet, J. FSTAT (version 1.2): A computer program to calculate F-statistics. J. Hered. 1995, 86, 485–486. [Google Scholar] [CrossRef]
- Peakall, R.; Smouse, P.E. Genalex 6: Genetic analysis in Excel. Population genetic software for teaching and research. Mol. Ecol. Notes 2006, 6, 288–295. [Google Scholar] [CrossRef]
- Evanno, G.; Regnaut, S.; Goudet, J. Detecting the number of clusters of individuals using the software STRUCTURE: A simulation study. Mol. Ecol. 2005, 14, 2611–2620. [Google Scholar] [CrossRef]


Disclaimer/Publisher’s Note: The statements, opinions and data contained in all publications are solely those of the individual author(s) and contributor(s) and not of MDPI and/or the editor(s). MDPI and/or the editor(s) disclaim responsibility for any injury to people or property resulting from any ideas, methods, instructions or products referred to in the content. |
© 2024 by the authors. Licensee MDPI, Basel, Switzerland. This article is an open access article distributed under the terms and conditions of the Creative Commons Attribution (CC BY) license (https://creativecommons.org/licenses/by/4.0/).