
A Precise Segmentation Algorithm of Pumpkin Seedling Point Cloud Stem Based on CPHNet
 ,
,
Abstract
1. Introduction
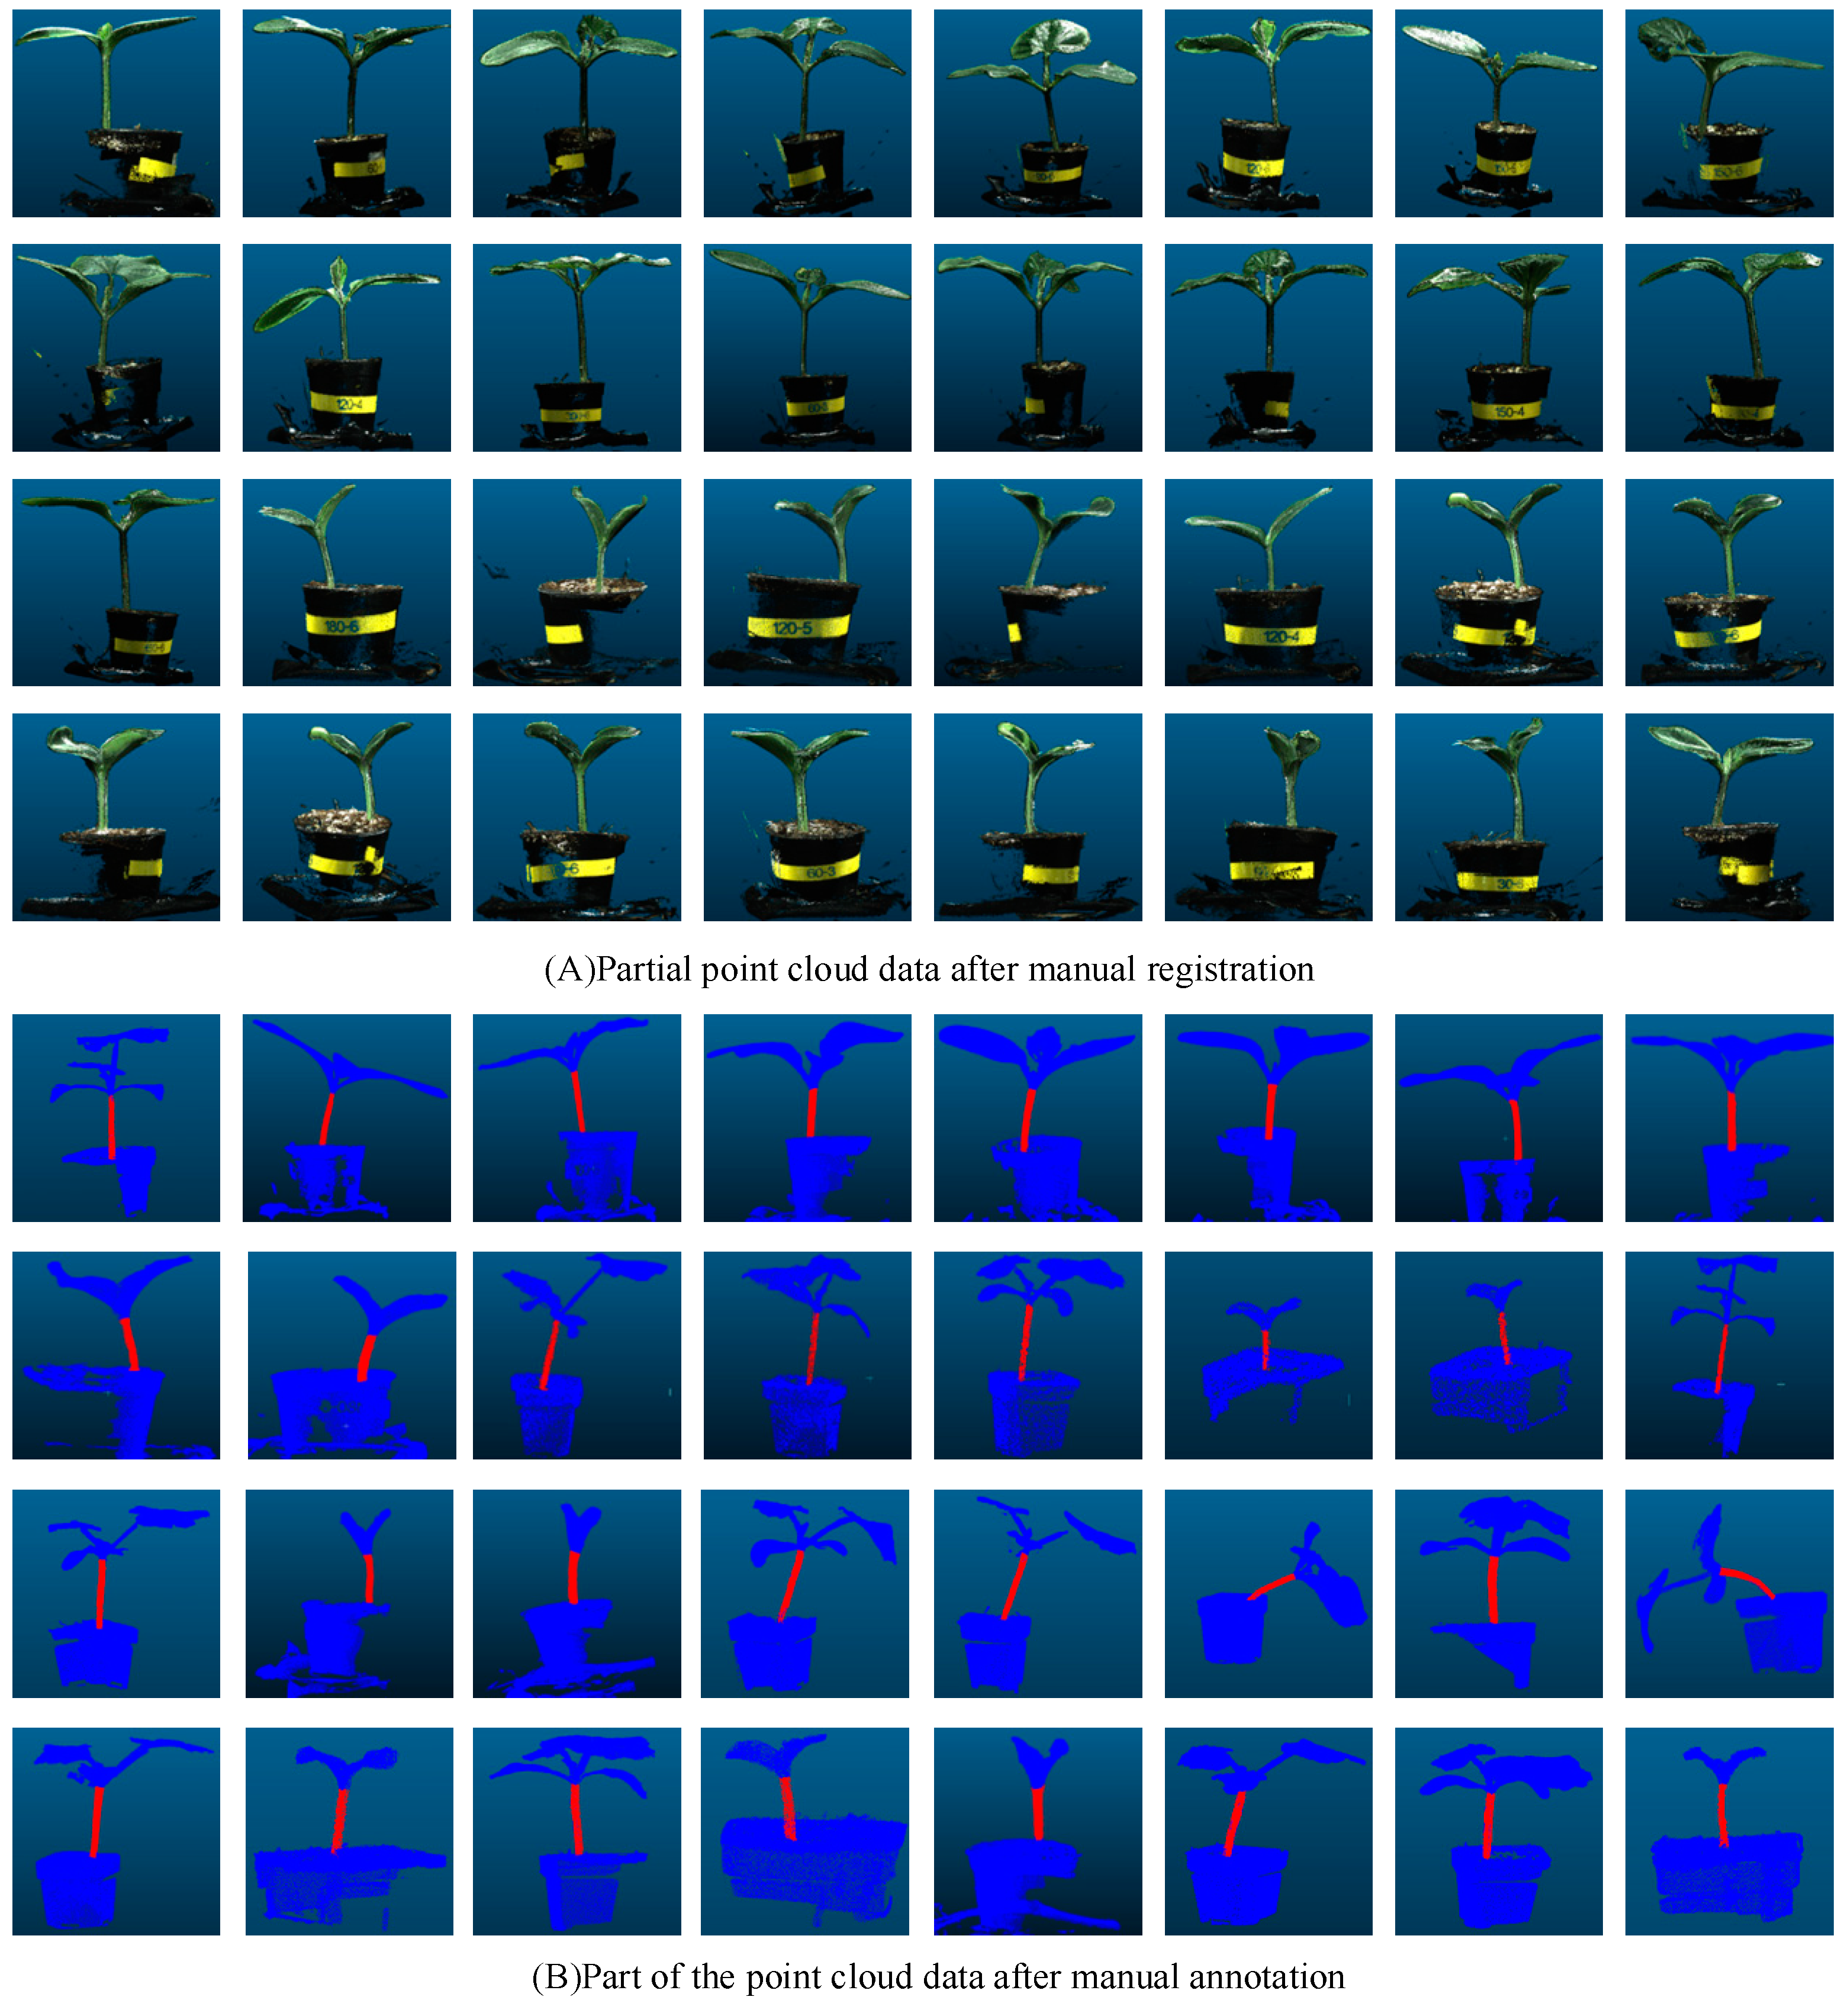
- To enable the point cloud segmentation network to obtain abundant pumpkin seedling stem features, we constructed a pumpkin seedling point cloud dataset with accurate segmentation and labeling of pumpkin seedling stems for the first time, and applied classification labels to mark the pumpkin seedling stem and other areas.
- To segment the stem of pumpkin seedlings more accurately, a partial cutting algorithm of pumpkin seedling stems based on point cloud data based on CPHNet was proposed. The design is as follows:
- (1)
- A Channel-Residual Attention Multi-Layer Perceptron (CRA-MLP) module is proposed to compress global spatial information and perform feature learning in the channel dimension, giving greater weight to the stem region of pumpkin seedlings, with residual connections enhancing the network’s ability to recognize and focus on the stem area while reducing the impact of background noise like soil and walls.
- (2)
- A Position-Enhanced Self-Attention (PESA) module is proposed to strengthen location information, enabling the model to understand the spatial relationships and geometric structure of pumpkin seedling point cloud data more accurately, while the self-attention mechanism helps the network dynamically adjust feature weights across different scales, improving adaptability and segmentation accuracy for the pumpkin seedling stem partial cutting task.
- (3)
- A Hybrid Cross Entropy and Dice Loss (HCE-Dice Loss) function is proposed, uniquely combining the classification accuracy of cross entropy, which requires high detail to help the model accurately classify the stem of the pumpkin seedling, with the boundary sensitivity of Dice loss, which aids the model in better identifying and segmenting stem details and boundary regions, thus allowing the training process to comprehensively consider pixel-level classification and target shape matching, ultimately improving the model’s segmentation accuracy and contrast for the pumpkin seedling stem boundary.
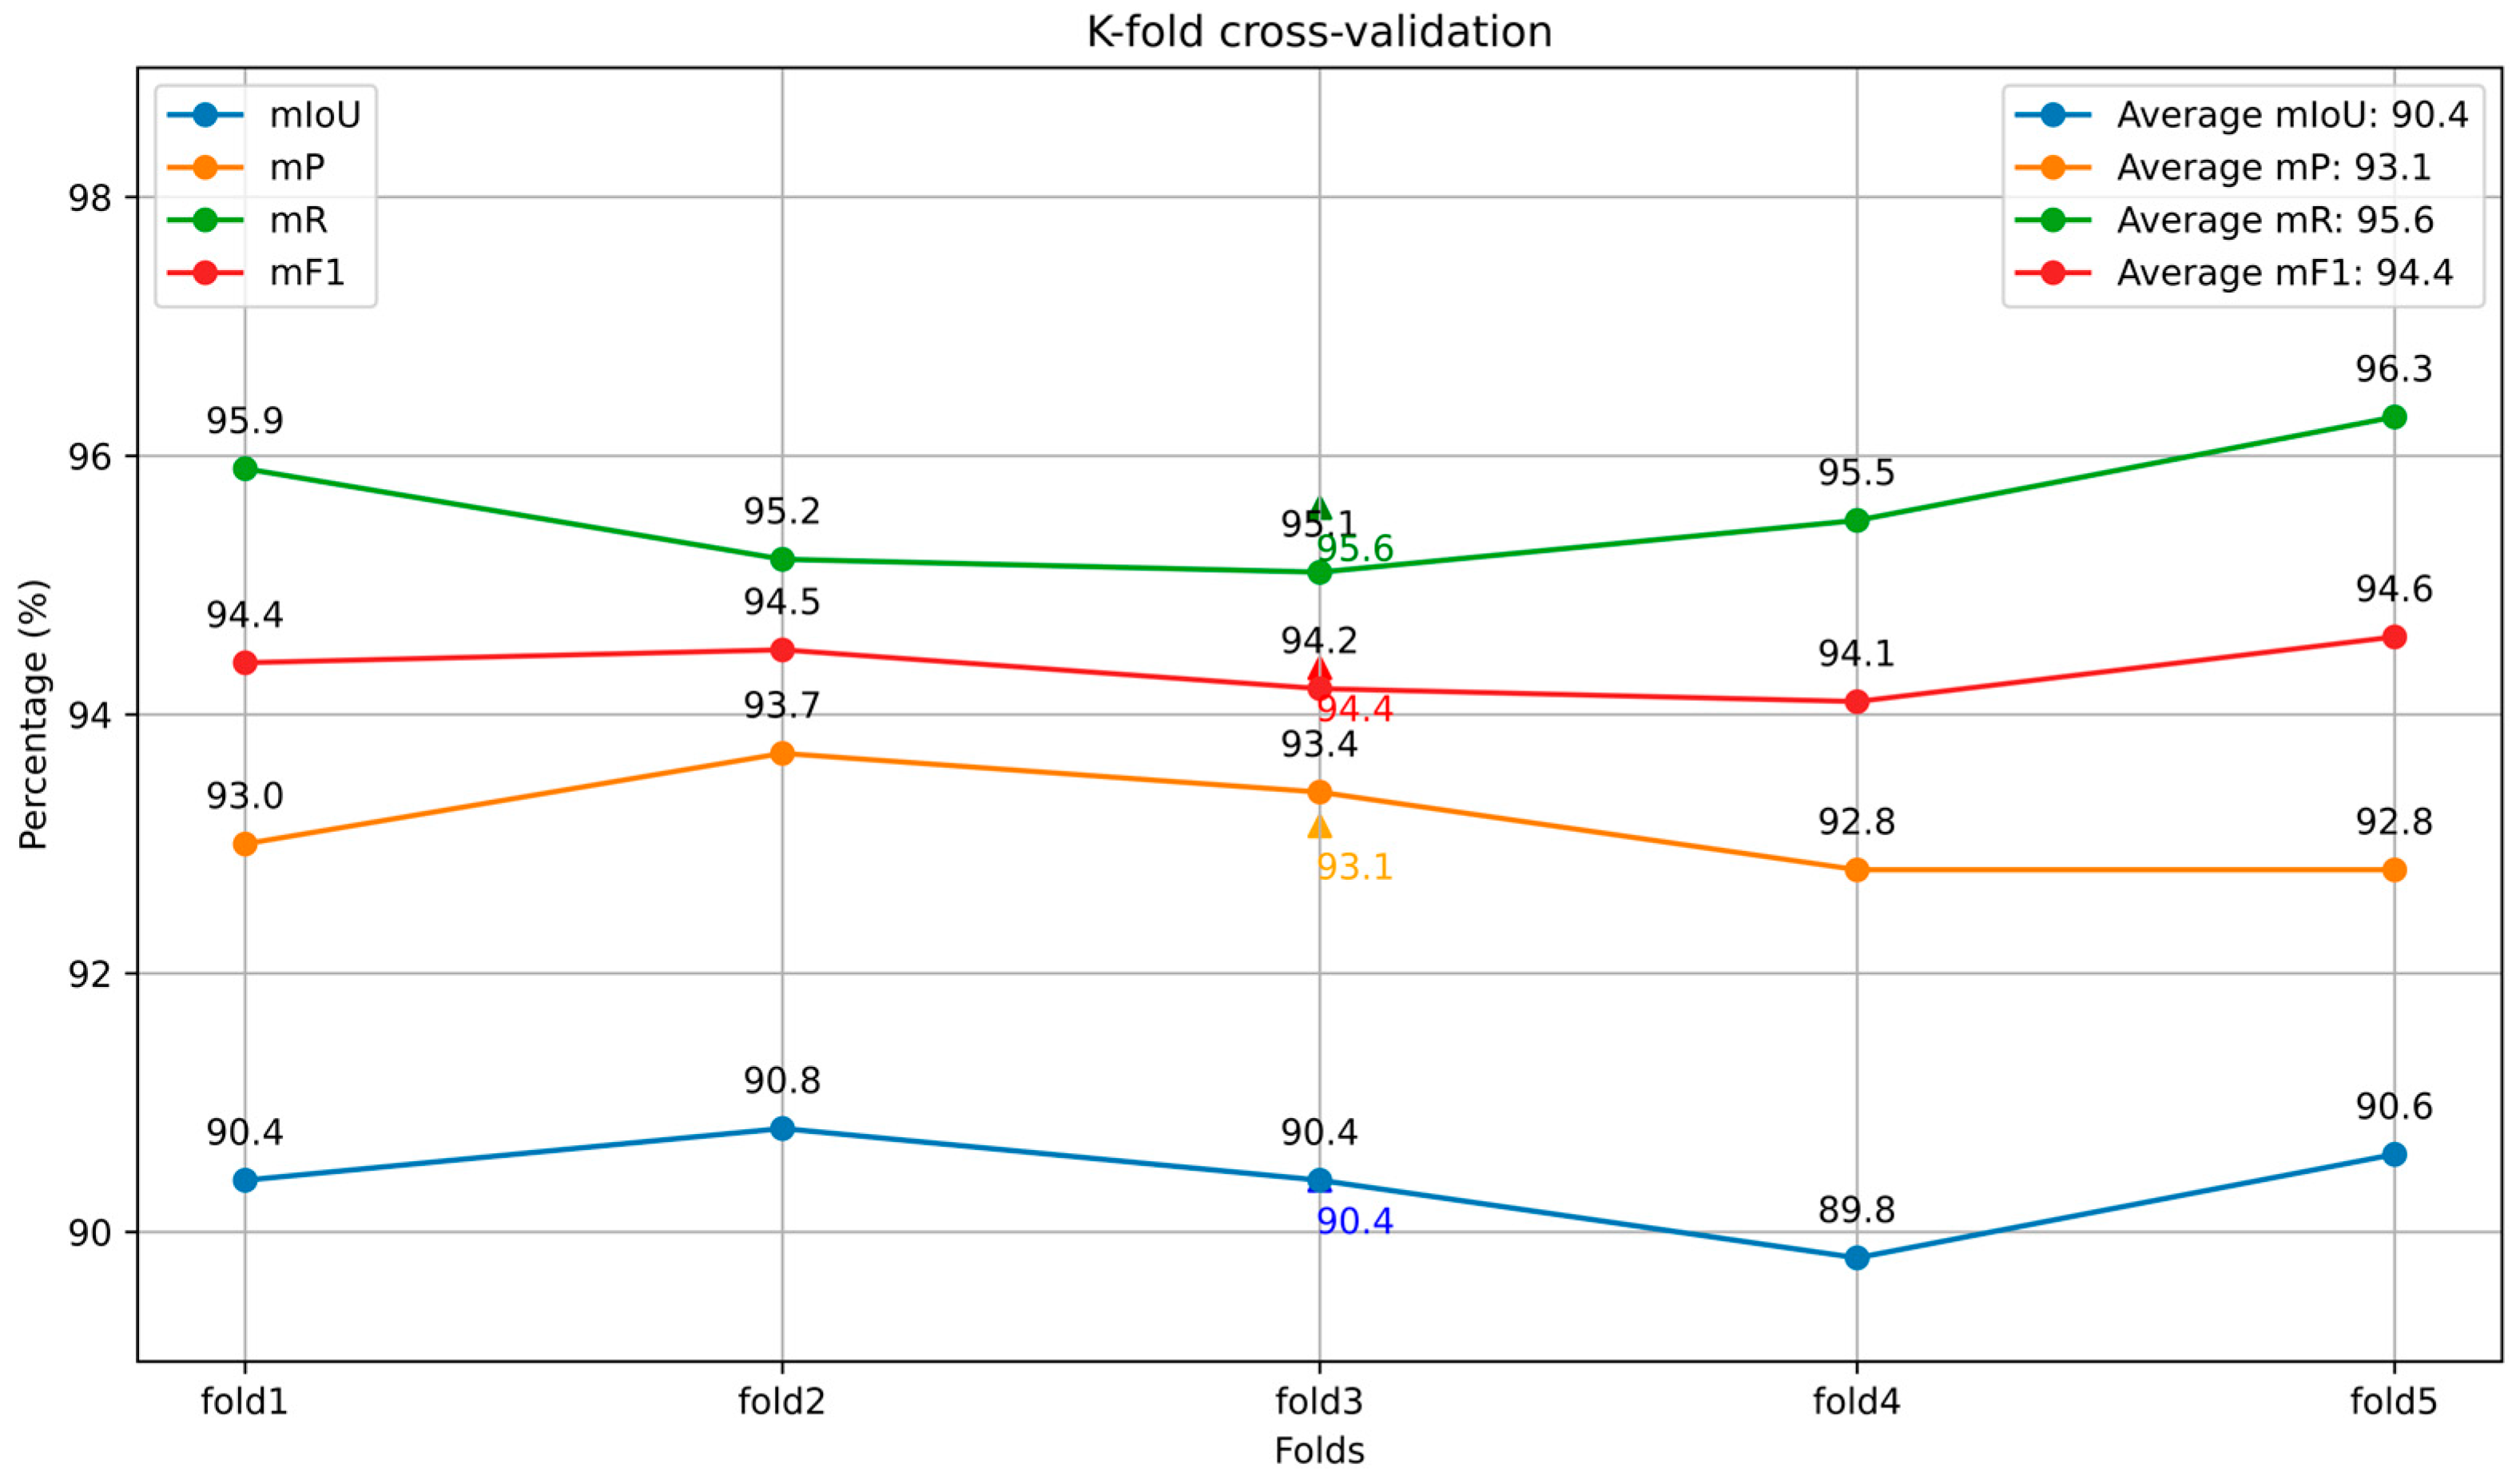
- The CPHNet proposed in this paper achieves 90.4% mIoU, 93.1% mP, 95.6% mR and 94.4% mF1 on the self-built dataset. This method can effectively extract the stem features of pumpkin seedlings with different shapes, and realize the accurate segmentation of the stem region of pumpkin seedlings. By accurately segmenting the stem region of pumpkin seedlings, CPHNet can provide reliable data for further morphological analysis, growth trend prediction and other studies, and provide important support for healthy growth of pumpkin seedlings and disease prevention and control.
2. Materials and Methods
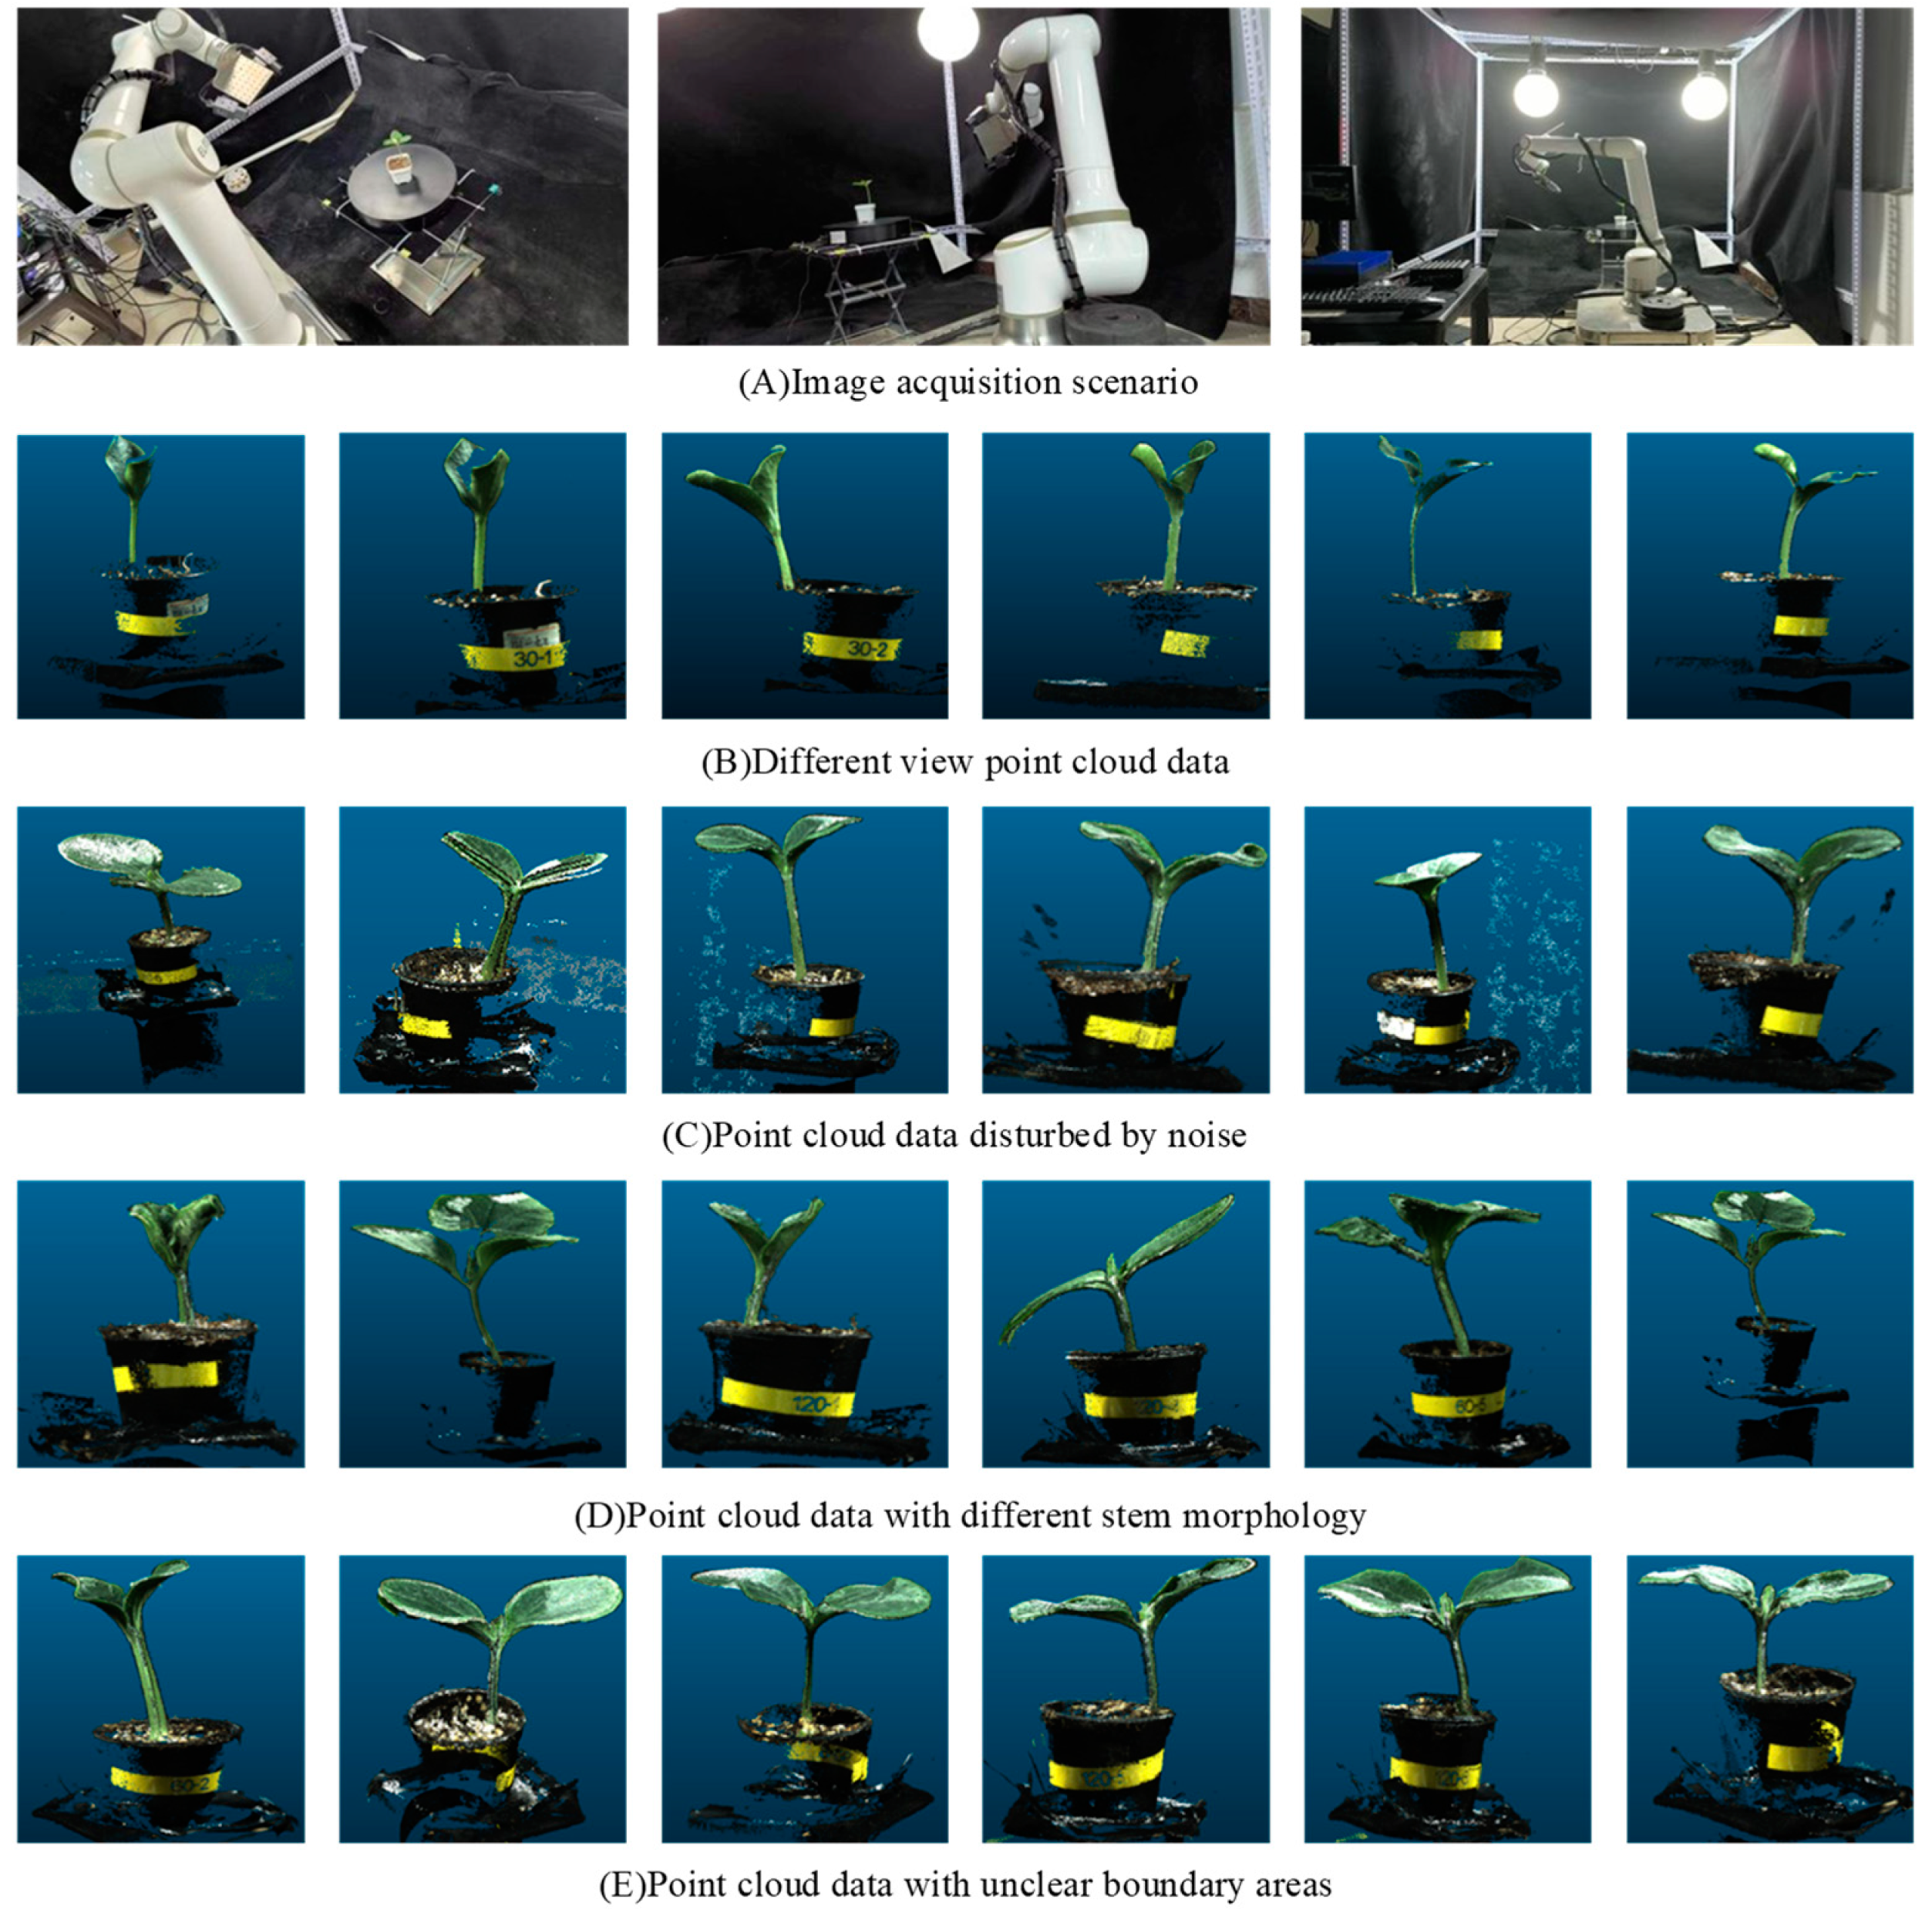
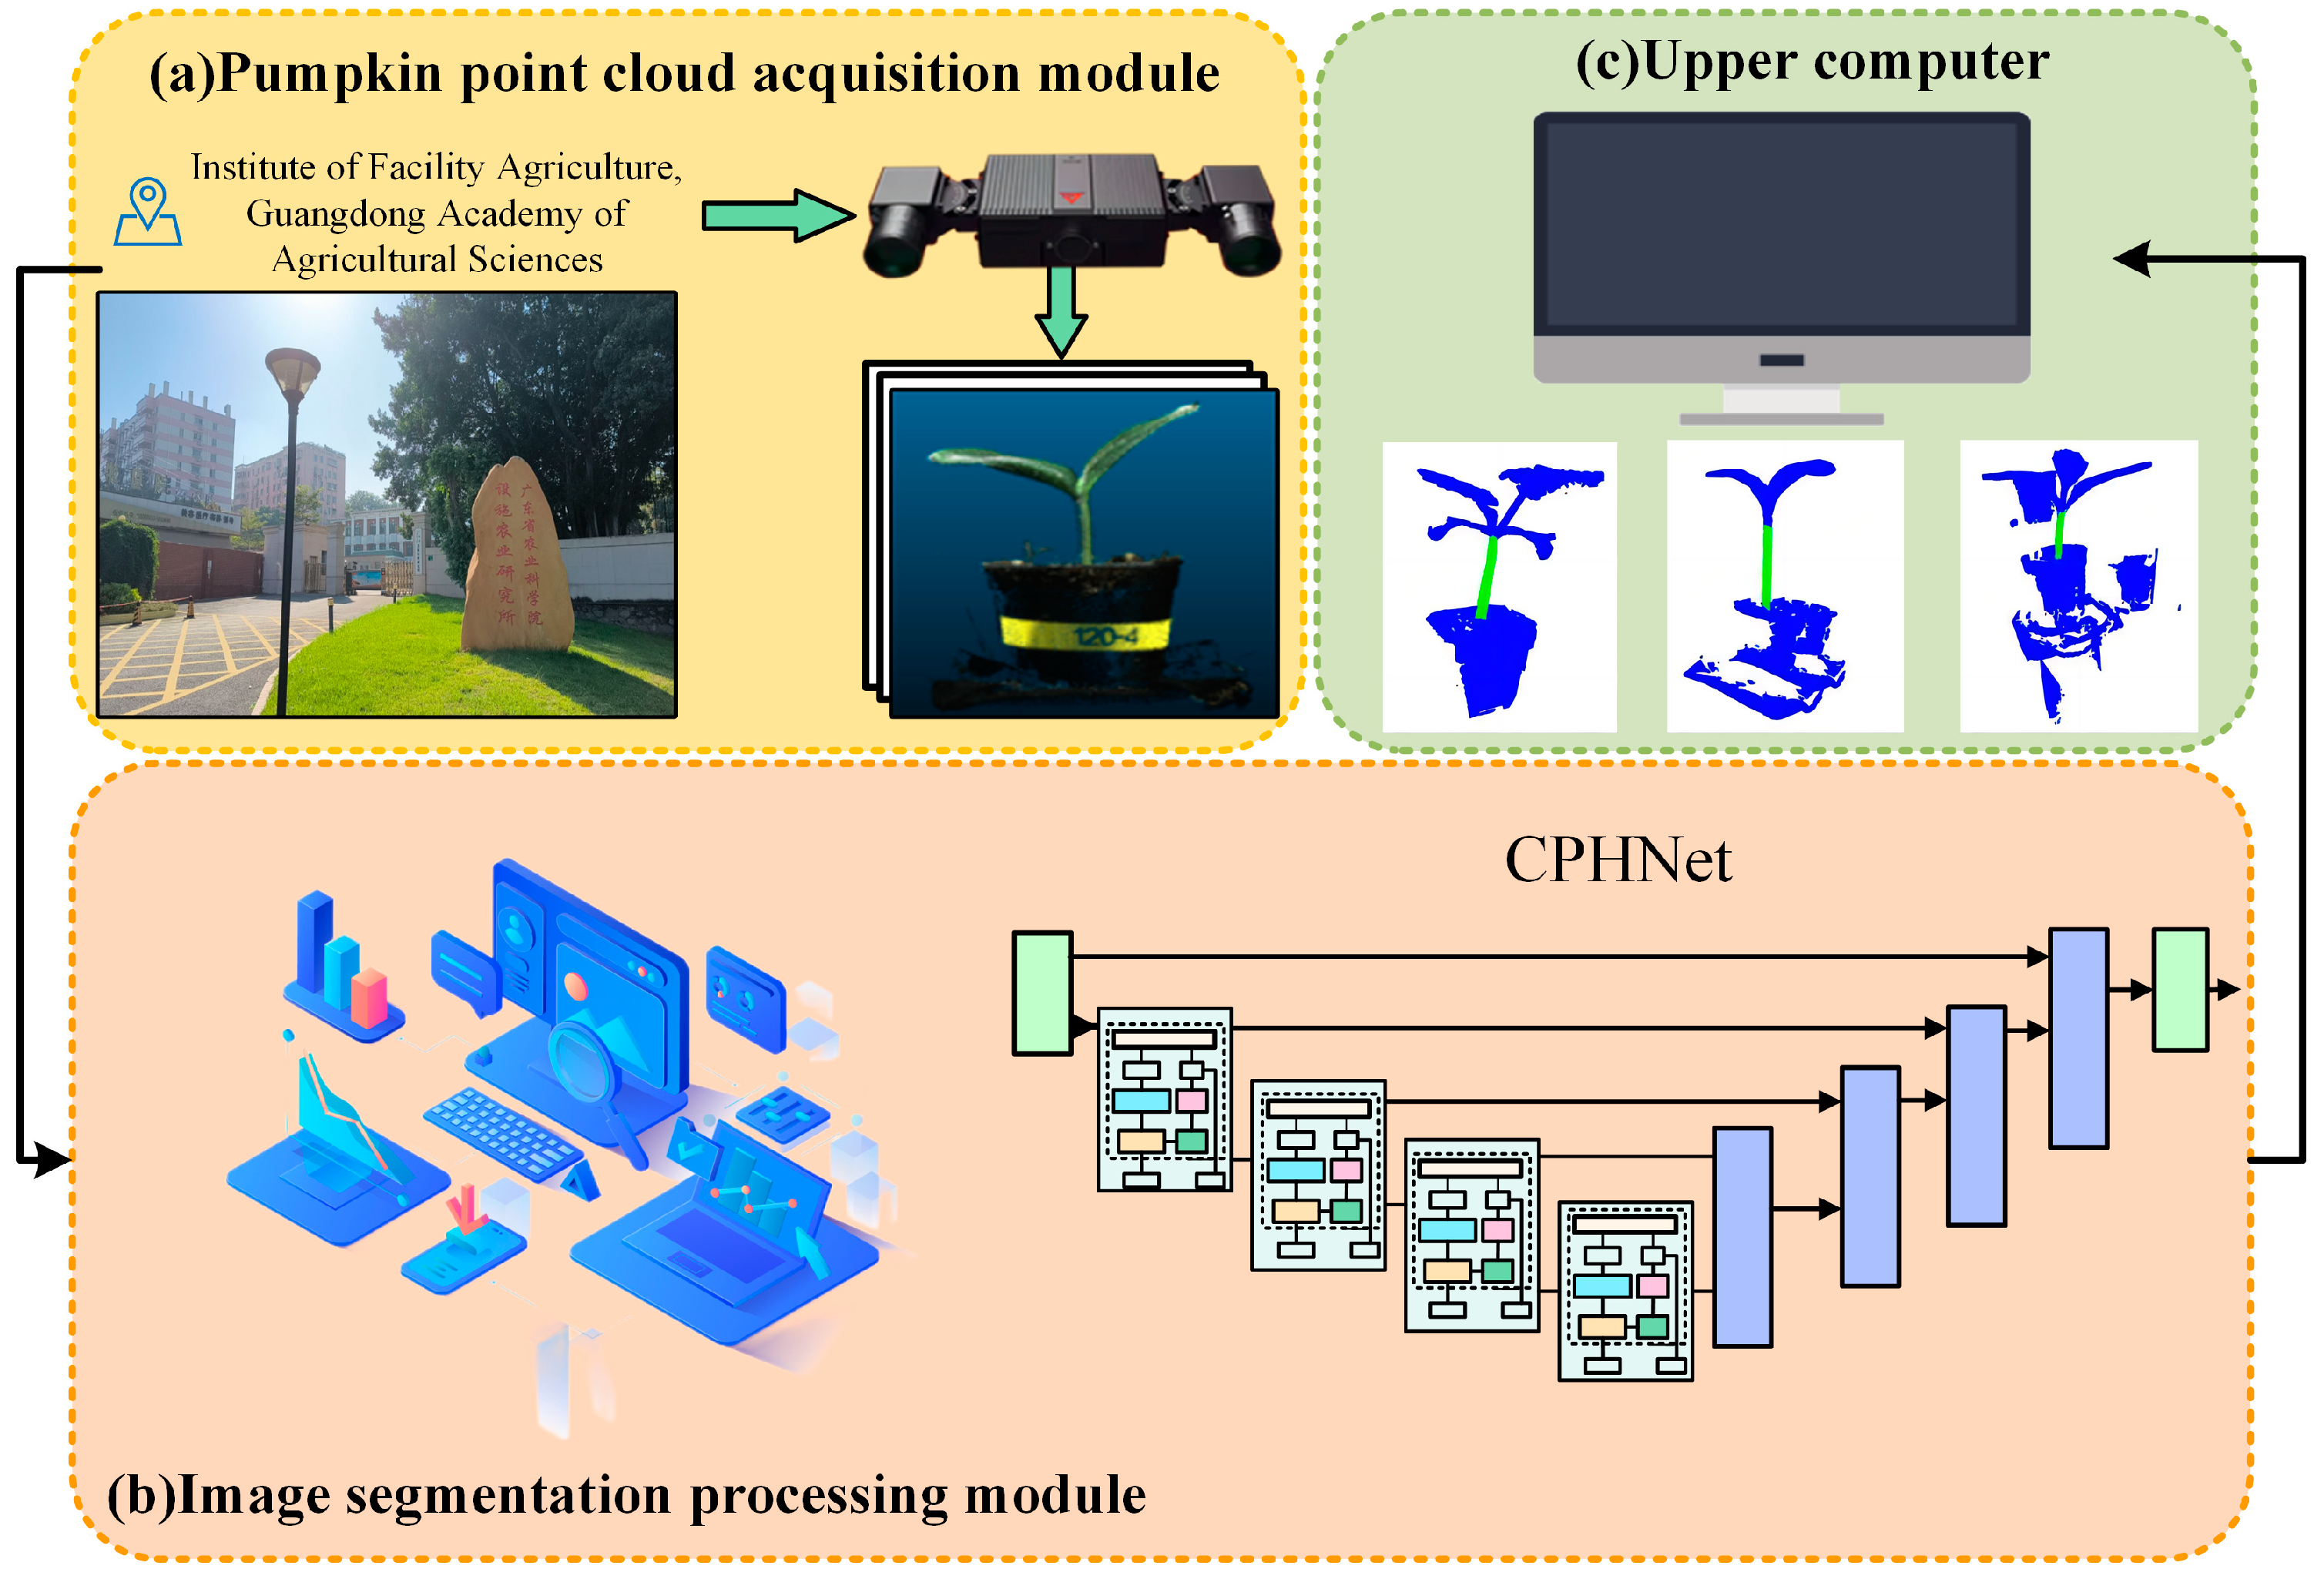
2.1. Data Acquisition
2.2. Data Processing
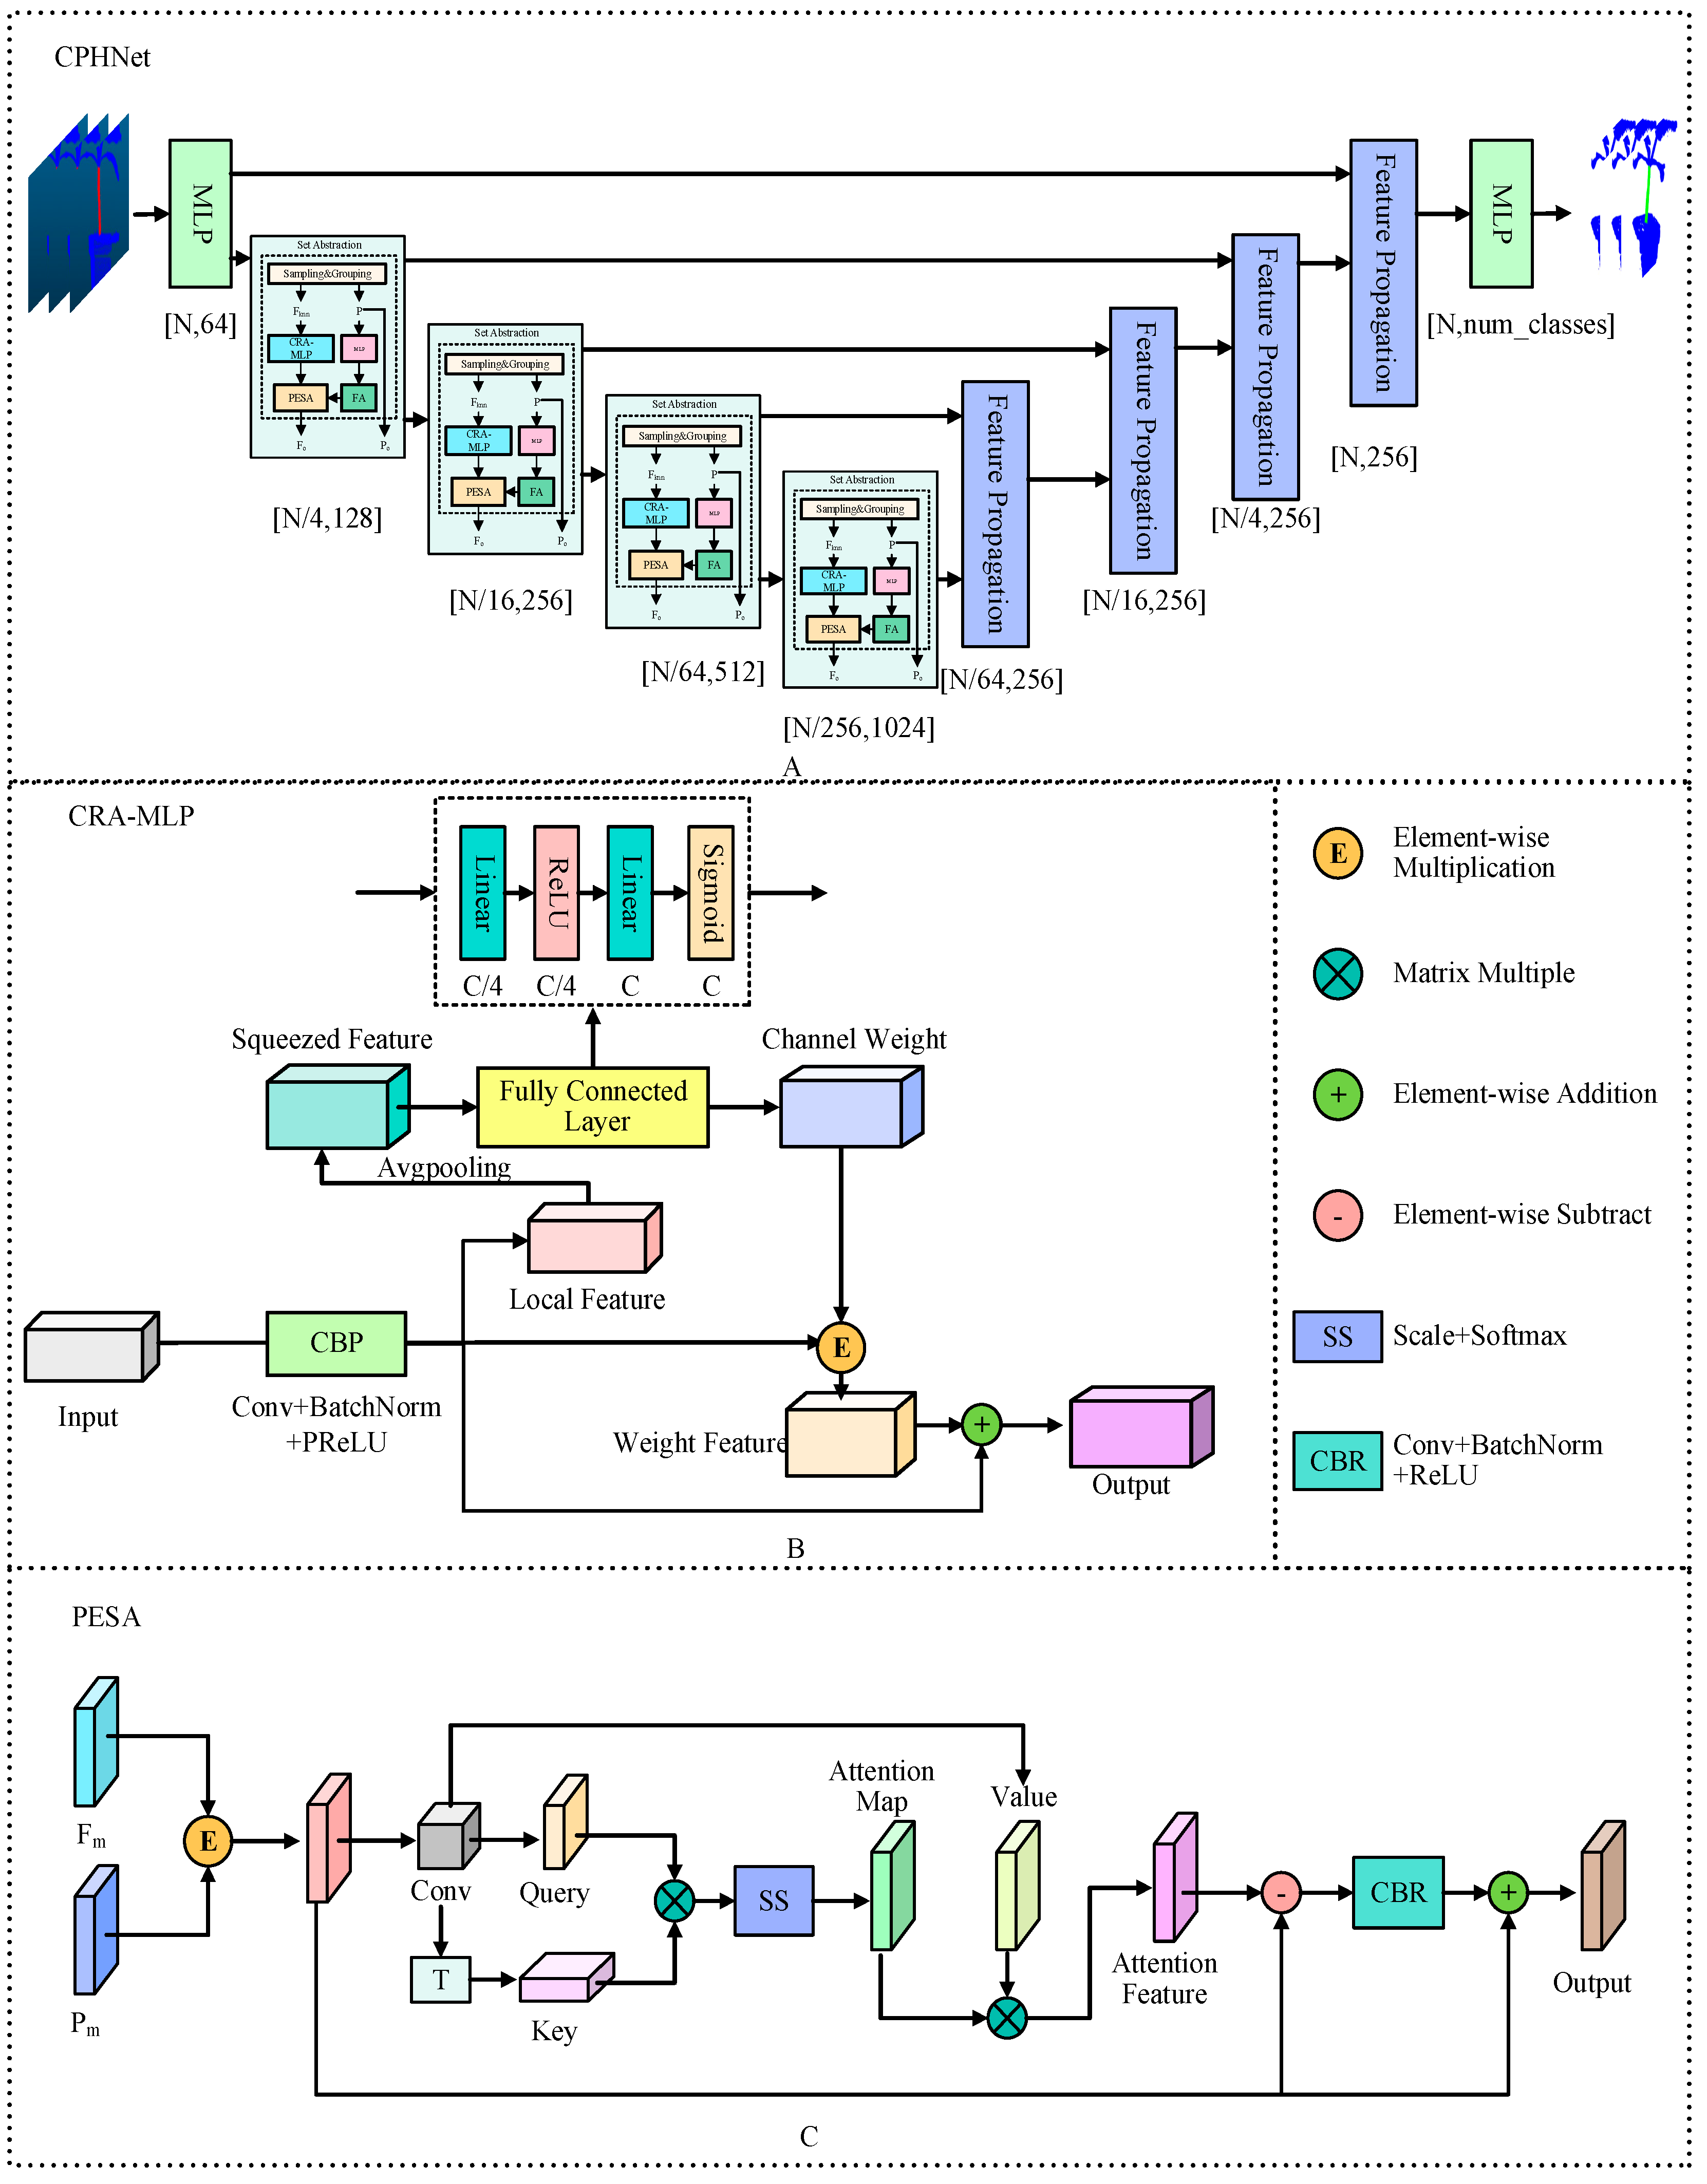
2.3. CPHNet
| Algorithm 1: All experiments in this paper used the default values. |
| Require: , the learning rate. m, the momentum. n, the number of epochs. , CPHNet parameter. |
| 1: while has not converged: |
| 2: for epoch = 0, …, n do: |
| 3: Randomly select a batch of data from the training set |
| 4: is local features. |
| 5: CRA-MLP |
| 6: |
| 7: |
| 8: PESA |
| 9: is position information. |
| 10: |
| 11: , the weights of Cross Entropy Loss. , the weights of Dice Loss. is the grad during the training process. |
| 12: |
| 13: end for |
| 14: end while |
2.3.1. Channel Residual Attention Multilayer Perceptron
- 1.
- For the nonlinear mapping layer in the MLP of the original model, we used the PReLU [41] activation function instead of the standard ReLU [42] activation function to improve the performance and training stability of the network. Unlike ReLU, PReLU allows some neurons to have negative activation values, thus providing a degree of linear responsiveness. This allows PReLU to learn more complex features. ReLU has a “dead neuron” problem [43]; that is, some neurons may never be activated during training, resulting in weights that are not updated. PReLU can mitigate this problem to some extent because it allows a subset of neurons to remain non-zero activated. And the parameters of PReLU can be trained, which means that the network can adaptively learn the activation function of each neuron, resulting in a stronger fitting ability.
- 2.
- Add channel residual attention mechanism at the end of MLP.
2.3.2. Self-Attention Mechanism of Position Enhancement
- 1.
- Enhancement of coordinate position information. First, the 3D original coordinate information P is passed through the MLP, and the convolution, normalization and nonlinear activation are carried out in the MLP. Through convolution, the channel number of the coordinate information matches the number of the incoming characteristic channel, and the position coordinate information is enriched to obtain . Then is weighted by the FA feature concern layer to get , which helps the network to better select the features of the location information. FA is a simple feature of concern.
- 2.
- Self-attention weighting. Firstly, the incoming enhanced position information and feature information are multiplied element by element to obtain the fused feature , where Q, K and V are the matrix generated by the linear transformation of the fused feature , and the process is defined as follows:
2.3.3. Hybrid Loss Function of Cross Entropy Loss and Dice Loss
3. Experimental Results and Analysis
3.1. Environment and Settings
3.2. Evaluating Indicator
3.3. CPHNet Performance Analysis
3.4. Module Effectiveness Experiments
3.4.1. Effectiveness of the Data Processing
3.4.2. Effectiveness of CRA-MLP
3.4.3. Effectiveness of PESA
3.4.4. Effectiveness of HCE-Dice Loss
3.4.5. Ablation Experiment
3.5. Comparison of State-of-the-Art (SOTA) Models
3.6. Visualize Results Comparison
3.7. Application and Prospect
4. Discussion
5. Conclusions
Author Contributions
Funding
Data Availability Statement
Acknowledgments
Conflicts of Interest
References
- Pan, Y. Analysis of concepts and categories of plant phenome and phenomics. Acta Agron. Sin. 2015, 41, 175–186. [Google Scholar] [CrossRef]
- Zhan, J.; Xie, Y.; Guo, J.; Hu, Y.; Zhou, G.; Cai, W.; Wang, Y.; Chen, A.; Liu, X.; Li, M.; et al. DGPF-RENet: A Low Data Dependence Network with Low Training Iterations for Hyperspectral Image Classification. IEEE Trans. Geosci. Remote Sens. 2023. [Google Scholar] [CrossRef]
- He, X.; Tang, Z.; Deng, Y.; Zhou, G.; Wang, Y.; Li, L. UAV-based road crack object-detection algorithm. Autom. Constr. 2023, 154, 105014. [Google Scholar] [CrossRef]
- Yang, W.; Duan, L.; Chen, G.; Xiong, L.; Liu, Q. Plant phenomics and high-throughput phenotyping: Accelerating rice functional genomics using multidisciplinary technologies. Curr. Opin. Plant Biol. 2013, 16, 180–187. [Google Scholar] [CrossRef]
- Deng, J.; Huang, W.; Zhou, G.; Hu, Y.; Li, L.; Wang, Y. Identification of Banana Leaf Disease Based on KVA and GR-ARNet. J. Integr. Agric. 2023. [Google Scholar] [CrossRef]
- Zhang, Y.; Zhou, G.; Chen, A.; He, M.; Li, J.; Hu, Y. A precise apple leaf diseases detection using BCTNet under unconstrained environments. Comput. Electron. Agric. 2023, 212, 108132. [Google Scholar] [CrossRef]
- Lin, H.; Zhou, G.; Chen, A.; Li, J.; Li, M.; Zhang, W.; Hu, Y.; Yu, W. EM-ERNet for Image-Based Banana Disease Recognition. J. Food Meas. Charact. 2021, 15, 4696–4710. [Google Scholar] [CrossRef]
- Fang, S.; Wang, Y.; Zhou, G.; Chen, A.; Cai, W.; Wang, Q.; Hu, Y.; Li, L. Multi-channel feature fusion networks with hard coordinate attention mechanism for maize disease identification under complex backgrounds. Comput. Electron. Agric. 2022, 203, 107486. [Google Scholar] [CrossRef]
- Chen, X.; Zhou, G.; Chen, A.; Yi, J.; Zhang, W.; Hu, Y. Identification of tomato leaf diseases based on combination of ABCK-BWTR and B-ARNet. Comput. Electron. Agric. 2020, 178, 105730. [Google Scholar] [CrossRef]
- Zhang, W.; Zhou, G.; Chen, A.; Pu, L.; Hu, Y. Deep multi-scale dual-channel convolutional neural network for Internet of Things apple disease detection. Comput. Electron. Agric. 2022, 194, 106749. [Google Scholar] [CrossRef]
- Clark, R.T.; MacCurdy, R.B.; Jung, J.K.; Shaff, J.E.; McCouch, S.R.; Aneshansley, D.J.; Kochian, L.V. Three-dimensional root phenotyping with a novel imaging and software platform. Plant Physiol. 2011, 156, 455–465. [Google Scholar] [CrossRef]
- Zhan, J.; Hu, Y.; Zhou, G.; Wang, Y.; Cai, W.; Li, L. A high-precision forest fire smoke detection approach based on ARGNet. Comput. Electron. Agric. 2022, 196, 106874. [Google Scholar] [CrossRef]
- Xiao, Y.; Liu, S.; Hou, C.; Liu, Q.; Li, F.; Zhang, W. Segmentation and Phenotypic Analysis of Soybean Plant Organs Based on 3D Point Clouds. China Agric. Sci. Technol. News 2023, 25, 115–125. [Google Scholar]
- Zhu, C.; Miao, T.; Xu, T.; Li, N.; Deng, H.; Zhou, Y. Segmentation and Phenotypic Extraction of Corn Stem and Leaves Based on Skeleton and Optimal Transport Distance of Point Clouds. J. Agric. Eng. 2021, 37, 188–198. [Google Scholar]
- Lin, C.; Han, J.; Xie, L.; Hu, F. Cylinder space segmentation method for field crop population using 3D point cloud. Trans. Chin. Soc. Agric. Eng. 2021, 37, 175–182. [Google Scholar]
- Liu, J.; Liu, Y.; Doonan, J. Point cloud based iterative segmentation technique for 3D plant phenotyping. In Proceedings of the 2018 IEEE International Conference on Information and Automation (ICIA), Wuyishan, China, 11–13 August 2018; IEEE: Singapore, 2018; pp. 1072–1077. [Google Scholar] [CrossRef]
- Peng, C.; Li, S.; Miao, Y.; Zhang, Z.; Zhang, M.; Li, H. Stem-leaf segmentation and phenotypic trait extraction of tomatoes using three-dimensional point cloud. Trans. Chin. Soc. Agric. Eng. 2022, 38, 187–194. [Google Scholar]
- Li, M.; Zhou, G.; Chen, A.; Li, L.; Hu, Y. Identification of tomato leaf diseases based on LMBRNet. Eng. Appl. Artif. Intell. 2023, 123, 106195. [Google Scholar] [CrossRef]
- Armeni, I.; Sener, O.; Zamir, A.R.; Jiang, H.; Brilakis, I.; Fischer, M.; Savarese, S. 3D semantic parsing of large-scale indoor spaces. In Proceedings of the IEEE Conference on Computer Vision and Pattern Recognition, Las Vegas, NV, USA, 27–30 June 2016; pp. 1534–1543. [Google Scholar] [CrossRef]
- Behley, J.; Garbade, M.; Milioto, A.; Quenzel, J.; Behnke, S.; Stachniss, C.; Gall, J. Semantickitti: A dataset for semantic scene understanding of lidar sequences. In Proceedings of the IEEE/CVF International Conference on Computer Vision, Seoul, Republic of Korea, 27–28 October 2019; pp. 9297–9307. [Google Scholar] [CrossRef]
- Li, J.; Zhou, G.; Chen, A.; Lu, C.; Li, L. BCMNet: Cross-Layer Extraction Structure and Multiscale Downsampling Network With Bidirectional Transpose FPN for Fast Detection of Wildfire Smoke. IEEE Syst. J. 2022, 17, 1235–1246. [Google Scholar] [CrossRef]
- Suo, J.; Zhan, J.; Zhou, G.; Chen, A.; Hu, Y.; Huang, W.; Cai, W.; Hu, Y.; Li, L. CASM-AMFMNet: A Network Based on Coordinate Attention Shuffle Mechanism and Asymmetric Multi-Scale Fusion Module for Classification of Grape Leaf Diseases. Front. Plant Sci. 2022, 13, 846767. [Google Scholar] [CrossRef]
- Yu, Y.; Cheng, Q.; Wang, F.; Zhu, Y.; Shang, X.; Jones, A.; He, H.; Song, Y. Crop/Plant Modeling Supports Plant Breeding: I. Optimization of Environmental Factors in Accelerating Crop Growth and Development for Speed Breeding. Plant Phenomics 2023, 5, 0099. [Google Scholar] [CrossRef]
- Guan, W.; Li, W.; Ren, Y. Point cloud registration based on improved ICP algorithm. In Proceedings of the 2018 Chinese Control And Decision Conference (CCDC), Shenyang, China, 9–11 June 2018; pp. 1461–1465. [Google Scholar] [CrossRef]
- Mao, X.; Shen, C.; Yang, Y. Image restoration using convolutional auto-encoders with symmetric skip connections. arXiv 2016, arXiv:1606.08921. [Google Scholar] [CrossRef]
- Xie, J.; Xu, Y.; Zheng, Z.; Zhu, S.; Wu, Y. Generative pointnet: Deep energy-based learning on unordered point sets for 3d generation, reconstruction and classification. In Proceedings of the IEEE/CVF Conference on Computer Vision and Pattern Recognition, Nashville, TN, USA, 20–25 June 2021; pp. 14976–14985. [Google Scholar] [CrossRef]
- Rakotosaona, M.J.; Barbera, V.L.; Guerrero, P.; Mitra, N.J.; Ovsjanikov, M. PointCleanNet: Learning to denoise and remove outliers from dense point clouds. In Computer Graphics Forum; Wiley-Blackwell Publishing Ltd.: London, UK, 2020; Volume 39, pp. 185–203. [Google Scholar] [CrossRef]
- Zeng, A.; Luo, L.; Pan, D.; Xian, Z.; Jiang, X.; Xian, Y.; Liu, L. Multi-task segmentation network for the plant on 3D point cloud. Trans. Chin. Soc. Agric. Eng. 2023, 39, 132–140. [Google Scholar]
- Li, M.; Zhou, G.; Chen, A.; Yi, J.; Lu, C.; He, M.; Hu, Y. FWDGAN-based data augmentation for tomato leaf disease identification. Comput. Electron. Agric. 2022, 194, 106779. [Google Scholar] [CrossRef]
- Zhang, L.; Zhou, G.; Lu, C.; Chen, A.; Wang, Y.; Li, L.; Cai, W. MMDGAN: A fusion data augmentation method for tomato-leaf disease identification. Appl. Soft Comput. 2022, 123, 108969. [Google Scholar] [CrossRef]
- Zhang, K.; Zuo, W.; Chen, Y.; Meng, D.; Zhang, L. Beyond a Gaussian Denoiser: Residual Learning of Deep CNN for Image Denoising. IEEE Trans. Image Process. 2017, 26, 3142–3155. [Google Scholar] [CrossRef] [PubMed]
- Qi, C.R.; Yi, L.; Su, H.; Guibas, L.J. PointNet++: Deep Hierarchical Feature Learning on Point Sets in a Metric Space. Neural Inf. Process. Syst. 2017. [Google Scholar] [CrossRef]
- Deng, Y.; Xi, H.; Zhou, G.; Chen, A.; Wang, Y.; Li, L.; Hu, Y. An effective image-based tomato leaf disease segmentation method 8 using MC-UNet. Plant Phenomics 2023, 5, 0049. [Google Scholar] [CrossRef]
- Wang, Q.; Chen, A.; Cai, W.; Cai, C.; Fang, S.; Li, L.; Zhou, G. Segmentation network of concrete cracks with multi-frequency OctaveRes dual encoder and cross-attention mechanism optimized by average weight. Autom. Constr. 2023, 155, 105050. [Google Scholar] [CrossRef]
- Ulyanov, D.; Vedaldi, A.; Lempitsky, V. Deep image prior. Int. J. Comput. Vis. 2020, 128, 1867–1888. [Google Scholar] [CrossRef]
- Zhang, L.; Lu, C.; Xu, H.; Chen, A.; Li, L.; Zhou, G. MMFNet: Forest Fire Smoke Detection Using Multiscale Convergence Coordinated Pyramid Network with Mixed Attention and Fast-robust NMS. IEEE Internet Things J. 2023, 10, 18168–18180. [Google Scholar] [CrossRef]
- Tang, Z.; He, X.; Zhou, G.; Chen, A.; Wang, Y.; Li, L.; Hu, Y. A Precise Image-Based Tomato Leaf Disease Detection Approach Using PLPNet. Plant Phenomics 2023, 5, 0042. [Google Scholar] [CrossRef]
- Sun, L.; Yang, Y.; Zhou, G.; Chen, A.; Zhang, Y.; Cai, W.; Li, L. An integration-competition network for bridge crack segmentation under complex scenes. Comput. Aided Civ. Infrastruct. Eng. 2024, 39, 617–634. [Google Scholar] [CrossRef]
- Hu, J.; Shen, L.; Sun, G. Squeeze-and-excitation networks. In Proceedings of the IEEE Conference on Computer Vision and Pattern Recognition, Salt Lake City, UT, USA, 18–23 June 2018; pp. 7132–7141. [Google Scholar] [CrossRef]
- Zhang, Y.; Huang, S.; Zhou, G.; Hu, Y.; Li, L. Identification of tomato leaf diseases based on multi-channel automatic orientation recurrent attention network. Comput. Electron. Agric. 2023, 205, 107605. [Google Scholar] [CrossRef]
- Finn, C.; Goodfellow, I.; Levine, S. Unsupervised learning for physical interaction through video prediction. Adv. Neural Inf. Process. Syst. 2016, 29. [Google Scholar] [CrossRef]
- Cai, C.; Wang, Q.; Cai, W.; Yang, Y.; Hu, Y.; Li, L.; Wang, Y.; Zhou, G. Identification of grape leaf diseases based on VN-BWT and Siamese DWOAM-DRNe. Eng. Appl. Artif. Intell. 2023, 123, 106341. [Google Scholar] [CrossRef]
- He, K.; Zhang, X.; Ren, S.; Sun, J. Delving deep into rectifiers: Surpassing human-level performance on imagenet classification. In Proceedings of the IEEE International Conference on Computer Vision, Santiago, Chile, 7–13 December 2015; pp. 1026–1034. [Google Scholar] [CrossRef]
- Liu, X.; Hu, Y.; Zhou, G.; Cai, W.; He, M.; Zhan, J.; Hu, Y.; Li, L. DS-MENet for the classification of citrus disease. Front. Plant Sci. 2022, 13, 884464. [Google Scholar] [CrossRef] [PubMed]
- You, H.; Xiong, Y.; Dai, X.; Wu, B.; Zhang, P.; Fan, H.; Vajda, P.; Lin, Y.C. Castling-ViT: Compressing self-attention via switching towards Linear-Angular attention at vision transformer inference. In Proceedings of the IEEE/CVF Conference on Computer Vision and Pattern Recognition, Vancouver, BC, Canada, 17–24 June 2023; pp. 14431–14442. [Google Scholar]
- Pan, X.; Ye, T.; Xia, Z.; Song, S.; Huang, G. Slide-Transformer: Hierarchical vision transformer with local self-attention. In Proceedings of the IEEE/CVF Conference on Computer Vision and Pattern Recognition, Vancouver, BC, Canada, 17–24 June 2023; pp. 2082–2091. [Google Scholar] [CrossRef]
- Wu, X.; Lao, Y.; Jiang, L.; Liu, X.; Zhao, H. Point Transformer V2: Grouped vector attention and partition-based pooling. Adv. Neural Inf. Process. Syst. 2022, 35, 33330–33342. [Google Scholar] [CrossRef]
- Vaswani, A.; Shazeer, N.; Parmar, N.; Uszkoreit, J.; Jones, L.; Gomez, A.N.; Kaiser, L.; Polosukhin, L. Attention is all you need. Adv. Neural Inf. Process. Syst. 2017, 30. [Google Scholar] [CrossRef]
- Dosovitskiy, A.; Beyer, L.; Kolesnikov, A.; Weissenborn, D.; Zhai, X.; Unterthiner, T.; Dehghani, M.; Minderer, M.; Heigold, G.; Gelly, S.; et al. An image is worth 16x16 words: Transformers for image recognition at scale. arXiv 2020, arXiv:2010.11929. [Google Scholar] [CrossRef]
- Engel, N.; Belagiannis, V.; Dietmayer, K. Point transformer. IEEE Access 2021, 9, 134826–134840. [Google Scholar] [CrossRef]
- Guo, M.; Cai, J.; Liu, Z.; Mu, T.; Martin, R.R.; Mu, S. Pct: Point cloud transformer. Comput. Vis. Media 2021, 7, 187–199. [Google Scholar] [CrossRef]
- Li, Y.; Bu, R.; Sun, M.; Wu, W.; Di, X.; Chen, B. PointCNN: Convolution on X-Transformed Points. Adv. Neural Inf. Process. Syst. 2018, 31. [Google Scholar] [CrossRef]
- Zhu, X.; Lyu, S.; Wang, X.; Zhao, Q. TPH-YOLOv5: Improved YOLOv5 based on transformer prediction head for object detection on drone-captured scenarios. In Proceedings of the IEEE/CVF International Conference on Computer Vision, Montreal, BC, Canada, 11–17 October 2021; pp. 2778–2788. [Google Scholar] [CrossRef]
- Devlin, J.; Chang, M.W.; Lee, K.; Toutanova, K. Bert: Pre-training of deep bidirectional transformers for language understanding. arXiv 2018, arXiv:1810.04805. [Google Scholar] [CrossRef]
- Zhou, Z.; Siddiquee, M.M.R.; Tajbakhsh, N.; Liang, J. Unet++: A nested u-net architecture for medical image segmentation. In Proceedings of the Deep Learning in Medical Image Analysis and Multimodal Learning for Clinical Decision Support: 4th International Workshop, DLMIA 2018, and 8th International Workshop, ML-CDS 2018, Held in Conjunction with MICCAI 2018, Granada, Spain, 20 September 2018; Springer International Publishing: Berlin/Heidelberg, Germany, 2018; pp. 3–11. [Google Scholar] [CrossRef]
- Gu, Z.; Cheng, J.; Fu, H.; Zhou, K.; Hao, H.; Zhao, Y.; Zhang, T.; Gao, S.; Liu, J. CE-Net: Context encoder network for 2d medical image segmentation. IEEE Trans. Med. Imaging 2019, 38, 2281–2292. [Google Scholar] [CrossRef] [PubMed]
- Qi, C.R.; Su, H.; Mo, K.; Guibas, L.J. Pointnet: Deep learning on point sets for 3d classification and segmentation. In Proceedings of the IEEE Conference on Computer Vision and Pattern Recognition, Honolulu, HI, USA, 21–26 July 2017; pp. 652–660. [Google Scholar] [CrossRef]
- Wang, L.; Huang, Y.; Hou, Y.; Zhang, S.; Shan, J. Graph attention convolution for point cloud semantic segmentation. In Proceedings of the IEEE/CVF Conference on Computer Vision and Pattern Recognition, Long Beach, CA, USA, 15–20 June 2019; pp. 10296–10305. [Google Scholar] [CrossRef]
- Qian, G.; Li, Y.; Peng, H.; Mai, J.; Hammoud, H.; Elhoseiny, M.; Ghanem, B. Pointnext: Revisiting pointnet++ with improved training and scaling strategies. Adv. Neural Inf. Process. Syst. 2022, 35, 23192–23204. [Google Scholar] [CrossRef]
- Wang, G.; Zhai, Q.; Liu, H. Cross self-attention network for 3D point cloud. Knowl. Based Syst. 2022, 247, 108769. [Google Scholar] [CrossRef]

| Pre-Statistical Filtering | After Statistical Filtering | Primary Point Cloud | Random Rotation | Random Jitter | Gaussian Noise |
|---|---|---|---|---|---|
  |   | 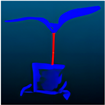 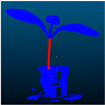 | 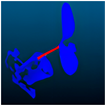 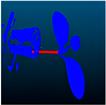 |   |   |
| Hardware environment | CPU | AMD Ryzen 7 5800H with Radeon Graphics |
| RAM | 16 GB | |
| GPU | NVIDIA GeForce RTX 3060 | |
| Video memory | 6 GB | |
| Software environment | OS | Windows11 |
| CUDA | 11.2 | |
| Python | 3.9.13 | |
| Torch | 2.0.0 |
| Module | Method | mIoU | mP | mR | mF1 | Params (M) | Speed |
|---|---|---|---|---|---|---|---|
| Data processing | Raw data | 87.7 | 89.0 | 95.6 | 92.2 | 7.282 | 0.03 |
| +Statistically filtered | 89.3 | 92.1 | 94.7 | 93.4 | 7.282 | 0.03 | |
| +Statistically filtered +Data enhanced | 90.4 | 93.1 | 95.6 | 94.4 | 7.282 | 0.03 | |
| CRA-MLP | PointNet++ | 79.9 | 84.5 | 89.8 | 87.0 | 1.403 | 0.10 |
| +CRA-MLP | 84.4 | 87.0 | 97.1 | 91.8 | 3.443 | 0.03 | |
| ReLU | 83.8 | 86.3 | 94.0 | 90.0 | 3.443 | 0.03 | |
| PReLU | 84.4 | 87.0 | 97.1 | 91.8 | 3.443 | 0.03 | |
| PESA | PointNet++ | 79.9 | 84.5 | 89.8 | 87.0 | 1.403 | 0.10 |
| +SA | 81.7 | 84.6 | 92.9 | 88.5 | 6.591 | 0.03 | |
| +PESA | 84.3 | 87.5 | 93.1 | 90.2 | 6.583 | 0.03 | |
| HCE-Dice Loss | Cross Entropy Loss | 79.9 | 84.5 | 89.8 | 87.0 | 1.403 | 0.10 |
| HCE-Dice Loss | 84.6 | 86.5 | 97.6 | 91.7 | 1.403 | 0.10 |
| Group | Method | mIoU | mP | mR | mF1 | Params (M) | Speed |
|---|---|---|---|---|---|---|---|
| A | PointNet++ | 79.9 | 84.5 | 89.8 | 87.0 | 1.403 | 0.10 |
| B | A+CRA-MLP | 84.4 | 87.0 | 97.1 | 91.8 | 3.443 | 0.03 |
| C | A+PESA | 84.3 | 87.5 | 93.1 | 90.2 | 6.583 | 0.03 |
| D | A+HCE-Dice Loss | 84.6 | 86.5 | 97.6 | 91.7 | 1.403 | 0.10 |
| E | B+PESA | 87.4 | 90.3 | 93.5 | 91.9 | 7.282 | 0.03 |
| F | B+HCE-Dice Loss | 87.0 | 88.3 | 95.7 | 91.8 | 3.443 | 0.03 |
| G | C+HCE-Dice Loss | 86.6 | 90.1 | 92.8 | 91.5 | 6.583 | 0.03 |
| H | E+HCE-Dice Loss | 90.4 | 93.1 | 95.6 | 94.4 | 7.282 | 0.03 |
| Method | A | B | C | D |
|---|---|---|---|---|
| Original Point cloud |  |  |  |  |
| Labeled Point cloud |  |  |  |  |
| PointNet++ |  |  |  |  |
| +CRA-MLP |  |  |  |  |
| +CRA-MLP+ PESA |  |  |  |  |
| CPHNet |  |  |  |  |
| Method | mIoU | mP | mR | mF1 | Params(M) | Speed |
|---|---|---|---|---|---|---|
| PointNet | 64.1 | 68.3 | 72.5 | 70.3 | 8.323 | 0.01 |
| PointNet++ | 79.9 | 84.5 | 89.8 | 87.0 | 1.403 | 0.10 |
| PointNet++(MSG) | 80.8 | 84.0 | 91.2 | 87.5 | 1.734 | 0.07 |
| GACNet | 75.7 | 80.2 | 87.2 | 83.5 | 1.318 | 0.04 |
| PointNeXt | 87.7 | 91.5 | 94.1 | 92.8 | 0.982 | 0.04 |
| CSANet | 88.0 | 91.0 | 93.7 | 92.3 | 15.946 | 0.05 |
| CPHNet | 90.4 | 93.1 | 95.6 | 94.4 | 7.282 | 0.03 |
| Method | A | B | C | D |
|---|---|---|---|---|
| Original Point cloud | 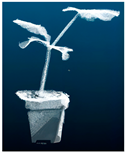 | 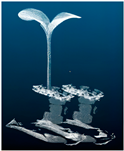 | 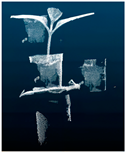 | 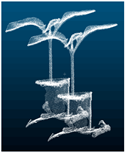 |
| Labeled Point cloud |  |  |  |  |
| PointNet |  |  |  |  |
| PointNet++ |  |  |  |  |
| PointNet++(MSG) |  | 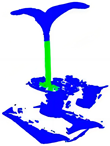 | 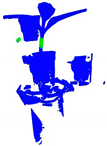 |  |
| GACNet | 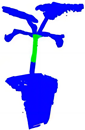 | 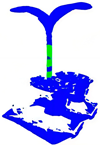 | 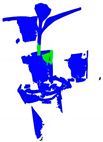 | 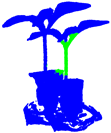 |
| PointNeXt |  | 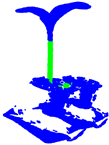 |  | 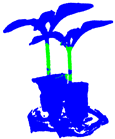 |
| CSANet |  |  |  |  |
| CPHNet |  |  |  |  |
Disclaimer/Publisher’s Note: The statements, opinions and data contained in all publications are solely those of the individual author(s) and contributor(s) and not of MDPI and/or the editor(s). MDPI and/or the editor(s) disclaim responsibility for any injury to people or property resulting from any ideas, methods, instructions or products referred to in the content. |
© 2024 by the authors. Licensee MDPI, Basel, Switzerland. This article is an open access article distributed under the terms and conditions of the Creative Commons Attribution (CC BY) license (https://creativecommons.org/licenses/by/4.0/).
Share and Cite
Deng, Q.; Zhao, J.; Li, R.; Liu, G.; Hu, Y.; Ye, Z.; Zhou, G. A Precise Segmentation Algorithm of Pumpkin Seedling Point Cloud Stem Based on CPHNet. Plants 2024, 13, 2300. https://doi.org/10.3390/plants13162300
Deng Q, Zhao J, Li R, Liu G, Hu Y, Ye Z, Zhou G. A Precise Segmentation Algorithm of Pumpkin Seedling Point Cloud Stem Based on CPHNet. Plants. 2024; 13(16):2300. https://doi.org/10.3390/plants13162300
Chicago/Turabian StyleDeng, Qiaomei, Junhong Zhao, Rui Li, Genhua Liu, Yaowen Hu, Ziqing Ye, and Guoxiong Zhou. 2024. "A Precise Segmentation Algorithm of Pumpkin Seedling Point Cloud Stem Based on CPHNet" Plants 13, no. 16: 2300. https://doi.org/10.3390/plants13162300
APA StyleDeng, Q., Zhao, J., Li, R., Liu, G., Hu, Y., Ye, Z., & Zhou, G. (2024). A Precise Segmentation Algorithm of Pumpkin Seedling Point Cloud Stem Based on CPHNet. Plants, 13(16), 2300. https://doi.org/10.3390/plants13162300