Article

Impact of Chromosomal Fusion and Transposable Elements on the Genomic Evolution and Genetic Diversity of Ilex Species

1
Co-Innovation Center for Sustainable Forestry in Southern China, College of Life Sciences, Nanjing Forestry University, Nanjing 210037, China
2
Peter O’Donnell Jr. School of Public Health, University of Texas Southwestern Medical Center, 5323 Harry Hines Blvd, Dallas, TX 75390, USA
3
National Key Laboratory of Wheat Improvement, Peking University Institute of Advanced Agricultural Sciences, Shandong Laboratory of Advanced Agricultural Sciences at Weifang, Weifang 261000, China
*
Authors to whom correspondence should be addressed.
Plants 2024, 13(18), 2649; https://doi.org/10.3390/plants13182649
Submission received: 30 July 2024 / Revised: 19 September 2024 / Accepted: 20 September 2024 / Published: 21 September 2024
(This article belongs to the Special Issue Genetic and Biological Diversity of Plants)

Abstract

:
The genus Ilex belongs to the sole family and is the single genus within the order Aquifoliales, exhibiting significant phenotypic diversity. However, the genetic differences underlying these phenotypic variations have rarely been studied. In this study, collinearity analyses of three Ilex genomes, Ilex latifolia Thunb., Ilex polyneura (Hand.-Mazz.) S. Y. Hu, and Ilex asprella Champ. ex Benth., indicated a recent fusion event contributing to the reduction of chromosomes in I. asprella. Comparative genome analyses showed slight differences in gene annotation among the three species, implying a minimal disruption of genes following chromosomal fusion in I. asprella. Comprehensive annotation of transposable elements (TEs) revealed that TEs constitute a significant portion of the Ilex genomes, with LTR transposons being predominant. TEs exhibited an inverse relationship with gene density, potentially influencing gene regulation and chromosomal architecture. TE insertions were shown to affect the conformation and binding sites of key genes such as 7-deoxyloganetin glucosyltransferase and transmembrane kinase (TMK) genes, highlighting potential functional impacts. The structural variations caused by TE insertions suggest significant roles in the evolutionary dynamics, leading to either loss or gain of gene function. This study underscores the importance of TEs in shaping the genomic landscape and evolutionary trajectories of Ilex species.

1. Introduction

Genetic diversity, the variation in genes among individuals or species, is crucial for the adaptability and survival of species [1,2,3]. Several factors contribute to genetic diversity, including mutation, polyploidy, chromosomal changes, transposition, and more [4,5,6]. For chromosomal changes, chromosomal fusion and fission are widely recognized as primary drivers of the evolution of fundamental chromosome numbers in both the animal and plant kingdoms [7,8,9]. For instance, the origin of human chromosome 2 resulted from the head-to-head fusion of two ancestral ape chromosomes [10]. In Heliconius species, the fusion events produced the ten longest chromosomes from ten pairs of shorter progenitors [11]. The transition from mitotic chromosomes to meiotic chromosomes through chromosomal fusion events was observed in both ancient wild Morus notabilis C. K. Schneid. and cultivated Morus alba L. [12]. In Artemisia argyi H. Lév. & Vaniot, the fusion of ancestral 8- and 9-like chromosomes resulted in the formation of chromosome 10, which was accompanied by one inversion and two intrachromosomal translocation events [9]. Chromosome fusions offer valuable insights into the dynamic evolution of genomes and the acquisition of adaptability. On the one hand, this process may lead to substantial changes in genome organization and gene regulation, impacting the evolutionary trajectory of a species [13]. On the other hand, the fusion events can lead to a reduction in chromosome number, potentially resulting in reproductively isolated “chromosomal races” and creating reproductive barriers, thereby driving speciation [11,14,15,16]. In plant genomes, chromosome fusion events are particularly noteworthy for their role in shaping karyotype evolution and contributing to genetic diversity [7,8].
Transposable elements (TEs) are DNA sequences that transpose from one location in the genome to another. These elements were first observed more than 70 years ago by Barbara McClintock [17]. Eukaryotic transposons are categorized into different classes based on their movement strategy. Class I consists of RNA transposons or retrotransposons, which can be further classified into two subtypes: long terminal repeat (LTR) and non-LTR retrotransposons [18,19,20,21]. LTR-retrotransposons possess LTRs at the 5′ and 3′ ends, while non-LTR retrotransposons do not. Retrotransposons rely on RNA intermediates that are converted into new copies by reverse transcriptases before being integrated into another position (copy and paste). Class II consists of DNA transposons, which transpose directly through transposases [20,21]. The terminal inverted repeats (TIRs) are recognized by transposases, which then catalyze the excision of the element from one genomic location to another (cut and paste). More recently, rolling circle elements, such as Helitrons, have been identified as a distinct and abundant group of DNA transposons. Unlike the “cut-and-paste” mechanism, these elements replicate through a “peel-and-paste” mechanism. It is hypothesized that the sense strand is “peeled” off and serves as a template to synthesize a second strand, forming a circular double-stranded DNA intermediate [18,20,21].
To date, the role of TEs in shaping genome function, speciation, genetic diversity, and adaptive variation in plants has been revealed extensively [22,23,24,25]. TEs exert significant effects on the structure and function of plant genomes [26]. In Arabidopsis thaliana (L.) Heynh., TEs have been documented to influence coding regions, with Copia-like and En/Spm-like sequences being over-represented in exons, leading to changes in gene functions, such as the enrichment of kinase activity or deficiency of structural molecule activity [27]. In the rice and maize genomes, Pack-TYPE TEs capture and recombine coding DNA, resulting in new transcriptional variants and accelerating gene evolution [28]. They trigger gene expression and functional enrichment in various biological processes, such as post-embryonic development, flower development, and morphogenesis, thereby promoting the plasticity of plant genomes. TEs in the Helitron superfamily inserted into the 3′ UTR of the FLOWERING LOCUS C (FLC) gene to reduce its expression level. This has promoted the natural variation in flowering time under different environmental conditions, explaining the high phenotypic diversity of Capsella rubella Reut after a genetic bottleneck [29]. In the genome of the apple, a specific gypsy-like LTR retrotransposon closely associated with the red fruit skin phenotype was discovered. This element, inserted upstream of MdMYB1, a key gene regulating the anthocyanin biosynthesis pathway, promotes the formation of the red fruit skin by enhancing the expression of MdMYB1 [30]. An active hAT in maize altered the translation rate by inserting into the coding sequence of the ZmSWEET4c gene and creating allelic variation, reducing protein abundance, and consequently, affecting the size of corn kernels. This study suggested the potential role of transposons in regulating the translation process, contributing to phenotypic diversity and adaptability in plants [31].
By integrating whole-genome analysis and large-scale resequencing, the role of TE insertion polymorphisms in regulating gene expression and the domestication of morphotypes in Brassica rapa L. has been revealed. Specific insertions of Copia retrotransposons altered the expression and structure of genes such as BrMYB18.1, BrFLOR1.2, and BrVRN1.2, which are associated with the morphological type and flowering time, promoting diversity in B. rapa morphotypes and adaptation to various climatic conditions [32]. TE insertions have provided raw materials for the domestication of Oryza sativa L. and its wild relative, Oryza rufipogon Griff., promoting the formation of new agronomic traits. The expression of genes OsRbohB and LIP19 is affected by PILE insertions, thereby reducing the thousand grain weight of rice and influencing its adaptability to cold and heat environmental stresses [33]. Through comparative analysis of 21 angiosperm species, it was found that miniature inverted-repeat transposable elements (MITEs), especially those from the Mutator, Tc1-Mariner, and PIF-Harbinger superfamilies, are the primary source of new microRNAs (miRNAs). These new miRNAs are formed through a transposition–transcription process and tend to target genes associated with environmental adaptability. For example, the MITE-miRNA Osa-miRN2285 regulates the cold tolerance-related gene LOC_Os06g39750, thereby affecting response and adaptability to temperature and other environmental changes in rice [34].
Aquifoliaceae, the sole family within the order Aquifoliales, encompasses a single genus, Ilex [35]. Characterized by their vibrant berries and distinctive foliage, Ilex species are frequently used as ornamental plants in gardens. These plants are also rich in beneficial compounds, such as terpenes, and are used as teas (e.g., Kudingcha made from I. latifolia) and medicinal products [36]. Despite their diverse applications, basic research on Ilex species remains relatively scarce. Recently, advances in sequencing technology have successfully assembled the genomes of three Ilex species, Ilex latifolia Thunb., Ilex polyneura (Hand.-Mazz.) S. Y. Hu, and Ilex asprella Champ. ex Benth., providing robust data support for comparative genomic studies [37,38,39,40].
Aquifoliaceae encompasses species with distinct botanical and genetic characteristics. Among the Ilex species with available genomes, I. latifolia and I. polyneura are tree-like in form, contrasting with the shrub-like growth habit of I. asprella. Fruit coloration at maturity varies, with I. latifolia and I. polyneura producing red fruits, while I. asprella bears black fruits. Genetically, I. latifolia and I. polyneura share a basic chromosome number of 20 (x = 20), whereas I. asprella has 19 chromosomes in the monoploid state (x = 19). Despite the known botanical differences, the genetic diversity at the molecular level among these three Ilex species remains poorly understood.
In this study, we employed three assembled genomes in Ilex to conduct comparative genomic analyses. Through chromosomal collinearity analysis, we demonstrated that chromosomal fusion has occurred in I. asprella, resulting in a reduced basic chromosome number of 19. Comprehensive annotation of TEs revealed that TEs constitute a significant portion of the Ilex genomes, potentially influencing gene regulation and protein structures by inserting into gene bodies or promoters. Via these bioinformatic analyses, our results revealed genetic diversity among the three Ilex species in terms of their genomic architecture, TE distribution, as well as the cis-regulatory elements associated with these TEs, elucidating the impact of chromosomal fusion and TEs on the genomic evolution and genetic diversity among Ilex species.

2. Results

2.1. Karyotype Evolution Driven by Chromosome Fusion

To gain insights into karyotype evolution, we surveyed the chromosome numbers in species of the Aquifoliaceae family. Chromosome number records for 44 species were retrieved from the Chromosome Counts Database (https://taux.evolseq.net/CCDB_web/search/, accessed on 26 February 2024), a community resource for plant chromosome numbers [41]. These records reveal that 28 of the 44 species (63.6%) contain 20 chromosomes in monoploid state (x = 20), which is the most representative karyotype. There are some exceptions, including six species (13.6%) that contain 18 chromosomes in monoploid state, four species (9.1%) contain 17 chromosomes in monoploid state, and three species (6.8%) contain 19 chromosomes in monoploid state. Additionally, we found that I. anomala Hook. & Arn. and I. argentina Lillo have 40 chromosomes, while I. pedunculosa Miq. has 60 chromosomes (Figure 1A and Table S1). Despite only a limited number of species being available, these data provide a glimpse into the diversity of the basic chromosome number in Aquifoliaceae.
Given the doubled or tripled chromosome counts in I. anomala, I. argentina, and I. pedunculosa compared with the canonical counts in Aquifoliaceae, we proposed that these changes were the result of recent diploidization or triploidization events. Additionally, 13 of the 44 species (29.5%) harbor 17 to 19 chromosomes in the monoploid state. To further explore the evolutionary forces driving the reduction of chromosomes in these species, we performed collinearity analyses among three available Ilex genomes. Among these, I. latifolia and I. polyneura have 20 chromosomes, while I. asprella has 19 chromosomes in the monoploid state. Our results suggested that chromosomes Chr10 and Chr11 in I. latifolia, as well as Chr10 and Chr18 in I. polyneura, exhibited a high degree of synteny with Chr1 in I. asprella (Figure 1B and Figure 2A). The length of Chr1 in I. asprella is approximately 54 million base pairs (Mbp), which is comparable to the sum of the two syntenic chromosomes in I. latifolia (~57 Mbp) and I. polyneura (~56 Mbp). Considering the unassembled sequences on telomeres, we did not delve into the reason for the relatively shorter chromosome in I. asprella following chromosome fusion. According to previous phylogenetic studies [42], the divergence of I. latifolia occurred prior to the divergence of I. polyneura and I. asprella. Therefore, our findings demonstrated that the missing chromosome in I. asprella is caused by a recent chromosome fusion event, after its divergence from I. polyneura.

2.2. Comparative Genome Reveals Slight Differences in Genes Annotation

Through collinearity analyses of entire genomes, our results exhibited one-to-one alignment of 18 chromosomes and 1 (or 2) fused chromosome among the three Ilex species (Figure 2A and Figures S1–S3) [43]. We then compared the number of protein-coding genes (hereinafter referred to as genes) among the three Ilex species. A total of 97,057 genes were identified, including 33,043 in I. latifolia, 31,990 in I. polyneura, and 29,839 in I. asprella (Figure 2B and Tables S2 and S3). Mapping these genes to individual chromosomes, we found that the number of genes in twelve chromosomes exhibited a coincident tendency with the total gene numbers in the three species. In addition, the number of genes from five chromosomes was highest in I. polyneura. As for the fused chromosomes, we detected 2185 genes located in the Chr1 of I. asprella, while 1173 genes of Chr10 and 1134 genes of Chr11 from I. latifolia, as well as 1202 genes of Chr10 and 1071 genes of Chr18 from I. polyneura were detected. The number of genes after chromosome fusion was slightly reduced compared to I. latifolia (−122 genes) and I. polyneura (−88 genes). This finding revealed that chromosome fusion in I. asprella caused minimal disruption to pre-existing genes.
Then, we identified totals of 2134, 2005, and 1823 transcription factors (TFs) in I. asprella, I. latifolia, and I. polyneura using PlantTFDB [44], respectively. A statistical analysis of their numbers in each family showed that the majority of families exhibited similar content across the three species, except for two TF families, NZZ/SPL and HB-PHD (Figure 2C and Table S4). The NZZ/SPL TF family, which is crucial for the early development of microsporangia and involved in the initial stages of archesporial cell proliferation and differentiation, is notably absent in the genome of I. latifolia. The HB-PHD TF family, which plays a vital role in modulating plant resistance to heavy metals, is absent in the genome of I. asprella. The potential absence of these two gene families in the Ilex species could be correlated with species-specific adaptive traits, reflecting evolutionary adjustments to their respective environments or ecological niche. Alternatively, these absences might also be a consequence of the incomplete genome assemblies, where some regions have not yet been sufficiently resolved, resulting in the omission of these gene families in the current genomes. Further investigation is required to confirm the absence of these TF families.

2.3. Identification of TEs in Three Ilex Species

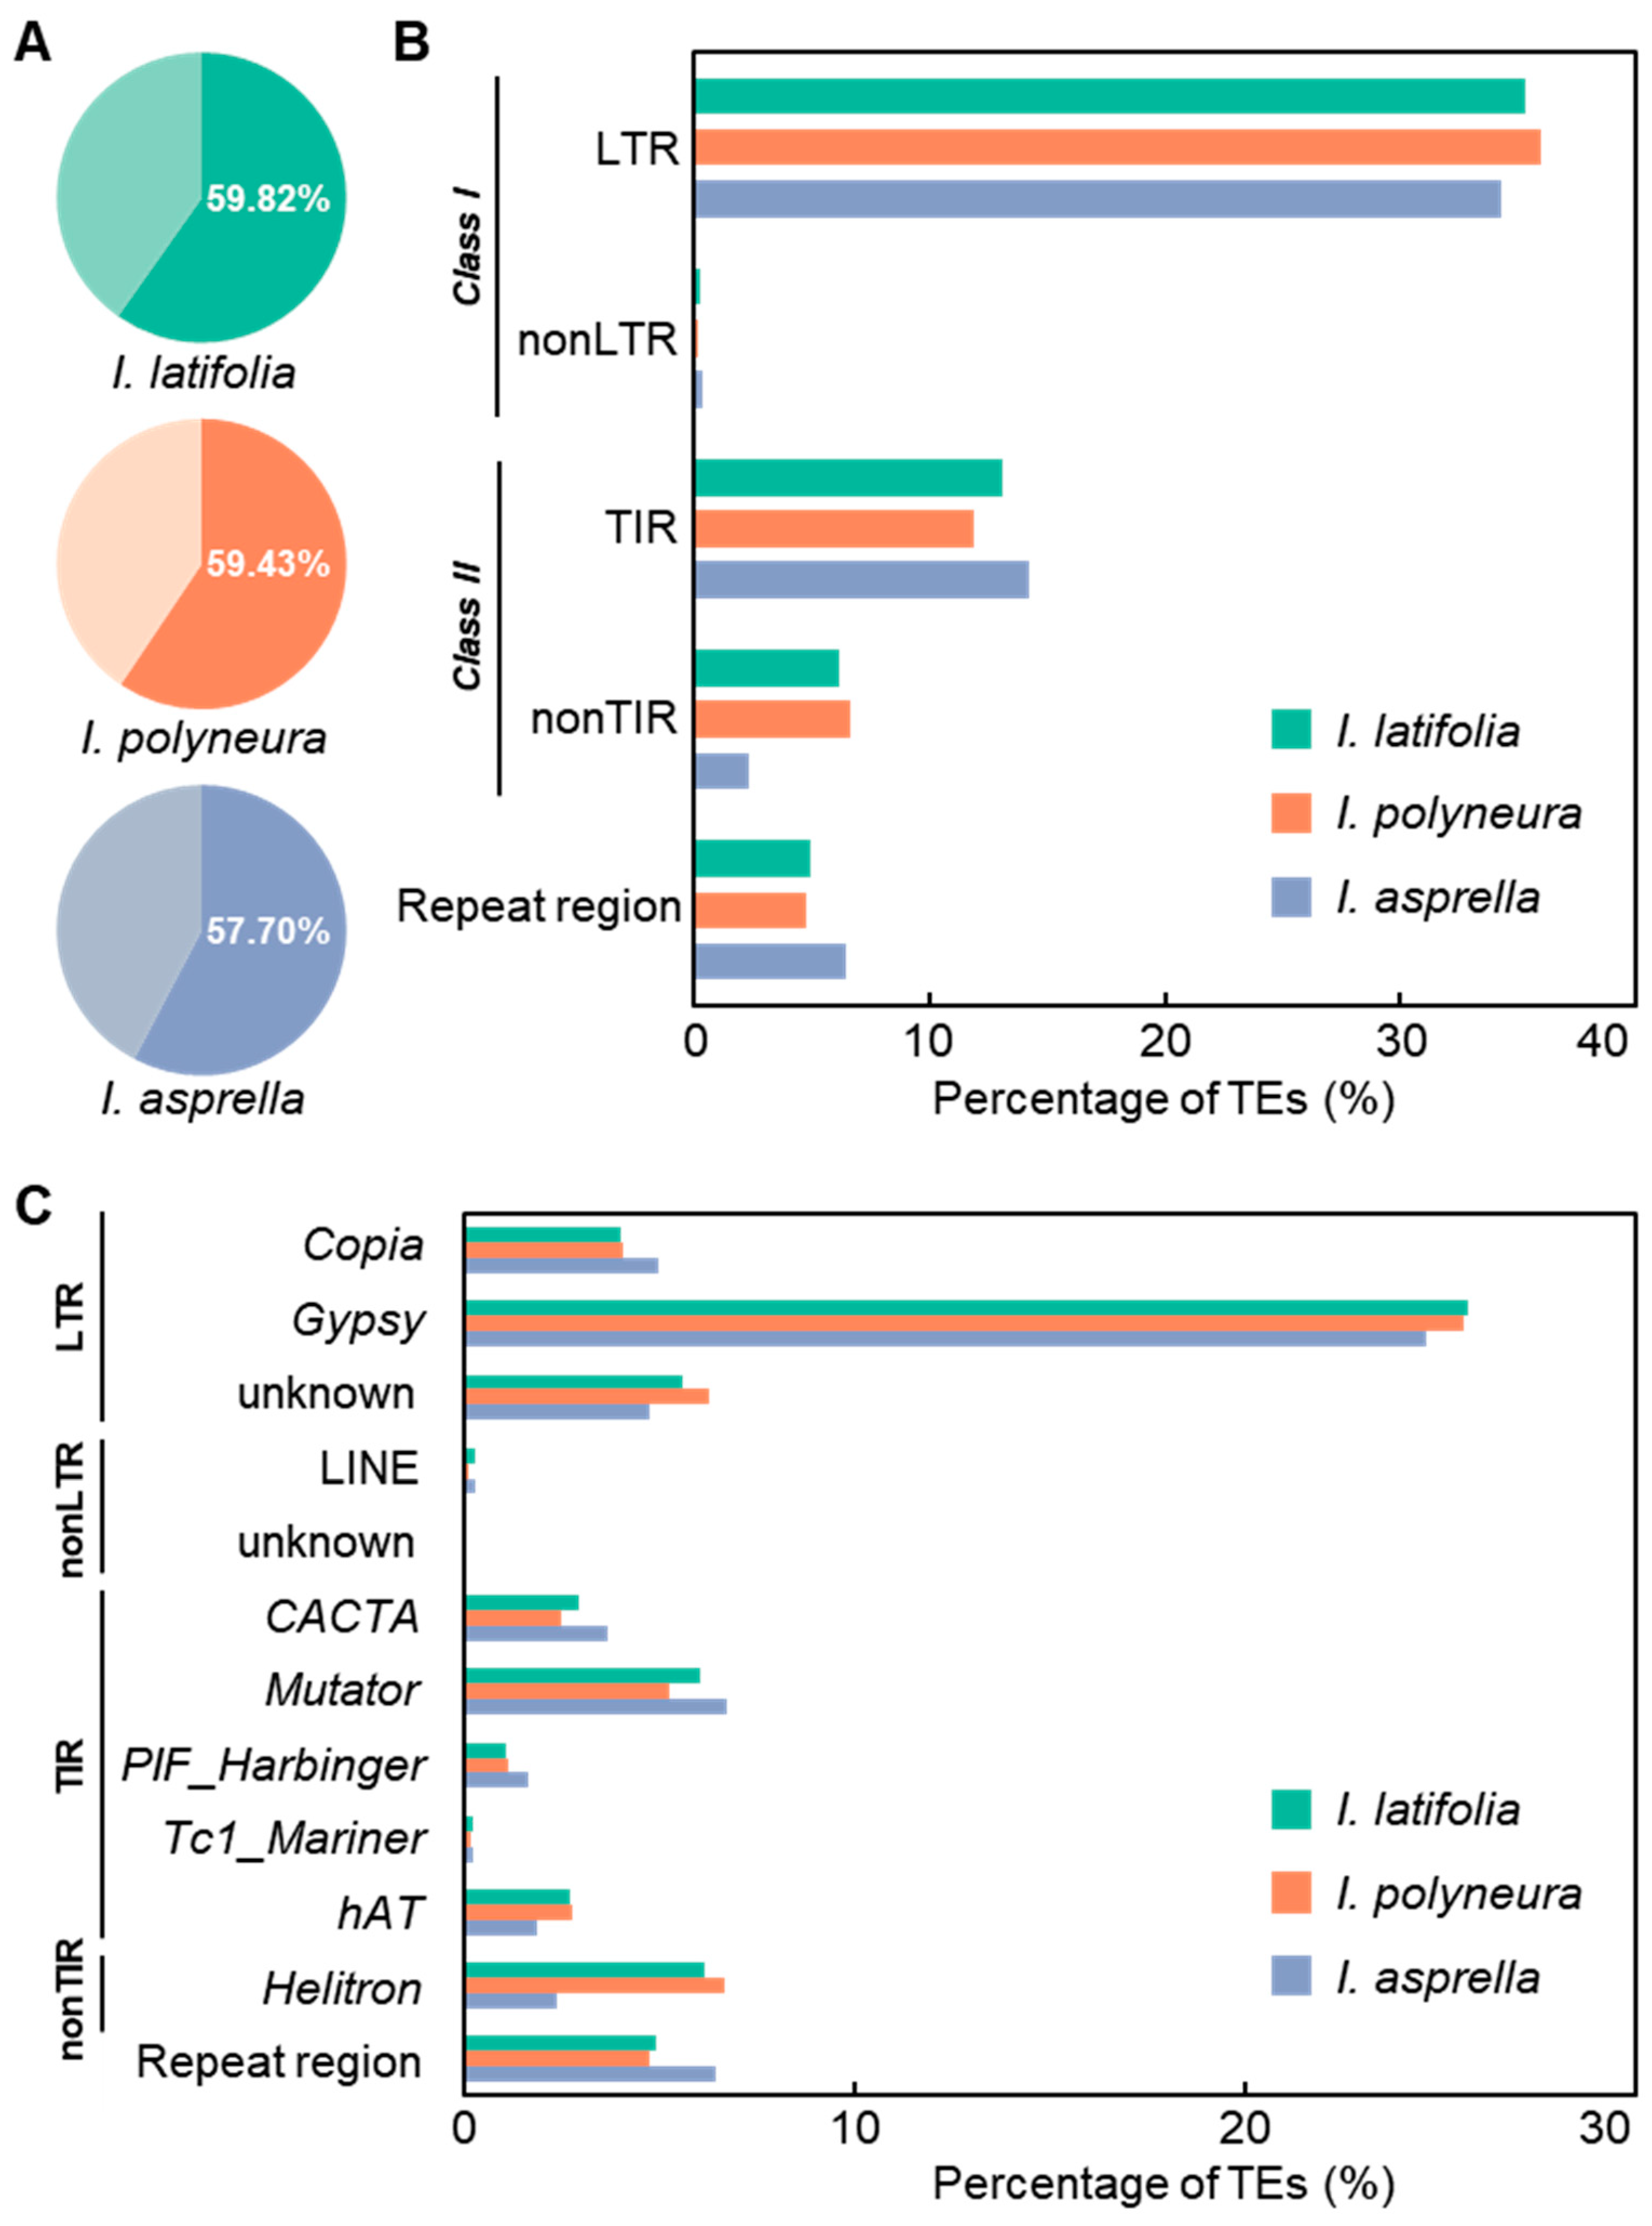
We performed a comprehensive annotation of TEs in the three Ilex species [45]. Our results indicated that TEs account for 59.82% of the genome in I. latifolia, 59.43% in I. polyneura, and 57.7% in I. asprella (Figure 3A). Transposons are known to categorize into Class I (retrotransposons) and Class II (DNA transposons). TEs in Class I include LTR (long terminal repeat) and non-LTR elements, while Class II includes TIR (terminal inverted repeat) and non-TIR elements. Among the TEs, LTR transposons constituted the highest proportion in the Ilex genomes, with 35.3% in I. latifolia, 35.96% in I. polyneura, and 34.34% in I. asprella (Figure 3B and Table 1). TIR transposons followed, accounting for 13.12% in I. latifolia, 11.87% in I. polyneura, and 14.24% in I. asprella (Figure 3B and Table 1). This classification and identification of TEs revealed that these two main types of transposons are proportionately represented across all three species.
Further classification of transposon superfamilies within the different types of transposons showed that the Gypsy superfamily is the most predominant across all three species, accounting for 25.69% in I. latifolia, 25.59% in I. polyneura, and 24.63% in I. asprella (Figure 3C and Table 1). Within the LTR transposons, the Gypsy superfamily is more than four times as abundant as the Copia superfamily. In the TIR transposons, the Mutator superfamily is predominant, followed by the CACTA superfamily (Figure 3C and Table 1). These results suggest a consistency in the primary types of transposon families across the three species, despite variations in their specific distribution. The high proportion of Gypsy elements within LTR transposons and the prominence of the Mutator superfamily within TIR transposons highlight the conserved nature of these elements in shaping the genomic landscape of the Ilex species.

2.4. TEs Mediate Genetic Effects in Three Ilex Species

To explore the potential genetic effects of TEs, we analyzed the distribution density of genes, TEs, TIRs, LTRs, and Gypsy elements on the chromosomes of I. latifolia, I. polyneura, and I. asprella, respectively (Figure 4A–C and Figures S4–S6) [46]. Our analyses revealed a generally uniform distribution of genes across the chromosomes of all three Ilex species. However, a notable inverse relationship between TE density and gene density was observed. As the density of TEs increased, the density of genes tended to decrease. This pattern was consistent across the genomes of I. latifolia, I. polyneura, and I. asprella, suggesting a potential regulatory or structural impact of TEs on gene distribution. These findings are instrumental in understanding the chromosomal architecture and genetic landscape of these Ilex species. The observed TE distributions and their relationship with gene densities provide insights into the evolutionary dynamics and regulatory mechanisms shaping the genomes of I. latifolia, I. polyneura, and I. asprella.
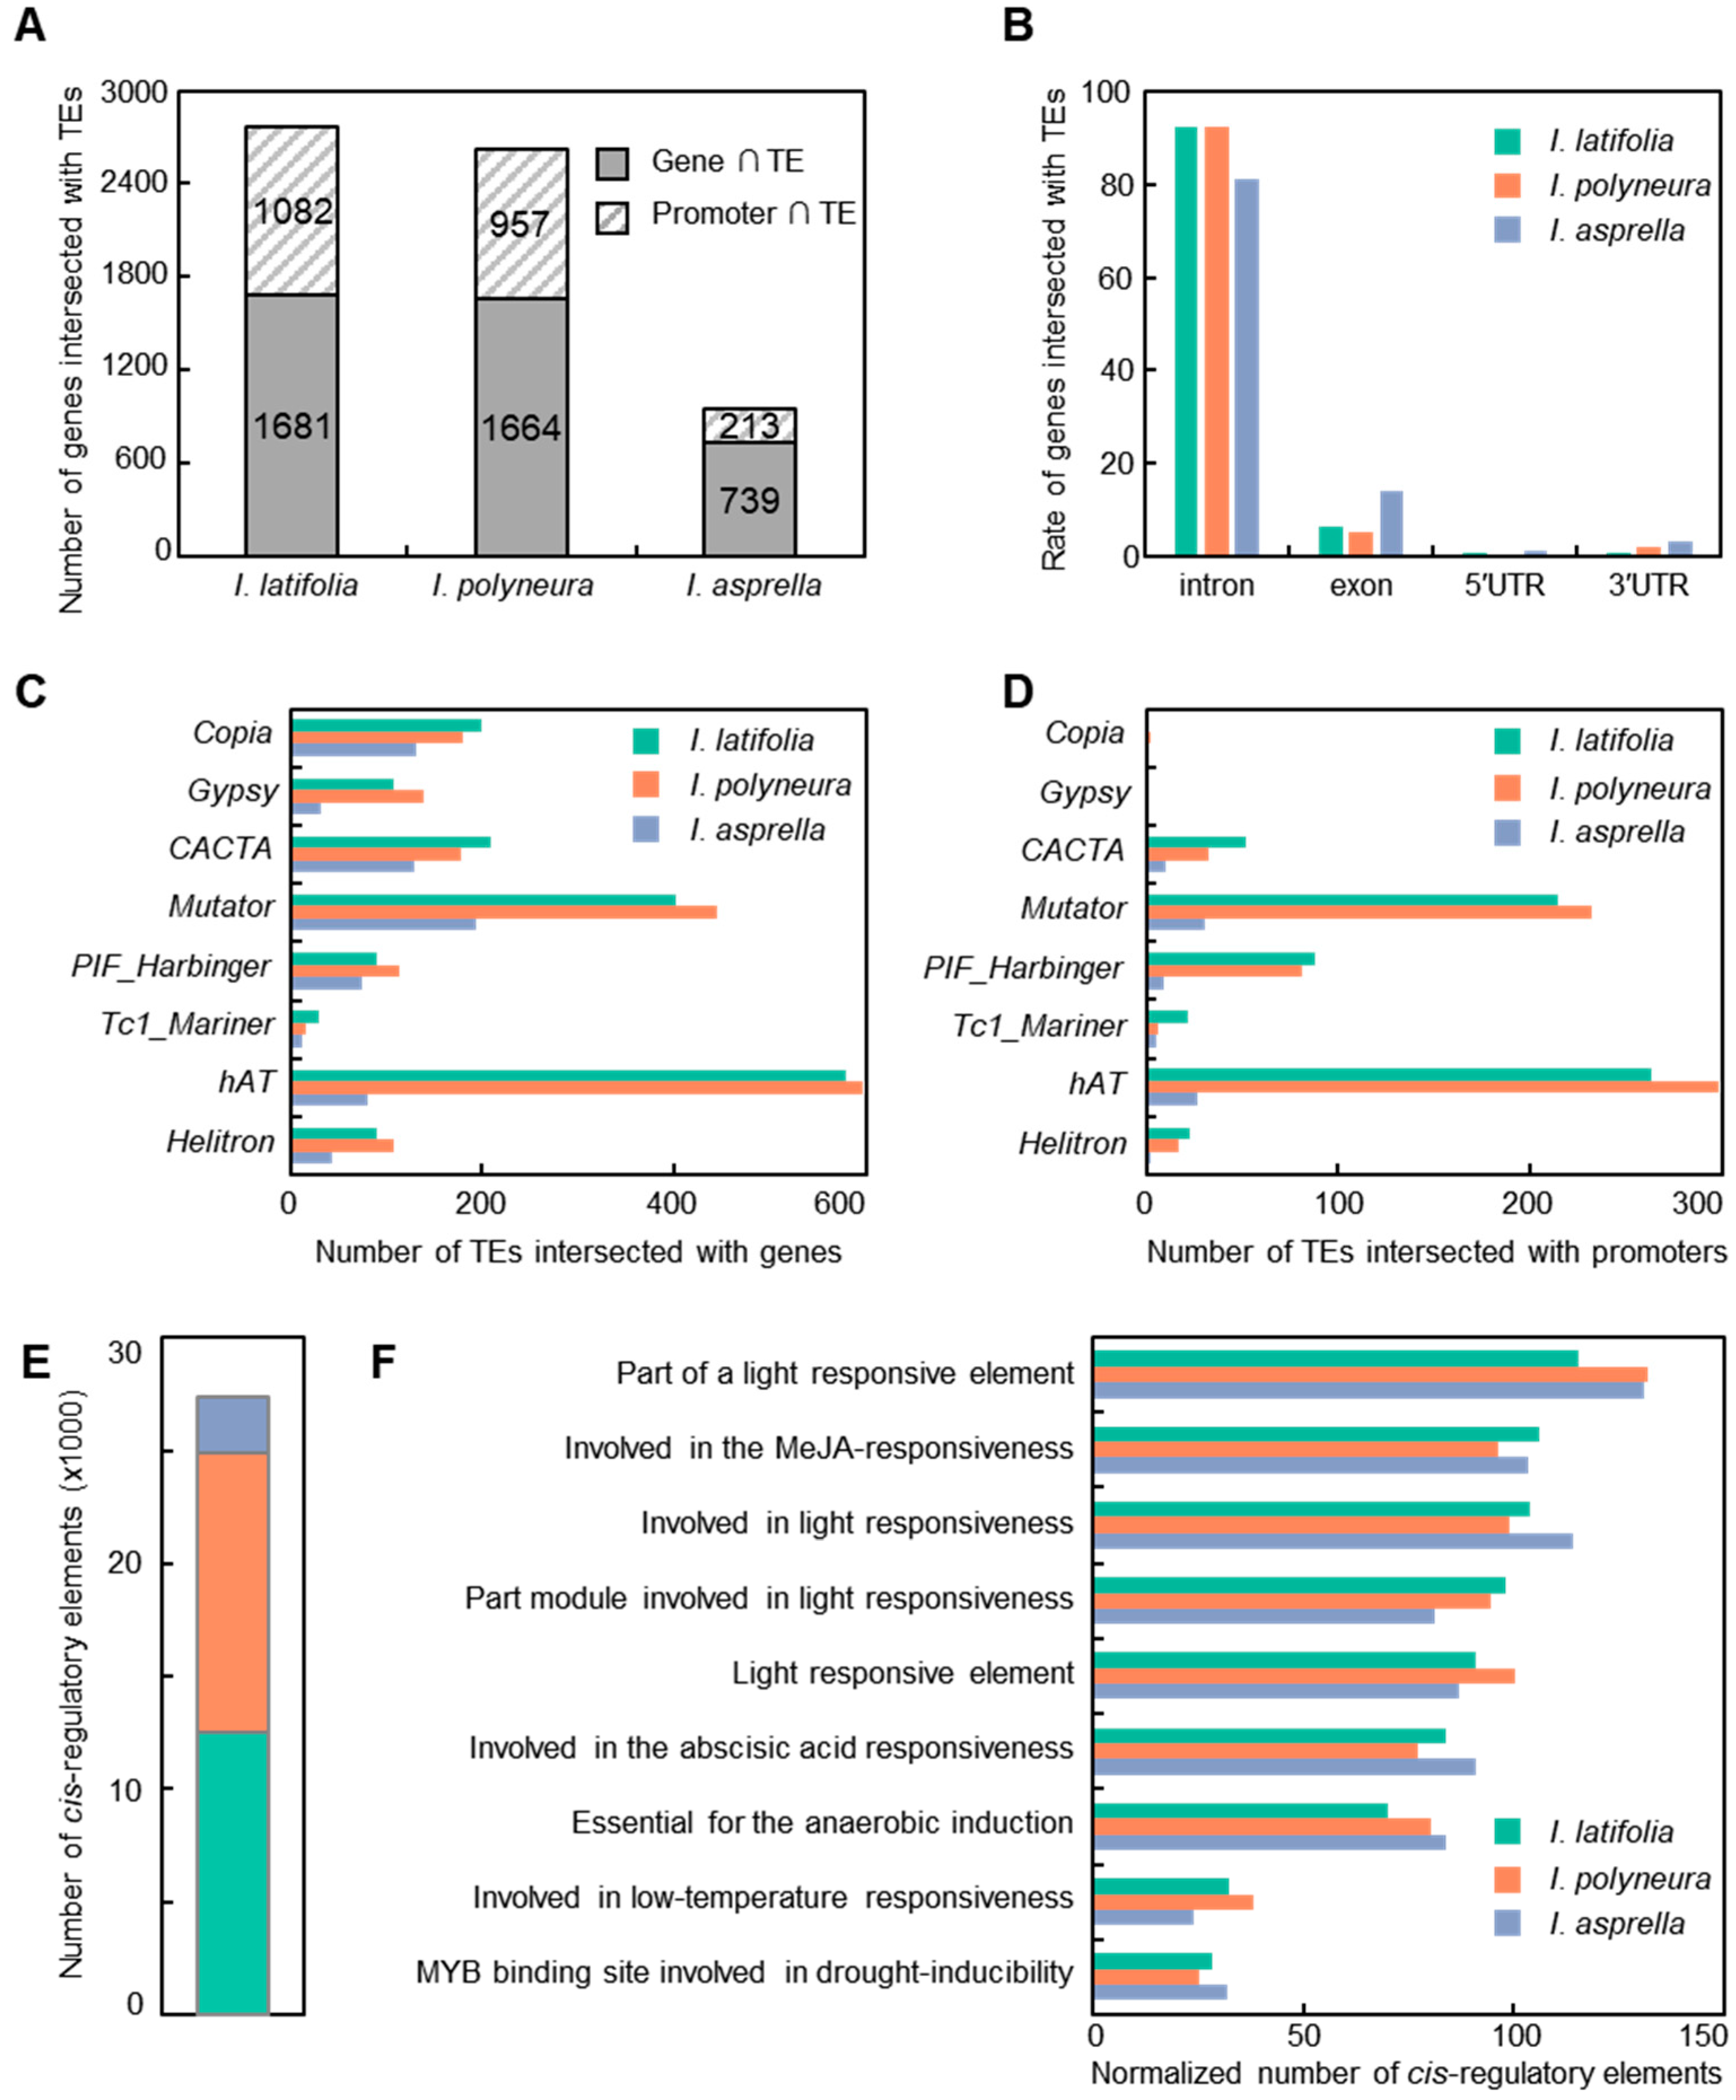
We further identified genes potentially influenced by TEs [47]. Our results revealed that 2763, 2621, and 952 genes contained TEs in promoters or gene bodies in I. latifolia, I. polyneura, and I. asprella, respectively (Figure 5A and Table S5). The number of TE-regulated genes in I. asprella was significantly less than that in the other two species. Among these, 1681 genes in I. latifolia, 1664 genes in I. polyneura, and 739 genes in I. asprella harbored TEs in their gene bodies. Examination of the 2000 bps upstream of the transcriptional start sites revealed 1082, 957, and 213 TE-regulated promoters in I. latifolia, I. polyneura, and I. asprella, respectively. The numbers of TE-regulated promoters in I. latifolia and I. polyneura were about five times that of I. asprella. As for TEs located in gene bodies, our results suggested that most TEs overlapped with introns, accounting for 92.2% in I. latifolia, 92.4% in I. polyneura, and 81.2% in I. asprella (Figure 5B and Table S5). A small number of genes contained TEs in the 5′ untranslated region (5′ UTR) and 3′ untranslated region (3′ UTR). Additionally, 6.3% of genes in I. latifolia, 5.2% of genes in I. polyneura, and 14.0% of genes in I. asprella were intersected with exons. These genes were reasonably considered as loss-of-function-resembling T-DNA insertions or frameshift mutations. These observations indicated notable differences in the regulation of genes by TEs among the three Ilex species.
A total of 4181 TEs were identified intersecting with gene bodies, with 1707 TEs in I. latifolia, 1774 TEs in I. polyneura, and 700 TEs in I. asprella (Figure 5C and Table S6). This indicated a reduced number of TEs overlapping with gene bodies in I. asprella. Categorization of these TEs revealed that the hAT superfamily was the most prominent gene regulators in the genomes of I. latifolia and I. polyneura, followed by the Mutator superfamily. In contrast, the Mutator superfamily predominates in affecting gene bodies in I. asprella, followed by the Copia and CACTA superfamilies. Among the three species, 1419 TEs were identified to intersect with promoters, specifically 663 TEs in I. latifolia, 670 TEs in I. polyneura, and 86 TEs in I. asprella (Figure 5D and Table S7). These data consistently revealed a lower quantity of TEs overlapping with promoters in I. asprella. The Mutator and hAT superfamilies were the two most prevalent overlapping with promoters in I. asprella, whereas in I. latifolia and I. polyneura, the hAT superfamily predominated, followed by the Mutator superfamily. The Copia and Gypsy superfamilies were exceedingly rare across all three species. Our analysis demonstrated substantial disparities in the genetic influence of TEs among the three Ilex species. I. asprella consistently exhibited a reduced number of TEs overlapping with both gene bodies and promoters compared to I. latifolia and I. polyneura, reflecting distinct regulatory roles and evolutionary pressures.
The analyses of cis-regulatory elements within TEs that intersect with promoters identified a total of 27,364 elements in the three species, specifically 12,545 in I. latifolia, 12,328 in I. polyneura, and 2491 in I. asprella (Figure 5E and Table S8) [48]. The number of cis-regulatory elements associated with TEs in I. latifolia and I. polyneura were similar and approximately five times higher than that in I. asprella. The higher abundance of these elements in I. latifolia and I. polyneura compared to I. asprella suggested different evolutionary pressures and functional significances. We then annotated these elements using a bioinformatic method. To mitigate the potential misleading effects caused by quantity variance, we normalized the number of cis-regulatory elements and selected the top nine functions based on their frequency (Figure 5F and Table S8). Our results indicated that elements related to light responsiveness were significantly enriched in all three species. Other enriched functions included responses to MeJA, abscisic acid, low temperatures, and drought, highlighting the critical role of TE insertions in plant defense mechanisms, and hormone and stress responses.

2.5. Impact of TE Insertions on Protein Structures: Two Case Studies

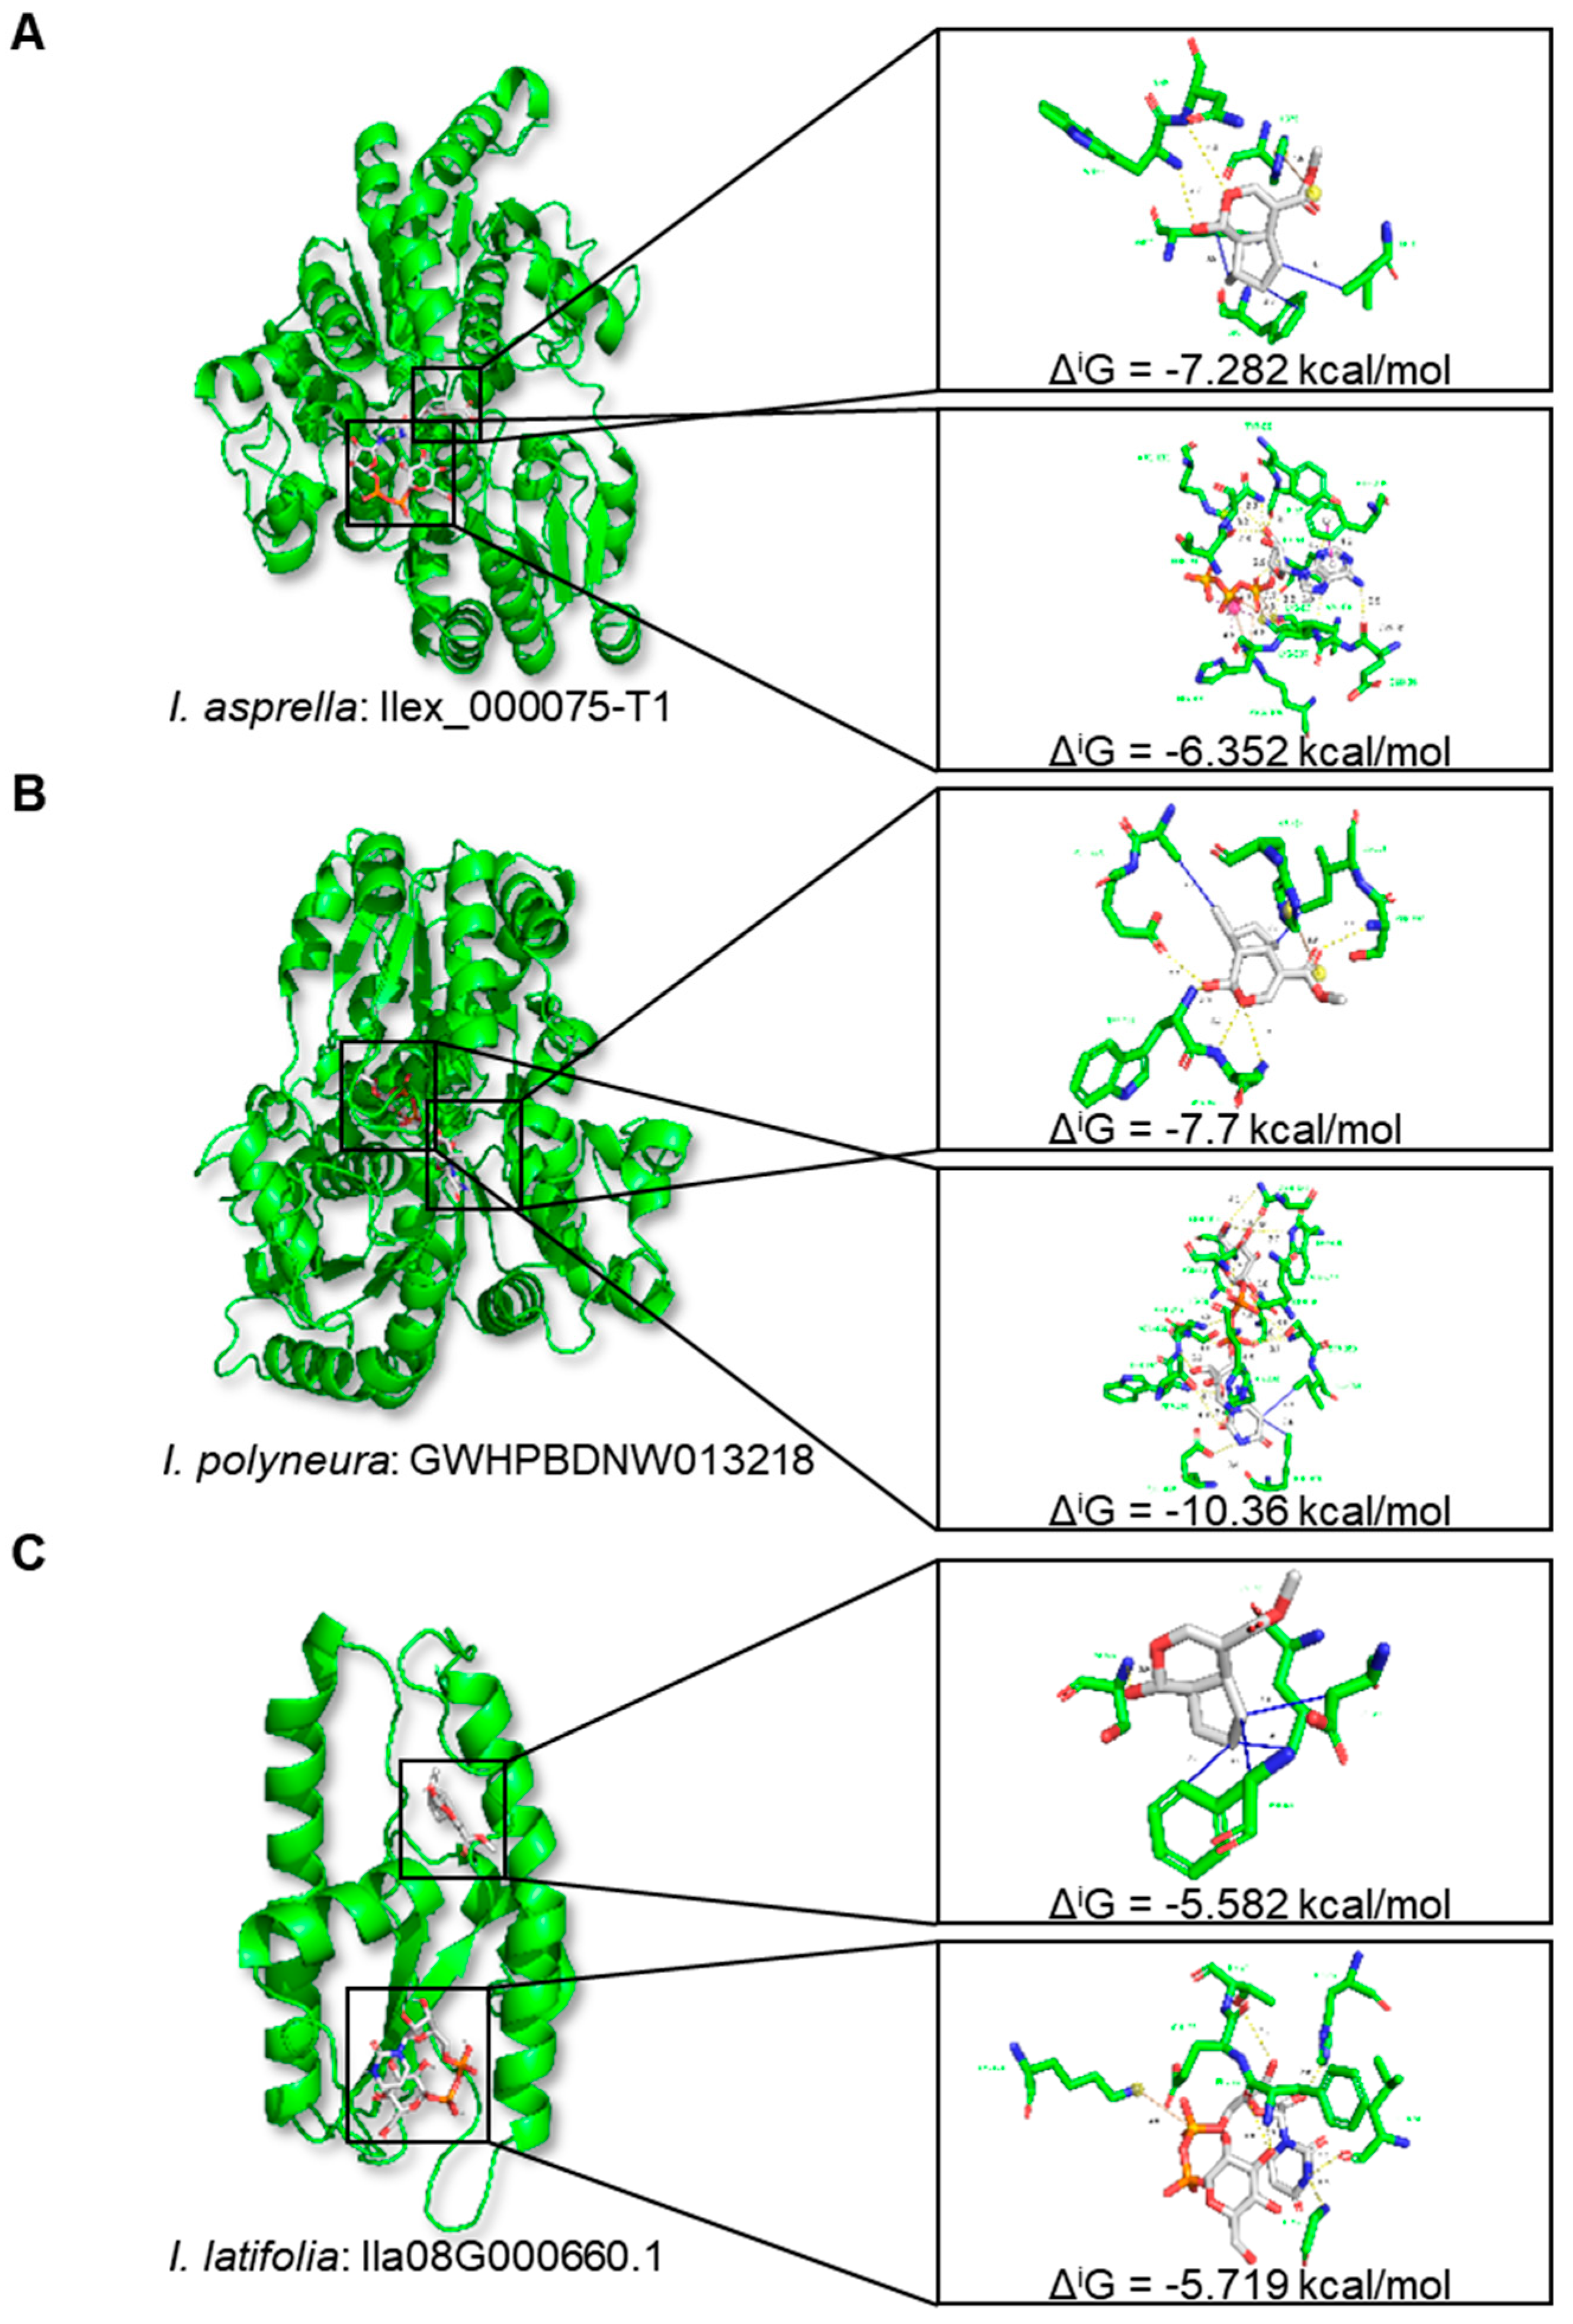
The analysis of TE−mediated genes identified one 7−deoxyloganetin glucosyltransferase gene (Ila08G000660.1) in I. latifolia that had a TE insertion within an exon belonging to the Gypsy superfamily. Its orthologous genes in I. asprella (Ilex_000075-T1) and I. polyneura (GWHPBDNW013218) did not overlap with TEs. Previous studies have shown that 7-deoxyloganetin glucosyltransferase (EC 2.4.1.324) can bind to two small−molecule ligands, 7−deoxyloganetin and UDP−alpha−D−glucose, simultaneously [49,50]. Our docking simulations revealed the significant differences in the conformation of the orthologous genes in I. asprella (Figure 6A) and I. polyneura (Figure 6B) compared to Ila08G000660.1 in I. latifolia (Figure 6C). Additionally, the binding sites of the 7-deoxyloganetin glucosyltransferases with the two ligands were distinct among the three species.
We further calculated the binding free energy at the interface, denoted as ΔiG (kcal/mol), to assess the molecular docking capacity between the 7-deoxyloganetin glucosyltransferase and the two ligands. Our findings showed that the ΔiG at the interface between Ilex_000075-T1 and 7-deoxyloganetin was −7.282 kcal/mol, and between Ilex_000075-T1 and UDP-alpha-D-glucose in I. asprella was −6.352 kcal/mol (Figure 6A and Table S9). The ΔiG at the interface between GWHPBDNW013218 and 7−deoxyloganetin was −7.7 kcal/mol, and between GWHPBDNW013218 and UDP−alpha−D-glucose in I. polyneura was −10.36 kcal/mol (Figure 6B and Table S9). However, the ΔiG at the interface between Ila08G000660.1 and 7-deoxyloganetin was −5.582 kcal/mol, and between Ila08G000660.1 and UDP−alpha−D−glucose in I. latifolia was −5.719 kcal/mol (Figure 6C and Table S9). Given the inverse relationship between docking capacity and the ΔiG value, our data suggested that the binding ability of Ila08G000660.1 in I. latifolia was disrupted by insertion of the Gypsy superfamily.
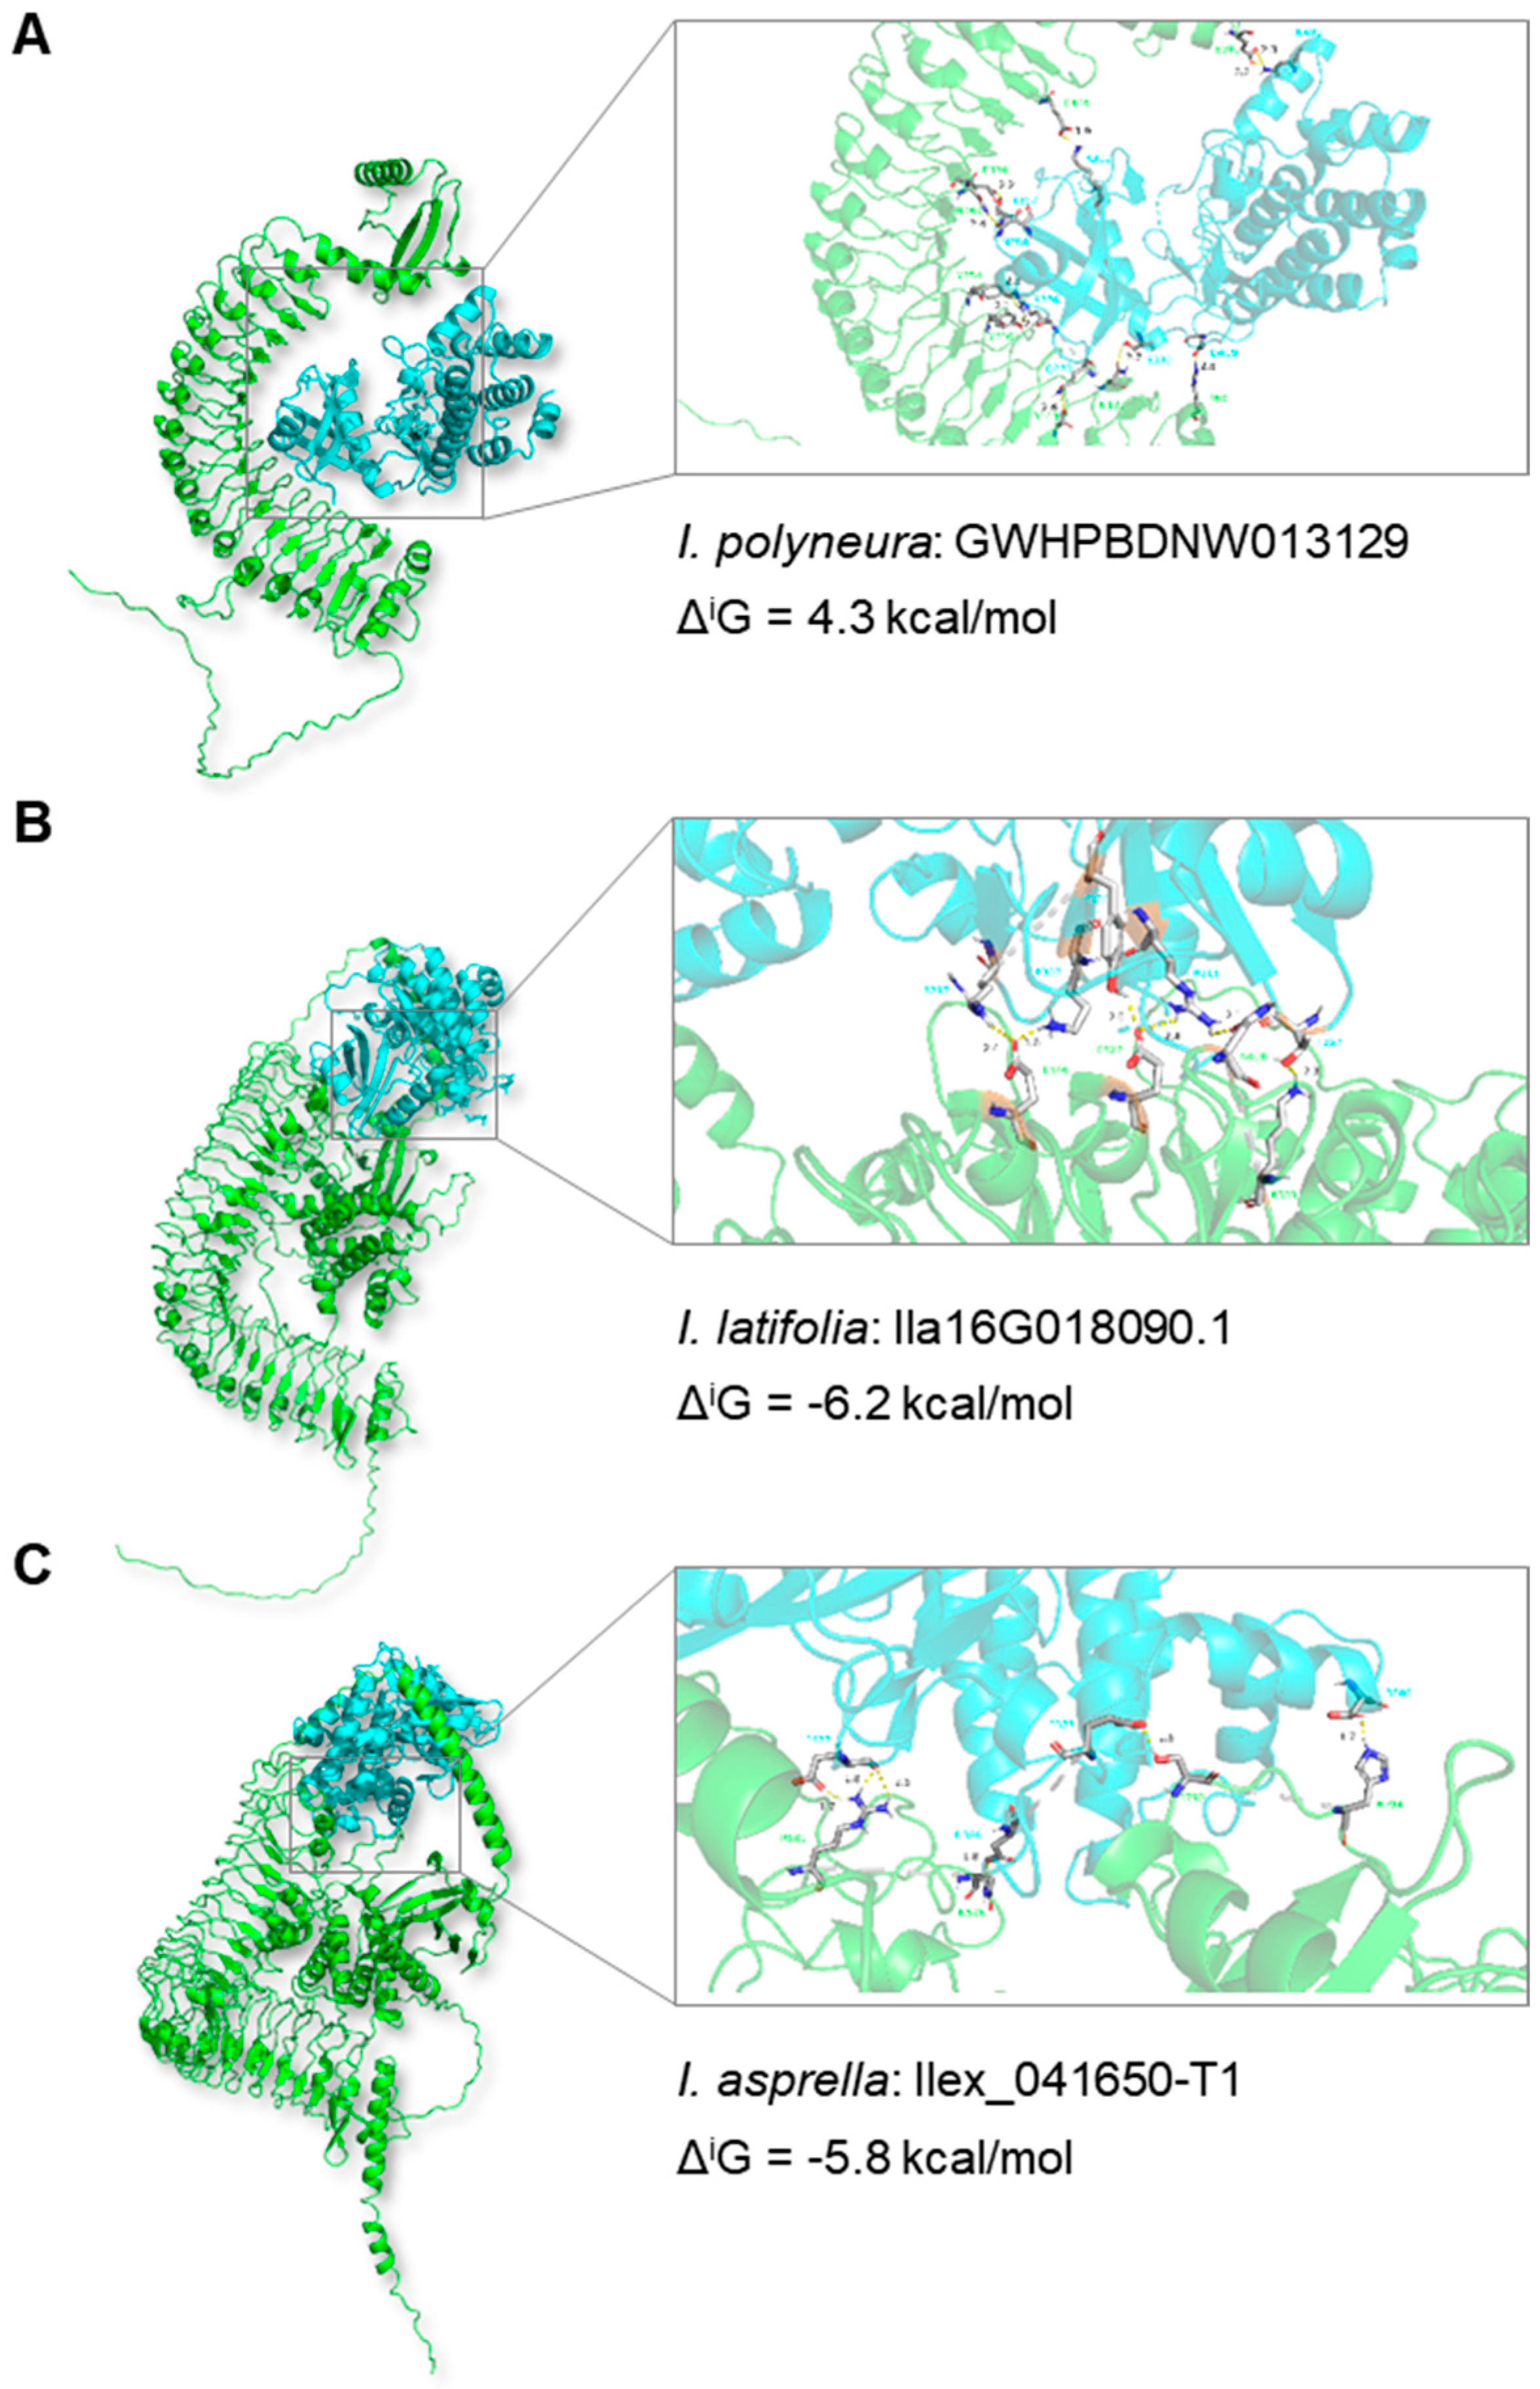
Another case involved the transmembrane kinase (TMK) gene in I. polyneura (GWHPBDNW013129), which did not overlap with TEs. However, in I. latifolia (Ila16G018090.1) and I. asprella (Ilex_041650-T1), TEs belonging to the CACTA superfamily have inserted into the exons of the TMK genes. Previous studies in Arabidopsis demonstrated the interaction between TMK protein and its donor, AtBAK1 (At4g33430) [51,52]. We simulated the binding structures of TMK proteins in the three Ilex species and their donor, AtBAK1, using AlphaFold3 [53]. Our results indicated that the binding conformation and position between TMK and AtBAK1 in I. polyneura (Figure 7A) were quite different from those in I. latifolia (Figure 7B) and I. asprella (Figure 7C). Calculation of binding free energy at the interface indicated the affinity between TMK and AtBAK1. Our findings revealed that the ΔiG at the interface between TMK and AtBAK1 in I. polyneura was 4.3 kcal/mol, whereas in I. latifolia and I. asprella it was −6.2 kcal/mol and −5.8 kcal/mol, respectively (Figure 7A–C and Table S10). Given the inverse relation between interaction capacity and the value of ΔiG, our data suggested that the acquisition of the binding ability in Ilex may occur after the insertion of the CACTA superfamily. Taken together, these two cases highlighted that the structural variations caused by TE insertions may result in potential functional impacts, leading to either loss of function or gain of function.

3. Discussion

Our study provides significant insights into the karyotype evolution, genetic diversity, and regulatory mechanisms of Ilex species driven by chromosomal fusion and TEs. The survey of chromosome numbers in the Aquifoliaceae family revealed a predominant karyotype with a basic chromosome number of 20, along with variations indicating recent diploidization or triploidization events. Collinearity analyses demonstrated that the fusion of chromosomes in I. asprella has minimal disruption on gene content, suggesting a recent chromosomal fusion event after the divergence with I. polyneura.
TEs are present across all phyla, exhibiting species-specific differences in their characteristics, prevalence, and functionality. For instance, in Saccharomyces cerevisiae, TEs make up only 3% of the genome [54], whereas they can account for as much as 80% in maize [55]. In this study, the comprehensive annotation of TEs across the three Ilex species highlighted that TEs account for 57.70% to 59.82% of their genomes. LTR transposons were predominant, followed by TIR transposons, with the Gypsy and Mutator superfamilies being the most prevalent. The inverse relationship between TE density and gene density across the chromosomes indicates that TEs may play a critical role in gene regulation and chromosomal architecture. This pattern was consistent in I. latifolia, I. polyneura, and I. asprella, suggesting potential regulatory or structural impacts of TEs on genes.
Our findings on the cis-regulatory elements within TEs that intersect with promoters identified substantial differences among the three species. I. latifolia and I. polyneura had a significantly higher number of cis-regulatory elements associated with TEs compared to I. asprella, suggesting different evolutionary pressures and functional significances. Elements related to light responsiveness, MeJA responsiveness, abscisic acid responsiveness, low-temperature responsiveness, and drought stress were significantly enriched, underscoring the critical role of TE insertions in plant defense mechanisms, hormone responses, and stress responses.
Furthermore, the analysis of TE-mediated genes identified significant differences in the binding interactions of key proteins. For instance, the 7-deoxyloganetin glucosyltransferase gene in I. latifolia, which had a TE belonging to Gypsy superfamily insertion in its exon, showed disrupted binding ability with its ligands compared to its orthologs in I. asprella and I. polyneura. On the contrary, the TMK genes in I. latifolia and I. asprella, affected by TE belonging to CACTA superfamily insertions, exhibited an increased affinity with their donor AtBAK1 compared to I. polyneura, which had no TE insertions. These structural variations caused by TE insertions resulted in potential functional impacts, leading to either loss of function or gain of function.
In short, our study highlights the significant role of chromosomal fusion and TE insertions in shaping the genomic landscape, regulatory mechanisms, and functional diversity of Ilex species. The insights gained from this research provide a robust foundation for future molecular studies and enhance our understanding of the evolutionary dynamics of the genome and adaptive strategies of plants.

4. Materials and Methods

4.1. Source of Genomes and Chromosome Counts

The genomes and corresponding annotations of I. latifolia [37], I. polyneura [38], and I. asprella [39] are available in previously published studies. The files with Fasta and GFF3 format were downloaded from HollyGTD (https://hollygdb.com/, accessed on 26 February 2024), a comprehensive database dedicated to collecting multi-omics data in Aquifoliaceae [40]. Chromosome numbers used in this study were retrieved from the Chromosome Counts Database (https://taux.evolseq.net/CCDB_web/search/, accessed on 26 February 2024) [41].

4.2. Collinearity-Based Chromosome Fusion Analysis

MCScanX is a bioinformatics tool used to detect and analyze chromosomal synteny, facilitating the identification and comparison of genomic homologies across different species [43]. In this study, we utilized MCScanX (Python version) to perform a collinearity-based chromosome fusion analysis in three Ilex species. The process began with the collection and preparation of chromosomal sequence data from the species involved in the study. We then employed the Python script of MCScanX to perform multiple sequence alignments for identifying homologous regions. The alignment outcomes were analyzed to determine the syntenic relationships between the chromosomes. Based on the synteny analysis results, we constructed the synteny plot to visualize homologous relationships and investigate chromosome fusion events.

4.3. Identification of Transcription Factor Families

The PlantTFDB (https://planttfdb.gao-lab.org/, accessed on 25 March 2024) is a database designed for the prediction of plant transcription factors [44]. It allows for the identification of transcription factors by directly inputting protein or nucleic acid sequences. In this study, we utilized PlantTFDB (Version 5.0) to identify transcription factor families in three Ilex genomes. We navigated to the PlantTFDB website then accessed the “prediction” tool. Using the default settings, we submitted protein sequences from the three Ilex species to predict and annotate their transcription factors.

4.4. Identification of Transposable Elements

EDTA (Extensive De-Novo TE Annotator) is a comprehensive bioinformatics tool for identifying transposable elements in plants [45]. It provides complete and high-quality annotations of transposable elements in newly assembled plant genomes by integrating various software and algorithms. In this study, we followed the EDTA software pipeline with default parameters to perform a de novo identification and statistical analysis of retrotransposons and DNA transposons in the genomes of three Ilex species.

4.5. Distribution of Genes and TEs

We used TBtools-II (Version 2.096) to analyze the distribution characteristics of protein-coding genes and transposable elements within the genome [46]. Firstly, the “Fasta Stats” tool was employed to calculate the lengths of the chromosomes. Following this, the “Table Row Manipulate” tool was used to determine the distribution density of genes and TEs across the genome. Lastly, the “Advanced Circos” tool was applied to visualize the results obtained from the previous steps.

4.6. Intersection of Genes and TEs

Bedtools is a collection of algorithmic tools for genomic data analysis, allowing for intersecting, merging, counting, complementing, and format transformation of genomic data [47]. “Bedtools intersect” is a standalone tool within Bedtools designed to calculate the positional relationships between two or more files. In this study, we utilized “Bedtools intersect” to perform an intersection analysis between genes and transposable elements. The regions of genes were further divided into promoter, exon, intron, 5′ UTR, and 3′ UTR. We set parameters as “-f 0.50” to ensure that at least 50% of the transposable elements were covered.

4.7. Extraction of Intron Positions in Genome

The standalone tool “Bedtools subtract” from the Bedtools toolkit was used to obtain the location data for introns [47]. The command was executed as “bedtools subtract -a gene.gff -b exon.gff > intron.gff”. The output file was sorted by chromosome position. Subsequently, the “Bedtools merge” tool was applied to consolidate overlapping entries within the intron.sort.gff file, with the command “bedtools merge -i intron.sort.gff -c 4,5 -o distinct > intron.sort.final.gff”.

4.8. Identification of Cis-Regulatory Elements

PlantCARE (https://bioinformatics.psb.ugent.be/webtools/plantcare/html/, accessed on 7 May 2024) is a specialized database and online toolkit for analyzing plant cis-regulatory elements, providing comprehensive information on various regulatory elements such as enhancers and silencers [48]. The DNA sequences of transposable elements located on promoters were submitted to the PlantCARE website to predict cis-regulatory elements. The annotations for each element were also retrieved from the PlantCARE database.

4.9. Prediction of Protein Structure

Protein sequences were extracted and formatted into Fasta files. These sequences served as input data for homology modeling using AlphaFold3 (https://golgi.sandbox.google.com/, accessed on 10 June 2024) [53]. The AlphaFold3 algorithm employs deep learning techniques to predict the most likely 3D conformation of a protein, selecting the optimal conformation as the result.

4.10. Protein–Protein Interaction Simulation

Information for the ligand At4g33430 was retrieved from the RCSB Protein Data Bank (https://www.rcsb.org/, accessed on 10 June 2024) [56,57]. Corresponding PDB format files were identified and downloaded for subsequent analysis. Protein–protein interaction was performed using the HADDOCK web server (https://rascar.science.uu.nl/haddock2.4/, accessed on 15 June 2024) [58]. The predicted structure of the target protein, along with the ligand protein structures obtained from the PDB, were used as input. The HADDOCK server generated various possible docking poses based on the input structures and interaction constraints. The optimal model was selected from the balanced-order models.
The complex structural model was created and visualized using the PyMOL Molecular Graphics System (Version 3.0.0) [59]. Colors were applied to label the different chains of the two proteins to facilitate visualization and interpretation. The capacity of protein–protein binding was assessed using the PDBePISA server (https://www.ebi.ac.uk/pdbe/pisa/, accessed on 15 June 2024) [60].

4.11. Molecular Docking Simulation of Proteins and Small-Molecule Ligands

The small-molecule ligands 7-deoxyloganetin (Compound CID: 10262598) and UDP-alpha-D-glucose (Compound CID: 8629) were obtained from PubChem (https://pubchem.ncbi.nlm.nih.gov, accessed on 19 July 2024) [61]. Corresponding SDF format files were downloaded for subsequent analyses. The SDF files were optimized using the Open Babel and AutoDockTools software (Version 1.5.7), and subsequently, saved in PDBQT format [62,63]. Concurrently, the protein PDB files were refined using AutoDockTools and saved in PDBQT format. The PDBQT files of the protein receptor and small-molecule ligands were inputted into AutoDock Vina for molecular docking simulations [64,65]. The final results were recorded, and the best model was selected based on these simulations. The complex structural model was generated and visualized using the PyMOL Molecular Graphics System (version 3.0.0) [59]. To enhance clarity, different colors were employed to distinguish between the protein amino acid residues and the small-molecule ligands.

Supplementary Materials

The following supporting information can be downloaded at: https://www.mdpi.com/article/10.3390/plants13182649/s1, Table S1: Statistics on the number of chromosomes in Ilex species; Table S2: Num. of genes in each chromosome on three Ilex species; Table S3: Length of each chromosome across three Ilex species; Table S4: Num. of transcription factor families on three Ilex species; Table S5: Num. of genes intersected with TEs on different gene elements in three Ilex species; Table S6: Num. of TEs intersected with gene in three Ilex species; Table S7: Num. of TEs intersected with promoter in three Ilex species; Table S8: Num. of cis-regulatory elements in three Ilex species; Table S9: Autodock vina molecular docking results between proteins and ligand in three Ilex species; Table S10: PDBePISA interface result between proteins and BAK1 in three Ilex species; Figures S1–S3: Chromosomal collinearity analysis in three Ilex species with each other; Figures S4–S6: Distribution of protein-coding genes and TEs in genomes of three Ilex species, respectively.

Author Contributions

Conceptualization, Z.G. and K.-W.X.; formal analysis, Z.X., H.W., M.L., Y.Q. and Z.G.; data curation, Z.X.; writing—original draft preparation, Z.X. and Z.G.; writing—review and editing, Z.X., Z.G., H.W., L.L. and K.-W.X.; supervision, L.L., K.-W.X. and Z.G.; funding acquisition, K.-W.X. All authors have read and agreed to the published version of the manuscript.

Funding

This research was funded by the Natural Science Foundation of Jiangsu Province grant number BK20210612 and the National Natural Science Foundation of China, 32100167 to K.X.

Data Availability Statement

The original contributions presented in the study are included in the article/Supplementary Materials, further inquiries can be directed to the corresponding authors.

Acknowledgments

We thank all members of Guo’s and Xu’s laboratories for their comments and suggestions on this study.

Conflicts of Interest

The authors declare no conflicts of interest.

References

  1. Feulner, P.G.D.; De-Kayne, R. Genome evolution, structural rearrangements and speciation. J. Evol. Biol. 2017, 30, 1488–1490. [Google Scholar] [CrossRef] [PubMed]
  2. Hughes, A.R.; Inouye, B.D.; Johnson, M.T.J.; Underwood, N.; Vellend, M. Ecological consequences of genetic diversity. Ecol. Lett. 2008, 11, 609–623. [Google Scholar] [CrossRef] [PubMed]
  3. Reed, D.H.; Frankham, R. Correlation between fitness and genetic diversity. Conserv. Biol. 2003, 17, 230–237. [Google Scholar] [CrossRef]
  4. Otto, S.P.; Whitton, J. Polyploid incidence and evolution. Annu. Rev. Genet. 2000, 34, 401–437. [Google Scholar] [CrossRef] [PubMed]
  5. Levin, D.A. The Role of Chromosomal Change in Plant Evolution; Oxford University Press: Oxford, UK, 2002; ISBN 9780197701928. [Google Scholar]
  6. Wessler, S.R. Transposable elements and the evolution of eukaryotic genomes. Proc. Natl. Acad. Sci. USA 2006, 103, 17600–17601. [Google Scholar] [CrossRef]
  7. Schubert, I.; Lysak, M.A. Interpretation of karyotype evolution should consider chromosome structural constraints. Trends Genet. 2011, 27, 207–216. [Google Scholar] [CrossRef]
  8. Weiss-Schneeweiss, H.; Schneeweiss, G.M. Karyotype Diversity and Evolutionary Trends in Angiosperms. In Plant Genome Diversity Volume 2: Physical Structure, Behaviour and Evolution of Plant Genomes; Greilhuber, J., Dolezel, J., Wendel, J.F., Eds.; Springer: Vienna, Austria, 2013; pp. 209–230. [Google Scholar]
  9. Miao, Y.; Luo, D.; Zhao, T.; Du, H.; Liu, Z.; Xu, Z.; Guo, L.; Chen, C.; Peng, S.; Li, J.X.; et al. Genome sequencing reveals chromosome fusion and extensive expansion of genes related to secondary metabolism in Artemisia argyi. Plant Biotechnol. J. 2022, 20, 1902–1915. [Google Scholar] [CrossRef]
  10. JW, I.J.; Baldini, A.; Ward, D.C.; Reeders, S.T.; Wells, R.A. Origin of human chromosome 2: An ancestral telomere-telomere fusion. Proc. Natl. Acad. Sci. USA 1991, 88, 9051–9055. [Google Scholar]
  11. Cicconardi, F.; Lewis, J.J.; Martin, S.H.; Reed, R.D.; Danko, C.G.; Montgomery, S.H. Chromosome fusion affects genetic diversity and evolutionary turnover of functional loci but consistently depends on chromosome size. Mol. Biol. Evol. 2021, 38, 4449–4462. [Google Scholar] [CrossRef]
  12. Xuan, Y.; Ma, B.; Li, D.; Tian, Y.; Zeng, Q.; He, N. Chromosome restructuring and number change during the evolution of Morus notabilis and Morus alba. Hortic. Res. 2022, 9, uhab030. [Google Scholar] [CrossRef]
  13. Vara, C.; Paytuví-Gallart, A.; Cuartero, Y.; Álvarez-González, L.; Marín-Gual, L.; Garcia, F.; Florit-Sabater, B.; Capilla, L.; Sanchéz-Guillén, R.A.; Sarrate, Z.; et al. The impact of chromosomal fusions on 3D genome folding and recombination in the germ line. Nat. Commun. 2021, 12, 2981. [Google Scholar] [CrossRef] [PubMed]
  14. Hauffe, H.C.; Searle, J.B. Chromosomal heterozygosity and fertility in house mice (Mus musculus domesticus) from Northern Italy. Genetics 1998, 150, 1143–1154. [Google Scholar] [CrossRef] [PubMed]
  15. de Vos, J.M.; Augustijnen, H.; Bätscher, L.; Lucek, K. Speciation through chromosomal fusion and fission in Lepidoptera. Philos. Trans. R. Soc. Lond. B Biol. Sci. 2020, 375, 20190539. [Google Scholar] [CrossRef] [PubMed]
  16. Luo, J.; Sun, X.; Cormack, B.P.; Boeke, J.D. Karyotype engineering by chromosome fusion leads to reproductive isolation in yeast. Nature 2018, 560, 392–396. [Google Scholar] [CrossRef] [PubMed]
  17. McClintock, B. The origin and behavior of mutable loci in maize. Proc. Natl. Acad. Sci. USA 2012, 36, 344–355. [Google Scholar] [CrossRef] [PubMed]
  18. Wells, J.N.; Feschotte, C. A field guide to eukaryotic transposable elements. Annu. Rev. Genet. 2020, 54, 539–561. [Google Scholar] [CrossRef]
  19. Kumar, A.; Bennetzen, J.L. Plant retrotransposons. Annu. Rev. Genet. 1999, 33, 479–532. [Google Scholar] [CrossRef]
  20. Bourque, G.; Burns, K.H.; Gehring, M.; Gorbunova, V.; Seluanov, A.; Hammell, M.; Imbeault, M.; Izsvák, Z.; Levin, H.L.; Macfarlan, T.S.; et al. Ten things you should know about transposable elements. Genome Biol. 2018, 19, 199. [Google Scholar] [CrossRef]
  21. Makałowski, W.; Gotea, V.; Pande, A.; Makałowska, I. Transposable Elements: Classification, Identification, and Their Use As a Tool for Comparative Genomics; Anisimova, M., Ed.; Evolutionary Genomics: Humana, New York, NY, USA, 2019; Volume 1910, pp. 177–207. [Google Scholar]
  22. Klein, S.J.; O’Neill, R.J. Transposable elements: Genome innovation, chromosome diversity, and centromere conflict. Chromosome Res. 2018, 26, 5–23. [Google Scholar] [CrossRef]
  23. Stritt, C.; Wyler, M.; Gimmi, E.L.; Pippel, M.; Roulin, A.C. Diversity, dynamics and effects of long terminal repeat retrotransposons in the model grass Brachypodium distachyon. New Phytol. 2019, 227, 1736–1748. [Google Scholar] [CrossRef]
  24. Ramakrishnan, M.; Satish, L.; Sharma, A.; Kurungara Vinod, K.; Emamverdian, A.; Zhou, M.; Wei, Q. Transposable elements in plants: Recent advancements, tools and prospects. Plant Mol. Biol. Rep. 2022, 40, 628–645. [Google Scholar] [CrossRef]
  25. Hassan, A.H.; Mokhtar, M.M.; El Allali, A. Transposable elements: Multifunctional players in the plant genome. Front. Plant Sci. 2024, 14, 1330127. [Google Scholar] [CrossRef] [PubMed]
  26. Parisod, C.; Alix, K.; Just, J.; Petit, M.; Sarilar, V.; Mhiri, C.; Ainouche, M.; Chalhoub, B.; Grandbastien, M.A. Impact of transposable elements on the organization and function of allopolyploid genomes. New Phytol. 2010, 186, 37–45. [Google Scholar] [CrossRef] [PubMed]
  27. Lockton, S.; Gaut, B.S. The contribution of Transposable Elements to expressed coding sequence in Arabidopsis thaliana. J. Mol. Evol. 2009, 68, 80–89. [Google Scholar] [CrossRef] [PubMed]
  28. Gisby, J.S.; Catoni, M. The widespread nature of Pack-TYPE transposons reveals their importance for plant genome evolution. PLoS Genet. 2022, 18, e1010078. [Google Scholar] [CrossRef]
  29. Niu, X.-M.; Xu, Y.-C.; Li, Z.-W.; Bian, Y.-T.; Hou, X.-H.; Chen, J.-F.; Zou, Y.-P.; Jiang, J.; Wu, Q.; Ge, S.; et al. Transposable elements drive rapid phenotypic variation in Capsella rubella. Proc. Natl. Acad. Sci. USA 2019, 116, 6908–6913. [Google Scholar] [CrossRef]
  30. Zhang, L.; Hu, J.; Han, X.; Li, J.; Gao, Y.; Richards, C.M.; Zhang, C.; Tian, Y.; Liu, G.; Gul, H.; et al. A high-quality apple genome assembly reveals the association of a retrotransposon and red fruit colour. Nat. Commun. 2019, 10, 1494. [Google Scholar] [CrossRef]
  31. Chen, G.; Wang, R.; Jiang, Y.; Dong, X.; Xu, J.; Xu, Q.; Kan, Q.; Luo, Z.; Springer, N.M.; Li, Q. A novel active transposon creates allelic variation through altered translation rate to influence protein abundance. Nucleic Acids Res. 2023, 51, 595–609. [Google Scholar] [CrossRef]
  32. Cai, X.; Lin, R.; Liang, J.; King, G.J.; Wu, J.; Wang, X. Transposable element insertion: A hidden major source of domesticated phenotypic variation in Brassica rapa. Plant Biotechnol. J. 2022, 20, 1298–1310. [Google Scholar] [CrossRef]
  33. Li, X.; Dai, X.; He, H.; Lv, Y.; Yang, L.; He, W.; Liu, C.; Wei, H.; Liu, X.; Yuan, Q.; et al. A pan-TE map highlights transposable elements underlying domestication and agronomic traits in Asian rice. Natl. Sci. Rev. 2024, 11, nwae188. [Google Scholar] [CrossRef]
  34. Guo, Z.; Kuang, Z.; Tao, Y.; Wang, H.; Wan, M.; Hao, C.; Shen, F.; Yang, X.; Li, L.; Arkhipova, I. Miniature Inverted-repeat Transposable Elements drive rapid microRNA diversification in angiosperms. Mol. Biol. Evol. 2022, 39, msac224. [Google Scholar] [CrossRef] [PubMed]
  35. Loizeau, P.A.; Andrews, S.V.; Spichiger, S.; Aquifoliaceae, R. The families and genera of vascular plants. In Flowering Plants. Eudicots; Kubitzki, K., Ed.; Springer: Berlin/Heidelberg, Germany, 2016; Volume 10, pp. 31–36. ISBN 978-3-319-93604-8. [Google Scholar]
  36. Yao, X.; Zhang, F.; Corlett, R.T. Utilization of the hollies (Ilex L. spp.): A review. Forests 2022, 13, f13010094. [Google Scholar] [CrossRef]
  37. Xu, K.W.; Wei, X.F.; Lin, C.X.; Zhang, M.; Zhang, Q.; Zhou, P.; Fang, Y.M.; Xue, J.Y.; Duan, Y.F. The chromosome-level holly (Ilex latifolia) genome reveals key enzymes in triterpenoid saponin biosynthesis and fruit color change. Front. Plant Sci. 2022, 13, 982323. [Google Scholar] [CrossRef] [PubMed]
  38. Yao, X.; Lu, Z.; Song, Y.; Hu, X.; Corlett, R.T. A chromosome-scale genome assembly for the holly (Ilex polyneura) provides insights into genomic adaptations to elevation in southwest China. Hortic. Res. 2022, 9, uhab049. [Google Scholar] [CrossRef] [PubMed]
  39. Kong, B.L.; Nong, W.; Wong, K.H.; Law, S.T.; So, W.L.; Chan, J.J.; Zhang, J.; Lau, T.D.; Hui, J.H.; Shaw, P.C. Chromosomal level genome of Ilex asprella and insight into antiviral triterpenoid pathway. Genomics 2022, 114, 110366. [Google Scholar] [CrossRef]
  40. Guo, Z.; Wei, J.; Xu, Z.; Lin, C.; Peng, Y.; Wang, Q.; Wang, D.; Yang, X.; Xu, K.W. HollyGTD: An integrated database for holly (Aquifoliaceae) genome and taxonomy. Front. Plant Sci. 2023, 14, 1220925. [Google Scholar] [CrossRef]
  41. Rice, A.; Glick, L.; Abadi, S.; Einhorn, M.; Kopelman, N.M.; Salman-Minkov, A.; Mayzel, J.; Chay, O.; Mayrose, I. The Chromosome Counts Database (CCDB)—A community resource of plant chromosome numbers. New Phytol. 2014, 206, 19–26. [Google Scholar] [CrossRef]
  42. Yang, Y.; Jiang, L.; Liu, E.D.; Liu, W.L.; Chen, L.; Kou, Y.X.; Fan, D.M.; Cheng, S.M.; Zhang, Z.Y.; Peng, H. Time to update the sectional classification of Ilex (Aquifoliaceae): New insights from Ilex phylogeny, morphology, and distribution. J. Syst. Evol. 2023, 61, 1036–1046. [Google Scholar] [CrossRef]
  43. Wang, Y.; Tang, H.; DeBarry, J.D.; Tan, X.; Li, J.; Wang, X.; Lee, T.H.; Jin, H.; Marler, B.; Guo, H.; et al. MCScanX: A toolkit for detection and evolutionary analysis of gene synteny and collinearity. Nucleic Acids. Res. 2012, 40, e49. [Google Scholar] [CrossRef]
  44. Tian, F.; Yang, D.-C.; Meng, Y.-Q.; Jin, J.; Gao, G. PlantRegMap: Charting functional regulatory maps in plants. Nucleic Acids. Res. 2019, 48, D1104–D1113. [Google Scholar] [CrossRef]
  45. Ou, S.; Su, W.; Liao, Y.; Chougule, K.; Agda, J.R.A.; Hellinga, A.J.; Lugo, C.S.B.; Elliott, T.A.; Ware, D.; Peterson, T.; et al. Benchmarking transposable element annotation methods for creation of a streamlined, comprehensive pipeline. Genome Biol. 2019, 20, 275. [Google Scholar] [CrossRef] [PubMed]
  46. Chen, C.; Chen, H.; Zhang, Y.; Thomas, H.R.; Frank, M.H.; He, Y.; Xia, R. TBtools: An integrative toolkit developed for interactive analyses of big biological data. Mol. Plant 2020, 13, 1194–1202. [Google Scholar] [CrossRef] [PubMed]
  47. Quinlan, A.R.; Hall, I.M. BEDTools: A flexible suite of utilities for comparing genomic features. Bioinformatics 2010, 26, 841–842. [Google Scholar] [CrossRef] [PubMed]
  48. Rombauts, S.; Dehais, P.; Van Montagu, M.; Rouze, P. PlantCARE, a plant cis-acting regulatory element database. Nucleic Acids Res. 1999, 27, 295–296. [Google Scholar] [CrossRef] [PubMed]
  49. Nagatoshi, M.; Terasaka, K.; Nagatsu, A.; Mizukami, H. Iridoid-specific Glucosyltransferase from Gardenia jasminoides. J. Biol. Chem. 2011, 286, 32866–32874. [Google Scholar] [CrossRef] [PubMed]
  50. Asada, K.; Salim, V.; Masada-Atsumi, S.; Edmunds, E.; Nagatoshi, M.; Terasaka, K.; Mizukami, H.; De Luca, V. A 7-Deoxyloganetic acid glucosyltransferase contributes a key step in secologanin biosynthesis in madagascar periwinkle. Plant Cell 2013, 25, 4123–4134. [Google Scholar] [CrossRef]
  51. Li, J.; Wen, J.; Lease, K.A.; Doke, J.T.; Tax, F.E.; Walker, J.C. BAK1, an Arabidopsis LRR Receptor-like Protein Kinase, interacts with BRI1 and modulates brassinosteroid signaling. Cell 2002, 110, 213–222. [Google Scholar] [CrossRef]
  52. Sun, Y.; Li, L.; Macho, A.P.; Han, Z.; Hu, Z.; Zipfel, C.; Zhou, J.-M.; Chai, J. Structural basis for flg22-induced activation of the Arabidopsis FLS2-BAK1 immune complex. Science 2013, 342, 624–628. [Google Scholar] [CrossRef]
  53. Abramson, J.; Adler, J.; Dunger, J.; Evans, R.; Green, T.; Pritzel, A.; Ronneberger, O.; Willmore, L.; Ballard, A.J.; Bambrick, J.; et al. Accurate structure prediction of biomolecular interactions with AlphaFold 3. Nature 2024, 630, 493–500. [Google Scholar] [CrossRef]
  54. Kim, J.M.; Vanguri, S.; Boeke, J.D.; Gabriel, A.; Voytas, D.F. Transposable Elements and Genome Organization: A comprehensive survey of retrotransposons revealed by the complete Saccharomyces cerevisiae senome sequence. Genome Res. 1998, 8, 464–478. [Google Scholar] [CrossRef]
  55. Flavell, R.B.; Bennett, M.D.; Smith, J.B.; Smith, D.B. Genome size and the proportion of repeated nucleotide sequence DNA in plants. Biochem. Genet. 1974, 12, 257–269. [Google Scholar] [CrossRef]
  56. Berman, H.M. The Protein Data Bank. Nucleic Acids Res. 2000, 28, 235–242. [Google Scholar] [CrossRef] [PubMed]
  57. Burley, S.K.; Bhikadiya, C.; Bi, C.; Bittrich, S.; Chao, H.; Chen, L.; Craig, P.A.; Crichlow, G.V.; Dalenberg, K.; Duarte, J.M.; et al. RCSB Protein Data Bank (RCSB.org): Delivery of experimentally-determined PDB structures alongside one million computed structure models of proteins from artificial intelligence/machine learning. Nucleic Acids Res. 2023, 51, D488–D508. [Google Scholar] [CrossRef] [PubMed]
  58. Honorato, R.V.; Trellet, M.E.; Jiménez-García, B.; Schaarschmidt, J.J.; Giulini, M.; Reys, V.; Koukos, P.I.; Rodrigues, J.P.G.L.M.; Karaca, E.; van Zundert, G.C.P.; et al. The HADDOCK2.4 web server for integrative modeling of biomolecular complexes. Nat. Protoc. 2024. [Google Scholar] [CrossRef]
  59. Chrödinger, L.L.C. The PyMOL Molecular Graphics System, Version 3.0.0; PyMOL. Available online: https://pymol.org/ (accessed on 15 June 2024).
  60. Krissinel, E.; Henrick, K. Inference of macromolecular assemblies from crystalline state. J. Mol. Biol. 2007, 372, 774–797. [Google Scholar] [CrossRef] [PubMed]
  61. Kim, S.; Chen, J.; Cheng, T.; Gindulyte, A.; He, J.; He, S.; Li, Q.; Shoemaker, B.A.; Thiessen, P.A.; Yu, B.; et al. PubChem 2023 update. Nucleic Acids. Res. 2023, 51, D1373–D1380. [Google Scholar] [CrossRef] [PubMed]
  62. O’Boyle, N.M.; Banck, M.; James, C.A.; Morley, C.; Vandermeersch, T.; Hutchison, G.R. Open Babel: An open chemical toolbox. J. Cheminf. 2011, 3, 33. [Google Scholar] [CrossRef]
  63. Morris, G.M.; Huey, R.; Lindstrom, W.; Sanner, M.F.; Belew, R.K.; Goodsell, D.S.; Olson, A.J. AutoDock4 and AutoDockTools4: Automated docking with selective receptor flexibility. J. Comput. Chem. 2009, 30, 2785–2791. [Google Scholar] [CrossRef]
  64. Trott, O.; Olson, A.J. AutoDock Vina: Improving the speed and accuracy of docking with a new scoring function, efficient optimization, and multithreading. J. Comput. Chem. 2009, 31, 455–461. [Google Scholar] [CrossRef]
  65. Eberhardt, J.; Santos-Martins, D.; Tillack, A.F.; Forli, S. AutoDock Vina 1.2.0: New docking methods, expanded force field, andpython bindings. J. Chem. Inf. Model. 2021, 61, 3891–3898. [Google Scholar] [CrossRef]
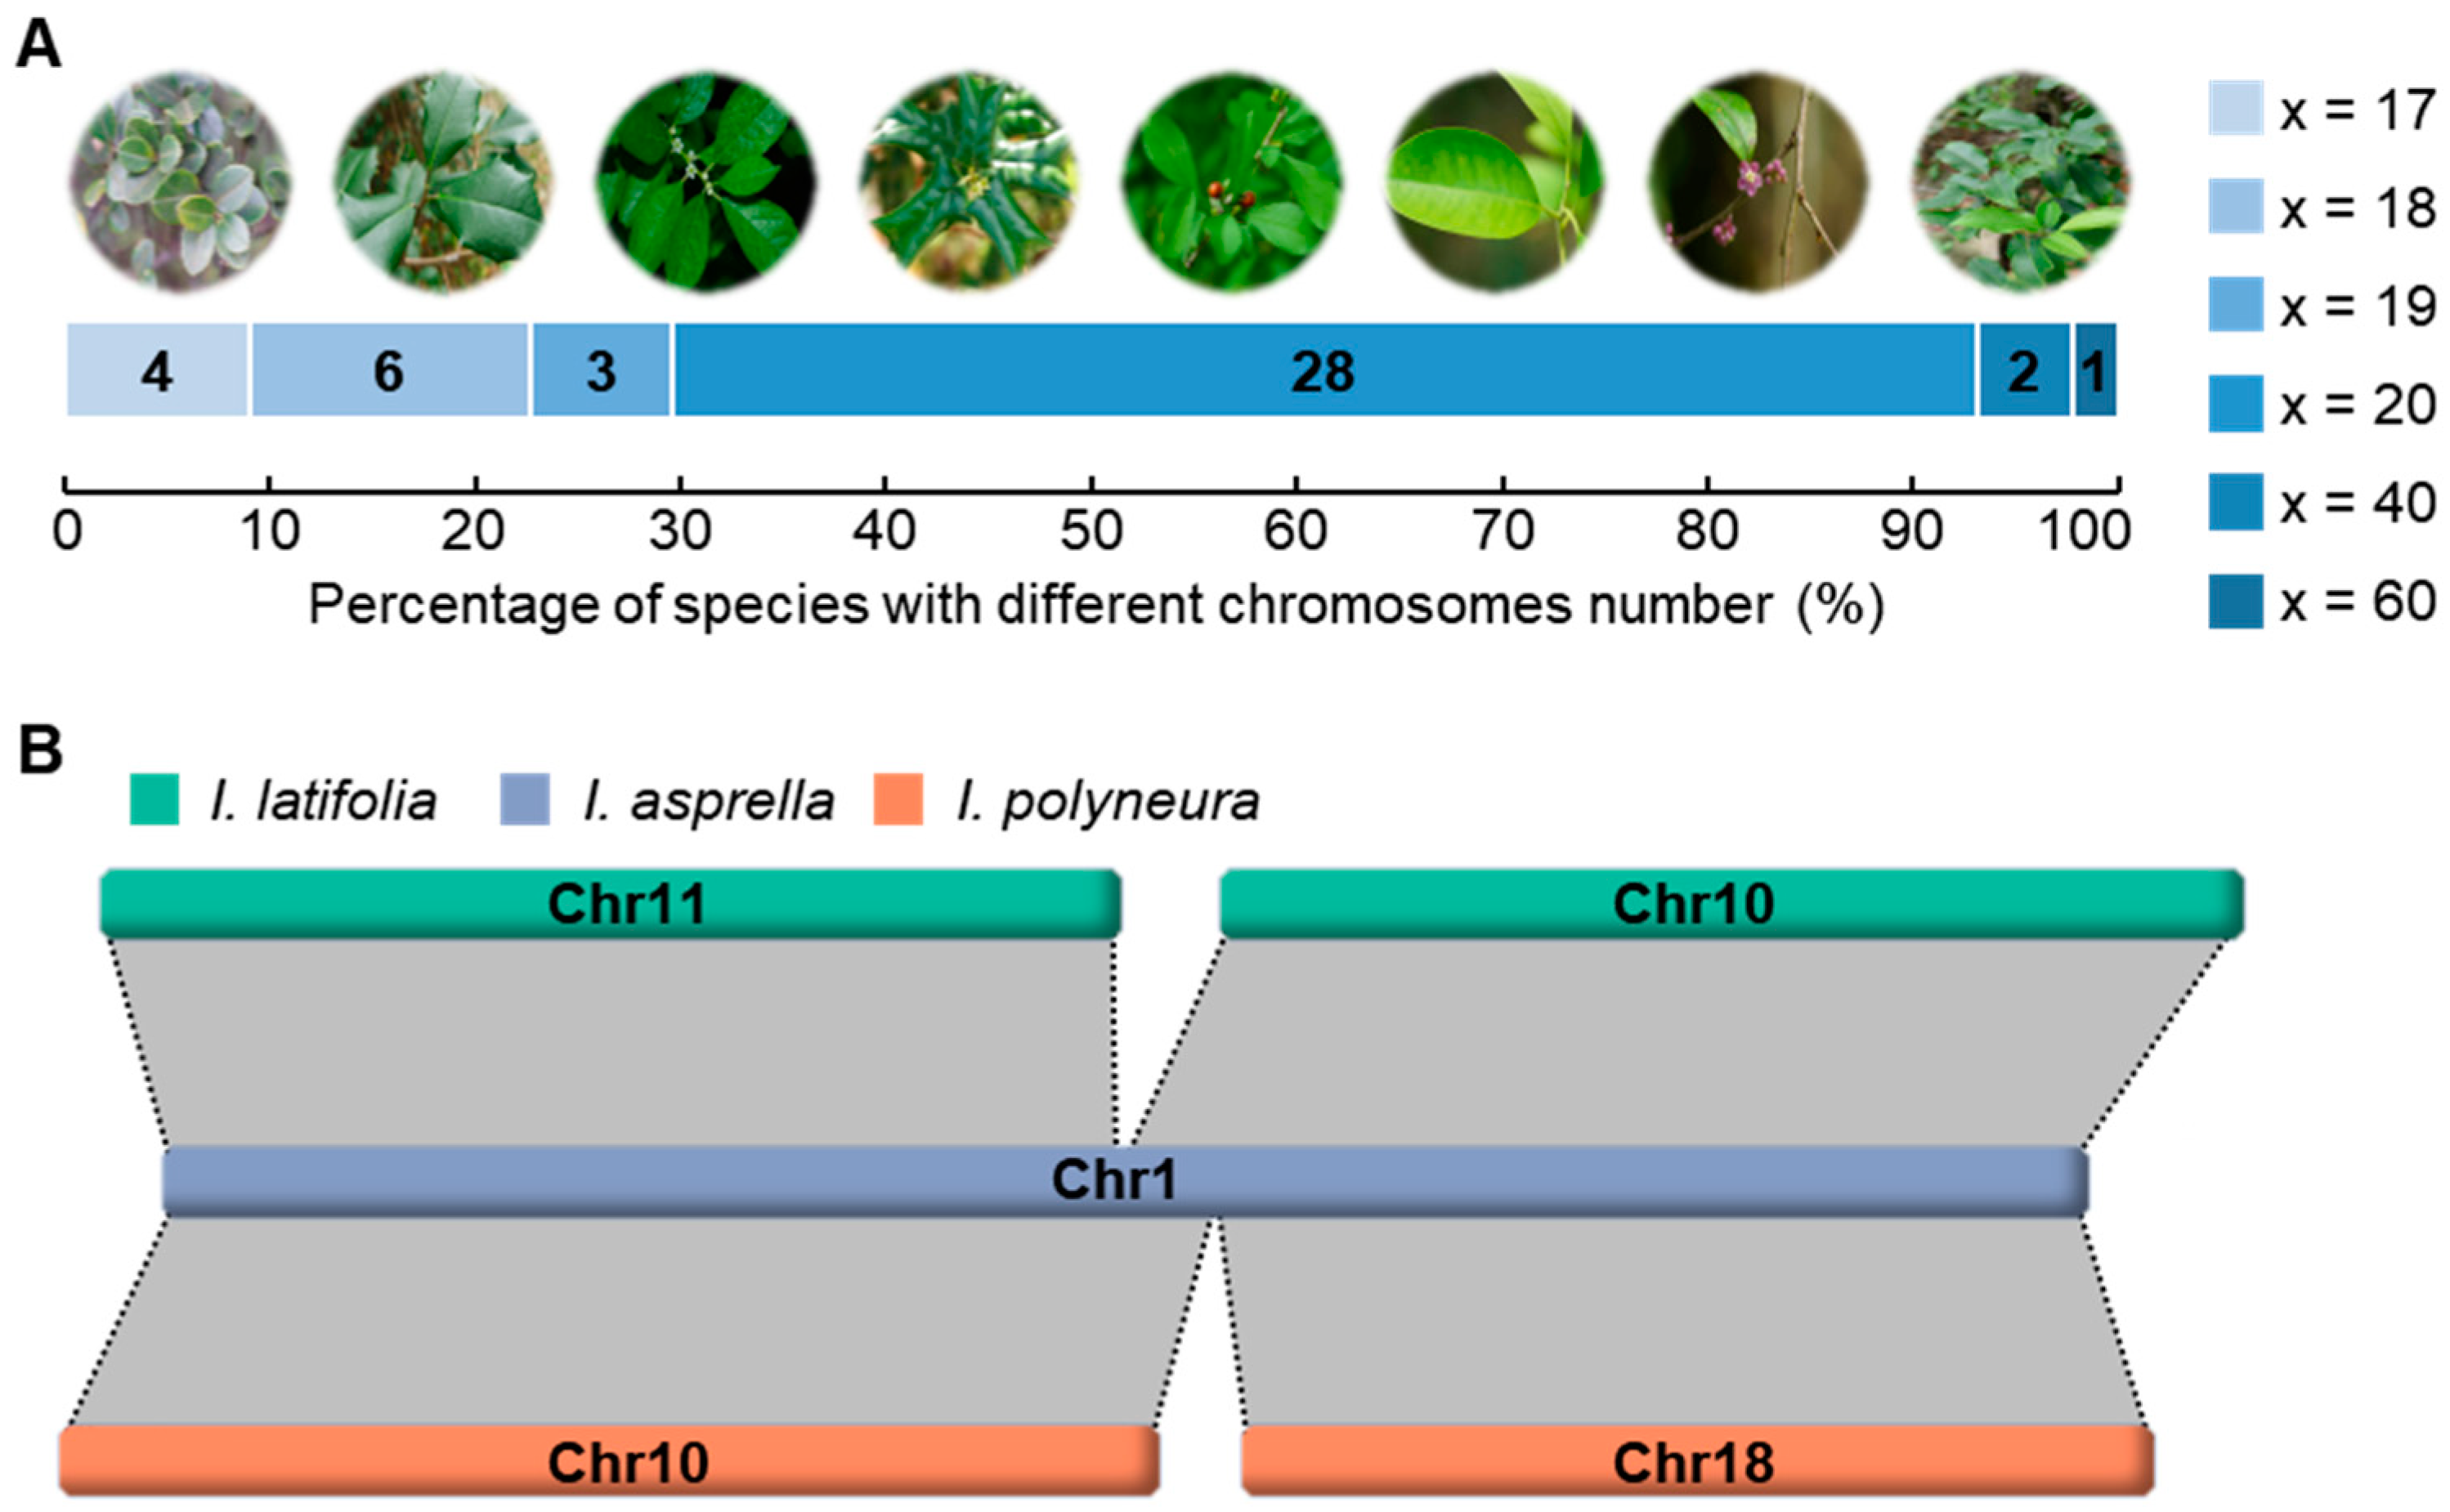
Figure 1. Chromosome number in Ilex and chromosome fusion in I. asprella. (A) Statistics of the chromosome number in representative species of Ilex. The photos from left to right indicate I. crenata Thunb. (x = 17), I. opaca Aiton and I. verticillata (L.) A. Gray (x = 18), I. cornuta Lindl. & Paxton (x = 19), I. decidua Walter, I. godajam (Colebr.) Wall. ex Hook.f. and I. pubescens Hook. & Arn. (x = 20), and I. pedunculosa (x = 60). (B) Collinearity plot showing the fusion of Chr1 in I. asprella.
Plants 13 02649 g001
Figure 2. Comparative genomic analyses in three Ilex species. (A) Collinearity analysis in I. latifolia, I. polyneura, and I. asprella. The chromosome fusion in I. asprella is highlighted in blue. (B) The number of annotated protein-coding genes in corresponding chromosomes of I. latifolia, I. polyneura, and I. asprella. (C) Statistics of 58 transcription factor families in three Ilex species. Percentages in I. latifolia, I. polyneura, and I. asprella are marked in green, orange, and blue, respectively.
Plants 13 02649 g002
Figure 3. Identification of TEs in three Ilex genomes. (A) Pie charts showing the total proportion of TEs in the genomes of I. latifolia, I. polyneura, and I. asprella. (B,C) Bar charts showing the proportion of TEs belonging to Class I, Class II (B), and each superfamily (C) in the three genomes.
Plants 13 02649 g003
Figure 4. Distribution of protein-coding genes and TEs in genomes of three Ilex species. (AC) Three circular plots represent the densities of distinct genomic features in I. latifolia (A), I. polyneura (B), and I. asprella (C). Layers of circular plots from outside to inside indicate (I) gene, (II) transposable elements, (III) terminal inverted repeat, (IV) long terminal repeat, and (V) LTR_Gypsy. The ideogram scale is in Mbp.
Plants 13 02649 g004
Figure 5. Analysis of protein-coding genes potentially affected by TEs. (A) Number of protein-coding genes intersect with TEs. The solid and dashed rectangles indicate TEs intersect with gene bodies and promoters, respectively. Promoters are defined as the 2000 bps upstream of the transcriptional start site. (B) Proportion of genes which contain TEs in exons, introns, 5′ UTR, and 3′ UTR regions. (C,D) Number of TEs in distinct superfamilies which intersect with gene bodies (C) and promoters (D). (E) Number of predicted cis-regulatory elements caused by TE insertions in promoters. (F) The functional annotation of cis-regulatory elements caused by TE insertions in promoters. The normalized number is calculated by the number of one type of element divided by the total number of elements, then multiplied by 1000.
Plants 13 02649 g005
Figure 6. Simulated docking structures of 7−deoxyloganetin glucosyltransferase with two small-molecule ligands, 7−deoxyloganetin and UDP−alpha−D−glucose. Protein structures of 7−deoxyloganetin glucosyltransferase in I. asprella (A), I. polyneura (B), and I. latifolia (C) are indicated in green. Ball and stick structures with red, blue, and gray indicate 7-deoxyloganetin (top) and UDP−alpha−D−glucose (bottom). TEs belonging to Gypsy superfamily insert into the exons of Ila08G000660.1 in I. latifolia. ΔiG (kcal/mol) indicates the binding free energy at the interface.
Plants 13 02649 g006
Figure 7. Simulated binding structures of TMK acceptors and their donors. Three TMK proteins, in I. polyneura (A), I. latifolia (B), and I. asprella (C), interactions with donors (AtMAK1, At4g33430) are predicted by AlphaFold3 [53]. Green structures indicate TMK proteins, while blue structures indicate donors. TEs belonging to CACTA superfamily insert into the exons of TMK gene in I. latifolia and I. asprella. ΔiG (kcal/mol) indicates the binding free energy at the interface.
Plants 13 02649 g007
Table 1. Statistics of identified TEs in three genomes of Ilex.
OrderSuperfamilyI. latifoliaI. asprellaI. polyneura
CountLength (bp)%CountLength (bp)%CountLength (bp)%
LTRCopia38,21930,700,8314.01%51,99835,494,9284.96%35,85729,629,4644.08%
Gypsy145,246196,792,50825.69%170,245176,221,77224.63%146,734186,042,50325.59%
unknown74,94642,916,0755.60%54,84633,952,9584.75%83,40345,770,0366.29%
Non-LTRLINE_element34912,077,1870.27%37902,279,0860.32%26051,113,3380.15%
unknown570167,5450.02%000.00%000.00%
TIRCACTA69,30222,641,0952.96%79,12426,401,2253.69%58,66718,315,0402.52%
Mutator141,93746,577,9196.08%139,18348,341,1436.76%119,26138,338,6225.27%
PIF_Harbinger26,3678,491,6501.11%37,81811,904,2291.66%26,5258,109,1611.12%
Tc1_Mariner71961,968,4340.26%68221,886,2530.26%45881,248,6140.17%
hAT56,87320,727,7062.71%34,98113,398,0441.87%54,11420,263,4832.79%
Non-TIRHelitron139,76847,218,5416.16%52,97616,905,4472.36%143,66548,573,1496.68%
repeat_region 125,49037,903,4674.95%165,14545,991,6816.43%123,44934,683,0804.77%
Total829,405458,182,95859.82%796,928412,776,76657.70%798,868432,086,49059.43%
Disclaimer/Publisher’s Note: The statements, opinions and data contained in all publications are solely those of the individual author(s) and contributor(s) and not of MDPI and/or the editor(s). MDPI and/or the editor(s) disclaim responsibility for any injury to people or property resulting from any ideas, methods, instructions or products referred to in the content.