
Application Techniques and Concentrations of Ascorbic Acid to Reduce Saline Stress in Passion Fruit


 ,
, 
 ,
,
Abstract
:1. Introduction
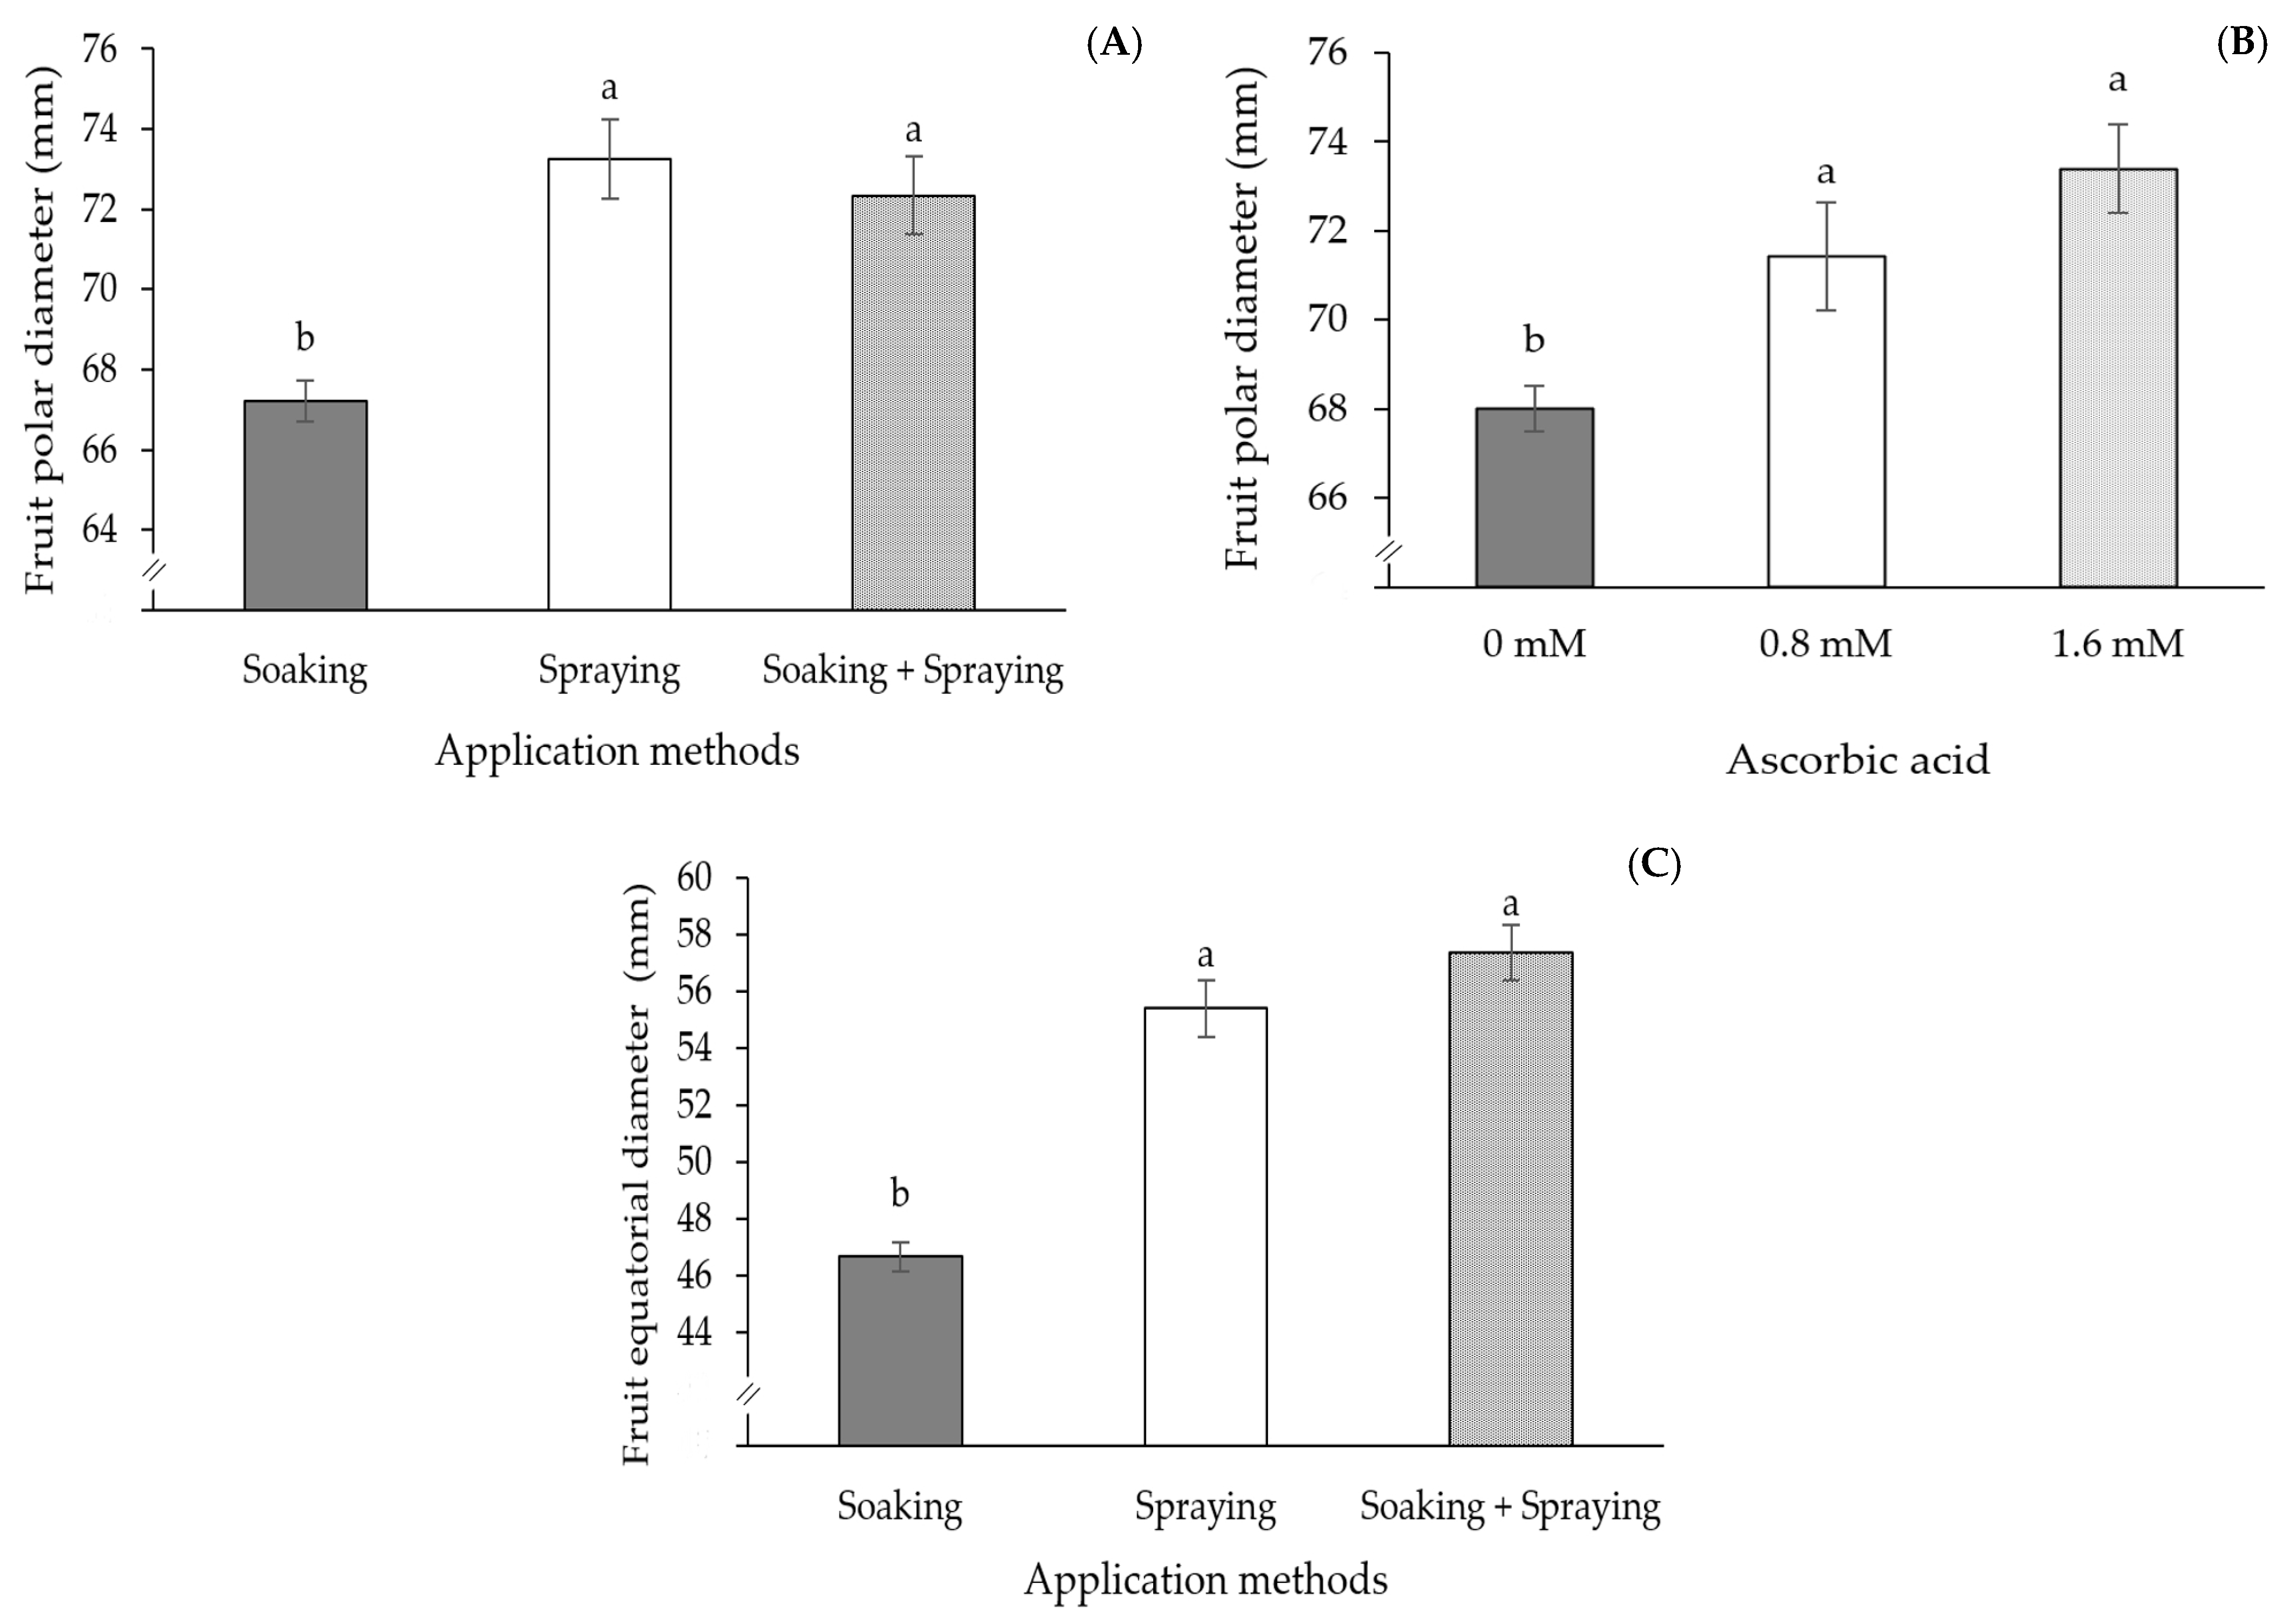
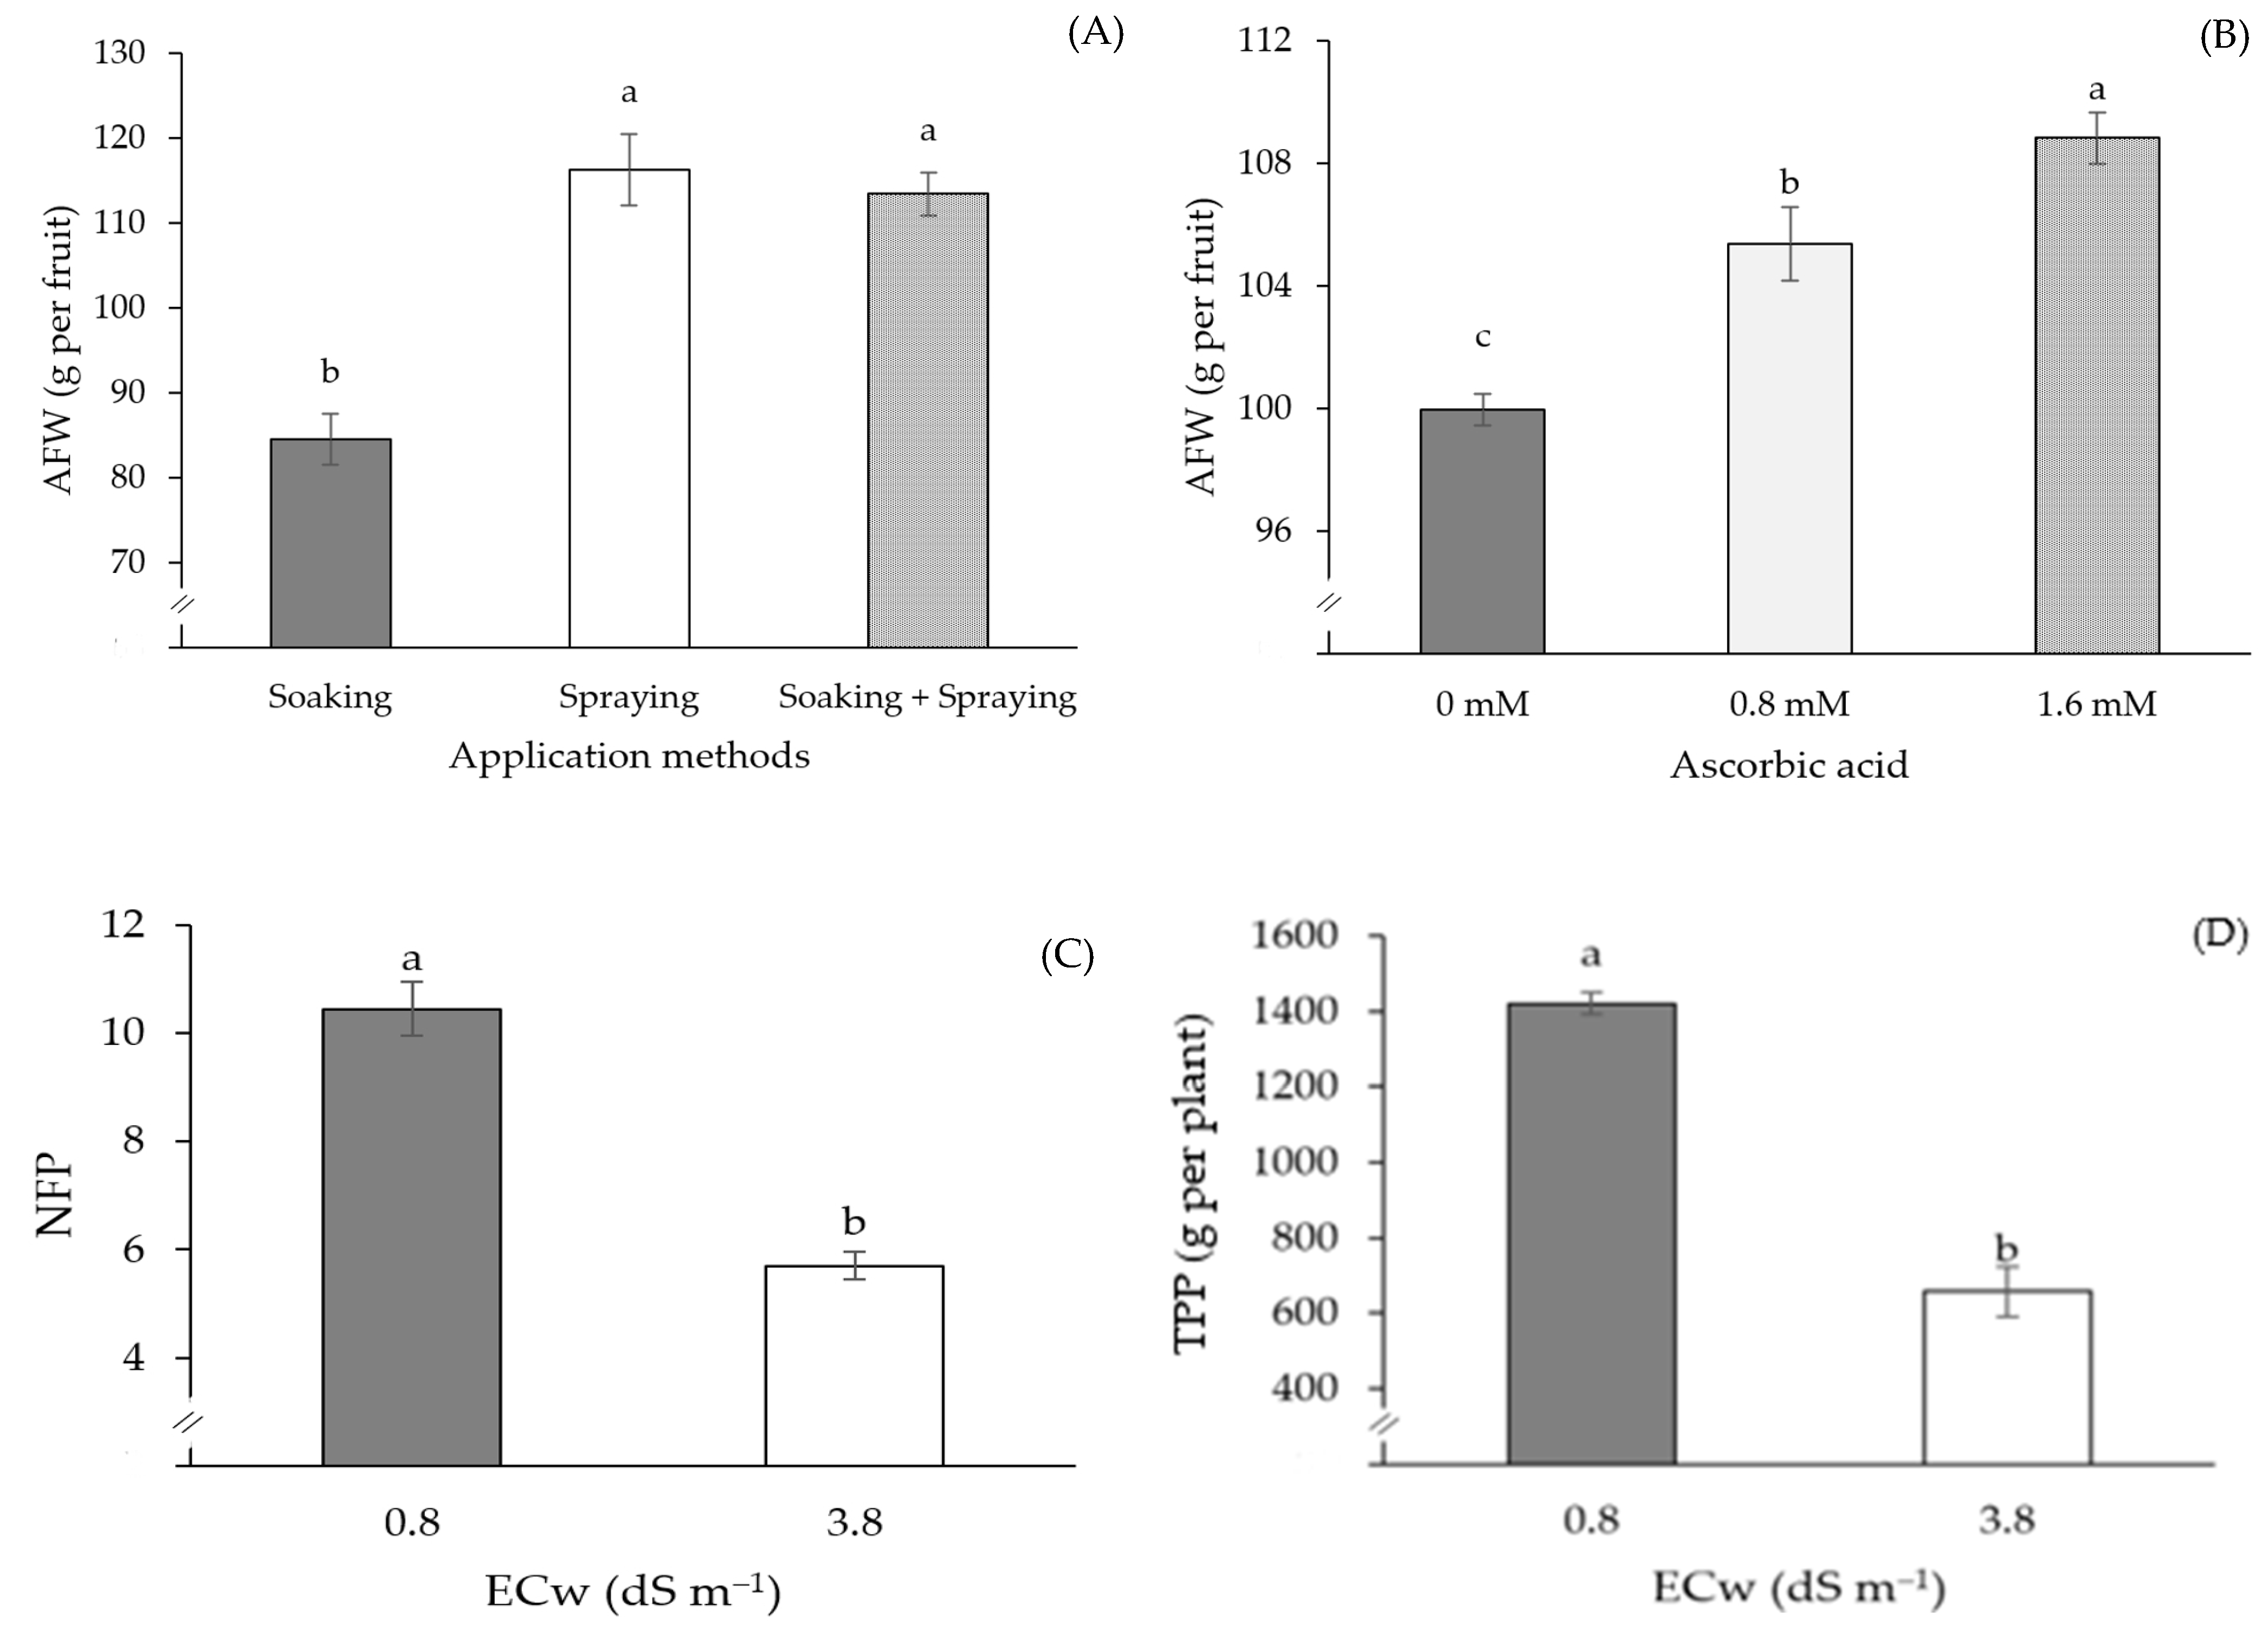
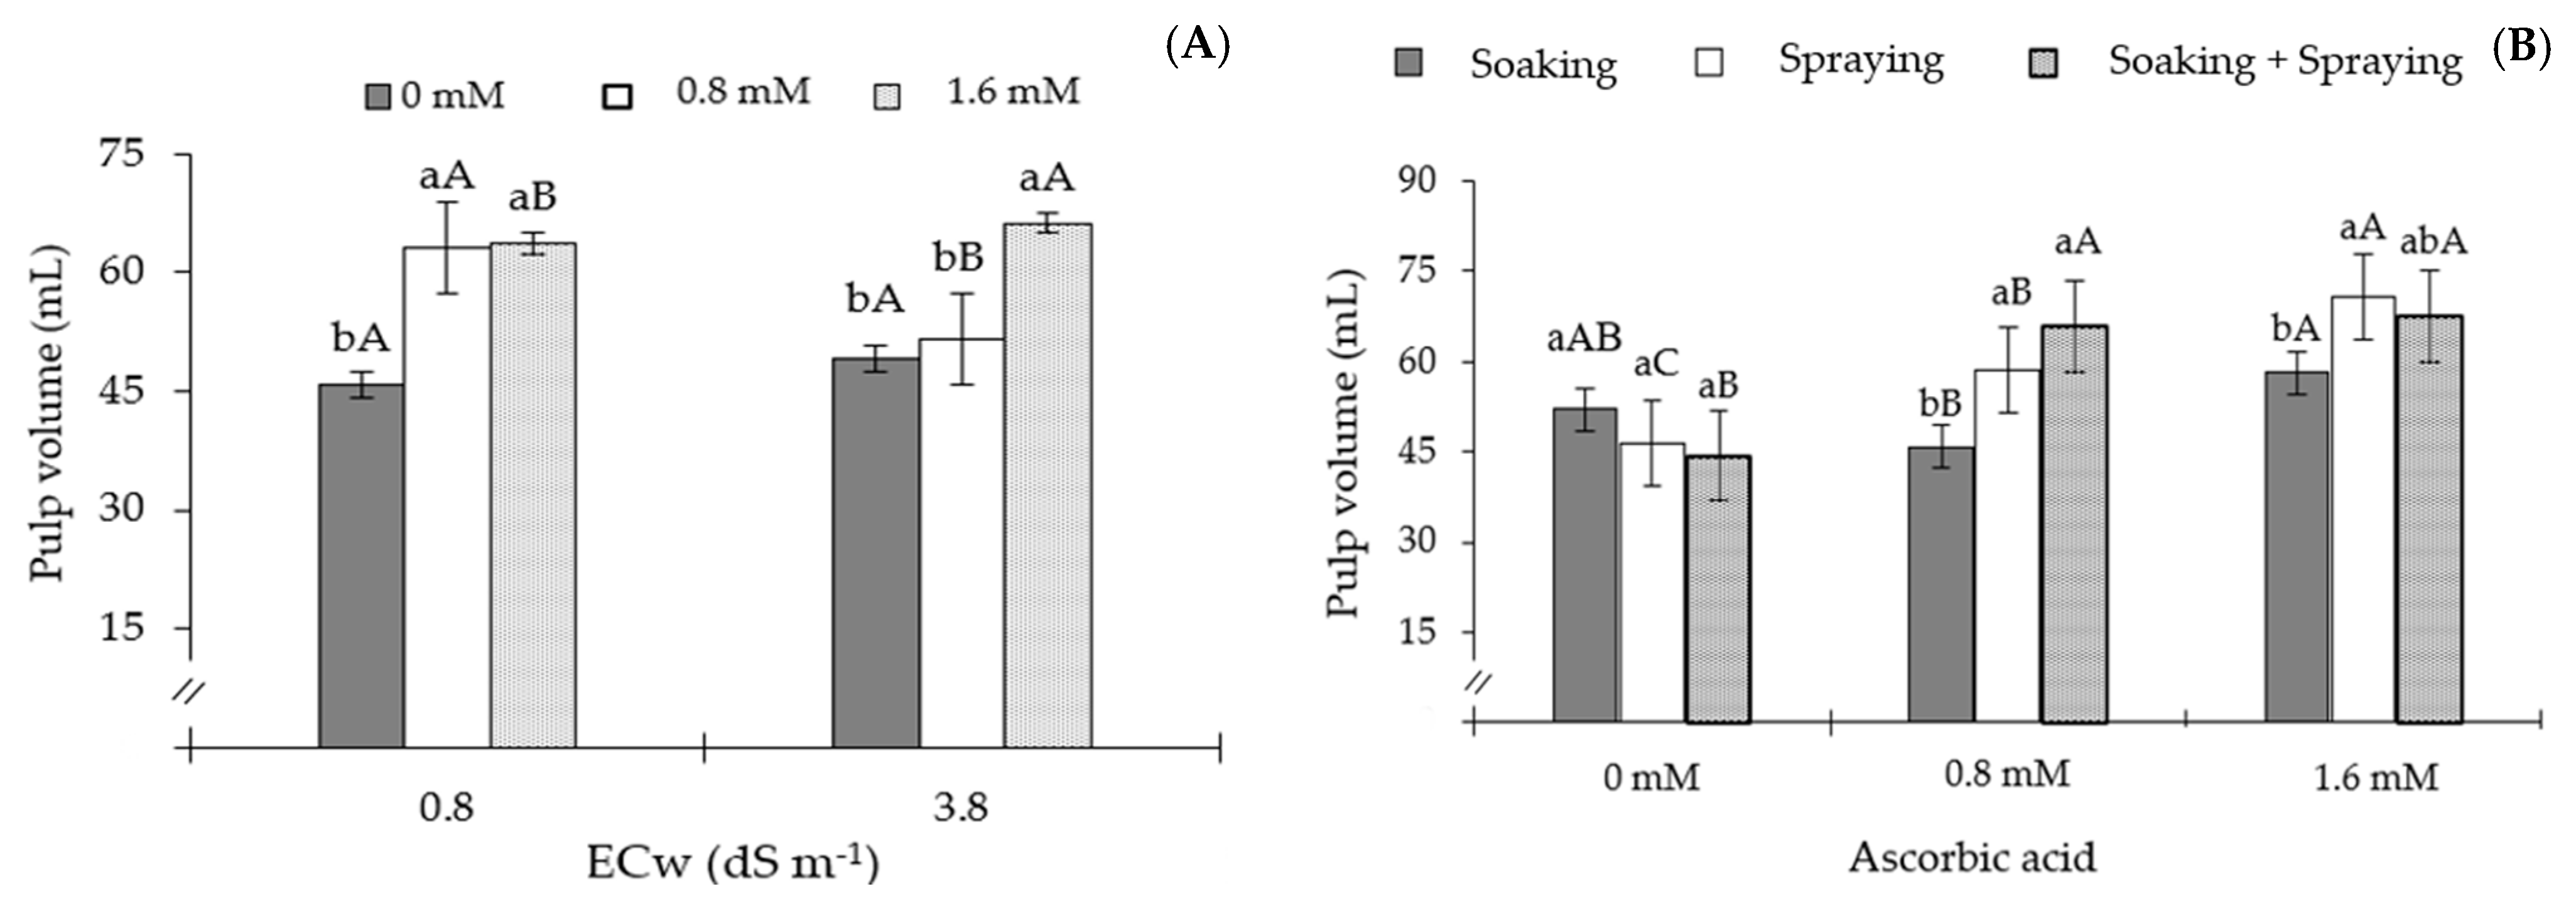
2. Results
3. Discussion
4. Materials and Methods
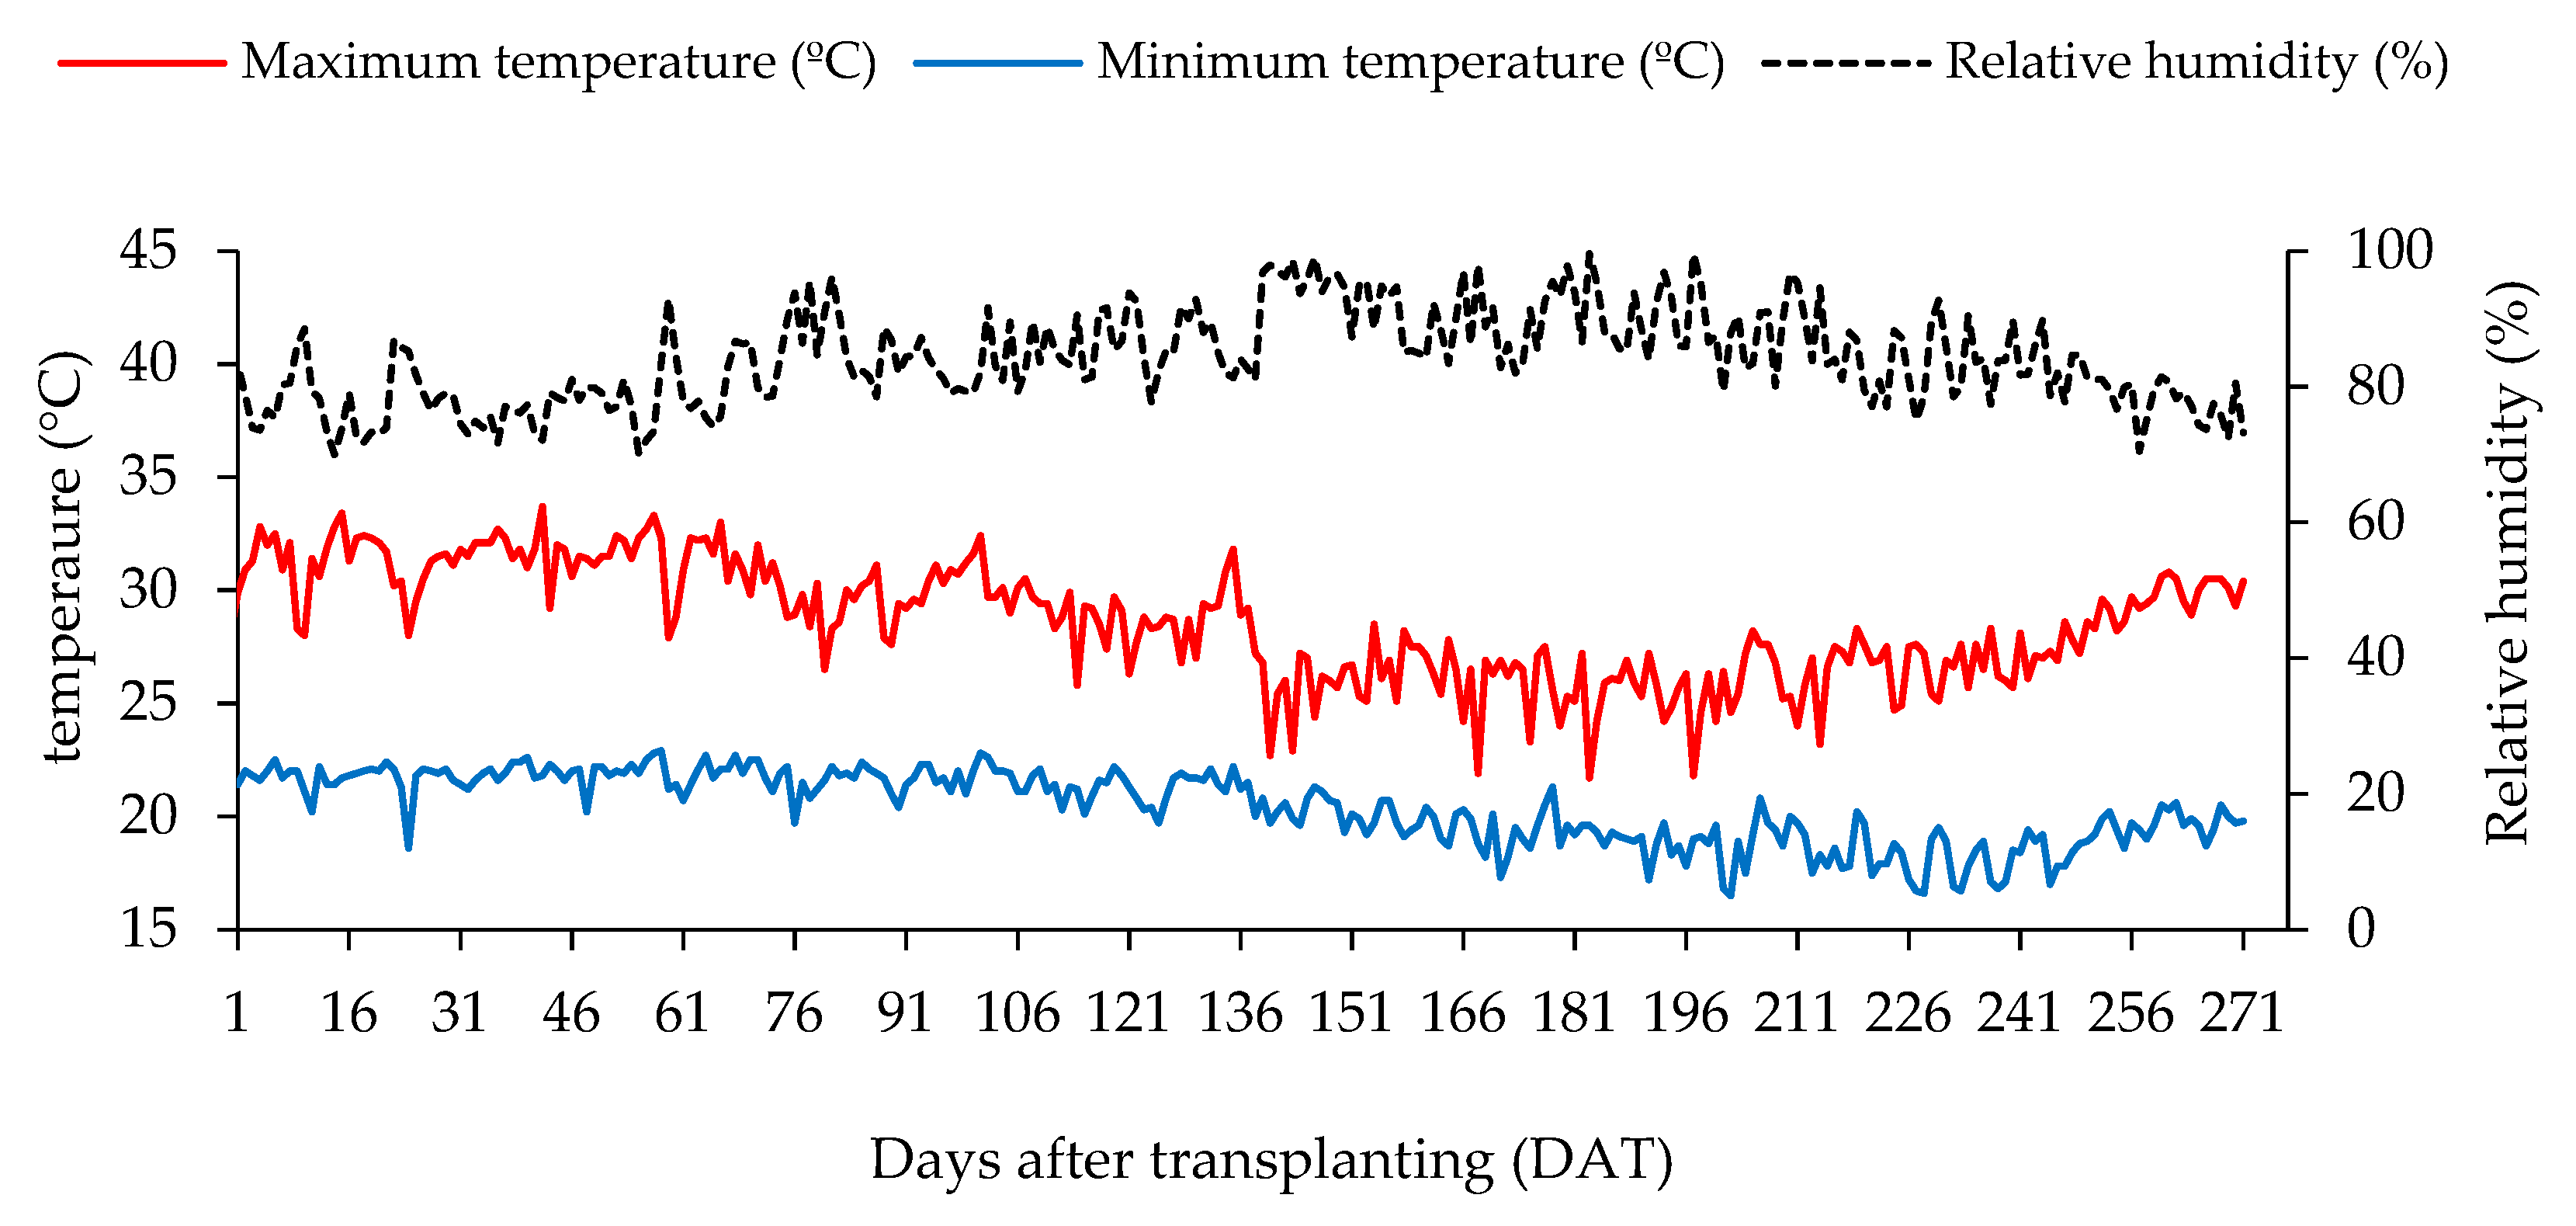
4.1. Experimental Site
4.2. Experimental Design and Treatments
4.3. Plant Material and Seedling Formation
4.4. Experiment Setup and Conduction
4.5. Preparation of Waters and Irrigation Management
4.6. Preparation and Application of Ascorbic Acid Solutions
4.7. Formative Pruning Management
4.8. Fertilization Management
4.9. Variables Analyzed
4.9.1. Physiological Variables
Gas Exchange
Chlorophyll a Fluorescence
Photosynthetic Pigments
4.9.2. Growth Variable
4.9.3. Production Variable
4.10. Statistical Analysis
5. Conclusions
Author Contributions
Funding
Data Availability Statement
Conflicts of Interest
References
- IBGE—Instituto Brasileiro de Geografia e Estatística. Produção Agrícola Municipal. 2022. Available online: https://www.ibge.gov.br/estatisticas/economicas/agricultura-e-pecuaria/9117-producao-agricola-municipal-culturas-temporarias-e-permanentes.html (accessed on 12 July 2023).
- Aguiar, A.V.M.; Cavalcante, L.F.; Silva, R.M.; Dantas, T.A.G.; Santos, E.C. Effect of biofertilization on yellow passion fruit production and fruit quality. Rev. Caatinga 2017, 30, 136–148. [Google Scholar] [CrossRef]
- Behdad, A.; Mohsenzadeh, S.; Azizi, M. Growth, leaf gas exchange and physiological parameters of two Glycyrrhiza glabra L. populations subjected to salt stress condition. Rhizosphere 2021, 17, e100319. [Google Scholar] [CrossRef]
- Pereira, K.T.O.; Torres, S.B.; Paiva, E.P.d.; Sousa, G.D.d.; Sousa Leite, M.d.; Albuquerque, C.C.d.; Sá, F.V.d.S. Priming cycles with salinity tolerance elicitors in seeds of Mimosa caesalpiniifolia and Pityrocarpa moniliformis. Biologia 2024, 79, 411–424. [Google Scholar] [CrossRef]
- Liang, W.; Ma, X.; Wan, P.; Liu, L. Plant salt-tolerance mechanism: A review. Biochem. Biophys. Res. Commun. 2018, 495, 286–291. [Google Scholar] [CrossRef] [PubMed]
- Nájar, R.; Aydi, S.; Sassi-Aydi, S.; Zarai, A.; Abdelly, C. Effect of salt stress on photosynthesis and chlorophyll fluorescence in Medicago truncatula. Plant Biosyst. 2019, 153, 88–97. [Google Scholar] [CrossRef]
- Lima, G.S.d.; Souza, W.B.d.; Paiva, F.J.d.S.; Soares, L.A.d.A.; Torres, R.A.; Silva, S.T.d.A.; Gheyi, H.R.; Lopes, K.P. Tolerance of sour passion fruit cultivars to salt stress in a semi-arid region. Rev. Bras. Eng. Agríc. Ambient. 2023, 27, 785–794. [Google Scholar] [CrossRef]
- Galvão Sobrinho, T.; Silva, A.A.R.d.; Lima, G.S.d.; Lima, V.L.A.d.; Borges, V.E.; Nunes, K.G.; Soares, L.A.d.A.; Saboya, L.M.F.; Gheyi, H.R.; Gomes, J.P.; et al. Foliar applications of salicylic acid on boosting salt stress tolerance in sour passion fruit in two cropping cycles. Plants 2023, 12, e2023. [Google Scholar] [CrossRef]
- Andrade, E.M.G.; Lima, G.S.d.; Lima, V.L.A.d.; Silva, S.S.d.; Gheyi, H.R.; Araújo, A.C.; Gomes, J.P.; Soares, L.A.D.A. Production and postharvest quality of yellow passion fruit cultivated with saline water and hydrogen peroxide. AIMS Agric. Food 2019, 4, 907–920. [Google Scholar] [CrossRef]
- Naz, H.; Akram, N.A.; Ashraf, M. Impact of ascorbic acid on growth and some physiological attributes of cucumber (Cucumis sativus) plants under water-deficit conditions. Pak. J. Bot. 2016, 3, 877–883. [Google Scholar]
- Hameed, A.; Gulzar, S.; Aziz, I.; Hussain, T.; Gul, B.; Khan, M.A. Effects of salinity and ascorbic acid on growth, water status and antioxidant system in a perennial halophyte. AoB Plants 2015, 7, plv004. [Google Scholar] [CrossRef]
- Wang, Y.H.; Zhang, G.; Chen, Y.; Gao, J.; Sun, Y.R.; Sun, M.F.; Chen, J.P. Exogenous application of gibberellic acid and ascorbic acid improved tolerance of okra seedlings to NaCl stress. Acta Physiol. Plant. 2019, 41, 93. [Google Scholar] [CrossRef]
- Leal, Y.H.; Sousa, L.V.d.; Gomes, M.J.; Sousa, B.A.G.; Melo Filho, J.S.; Silva, M.G.T.; Carlos, A.; Dias, T.J. Agronomic performance and gaseous exchanges of the radish under saline stress and ascorbic acid application. Rev. Colomb. Cienc. Hortíc. 2019, 13, 89–98. [Google Scholar] [CrossRef]
- Nunes, L.R.d.L.; Pinheiro, P.R.; Cabral, F.A.S.; Silva, J.B.d.; Dutra, A.S. Ascorbic acid of cowpea seeds under saline stress. J. Seed Sci. 2019, 41, 441–451. [Google Scholar] [CrossRef]
- Noreen, S.; Sultan, M.; Akhter, M.S.; Shah, K.H.; Ummara, U.; Manzoor, H.; Ahmad, P.A. Foliar fertigation of ascorbic acid and zinc improves growth, antioxidant enzyme activity and harvest index in barley (Hordeum vulgare L.) grown under salt stress. Plant Physiol. Biochem. 2021, 158, 244–254. [Google Scholar] [CrossRef]
- Fatah, E.M.A.; Sadek, K.A. Impact of different application methods and concentrations of ascorbic acid on sugar beet under salinity stress conditions. J. Agric. Sci. 2020, 65, 31–44. [Google Scholar] [CrossRef]
- Kaiser, H.F. The application of electronic computers to factor analysis. Educ. Psychol. Meas. 1960, 20, 141–151. [Google Scholar] [CrossRef]
- Nachtigall, G.R.; Nava, G. Adubação foliar: Fatos e mitos. Rev. Agropec. Catarinense 2010, 23, 87–97. [Google Scholar]
- Alves, R.d.C.; Oliveira, K.R.; Lúcio, J.C.B.; Silva, J.d.S.; Carrega, W.C.; Queiroz, S.F.; Gratão, P.L. Exogenous foliar ascorbic acid applications enhance salt-stress tolerance in peanut plants throughout an increase in the activity of major antioxidant enzymes. S. Afr. J. Bot. 2022, 150, 759–767. [Google Scholar] [CrossRef]
- Azeem, M.; Sultana, R.; Mahmood, A.; Qasim, M.; Siddiqui, Z.S.; Mumtaz, S.; Javed, T.; Umar, M.; Adnan, M.Y.; Siddiqui, M.H. Ascorbic and salicylic acids vitalized growth, biochemical responses, antioxidant enzymes, photosynthetic efficiency and ionic regulation for alleviate salinity stress in Sorghum bicolor. J. Plant Growth Regul. 2023, 2, 5266–5279. [Google Scholar] [CrossRef]
- Saeidi-Sar, S.; Abbaspour, H.; Afshari, H.; Yaghoobi, S.R. Effects of ascorbic acid and gibberellin A3 on alleviation of salt stress in common bean (Phaseolus vulgaris L.) seedlings. Acta Physiol. Plant 2013, 35, 667–677. [Google Scholar] [CrossRef]
- El-Sayed, O.M.; El-Gammal, O.H.M.; Salama, A.S.M. Effect of ascorbic acid, proline and jasmonic acid foliar spraying on fruit set and yield of Manzanillo olive trees under salt stress. Sci. Hortic. 2014, 176, 32–37. [Google Scholar] [CrossRef]
- Sullivan, C.Y. Mechanisms of heat and drought resistance in grain sorghum and methods of measurement. In Sorghum in Seventies; Rao, N.G.P., House, L.R., Eds.; Oxford & IBH Publishing Co.: New Delhi, India, 1972; 247p. [Google Scholar]
- Akram, N.A.; Iqbal, M.; Muhammad, A.; Ashraf, M.; Al-Qurainy, F.; Shafiq, S. Aminolevulinic acid and nitric oxide regulate oxidative defense and secondary metabolisms in canola (Brassica napus L.) under drought stress. Protoplasma 2018, 255, 163–174. [Google Scholar] [CrossRef] [PubMed]
- Soni, S.; Sharawat, N.; Kumar, A.; Kumar, N.; Lata, C.; Mann, A. Effect of saline irrigation on plant water traits, photosynthesis and ionic balance in durum wheat genotypes. Saudi J. Biol. Sci. 2021, 28, 2510–2517. [Google Scholar] [CrossRef]
- Farouk, S.; Elhindi, K.M.; Alotaibi, M.A. Silicon supplementation mitigates salinity stress on Ocimum basilicum L. via improving water balance, ion homeostasis, and antioxidant defense system. Ecotoxicol. Environ. Saf. 2020, 206, e111396. [Google Scholar] [CrossRef]
- Chrysargyris, A.; Xylia, P.; Nicolas, S.; Tzortzakis, N. Physiochemical properties of petunia edible flowers grown under saline conditions and their postharvest performance under modified atmosphere packaging and ethanol application. J. Sci. Food Agric. 2019, 99, 3644–3652. [Google Scholar] [CrossRef] [PubMed]
- Sá, F.V.S.; Brito, M.E.B.; Silva, L.A.; Moreira, R.C.L.; Fernandes, P.D.; Figueiredo, L.C. Physiology of perception of saline stress in ‘Common Sunki’ mandarin hybrids under saline hydroponic solution. Comun. Sci. 2015, 6, 463–470. [Google Scholar] [CrossRef]
- Dias, A.S.; Lima, G.S.d.; Gheyi, H.R.; Furtado, G.d.F.; Soares, L.A.d.A.; Nobre, R.G.; Fernandes, P.D. Chloroplast pigments and photochemical efficiency of West Indian cherry under salt stress and potassium-phosphorus fertilization. Semin. Ciênc. Agrár. 2021, 42, 87–104. [Google Scholar] [CrossRef]
- Silva, A.A.R.d.; Lima, G.S.d.; Azevedo, C.A.V.d.; Gheyi, H.R.; Soares, L.A.d.A.; Veloso, L.L.d.S.A. Salicylic acid improves physiological indicators of soursop irrigated with saline water. Rev. Bras. Eng. Agríc. Ambient. 2022, 26, 412–419. [Google Scholar] [CrossRef]
- Lacerda, C.N.d.; Soares, G.S.d.; Soares, L.A.d.A.; Fatima, R.T.d.; Gheyi, H.R.; Azevedo, C.A.V.d. Morphophysiology and production of guava as a function of water salinity and salicylic acid. Rev. Bras. Eng. Agríc. Ambient. 2022, 26, 451–458. [Google Scholar] [CrossRef]
- Silva, A.F.; Sousa, V.F.D.O.; Santos, G.L.d.; Júnior, E.S.A.; Silva, S.L.d.; Macedo, C.E.d.; Maia, J.M. Antioxidant protection of photosynthesis in two cashew progenies under salt stress. J. Agric. Sci. 2018, 10, 388–404. [Google Scholar] [CrossRef]
- Lima, G.S.d.; Pinheiro, F.W.A.; Gheyi, H.R.; Soares, L.A.d.A.; Soares, M.D.M.; Silva, F.A.; Azevedo, C.A.V.d.; Lima, V.L.A. Postharvest quality of sour passion fruit under irrigation strategies with brackish water and potassium application in two crop cycles. Wat. Air Soil Poll. 2022, 233, e452. [Google Scholar] [CrossRef]
- Andrade, E.M.G.; Lima, G.S.d.; Lima, V.L.A.d.; Silva, S.S.d.; Gheyi, H.R.; Silva, A.A.R.d. Gas exchanges and growth of passion fruit under saline water irrigation and H2O2 application. Rev. Bras. Eng. Agríc. Ambient. 2019, 23, 945–951. [Google Scholar] [CrossRef]
- Souza, W.B.B.d.; Lima, G.S.d.; Paiva, F.J.d.S.; Soares, L.A.d.A.; Fatima, R.T.d.; Silva, A.A.R.d.; Gheyi, H.R.; Fernandes, P.D. Potassium fertilization as salt stress attenuator in sour passion fruit. Ciênc. Rural. 2023, 53, e20210769. [Google Scholar] [CrossRef]
- Kang, S.M.; Shaffique, S.; Injamum-Ul-Hoque, M.; Alomrani, S.O.; Park, Y.S.; Lee, I.J. Foliar treatment with melatonin modulates photosynthetic and antioxidant responses in Silybum marianum L. under salt stress. Sci. Hortic. 2024, 325, e112664. [Google Scholar] [CrossRef]
- Lotfi, R.; Ghassemi-Golezani, K.; Pessarakli, M. Salicylic acid regulates photosynthetic electron transfer and stomatal conductance of mung bean (Vigna radiata L.) under salinity stress. Biocatal. Agric. Biotechnol. 2020, 26, e101635. [Google Scholar] [CrossRef]
- Abbas, R.; Rasul, S.; Aslam, K.; Baber, M.; Shahid, M.; Mubeen, F.; Naqqash, T. Halotolerant PGPR: A hope for cultivation of saline soils. J. King Saud Univ. Sci. 2019, 31, 1195–1201. [Google Scholar] [CrossRef]
- Saddiq, M.S.; Iqbal, S.; Hafeez, M.B.; Ibrahim, A.M.; Raza, A.; Fatima, E.M.; Ciarmiello, L.F. Effect of salinity stress on physiological changes in winter and spring wheat. Agronomy 2021, 11, e1193. [Google Scholar] [CrossRef]
- Yang, D.Y.; Ma, N.N.; Zhuang, K.Y.; Zhu, S.B.; Liu, Z.M.; Yang, X.H. Overexpression of tomato SlGGP-LIKE gene improves tobacco tolerance to methyl viologen-mediated oxidative stress. J. Plant Physiol. 2017, 209, 31–41. [Google Scholar] [CrossRef]
- Li, H.; Yan, S.; Zhao, L.; Tan, J.; Zhang, Q.; Gao, F.; Wang, P.; Hou, H.; Li, L. Histone acetylation associated up-regulation of the cell wall related genes is involved in salt stress induced maize root swelling. BMC Plant Biol. 2014, 14, 127–139. [Google Scholar] [CrossRef]
- Byrt, C.S.; Munns, R.; Burtonc, R.A.; Gillihama, M.; Wegea, S. Root cell wall solutions for crop plants in saline soils. Plant Sci. 2018, 269, 47–55. [Google Scholar] [CrossRef]
- Silva, E.B.D.; Viana, T.V.D.A.; Sousa, G.G.D.; Sousa, J.; Santos, M.F.D.; Azevedo, B.M.D. Growth and nutrition of peanut crop subjected to saline stress and organomineral fertilization. Rev. Bras. Eng. Agríc. Ambient. 2022, 26, 495–501. [Google Scholar] [CrossRef]
- Abreu, F.D.S.; Viana, T.V.D.A.; Sousa, G.G.D.; Baldé, B.; Lacerda, C.F.D.; Goes, G.F.; Cambissa, P.B. Salt stress and potassium fertilization on the agronomic performance of peanut crop. Rev. Caatinga 2024, 37, e11996. [Google Scholar] [CrossRef]
- Lima, L.K.d.S.; Jesus, O.N.d.; Soares, T.L.; Santos, I.S.d.; Oliveira, E.J.d.; Coelho Filho, M.A. Growth, physiological, anatomical and nutritional responses of two phenotypically distinct passion fruit species (Passiflora L.) and their hybrid under saline conditions. Sci. Hortic. 2020, 263, e109037. [Google Scholar] [CrossRef]
- Skider, R.K.; Wang, X.; Zhang, H.; Gui, H.; Dong, Q.; Jin, D.; Song, M. Nitrogen enhances salt tolerance by modulating the antioxidant defense system and osmoregulation substance content in Gossypium hirsutum. Plants 2020, 9, e450. [Google Scholar] [CrossRef] [PubMed]
- Ramos, J.G.; Lima, V.L.A.d.; Lima, G.S.d.; Nunes, K.G.; Pereira, M.O.; Paiva, F.J.S. Produção e qualidade pós-colheita do maracujazeiro-azedo irrigado com águas salinas e aplicação exógena de H2O2. Irriga 2022, 27, 540–556. [Google Scholar] [CrossRef]
- Siddiqui, M.H.; Alamri, S.; Al-Khaishany, M.Y.; Khan, M.N.; Al-Amri, A.; Ali, H.M.; Alaraidh, I.A.; Alsahli, A.A. Exogenous melatonin counteracts NaCl-induced damage by regulating the antioxidant system, proline and carbohydrate metabolism in tomato seedlings. Int. J. Mol. Sci. 2019, 20, e353. [Google Scholar] [CrossRef]
- EMBRAPA. BRS Sol do Cerrado: Híbrido de Maracujazeiro azedo para mesa e indústria, 2nd ed.; Brasília, D.F., Ed.; Embrapa Cerrado: Planaltina, Brazil, 2008; 2p. [Google Scholar] [CrossRef]
- Santos, O.F.; Broetto, F.; Oliveira, D.P.F.; Galvão, Í.M.; Souza, M.L.C.; Basílio, J.J.N. Ácido ascórbico, uma alternativa para minimizar os efeitos da deficiência hídrica em rabanete. Irriga 2018, 1, 79–91. [Google Scholar] [CrossRef]
- Ayers, R.S.; Westcot, D.W. A Qualidade de Água na Agricultura, 2nd ed.; Estudos Irrigação e Drenagem, 29 revisado 1; UFPB, FAO: Campina Grande, Brazil, 1999; 153p. [Google Scholar]
- Teixeira, P.C.; Donagemma, G.K.; Fontana, A.; Teixeira, W.G. Manual de Métodos de Análise de Solo, 3rd ed.; Embrapa: Brasília, Brazil, 2017; 573p. [Google Scholar]
- Medeiros, J.F.; Lisboa, R.A.; de Oliveira, M.; de Silva Júnior, M.J.; Alves, L.P. Caracterização das águas subterrâneas usadas para irrigação na área produtora de melão da Chapada do Apodi. Rev. Bras. Eng. Agríc. Ambient. 2003, 7, 469–472. [Google Scholar] [CrossRef]
- Cavalcante, F.J.A. Recomendação de Adubação para o Estado de Pernambuco: 2. Aproximação, 3rd ed.; Recife, P.E., Ed.; Instituto Agronômico de Pernambuco: Recife, Brazil, 2008; 212p. [Google Scholar]
- Weatherley, P.E. Studies in the water relations of the cotton plant. I-The field measurements of water deficits in leaves. New Phytol. 1950, 49, 81–97. [Google Scholar] [CrossRef]
- Scotti-Campos, P.; Pham-Thi, A.T.; Semedo, J.N.; Pais, I.P.; Ramalho, J.C.; Matos, M.C. Physiological responses and membrane integrity in three Vigna genotypes with contrasting drought tolerance. Emir. J. Food Agric. 2013, 5, 1002–1013. [Google Scholar] [CrossRef]
- Arnon, D.I. Copper enzymes in isolated chloroplasts: Polyphenoloxidase in Beta vulgaris. Plant Physiol. 1949, 24, 1–15. [Google Scholar] [CrossRef] [PubMed]
- Costa, A.d.F.S.d.; Costa, A.N.d.; Ventura, J.A.; Fanton, C.J.; Lima, I.d.M.; Caetano, L.C.S.; Santana, E.N.d. Recomendações Técnicas para o Cultivo do Maracujazeiro; Incaper: Vitória, Brazil, 2008; 55p. [Google Scholar]
- Pinheiro, F.W.; Lima, G.S.d.; Sousa, P.F.d.N.; Souza, W.B.d.; Soares, L.A.d.A.; Gheyi, H.R.; Felix, C.M.; Paiva, F.J.d.S. Potassium fertilization in the cultivation of sour passion fruit under irrigation strategies with brackish water. Rev. Bras. Eng. Agríc. Ambient. 2023, 27, 42–50. [Google Scholar] [CrossRef]
- Govaerts, B.; Sayre, K.D.; Lichter, K.; Dendoover, L.; Decker, J. Influence of permanent raised bed planting and residue management on physical and chemical soil quality in rainfed maize/wheat systems. Plant Soil 2007, 291, 39–54. [Google Scholar] [CrossRef]
- Hotelling, H. Multivariate quality control. In Techniques of Statistical Analysis; Eisenhart, C., Hastay, M.W., Wallis, W.A., Eds.; John Wiley & Sons: New York, NY, USA, 1947; 73p. [Google Scholar]
- Hair, F.J.; Black, C.W.; Badin, B.J.; Anderson, R.E.; Tathan, R.L. Análise Multivariada de Dados, 6th ed.; Sant’Anna, A.S., Translator; Bookman: Porto Alegre, Brazil, 2009; 688p. [Google Scholar]
- Ferreira, D.F. Sisvar: A computer analysis system to fixed effects split plot type designs. Rev. Bras. Biom. 2019, 37, 529–535. [Google Scholar] [CrossRef]


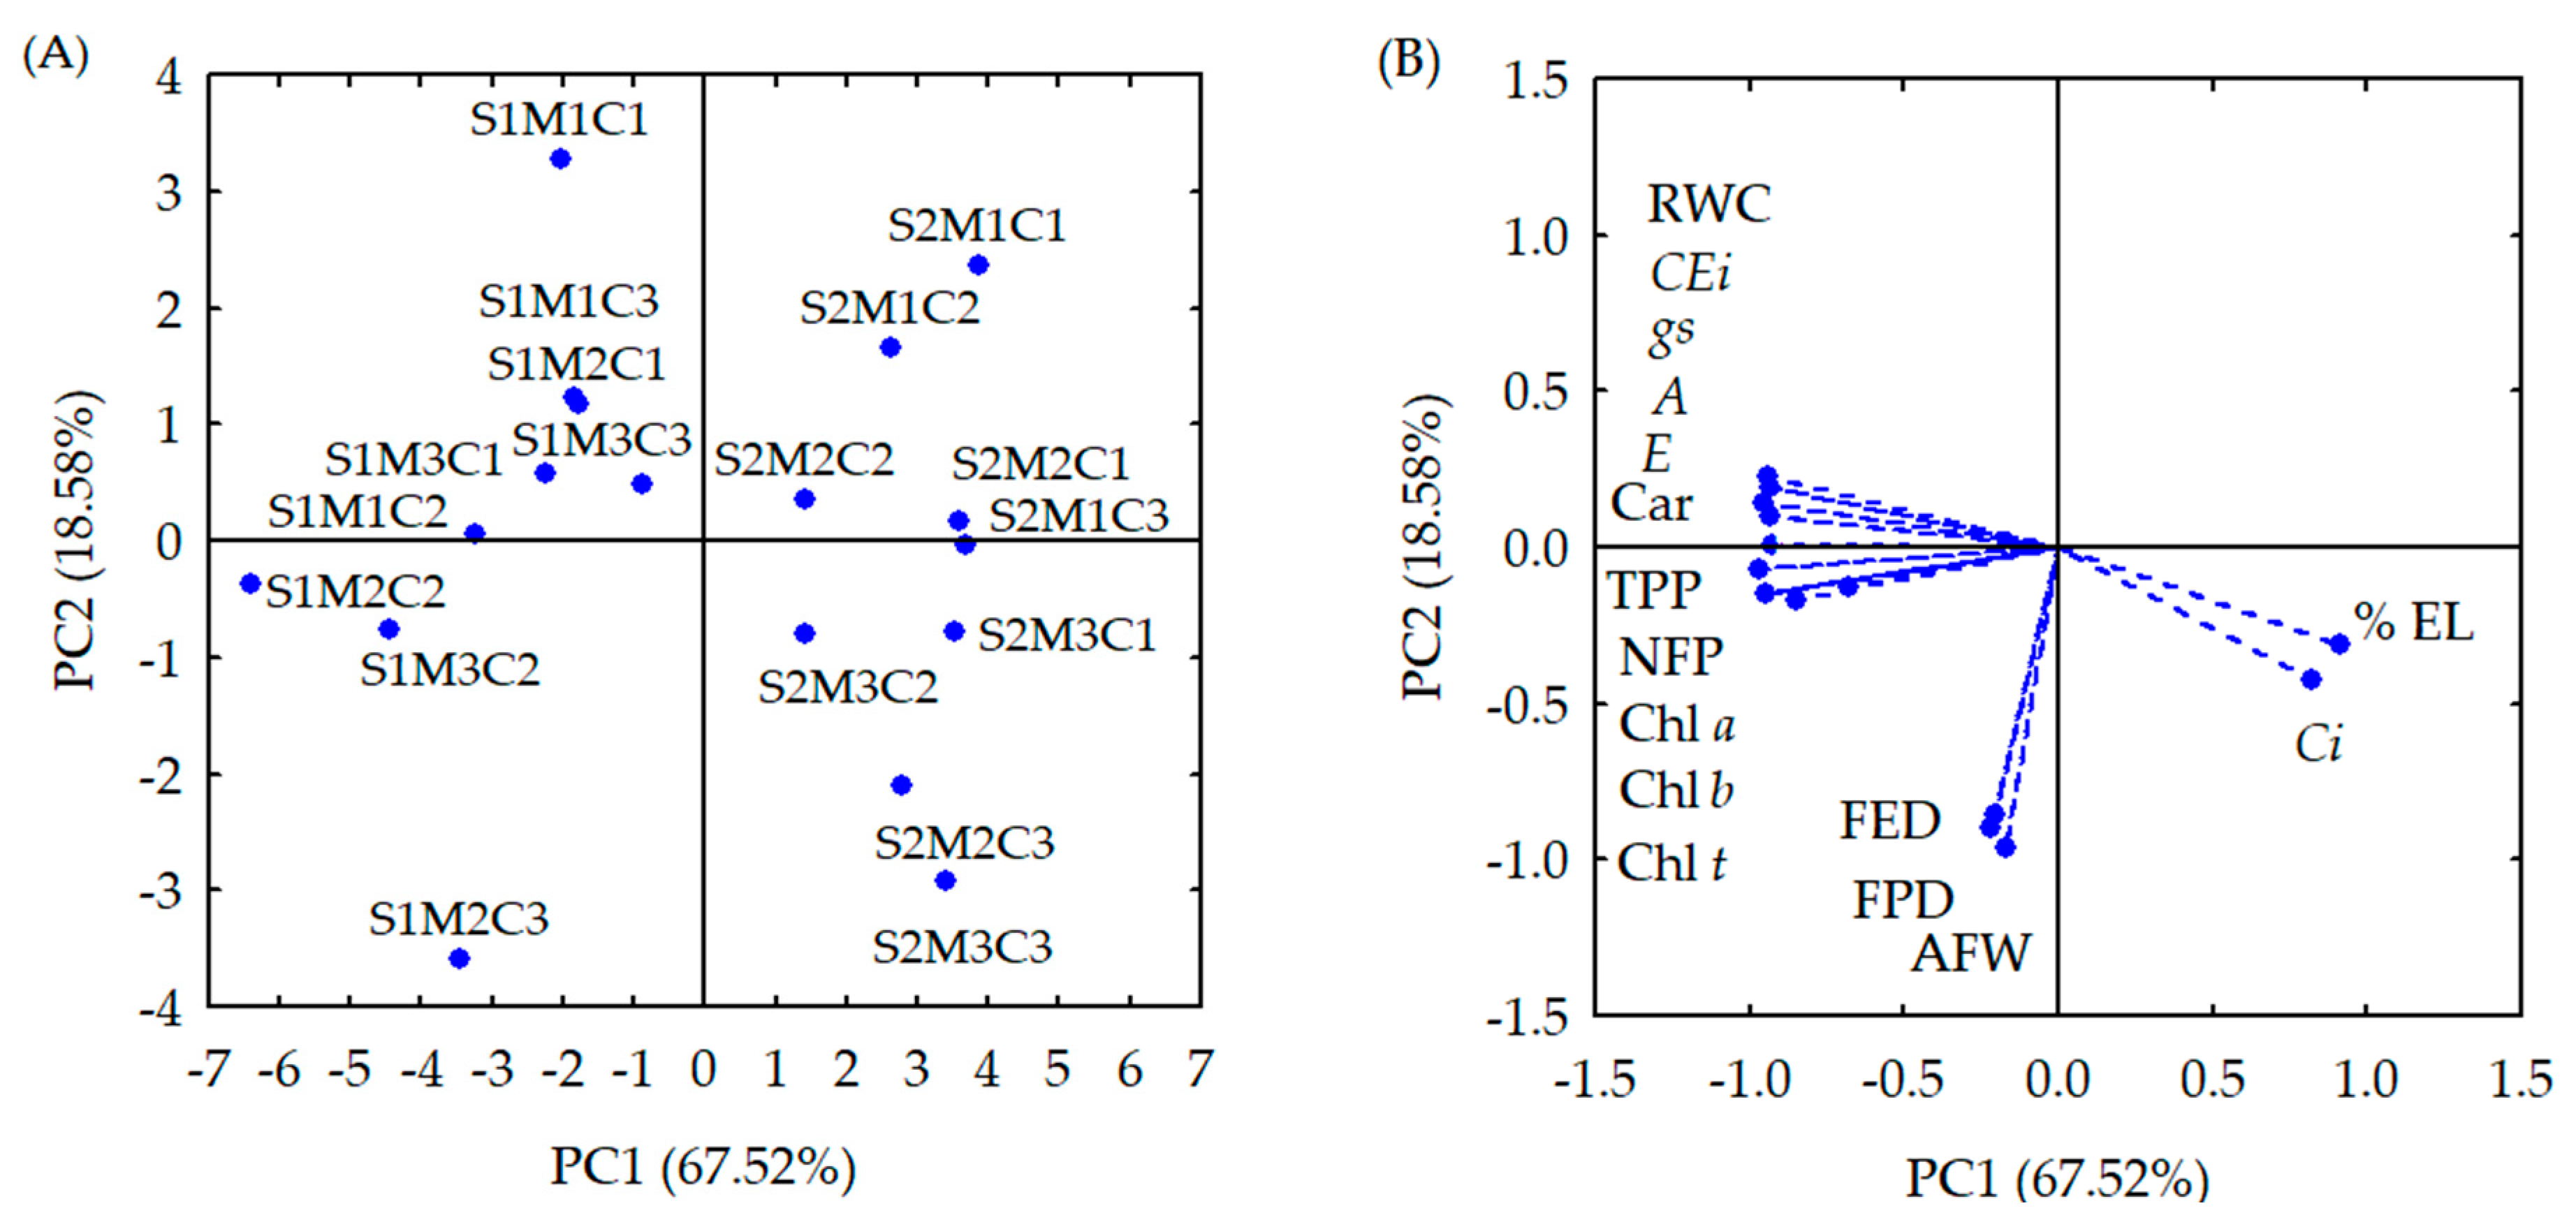
| Principal Components (PCs) | ||
|---|---|---|
| PC1 | PC2 | |
| Eigenvalues (λ) | 10.80 | 2.97 |
| Percentage of total variance (S2%) | 67.52 | 18.58 |
| Hotelling test (T2) for interaction (ECw × M) | 0.01 | 0.01 |
| Hotelling test (T2) for interaction (ECw × C) | 0.01 | 0.01 |
| Hotelling test (T2) for interaction (M × C) | 0.01 | 0.01 |
| Hotelling test (T2) for interaction (ECw × M × C) | 0.03 | 0.05 |
| PCs | Correlation Coefficients (r) | |||||||
|---|---|---|---|---|---|---|---|---|
| RWC | EL | Chl a | Chl b | Chl t | Car | Ci | A | |
| PC1 | −0.929 * | 0.909 * | −0.939 * | −0.937 * | −0.938 * | −0.966 * | 0.819 * | −0.947 * |
| PC2 | 0.187 | −0.308 | −0.146 | −0.147 | −0.149 | −0.068 | 0.417 | 0.139 |
| PCs | Correlation Coefficients (r) | |||||||
| E | gs | CEi | FPD | FED | AFW | NFP | TPP | |
| PC1 | −0.928 * | −0.929 * | −0.937 * | 0.219 | −0.209 | −0.169 | −0.809 * | −0.849 * |
| PC2 | 0.098 | 0.078 | 0.219 | −0.898 * | −0.859 * | −0.958 * | −0.119 | −0.169 |
| Treatments | Variables | |||||||
|---|---|---|---|---|---|---|---|---|
| RWC | EL | Chl a | Chl b | Chl t | Car | Ci | A | |
| S1M1C1 | 86.48 ± 0.5 a | 36.11 ± 1.8 a | 341.11 ± 11.8 a | 204.67 ± 11.8 a | 545.77 ± 9.8 a | 78.80 ± 1.8 a | 160 ± 1.8 a | 5.12 ± 0.9 a |
| S1M2C1 | 86.31 ± 0.9 a | 37.15 ± 1.5 a | 326.82 ± 13.2 a | 196.09 ± 5.8 a | 522.92 ± 8.7 a | 75.50 ± 1.6 a | 164 ± 2.9 a | 5.29 ± 1.3 a |
| S1M3C1 | 83.45 ± 1.1 a | 35.94 ± 1.8 a | 349.25 ± 12.5 a | 209.55 ± 9.2 a | 558.80 ± 6.8 a | 80.68 ± 2.4 a | 173 ± 3.1 a | 5.32 ± 1.1 a |
| S1M1C2 | 79.66 ± 1.1 a | 35.15 ± 1.6 a | 402.66 ± 22.6 a | 241.60 ± 12.8 a | 644.26 ± 7.9 a | 84.56 ± 3.1 a | 144 ± 4.2 a | 5.21 ± 0.9 a |
| S1M2C2 | 89.51 ± 2.2 a | 33.01 ± 2.1 a | 503.33 ± 30.1 a | 302.00 ± 14.8 a | 805.32 ± 9.8 a | 105.70 ± 2.8 a | 137 ± 4.9 a | 6.18 ± 1.2 a |
| S1M3C2 | 83.89 ± 1.4 a | 35.54 ± 1.2 a | 427.83 ± 26.3 a | 256.70 ± 19.5 a | 684.53 ± 7.8 a | 89.84 ± 3.9 a | 146 ± 3.8 a | 5.87 ± 1.1 a |
| S1M1C3 | 83.50 ± 1.4 a | 40.05 ± 5.1 a | 342.26 ± 22.1 a | 205.36 ± 22.8 a | 547.62 ± 9.2 a | 71.88 ± 4.1 a | 156 ± 7.1 a | 5.35 ± 0.8 a |
| S1M2C3 | 83.28 ± 0.9 a | 41.36 ± 4.3 a | 427.83 ± 14.4 a | 256.70 ± 29.9 a | 684.53 ± 8.6 a | 89.84 ± 5.7 a | 191 ± 6.4 a | 5.01 ± 1.5 a |
| S1M3C3 | 82.69 ± 0.8 a | 41.72 ± 4.3 a | 363.65 ± 13.7 a | 218.19 ± 14.7 a | 581.85 ± 6.5 a | 76.37 ± 3.2 a | 196 ± 5.7 a | 4.66 ± 0.8 a |
| S2M1C1 | 67.58 ± 2.6 a | 48.82 ± 6.8 a | 238.78 ± 14.7 a | 143.27 ± 19.7 a | 382.04 ± 6.5 a | 50.14 ± 4.5 a | 198 ± 4.9 a | 3.18 ± 1.2 a |
| S2M2C1 | 70.77 ± 1.3 a | 50.90 ± 4.2 a | 228.78 ± 21.0 a | 137.27 ± 14.4 a | 366.04 ± 7.1 a | 48.04 ± 3.8 a | 210 ± 4.3 a | 3.68 ± 1.3 a |
| S2M3C1 | 68.43 ± 1.1 a | 51.11 ± 3.2 a | 244.47 ± 19.7 a | 146.68 ± 10.2 a | 391.16 ± 8.6 a | 51.34 ± 4.2 a | 227 ± 3.5 a | 3.60 ± 1.2 a |
| S2M1C2 | 69.54 ± 1.7 a | 51.43 ± 1.8 a | 281.86 ± 13.7 a | 169.12 ± 21.9 a | 450.98 ± 8.7 a | 59.19 ± 3.1 a | 228 ± 9.8 a | 4.29 ± 0.9 a |
| S2M2C2 | 73.40 ± 1.2 a | 52.55 ± 1.7 a | 352.33 ± 14.4 a | 211.40 ± 24.5 a | 563.73 ± 7.6 a | 73.99 ± 8.6 a | 233 ± 9.7 a | 3.69 ± 0.8 a |
| S2M3C2 | 69.81 ± 2.2 a | 52.98 ± 1.5 a | 299.48 ± 16.8 a | 179.69 ± 19.6 a | 479.17 ± 4.9 a | 62.89 ± 9.1 a | 257 ± 8.7 a | 4.43 ± 0.7 a |
| S2M1C3 | 68.47 ± 2.7 a | 53.36 ± 1.7 a | 239.58 ± 17.9 a | 143.75 ± 14.5 a | 383.33 ± 3.9 a | 50.31 ± 2.4 a | 259 ± 6.5 a | 3.55 ± 0.7 a |
| S2M2C3 | 68.29 ± 2.1 a | 55.67 ± 1.6 a | 299.48 ± 18.5 a | 179.69 ± 17.9 a | 479.17 ± 7.8 a | 62.89 ± 3.9 a | 283 ± 5.4 a | 3.41 ± 0.9 a |
| S2M3C3 | 67.81 ± 1.8 a | 58.56 ± 2.1 a | 254.56 ± 16.8 a | 152.73 ± 17.1 a | 407.29 ± 9.8 a | 53.46 ± 8.1 a | 288 ± 6.1 a | 3.21 ± 0.5 a |
| Treatments | Variables | |||||||
| E | gs | CEi | FPD | FED | AFW | NFP | TPP | |
| S1M1C1 | 0.96 ± 0.3 a | 0.057 ± 0.02 a | 0.032 ± 0.01 a | 63.97 ± 1.7 a | 41.31 ± 2.4 a | 67.25 ± 3.1 a | 11.33 ± 0.7 a | 1500.0 ± 32.2 a |
| S1M2C1 | 0.99 ± 0.2 a | 0.047 ± 0.06 a | 0.032 ± 0.01 a | 68.50 ± 1.8 a | 54.69 ± 3.4 a | 89.50 ± 3.4 a | 10.33 ±0.9 a | 1274.3 ± 54.1 a |
| S1M3C1 | 0.96 ± 0.3 a | 0.053 ± 0.04 a | 0.031 ± 0.02 a | 67.96 ± 1.5 a | 56.82 ± 2.3 a | 102.17 ± 3.4 a | 12.00 ± 1.2 a | 1396.7 ± 38.9 a |
| S1M1C2 | 1.02 ± 0.2 a | 0.070 ± 0.02 a | 0.036 ± 0.03 a | 72.53 ± 1.1 a | 58.58 ± 2.2 a | 102.33 ± 2.9 a | 8.67 ± 0.9 a | 1272.2 ± 41.4 a |
| S1M2C2 | 1.27 ± 0.1 a | 0.077 ± 0.01 a | 0.045 ± 0.02 a | 75.90 ± 1.1 a | 52.36 ± 3.1 a | 120.13 ± 5.1 a | 15.00 ± 1.1a | 2011.3 ± 81.9 a |
| S1M3C2 | 1.13 ± 0.1 a | 0.067 ± 0.02 a | 0.040 ± 0.01 a | 74.74 ± 1.4 a | 62.26 ± 4.9 a | 118.33 ± 3.4a | 9.67 ± 0.5 a | 1418.3 ± 56.4 a |
| S1M1C3 | 0.93 ± 0.3 a | 0.050 ± 0.02 a | 0.034 ± 0.02 a | 67.57 ± 2.3 a | 55.97 ± 3.7 a | 84.17 ± 2.8 a | 11.67 ± 0.3 a | 1284.0 ± 46.1 a |
| S1M2C3 | 0.88 ± 0.4 a | 0.047 ± 0.03 a | 0.026 ± 0.01 a | 78.95 ± 1.2 a | 69.95 ± 2.7 a | 159.50 ± 3.2 a | 8.33 ± 0.4 a | 1409.0 ± 57.9 a |
| S1M3C3 | 0.89 ± 0.3 a | 0.043 ± 0.02 a | 0.024 ± 0.01 a | 72.24 ± 1.8 a | 43.23 ± 3.7 a | 102.00 ± 4.1a | 7.00 ± 0.8 a | 1218.0 ± 68.7 a |
| S2M1C1 | 0.67 ± 0.5 a | 0.020 ± 0.02 a | 0.016 ± 0.02 a | 63.12 ± 2.1 a | 34.64 ± 4.8 a | 67.44 ± 2.7 a | 5.67 ± 0.2 a | 567.7 ± 29.8 a |
| S2M2C1 | 0.72 ± 0.3 a | 0.023 ± 0.03 a | 0.018 ± 0.01 a | 72.18 ± 1.9 a | 49.77 ± 3.4 a | 105.00 ± 3.1 a | 4.00 ± 0.4 a | 475.3 ± 29.5 a |
| S2M3C1 | 0.72 ± 0.4 a | 0.021 ± 0.02 a | 0.016 ± 0.01 a | 72.32 ± 1.6 a | 59.15 ± 2.2 a | 114.00 ± 2.9a | 4.67 ± 0.6 a | 442.3 ± 31.8 a |
| S2M1C2 | 0.77 ± 0.2 a | 0.037 ± 0.02 a | 0.019 ± 0.02 a | 68.07 ± 2.1 a | 39.18 ± 3.1 a | 76.50 ± 4.2 a | 4.00 ± 0.7 a | 456.0 ± 41.2 a |
| S2M2C2 | 0.95 ± 0.8 a | 0.032 ± 0.01 a | 0.016 ± 0.01 a | 67.95 ± 1.8 a | 45.55 ± 2.4 a | 104.50 ± 3.7 a | 4.00 ± 0.8 a | 477.3 ± 35.6 a |
| S2M3C2 | 0.85 ± 0.6 a | 0.037 ± 0.02 a | 0.017 ± 0.02 a | 69.30 ± 2.2 a | 58.05 ± 1.8 a | 110.00 ± 2.8 a | 11.00 ± 1.2 a | 1085.3 ± 58.9 a |
| S2M1C3 | 0.70 ± 0.2 a | 0.027 ± 0.01 a | 0.014 ± 0.01 a | 68.06 ± 3.4 a | 50.36 ± 3.2 a | 109.00 ± 3.1 a | 6.00 ± 0.9 a | 824.0 ± 54.6 a |
| S2M2C3 | 0.72 ± 0.1 a | 0.040 ± 0.02 a | 0.012 ± 0.01 a | 76.05 ± 2.1 a | 60.07 ± 1.4 a | 119.00 ± 2.4 a | 4.00 ± 1.1 a | 745.0 ± 41.6 a |
| S2M3C3 | 0.71 ± 0.3 a | 0.035 ± 0.03 a | 0.011 ± 0.01 a | 77.49 ± 2.1 a | 64.70 ± 1.9 a | 133.88 ± 5.8 a | 8.00 ± 1.4 a | 845.7 ± 31.4 a |
| Source of Variation | DF | Mean Squares | |||||
|---|---|---|---|---|---|---|---|
| RWC | EL | Chl a | Chl b | Chl t | Car | ||
| Application methods (M) | 2 | 1.99 ns | 34.67 ns | 26,737.19 ns | 31,952.81 ** | 90,892.32 ns | 791.90 ns |
| Ascorbic acid (AsA) | 2 | 0.75 ns | 12.72 ns | 5039.03 ** | 54,984.37 ** | 77,516.81 ns | 423.37 ns |
| Electrical conductivity (ECw) | 1 | 7.05 ns | 2904.00 ** | 65,022.94 ** | 2331.82 ns | 42,727.78 ** | 245.37 ** |
| Interaction (M × AsA × ECw) | 4 | 3.29 ns | 31.69 ns | 15,780.78 ns | 18,571.82 ns | 31,527.80 ns | 538.27 ns |
| Interaction (M × AsA) | 4 | 13.61 ns | 27.64 ns | 13,309.78 ns | 21,702.56 ns | 19,106.71 ns | 2565.72 ns |
| Interaction (M × ECw) | 2 | 35.77 ns | 20.22 ns | 5038.72 ns | 1607.52 ns | 2205.72 ns | 452.72 ns |
| Interaction (AsA × ECw) | 2 | 339.09 ** | 15.05 ns | 87,585.05 ns | 1268.05 ns | 29,568.05 ns | 421.05 ns |
| Blocks | 2 | 26.70 ns | 44.05 ns | 481.17 ns | 217.35 ns | 284.74 ns | 38.27 ns |
| Residual | 34 | 15.11 | 51.25 | 856.39 | 1432.39 | 2910.96 | 27.65 |
| CV (%) | 4.68 | 15.75 | 12.67 | 18.32 | 12.33 | 10.51 | |
| Source of Variation | DF | Mean Squares | ||||
|---|---|---|---|---|---|---|
| Ci | A | E | gs | CEi | ||
| Application methods (M) | 2 | 2521.13 ns | 1.0 ns | 0.16 ns | 0.0003 ns | 0.0002 ns |
| Ascorbic acid (AsA) | 2 | 17,420.35 ** | 2.76 ns | 0.05 ns | 0.01 ** | 0.0002 ns |
| Electrical conductivity (ECw) | 1 | 34,858.96 ** | 49.06** | 1.29 ** | 0.007 ** | 0.004 ** |
| Interaction (M × AsA × ECw) | 4 | 3486.60 ns | 0.37 ns | 0.01 ns | 0.0001 ns | 0.0002 ns |
| Interaction (M × AsA) | 4 | 1453.51 ns | 3.41 ns | 0.11 ns | 0.0001 ns | 0.0002 ns |
| Interaction (M × ECw) | 2 | 3141.51 ns | 1.01 ns | 0.04 ns | 0.0002 ns | 0.0002 ns |
| Interaction (AsA × ECw) | 2 | 3486.51 ns | 3.66 ns | 0.01 ns | 0.0002 ns | 0.0002 ns |
| Blocks | 2 | 41.51 ns | 2.33 ns | 0.01 ns | 0.00007 ns | 0.0001 ns |
| Residual | 34 | 471.34 | 1.89 | 0.02 | 0.0001 | 0.00001 |
| CV (%) | 10.72 | 21.31 | 18.86 | 17.25 | 19.47 | |
| Source of Variation | DF | Mean Squares | ||||
|---|---|---|---|---|---|---|
| F0 | Fv | Fv/Fm | Fm | SD | ||
| Application methods (M) | 2 | 238.9 ns | 6414.7 ns | 0.000088 ns | 6191.90 ns | 0.348 ns |
| Ascorbic acid (AsA) | 2 | 1629 ns | 24,939 ns | 0.000089 ns | 75,752.7 ** | 4.870 ** |
| Electrical conductivity (ECw) | 1 | 9414 ** | 42,056 * | 0.001645 * | 158,437 ** | 30.31 ** |
| Interaction (M × AsA × ECw) | 4 | 1027 ns | 43,150 ns | 0.000664 ns | 2238.27 ns | 0.905 ns |
| Interaction (M × AsA) | 4 | 514.4 ns | 2198.4 ns | 0.00019 ns | 19,700.7 ** | 1.308 ns |
| Interaction (M × ECw) | 2 | 1094 ns | 3404.7 ns | 0.000252 ns | 8583.72 ns | 1.054 ns |
| Interaction (AsA × ECw) | 2 | 2086 ns | 3230.2 ns | 0.0000006 ns | 11,268.05 ns | 1.499 * |
| Blocks | 2 | 225.6 | 11,128 | 0.00083 | 2238.27 | 0.082 |
| Residual | 34 | 601.7 | 6975.09 | 0.00040 | 3343.65 | 0.375 |
| CV (%) | 5.10 | 5.70 | 2.58 | 3.05 | 4.02 | |
| Source of Variation | DF | Mean Squares | |||||
|---|---|---|---|---|---|---|---|
| FPD | FED | AFW | NFP | TPP | PV | ||
| Application methods (M) | 2 | 190.39 ** | 583.18 ** | 5576.99 ** | 6.01 ns | 40,933.38 ns | 288.06 ** |
| Ascorbic acid (AsA) | 2 | 133.62 ** | 289.99 ns | 3292.81 ** | 4.57 ns | 207,195.71 ns | 1362 ** |
| Electrical conductivity (ECw) | 1 | 10.17 ns | 189.01 ns | 6.11 ns | 303.41 ** | 7,855,116.07 ** | 46.29 ns |
| Interaction (M × AsA × ECw) | 4 | 17.93 ns | 369.24 ns | 722.61 ns | 35.91 ns | 225,935.91 ns | 71.49 ns |
| Interaction (M × AsA) | 4 | 89.57 ns | 167.07 ns | 871.78 ns | 17.79 ns | 59,213.39 ns | 382.37 ** |
| Interaction (M × ECw) | 2 | 27.66 ns | 284.65 ns | 482.68 ns | 18.37 ns | 238,400.23 ns | 323.97 ns |
| Interaction (AsA × ECw) | 2 | 12.07 ns | 98.75 ns | 939.10 ns | 18.21 ns | 150,123.95 ns | 314.75 ** |
| Blocks | 2 | 23.28 ns | 86.47 ns | 28.55 ns | 0.90 ns | 18,694.25 ns | 188.56 |
| Residual | 34 | 28.07 | 120.27 | 225.01 | 15.69 | 126,741.20 | 54.242 |
| CV (%) | 7.47 | 10.63 | 14.33 | 19.06 | 14.26 | 12.77 | |
| ECw | Ascorbic Acid Application Methods (M) | Concentration | ||
|---|---|---|---|---|
| M1 (Soaking) | M2 (Spraying) | M3 (Soaking + Spraying) | ||
| S1 (0.8 dS m−1) | S1M1C1 | S1M2C1 | S1M3C1 | C1—0 mM |
| S1M1C2 | S1M2C2 | S1M3C2 | C2—0.8 mM | |
| S1M1C3 | S1M2C3 | S1M3C3 | C3—1.6 mM | |
| S2 (3.8 dS m−1) | S2M1C1 | S2M2C1 | S2M3C1 | C1—0 mM |
| S2M1C2 | S2M2C2 | S2M3C2 | C2—0.8 mM | |
| S2M1C3 | S2M2C3 | S2M3C3 | C3—1.6 mM | |
Disclaimer/Publisher’s Note: The statements, opinions and data contained in all publications are solely those of the individual author(s) and contributor(s) and not of MDPI and/or the editor(s). MDPI and/or the editor(s) disclaim responsibility for any injury to people or property resulting from any ideas, methods, instructions or products referred to in the content. |
© 2024 by the authors. Licensee MDPI, Basel, Switzerland. This article is an open access article distributed under the terms and conditions of the Creative Commons Attribution (CC BY) license (https://creativecommons.org/licenses/by/4.0/).
Share and Cite
Caetano, E.J.M.; Silva, A.A.R.d.; Lima, G.S.d.; Azevedo, C.A.V.d.; Veloso, L.L.d.S.A.; Arruda, T.F.d.L.; Souza, A.R.d.; Soares, L.A.d.A.; Gheyi, H.R.; Dias, M.d.S.; et al. Application Techniques and Concentrations of Ascorbic Acid to Reduce Saline Stress in Passion Fruit. Plants 2024, 13, 2718. https://doi.org/10.3390/plants13192718
Caetano EJM, Silva AARd, Lima GSd, Azevedo CAVd, Veloso LLdSA, Arruda TFdL, Souza ARd, Soares LAdA, Gheyi HR, Dias MdS, et al. Application Techniques and Concentrations of Ascorbic Acid to Reduce Saline Stress in Passion Fruit. Plants. 2024; 13(19):2718. https://doi.org/10.3390/plants13192718
Chicago/Turabian StyleCaetano, Edmilson Júnio Medeiros, André Alisson Rodrigues da Silva, Geovani Soares de Lima, Carlos Alberto Vieira de Azevedo, Luana Lucas de Sá Almeida Veloso, Thiago Filipe de Lima Arruda, Allesson Ramos de Souza, Lauriane Almeida dos Anjos Soares, Hans Raj Gheyi, Mirandy dos Santos Dias, and et al. 2024. "Application Techniques and Concentrations of Ascorbic Acid to Reduce Saline Stress in Passion Fruit" Plants 13, no. 19: 2718. https://doi.org/10.3390/plants13192718