Article

Genome-Wide Identification of Osmanthus fragrans Histone Modification Genes and Analysis of Their Expression during the Flowering Process and under Azacytidine and Ethylene Treatments

1
National Forestry and Grassland Administration Engineering Research Center for Osmanthus Fragrans, Hubei University of Science and Technology, Xianning 437100, China
2
Osmanthus Innovation Center of National Engineering Research Center for Floriculture, Hubei University of Science and Technology, Xianning 437100, China
3
Hubei Key Laboratory of Agricultural Bioinformatics, College of Informatics, Huazhong Agricultural University, Wuhan 430070, China
4
Research Center for Osmanthus Fragrans, Xianning Research Academy of Industrial Technology of Osmanthus Fragrans, Xianning 437100, China
*
Authors to whom correspondence should be addressed.
These authors contributed equally to this work.
Plants 2024, 13(6), 777; https://doi.org/10.3390/plants13060777
Submission received: 11 February 2024 / Revised: 3 March 2024 / Accepted: 6 March 2024 / Published: 9 March 2024
(This article belongs to the Section Plant Genetics, Genomics and Biotechnology)

Abstract

:
Histone acetylation and methylation, governed by various histone modification (HM) gene families, are vital for plant biological processes. However, there are limited studies that have explored HMs in ornamental horticultural trees, including sweet osmanthus (Osmanthus fragrans). We performed genome-wide search and identified 208 OfHMs, encompassing 81 histone methyltransferases (OfHMTs), 51 histone demethylases (OfHDMs), 49 histone acetyltransferases (OfHATs) and 27 histone deacetylases (HDACs). Our comprehensive analysis covered chromosome locations, gene structures, conserved domains, cis-acting elements, phylogenetic comparisons, protein interaction networks and functional enrichment pathways for these gene families. Additionally, tandem and fragment replications were unveiled as contributors to the expansion of OfHMs, with some genes exhibiting positive selection. Furthermore, we examined OfHM expression profiles across various tissues and flowering stages, and under 5′-azacytidine (Aza) and ethylene treatments. Most OfHMs displayed heightened expression in leaves, and were downregulated during the flower opening and senescence stages, including OfPRMTs, OfHDTs, OfHDAs, OfSRTs, OfJMJs and OfHAGs; 75.86% and 80.77% of the differentially expressed OfHMs were upregulated after Aza and ethylene treatments, including OfHAGs, OfHDAs and OfSDGs. This study offers a comprehensive analysis of the OfHM gene family, which indicated their potential involvement in ethylene and Aza responses, and in the flowering process. These findings provide valuable insights into the role of OfHMs in flowering and stress responses.

Graphical Abstract

1. Introduction

Histone modifications (HMs) are essential for modulating gene expression through modifying chromatin structure and stability, thereby influencing diverse biological processes in plants [1,2,3]. These processes include not only biological growth and development, but also the response to stress. The primary types of HMs encompass histone acetylation, methylation, phosphorylation, ubiquitination, SUMOylation and ADP-ribosylation [4]. Among these types, histone acetylation and methylation have been extensively studied [5,6] and are recognized as two pivotal and widespread epigenetic regulatory mechanisms that significantly impact gene expression.
Histone acetylation, under the control of histone acetyltransferases (HATs) and histone deacetylases (HDACs), involves the modification of lysine residues in histone proteins through the addition or removal of acetyl groups [7,8]. HAT-induced acetylation promotes the opening of local chromatin, facilitating the binding of transcription factors and increasing gene expression, while HDAC-associated acetylation is often associated with gene repression [9,10,11]. Histone methylation, catalyzed by histone demethylases (HDMs) and histone methyltransferases (HMTs), involves the addition or removal of methyl groups from the histone tails [7]. Combinatorial binding modules in histone recognizers recognize this modification, ultimately influencing chromatin structure and gene expression [4]. The impact of histone methylation on the initiation and inhibition of gene expression is primarily determined by the position of the methylation. For instance, trimethylation of lysine at position 4 on histone H3 (H3K4me3) is linked to the initiation of gene expression, while trimethylation of lysine at position 27 on histone H3 (H3K27me3) is correlated with repressed gene expression [12,13].
Histone acetylation and methylation modifications are predominantly governed by various members of the HM gene family, a group that has been discovered and characterized in several plant species, such as tomato (Solanum lycopersicum) [14], apple (Malus domestica) [8], litchi (Litchi chinensis) [15], sweet orange (Citrus sinensis) [16], rice (Oryza sativa) [17] and strawberry (Fragaria vesca) [18]. The HM gene family encompasses the HAT, HDAC, HMT and HDM gene families [7,8], each of which contains distinct subfamilies. Specifically, the HAT family includes four subfamilies. HAG includes histone acetylases with a GCN5-, ELP3- and HAT1-like domain, HAM involves the MOZ-YBF2 (MYST) domain, HAC features the HAT_KAT11 domain, and HAF is associated with the TATA-binding protein-related factor TAF [7,8]. The HDAC family consists of three subfamilies: HD2 (HDT), RPD3/HDA1 (HDA) and silent information regulator 2 (SRT) [19]. The HMT family comprises two subfamilies: the SET domain group (SDG) and protein arginine methyltransferases (PRMT), and the HDM family, which also includes two subfamilies, the SWIRM and C-terminal domain (HDMA) protein family and the JmjC domain protein family (JMJ) [7,8].
The functions of HM genes have been delineated, revealing their involvement in various plant processes [20,21]. These processes encompass growth and development, and stress responses, including photomorphogenesis [22], embryo development [23], seed germination and dormancy [2], flowering processes [8], fruit development [15,16,18], stress and defensive responses [3,16,17,18] and signaling responses to hormones [17]. In particular, HM genes play a pivotal role in crucial physiological processes associated with plant flowering, including flower induction, petal senescence and regulation of the flowering period. For instance, members of the HAT family, such as AtHAM1 and AtHAM2, influence flowering time through epigenetic modification of FLOWERING LOCUS C (FLC) and MADS AFFECTING FLOWERING 3/4 (MAF3/4) chromatin through H4K5 acetylation [24]. AtHAC1 promotes the Arabidopsis flowering process through epigenetic modifications to FLC upstream factors [25]. Within the HDAC family, AtHDA6 and AtHDA9 regulate the flowering locus D/VE (FLD/FVE), osmotically responsive gene 1 (HOS1), nuclear localized protein 22 of the AT hook motif (AHL22) and AGAMOUS-LIKE 9 (AGL9), thus influencing the flowering time of Arabidopsis [26,27]. The AtHDA19 complex directly regulates gibberellin (GA) signaling, impacting the expression of FLC and FLOWERING LOCUS T (FT) through a pathway that inhibits flowering [28]. In the HDM family, AtJMJ14, AtJMJ15 and AtJMJ18 regulate the flower opening time of Arabidopsis by modulating the trimethylation level of histone H3K4 [29,30,31]; BcJMJ30, a gene that encodes a histone demethylase with a jmjC domain, is involved in the development of pollen and fertilization of rape (Brassica campestris) [32]. The trithorax group gene (TrxG) AtSDG25 of the HMT family, which is involved in H3K4 and H3K36 methylation, delays flowering by activating FLC expression [33]. However, the roles of HMs in ornamental horticultural trees, including sweet osmanthus (Osmanthus fragrans), have received limited attention.
O. fragrans, a distinguished member of the Oleaceae family, stands as one of the most renowned and traditional flowers in China. Celebrated for its intense fragrance [34], it is widely embraced in horticulture and landscaping. Beyond its ornamental value, it has found mature applications in the realms of food, cosmetics and medicines [34,35,36]. However, despite its versatility, it faces the challenge of a brief flowering period, which typically only lasts 2 to 3 days, limiting its ornamental and economic value [37,38]. The role of HMs in regulating the flowering period in O. fragrans remains elusive. This study used bioinformatics to identify HM gene members in the O. fragrans genome, conducting analyses of the gene structure, chromosomal location, phylogenetic comparisons, conserved protein domains, protein–protein interaction networks and functional enrichment. Furthermore, transcriptome data were utilized to analyze gene expression profiles in different tissues (stems, leaves and roots), during the flower opening and senescence processes, and under various treatment agents. These findings provide valuable information on HM genes during the flower opening and senescence stages of O. fragrans, thereby contributing essential information for comprehending the intricacies of flowering and senescence processes and enriching biological theories. Moreover, considering the significant economic importance of O. fragrans, research on OfHM genes holds potential application value in improving its yield and quality. This study could contribute to expanding our comprehensive understanding of plant life activities and provide new theoretical and practical support for plant genetic breeding and biotechnology applications.

2. Results

2.1. Identification and Characterization Analysis of HMs in the O. fragrans Genome

A total of 208 OfHMs were identified in the O. fragrans genome, which were classified into 81 OfHMTs (consisting of 12 OfPRMTs and 69 OfSDGs), 51 OfHDMs (encompassing 17 OfHDMAs and 34 OfJMJs), 49 OfHATs (comprising 39 OfHAGs, 2 OfHAMs, 7 OfHACs and 1 OfHAF) and 27 OfHDACs (including 17 OfHDAs, 3 OfSRTs and 7 OfHDTs) (Table S1). The OfHMTs exhibited lengths ranging from 258 to 2419 amino acids (aa), with molecular weights (MWs) varying from 29.30 to 276.20 kDa, isoelectric points (pIs) within the range of 4.55 to 9.16, and aliphatic indices within the range of 62.62 to 99.85 (Table S1). Among them, 83.95% of the OfHMTs exhibited an instability index >40, which is indicative of a prevalence of unstable proteins in this gene family (Table S1). The OfHDMs had lengths ranging from 135 to 2136 aa, MWs from 14.79 to 233.73 kDa, pIs from 4.89 to 9.43, and aliphatic indices from 65.85 to 94.89, with 88.24% being classified as unstable proteins (Table S1). The OfHATs exhibited lengths ranging from 105 to 1869 aa, with MWs from 11.73 to 212.34 kDa, pIs from 4.46 to 10.41, and aliphatic indices >60% (Table S1). The majority (67.35%) of them were characterized as unstable proteins (Table S1). OfHDACs, with lengths of 98–659 aa, MWs of 11.47–73.41 kDa, pIs of 4.11–10.55, and aliphatic indices ≥48.32, included unstable proteins among the OfSRTs (71.43%), OfHDTs (71.43%), and OfHDAs (47.06%) (Table S1). It is noteworthy that, excluding OfPRMT11, the other OfHMs possessed a grand average of hydropathicity (GRAVY) < 0, signifying hydrophilic properties (Table S1). Furthermore, in addition to OfSDG27 and OfHDA10, the remaining OfHMs lacked protein transmembrane domains (Table S1).
Most OfHM proteins (63.94%) were predicted to be localized in the nucleus (Table S1), and 21.63% of the proteins were identified on the cell membrane, encompassing the endomembrane system, plasma membrane and organelle membrane (Table S1). Furthermore, 11.54% of these proteins were assumed to be located within the chloroplast (Table S1).

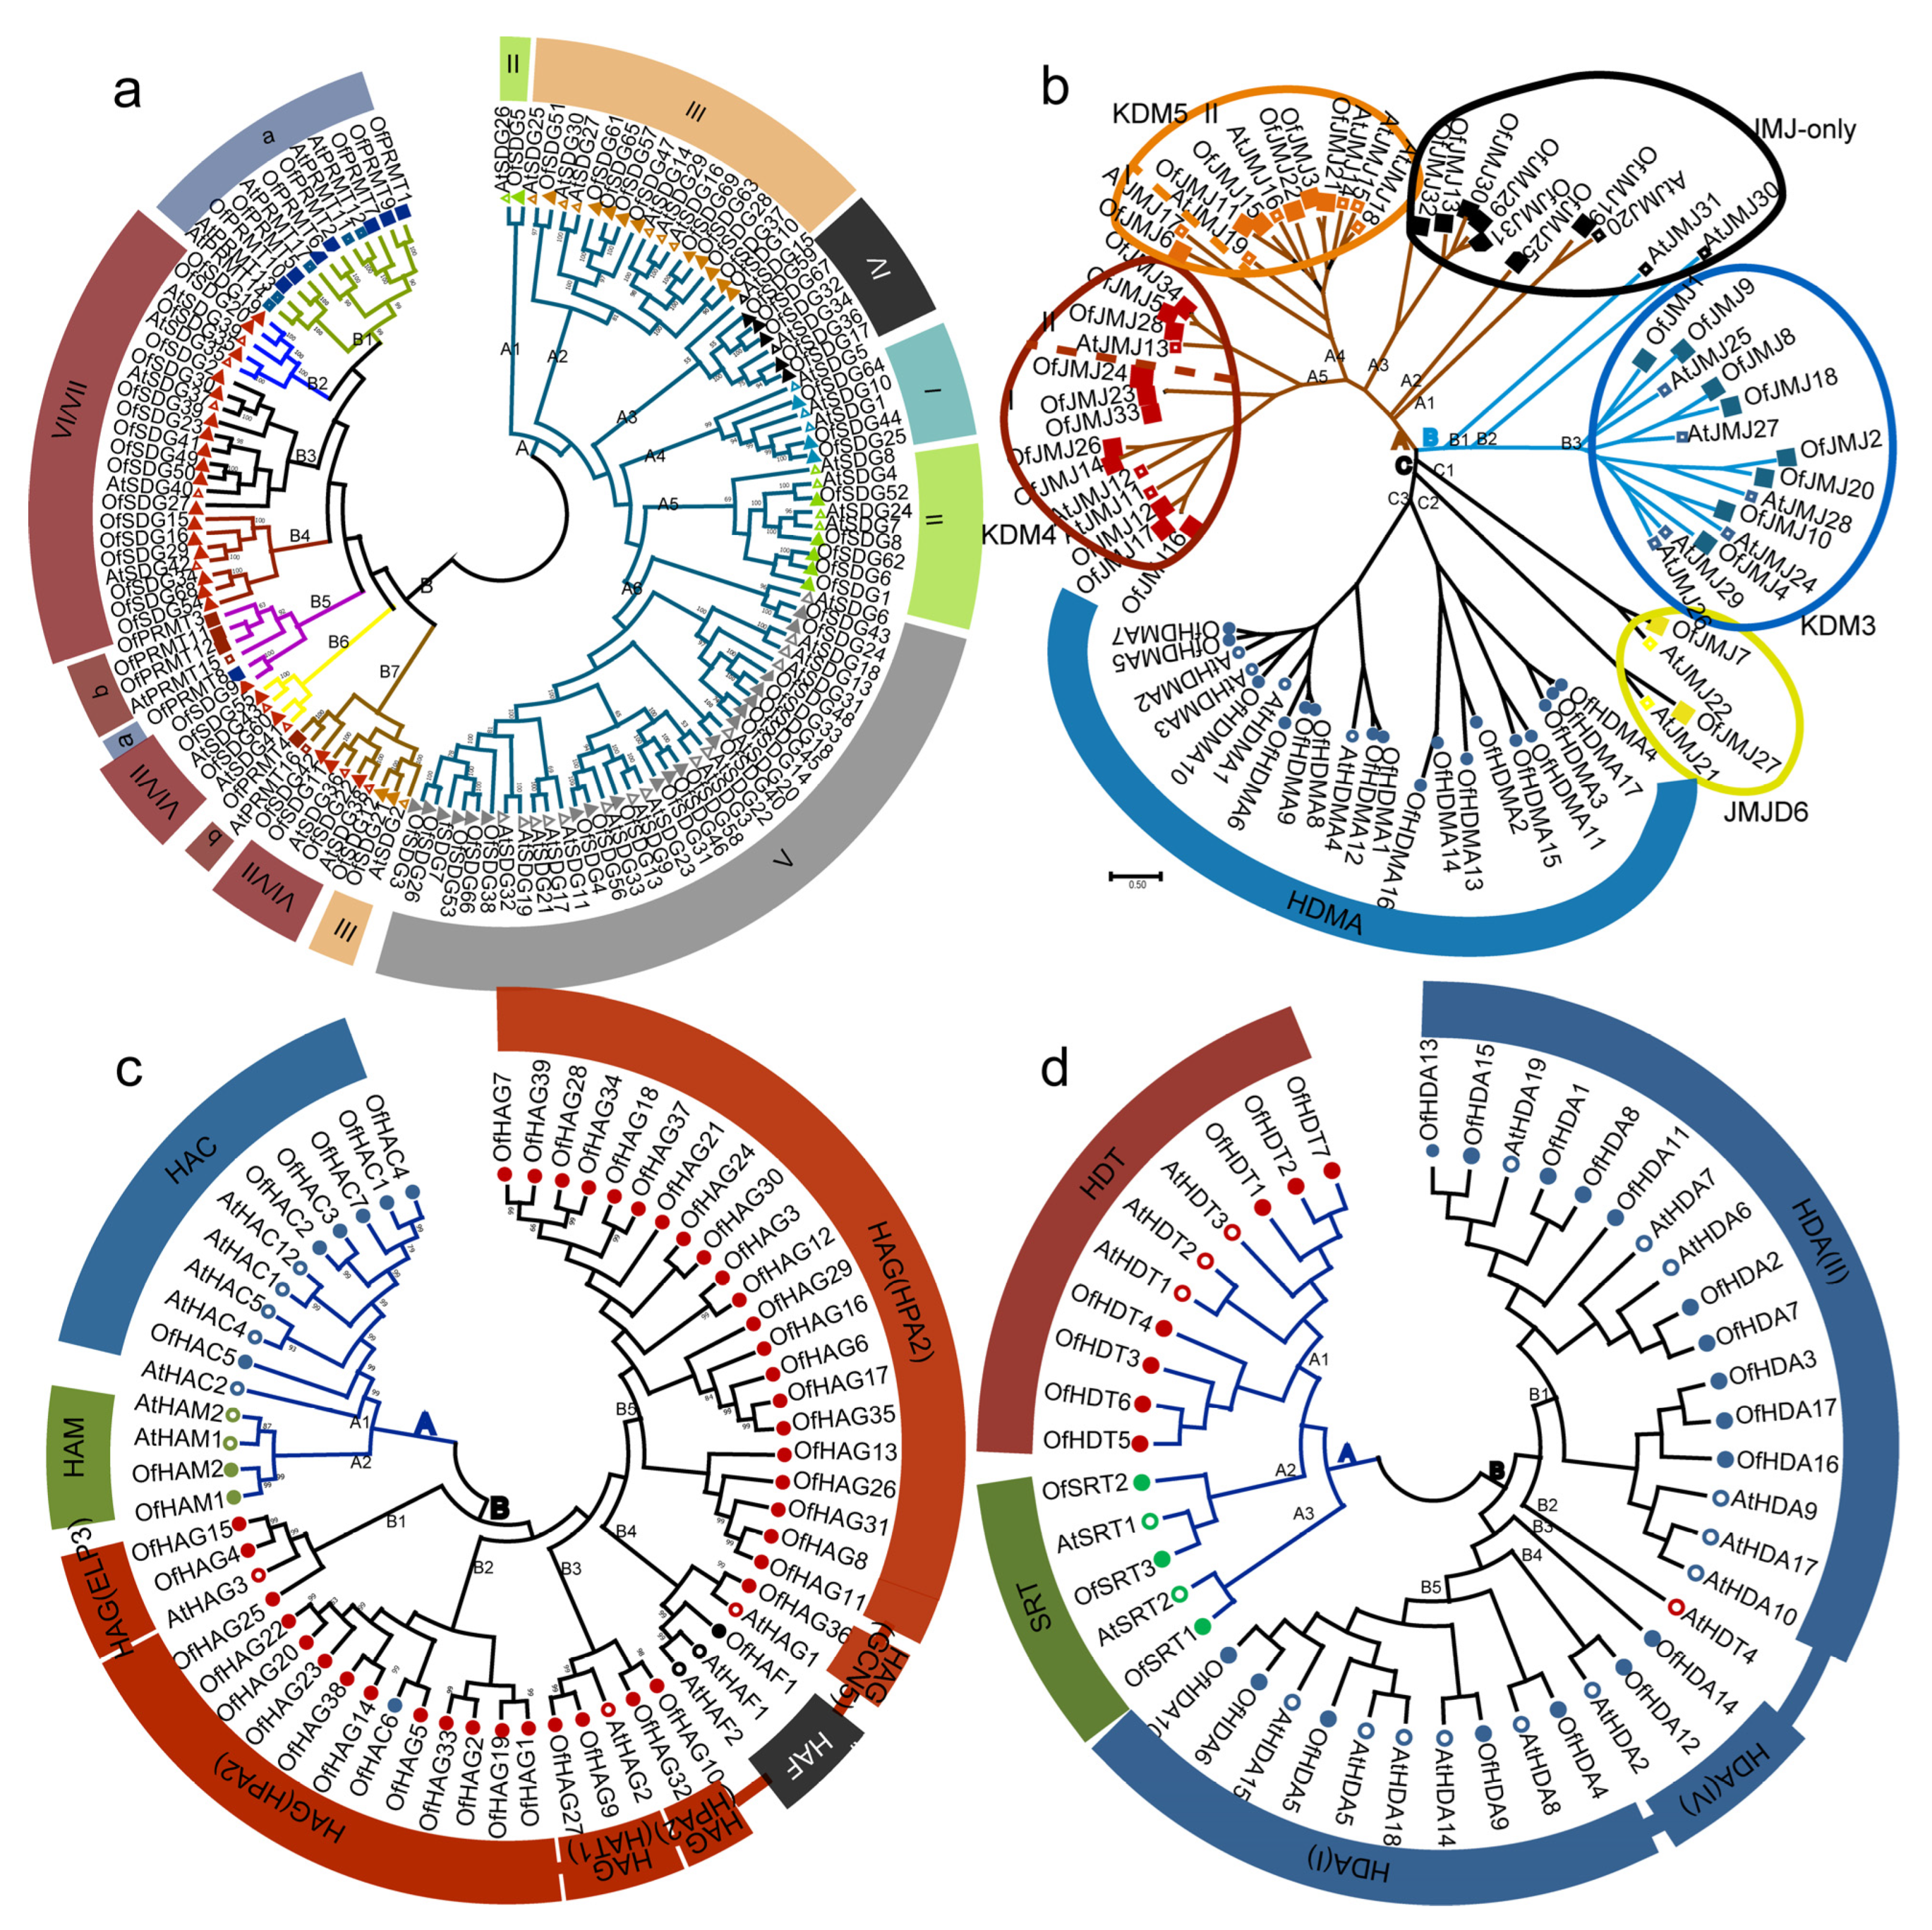
2.2. Phylogenetic Analysis of HMs between O. fragrans and Arabidopsis

To elucidate the phylogenetic relationships among HMs, we constructed four unrooted phylogenetic trees, specifically for HMTs, HDMs, HATs and HDACs, utilizing AtHMs and OfHMs. The classification of AtHMTs and OfHMTs revealed two distinct groups: A (A1–6) and B (B1–7), as illustrated in Figure 1a. Group A included types I (A4), II (A1, 5), IV (A3) and V (A6) SDGs, together with most type III (A2) SDGs, while Group B encompassed types VI/VII SDGs (B2–4, 6, 7), a few type III SDGs (B7) and types a (B1, 5) and b (B5, 7) PRMTs. The phylogenetic analysis of the AtHDMs and OfHDMs revealed a close clustering into three categories labeled A–C (Figure 1b). Specifically, branch C comprised all HDMAs (C3) and JMJD6-type genes (C1, 2), branch B included KDM3-type (B3) and some JMJ-only (B1, 2) genes, while branch A clustered KDM4-type (A5), KDM5-type (A4) and some JMJ-only (A1–3) genes. For the AtHATs and OfHATs, they were grouped into two branches: A and B, as shown in Figure 1c. Notably, with the exception of OfHAC6, the HACs (A1) and HAMs (A2) were placed on branch A, the HAFs were clustered in branch B4 and the HAGs were distributed throughout branch B. Similarly, all the HDACs were classified into two branches: A and B (Figure 1d). Specifically, excluding AtHDT4, branch A included the other HDTs (A1) and all SRTs (A2, 3), while branch B grouped the HDAs, with I- (B5), II- (B1) and IV-type HDAs (B3, 4).

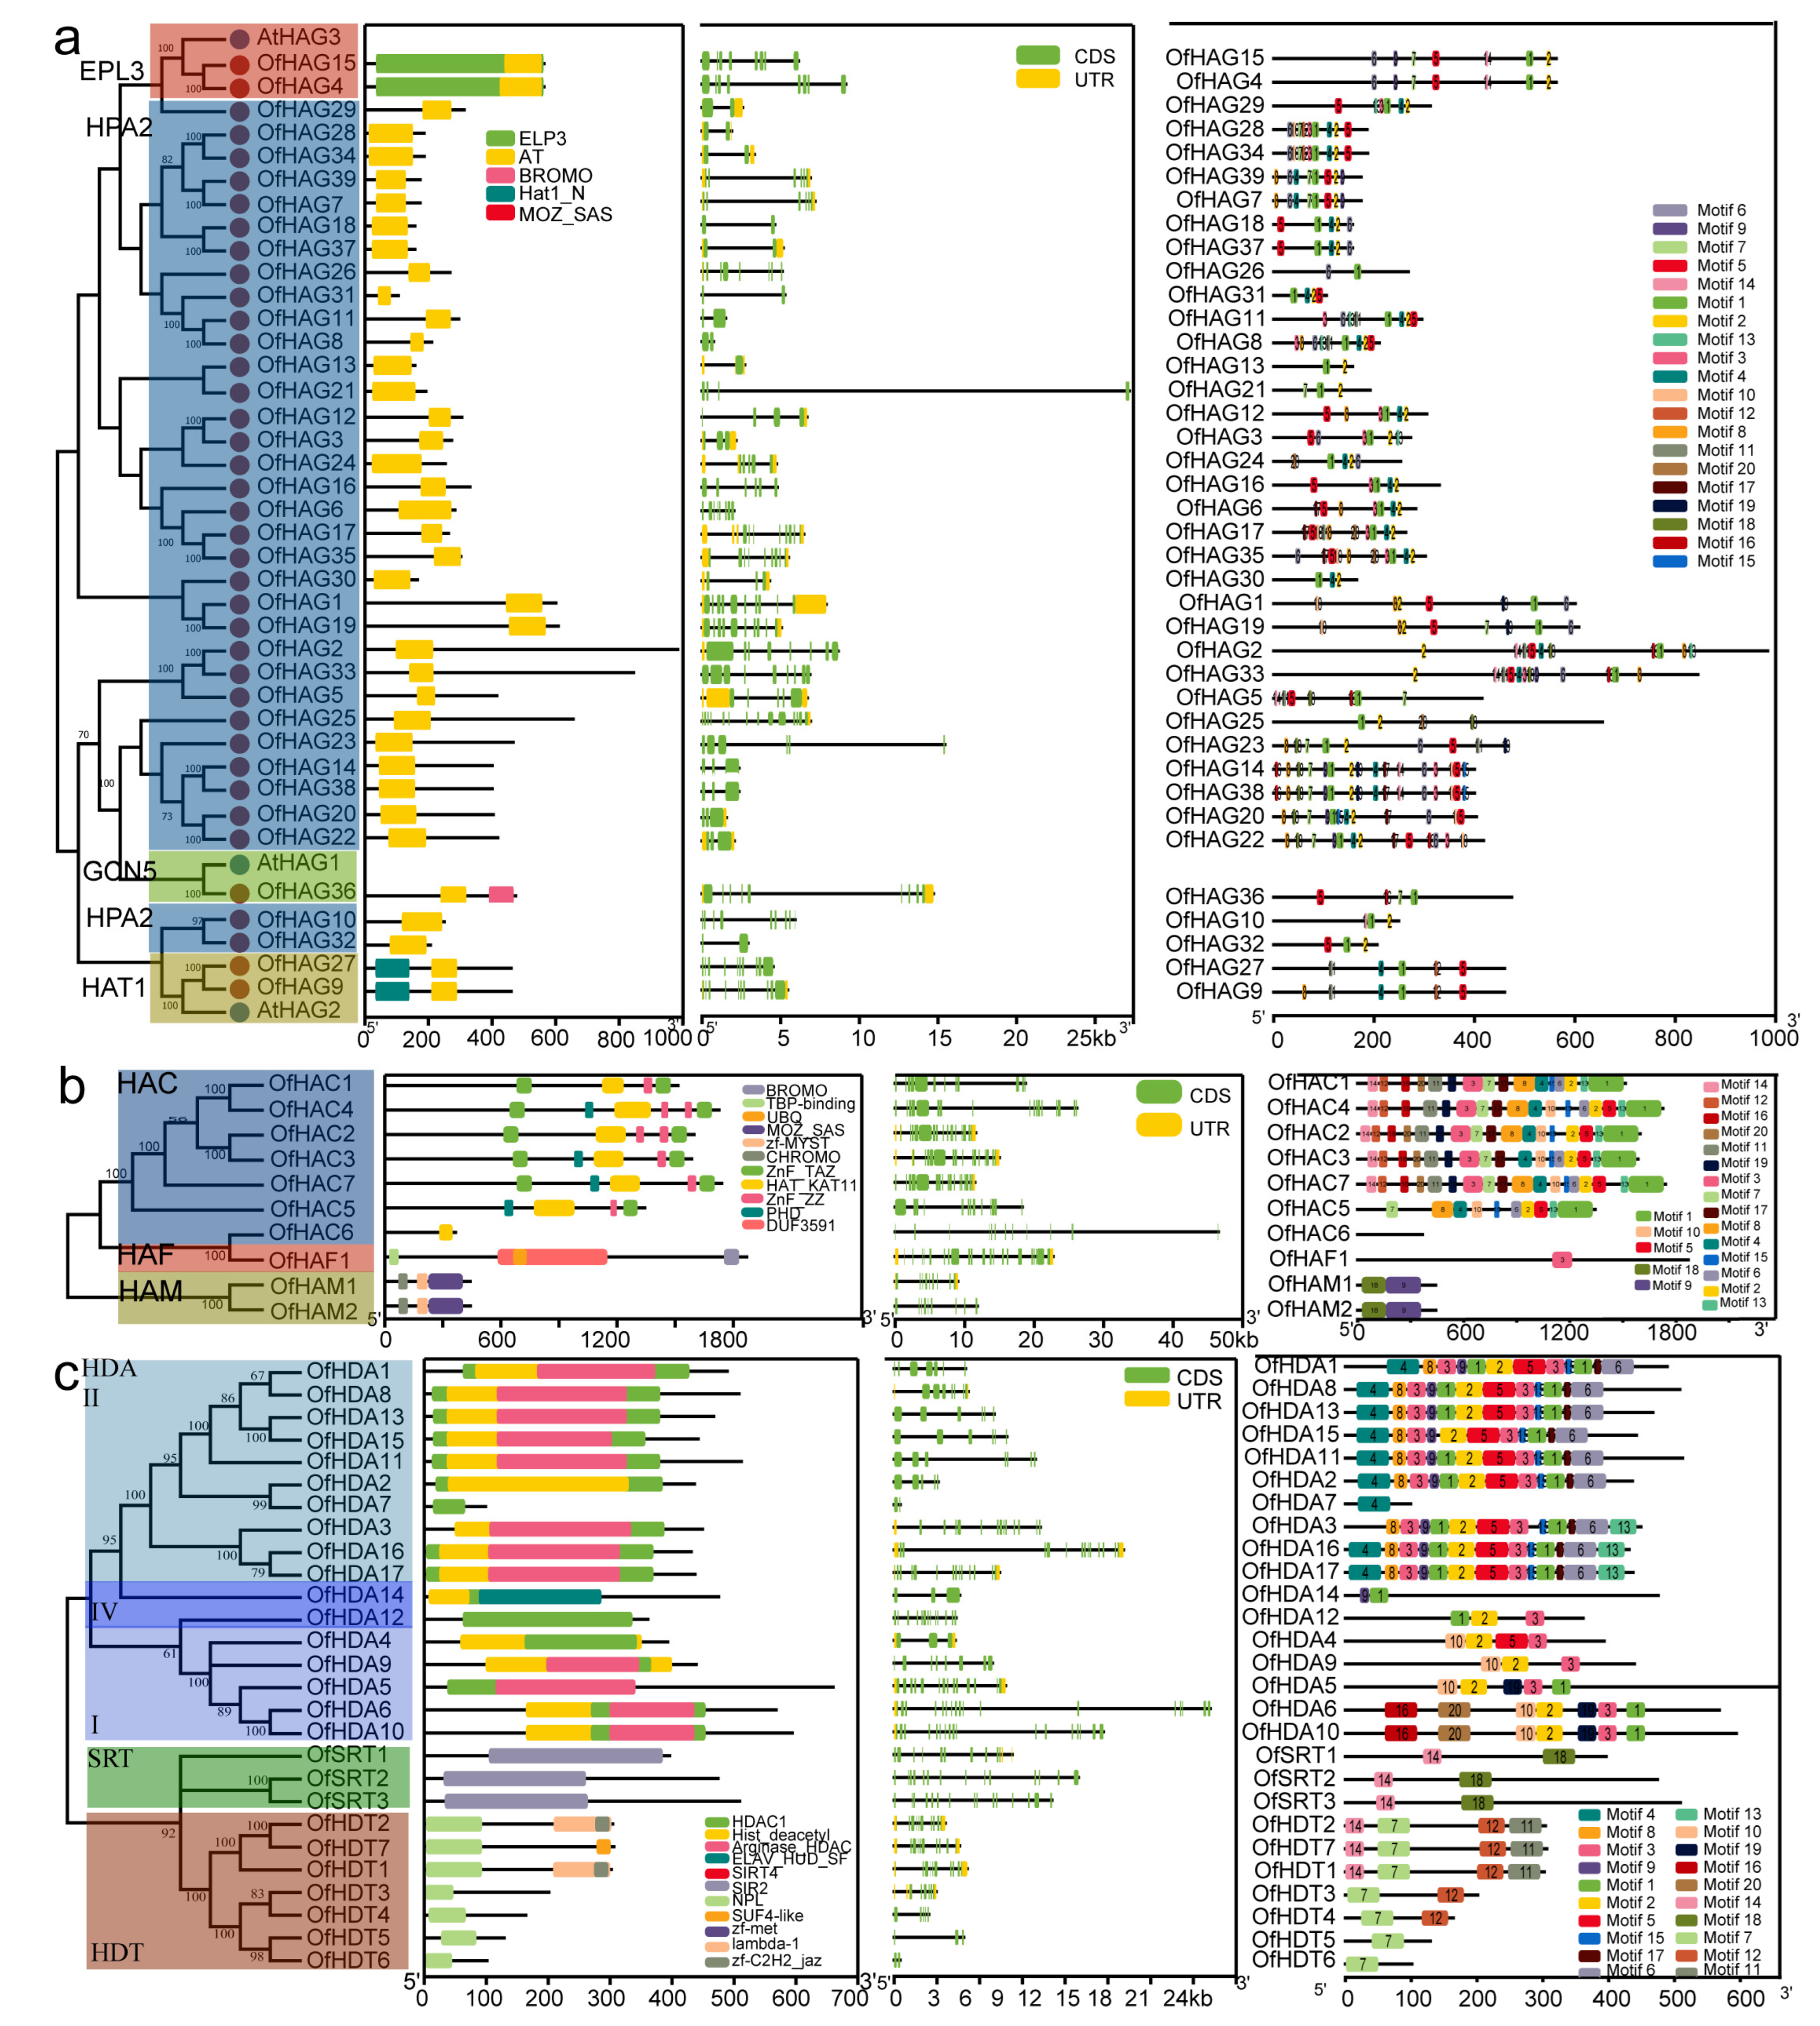
2.3. Gene Structure and Conserved Motif Analyses of OfHMs

Gene structure analyses provide valuable information on evolutionary relationships within gene families. Here, we explored the conserved domains, gene structures and motifs of 11 OfHM gene families, with the results presented in Figure 2. Among the OfPRMTs, which contained 7–20 coding sequences (CDSs), a consistent presence of uniform PRMT5/MT domains was observed (Figure 2a). The a-type OfPRMTs exhibited 7–11 different motifs, containing motifs 1, 2, 10 and 14; while the b-type OfPRMTs contained 2–6 motifs (Figure 2a). The OfSDGs, which contained 1 to 35 CDSs, featured SET domains and shared analogous motifs (Figure 2b). The I-type OfSDGs included motifs 2 and 3; the II-type OfSDGs, except for OfSDG5, contained the AWS domain and fewer motifs (3–6); the III-type OfSDGs, with the exceptions of OfSDG12, OfSDG21 and OfSDG51, embraced the zf-HC5HC2H and FYRC/PWWP domains, with the majority of genes possessing motifs 14, 15, 10, 1, 11, 3 and 2; most of the V-type OfSDGs also included the SRR/WIYLD and Pre-SET domains, with 3–15 motifs; most of the VI/VII-type OfSDGs had rubis-subs-bind/AWS/TPR domains, with 0–6 motifs (Figure 2b). The OfHDMAs, characterized by SWIRM domains, were categorized into two types based on the presence of RSC8 (Figure 2c). The I-type OfHDMAs contained 2 to 3 motifs, including motifs 11 and 13, while the II-type genes included 8–9 motifs, involving motifs 7, 15, 6, 9, 5 and 14 (Figure 2c). All the OfJMJs contained cupin_RmlC-like or JmjC domains (Figure 2c). The JMJ-only genes comprised 3–9 CDSs and 1–2 motifs; the KDM3-type genes included 2 cupin_RmlC-like domains or WRC and zf-4CXXC_R1 domains, with 8–20 CDSs and 3–5 motifs (such as 8, 12 and 17); the I-type KDM4 genes predominantly featured the JmjN domain, with 1–8 motifs; the II-type KDM4 contained JmjN and zf-C5HC2 domains, with 4 motifs (4, 3, 2 and 1); the KDM5-type genes included 5 motifs (motifs 4, 19, 3, 2 and 1) and the JmjN domain, with some genes containing zf-C5HC2, PLU-1, FYRN and FYRC domains; the JMJD6-type genes embraced the F-box domain and had only 1 motif (Figure 2c).
The OfHAGs were distinguished by the presence of AT domains (Figure 3a). The EPL3-type HAGs (OfHAG4, 15) additionally featured the EPL3 domain, with eight CDSs and seven motifs, including motifs 1, 2, 5, 6, 7, 9 and 14 (Figure 3a). The GCN5-type HAG (OfHAG36) included a BROMO domain, with nine CDSs and four motifs, i.e., motifs 1, 5, 7 and 16 (Figure 3a). The Hat1_N-type HAGs (OfHAG9, 27) consisted of 10 CDSs and 5–6 motifs, such as 1, 4, 5, 11 and 12 (Figure 3a). The OfHACs featured the HAT_KAT11 domain, with 12 to 17 CDSs (Figure 3b). Except for OfHAC6, the other genes contained 10–18 motifs, including motifs 1, 13, 2, 6 and 7. OfHAF1 contained the DUF3591 domain, with 21 CDSs and motif 3 (Figure 3b). The OfHAMs contained CHROMO, zf-MYST and MOZ_SAS domains, with nine CDSs and motifs 9 and 18 (Figure 3b). The OfHDAs contained an HDAC1 domain, with 2–17 CDSs (Figure 3c). The I-type HDAs included 3–7 motifs, such as motifs 2, 3 and 10; the IV-type genes included 2–3 motifs; except for OfHDA7, which contained 1 motif, the other II-type HDAs included 12–13 motifs (Figure 3c). The OfHDTs contained an NPL domain, with 2–10 CDSs and motif 7 (Figure 3c). The OfSRTs, which featured an SIR2 domain, comprised 10–15 CDSs and motifs 14 and 18 (Figure 3c).

2.4. Cis-Acting Element Analysis of OfHMs

Promoters are crucial in initiating gene transcription. To explore the potential biological functions and response characteristics of OfHM genes, the promoter sequences were submitted to PlantCARE for the analysis of cis-acting elements. The analysis revealed 24 cis-acting elements involved in light responsiveness, hormone responsiveness (including responses to auxin, GA, SA, MeJA and ABA), physiological stress (such as drought and cold) and growth and development regulation (Figure 4 and Figure 5). The abundance of light response elements was highest at 2259, followed by hormone response (1515), physiological stress elements (917), and growth and development regulation (346) (Figure 4 and Figure 5). Among them, the OfHAC4 gene contained the fewest light-responsive elements, with only 3, while OfJMJ17 had the most (32) (Figure 4 and Figure 5). OfHAC7, OfHDA15, OfJMJ4, OfSDG8, OfSDG46 and OfSDG65 had the fewest hormone-responsive elements (1), while OfHDT4, OfJMJ1 and OfJMJ10 possessed the most response elements (19–20) (Figure 4 and Figure 5). OfHAG12, OfHAG33, OfJMJ6 and OfSDG12 lacked physiological stress response elements, while the others contained 1–10 stress response elements (Figure 4 and Figure 5). Interestingly, 38 OfHMs (18.27%) lacked regulatory cis-acting elements for growth and development, 72 genes (34.62%) had only one cis-acting element, and 54 OfHMs (25.96%) contained two cis-acting elements (Figure 4 and Figure 5). These findings collectively indicate that the expression of OfHMs may be regulated by various cis-acting elements correlated with light responsiveness, hormone responsiveness, physiological stress, and specific growth and development processes.

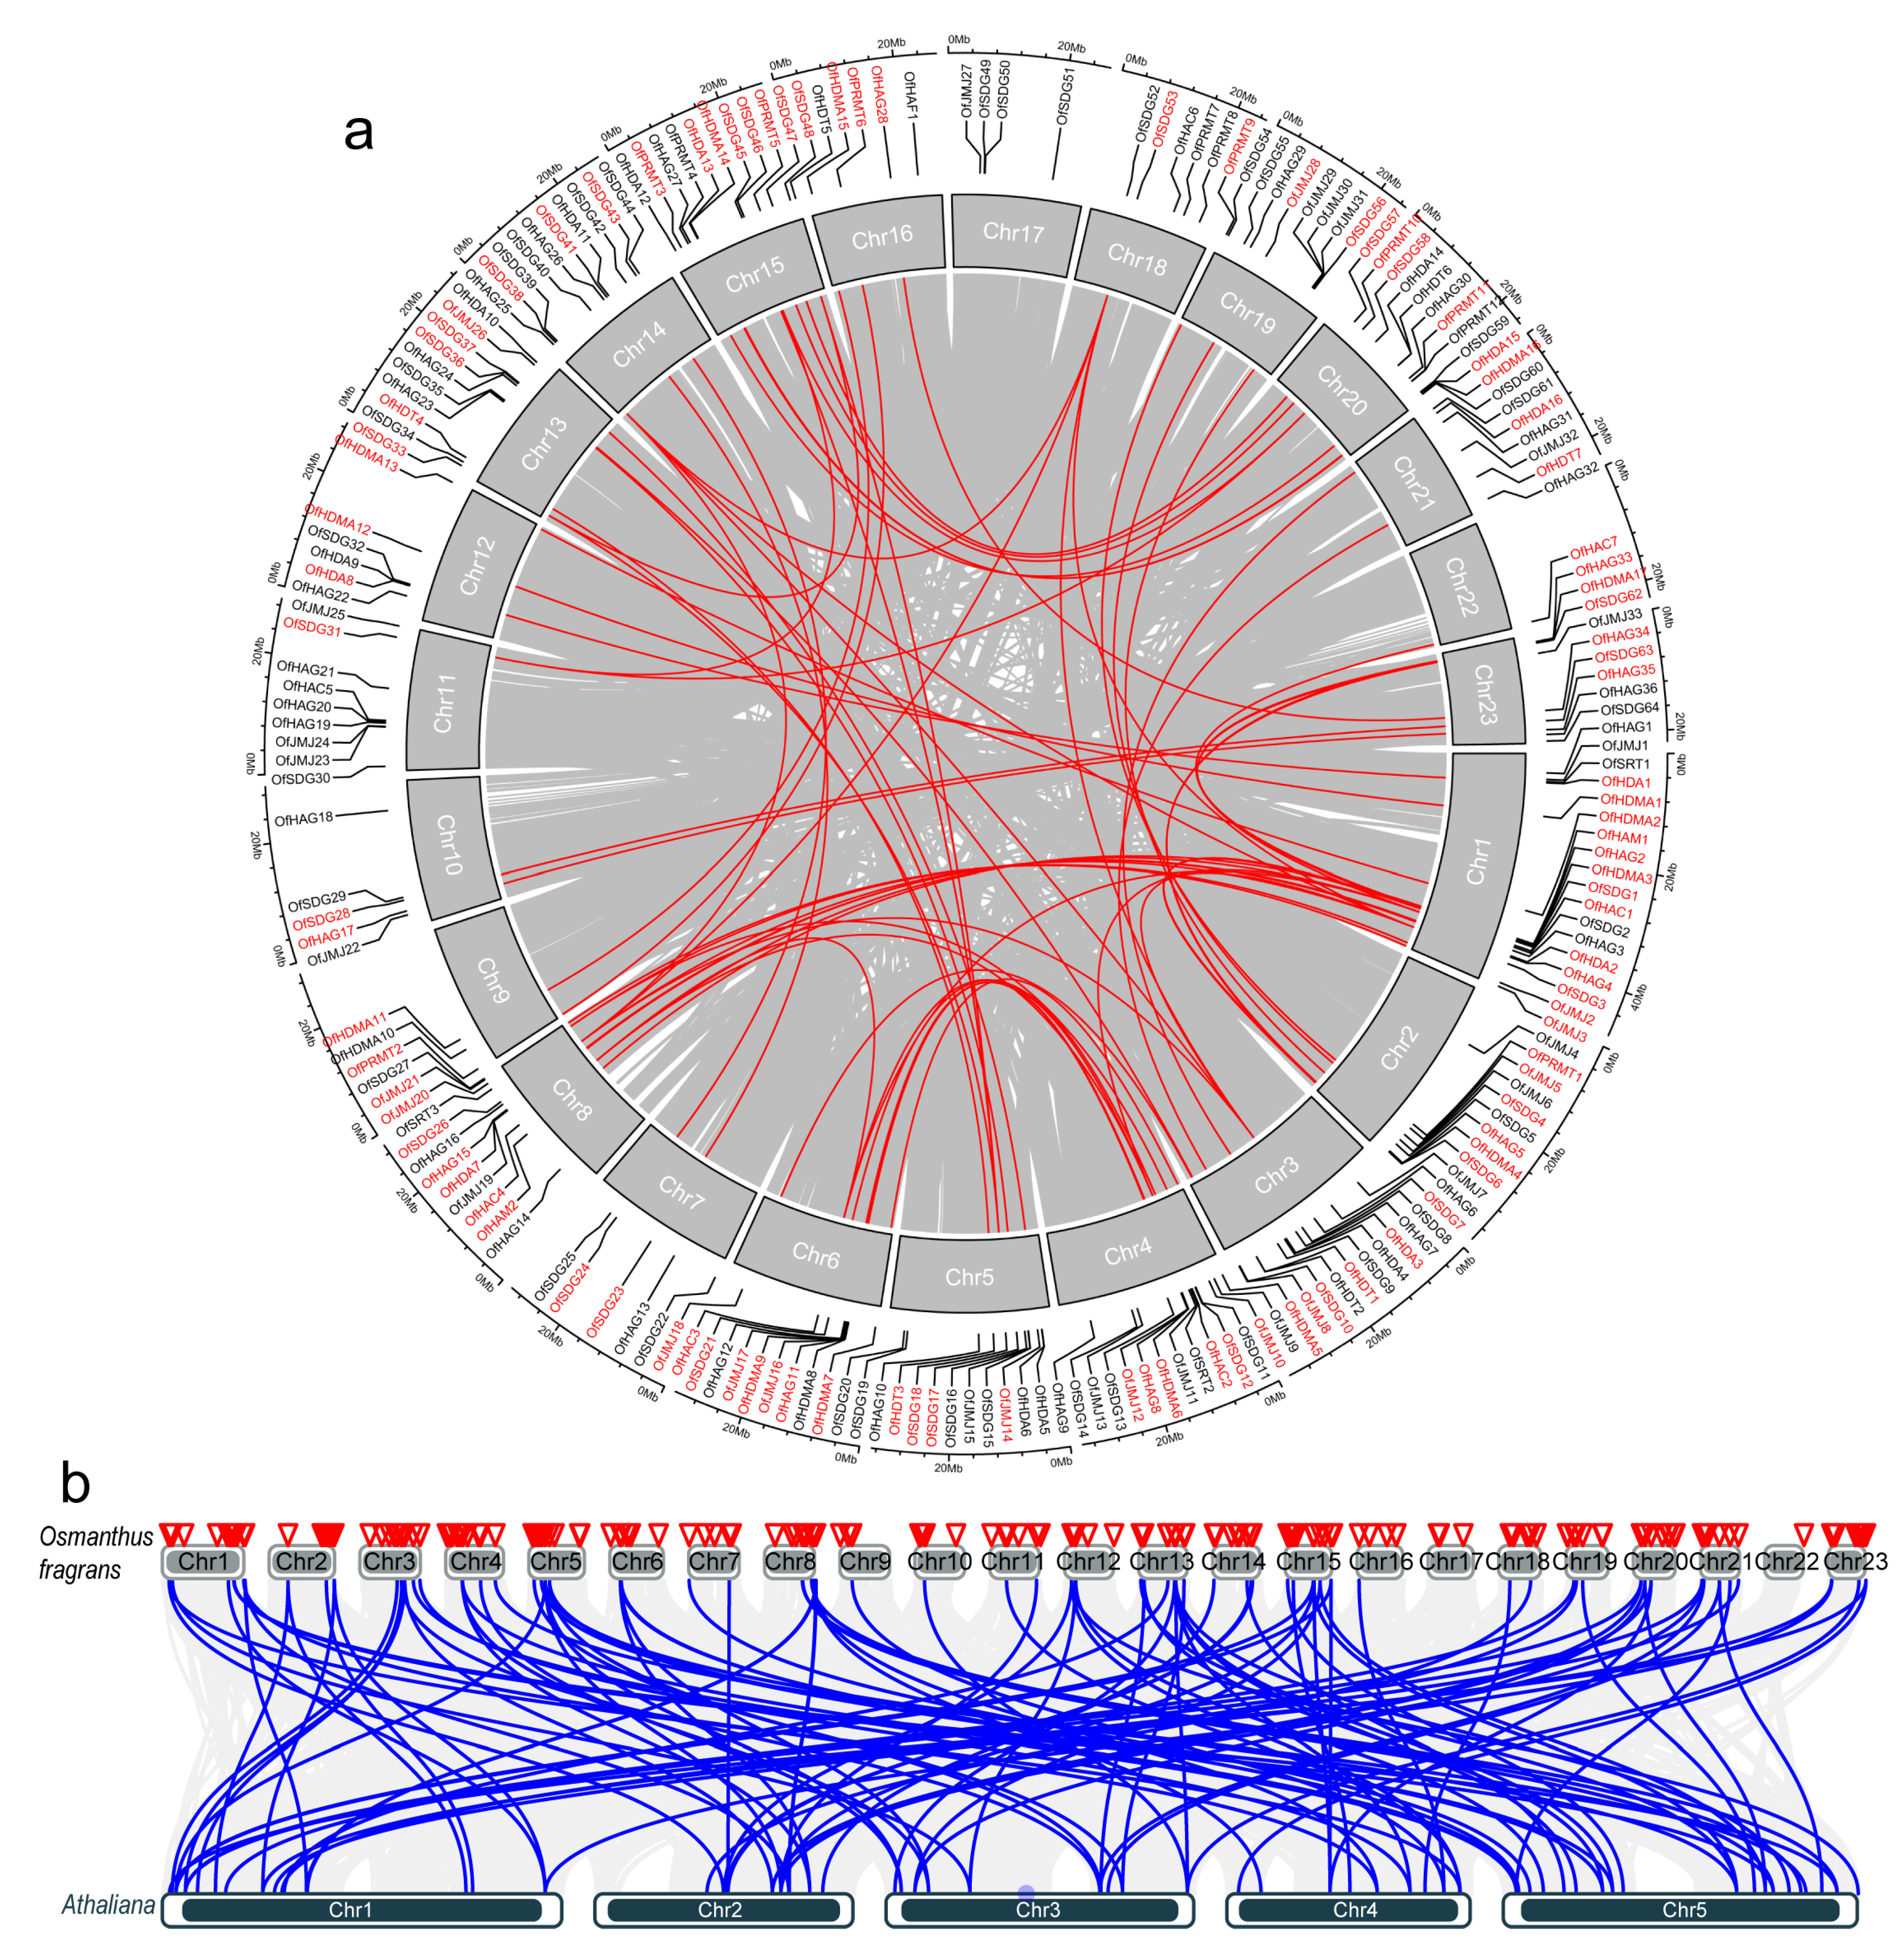
2.5. Chromosomal Distribution and Synteny Analysis of OfHMs

The chromosomal distribution of the OfHM genes is illustrated in Figure 6a. OfSDG6569, OfJMJ34, OfHAG3739 and OfHDA17 were not anchored on any chromosome (Chr), whereas the remaining 198 OfHMs were unevenly distributed across 23 Chrs. The majority of genes were located on Chrs 1 (18 OfHM genes), 4 (15), 15 (12), 20 (12), 3 (12), 5 (12), 8 (12), 6 (10), 13 (10) and 14 (10), whereas only one gene was located on Chr 22 (Figure S1).
The importance of gene duplication in the generation of new genes and functions is evident, with segmental and tandem duplications serving as primary drivers during the expansion of gene family [39]. This study investigated the amplification of the OfHM genes through an analysis of gene duplication events. The findings revealed that 89 OfHMs resulted from duplication events, covering 3 pairs of tandem duplicate genes (i.e., OfJMJ23 and OfJMJ24, OfSDG49 and OfSDG50, and OfHDT1 and OfHDT2) and 86 pairs of segmental duplications, with 70 pairs located on Chrs (Figure 6a). To assess the selective pressure on OfHM gene duplication during O. fragrans evolution, this study calculated the non-synonymous (Ka)/synonymous (Ks) ratios for homologous gene pairs. Among them, 44 pairs of OfHM genes exhibited a Ka/Ks ratio < 1 (Table S2), suggesting purifying selection and evolutionary conservation of functions. On the contrary, 11 pairs of OfHM genes, including OfHDMA1 and OfHDMA12, OfHAC1 and OfHAC2, OfHAC2 and OfHAC4, OfHAC3 and OfHAC4, OfHAC1 and OfHAC7, OfJMJ8 and OfJMJ18, OfJMJ26 and OfJMJ14, OfHAG17 and OfHAG35, OfSDG36 and OfSDG17, OfSDG45 and OfSDG18, and OfSDG57 and OfSDG65, displayed a Ka/Ks ratio > 1 (Table S2), indicating positive selection during evolution.
As shown in Figure 6b, a syntenic map of the OfHMs and AtHMs was constructed to elucidate their potential evolutionary relationships. A total of 87 segmental duplications of OfHMs and AtHMs were identified (83 pairs of genes shown in Chrs, Figure 6a) (Table S3). The identified pairs consisted of 6 PRMTs, 44 SDGs, 2 HDMAs, 16 JMJs, 3 HAGs, 1 SRT, 9 HDAs and 6 HDTs. To assess the selection pressure during duplication, we calculated the Ka/Ks values for these gene pairs. It was found that 11 pairs of HMs, namely AtPRMT13 and OfPRMT5, AtPRMT13 and OfPRMT10, AtSDG6 and OfSDG24, AtSDG6 and OfSDG43, AtSDG13 and OfSDG48, AtSDG8 and OfSDG62, AtSDG5 and OfSDG64, AtJMJ28 and OfJMJ2, AtJMJ18 and OfJMJ3, AtJMJ17 and OfJMJ6, and AtJMJ11 and OfJMJ12, exhibited Ka/Ks values < 1 (Table S3), indicating purifying selection during evolution. A pair of HMs, namely AtSDG13 and OfSDG18, had a Ka/Ks value of 1 (Table S3), suggesting neutral selection during evolution. For 20 pairs of HMs, that is, 9 pairs of SDGs, 1 pair of HDMAs, 7 pairs of JMJs, 2 pairs of HAGs and 1 pair of HDAs, the Ka/Ks value was > 1 (Table S3), indicated that they had undergone positive selection.

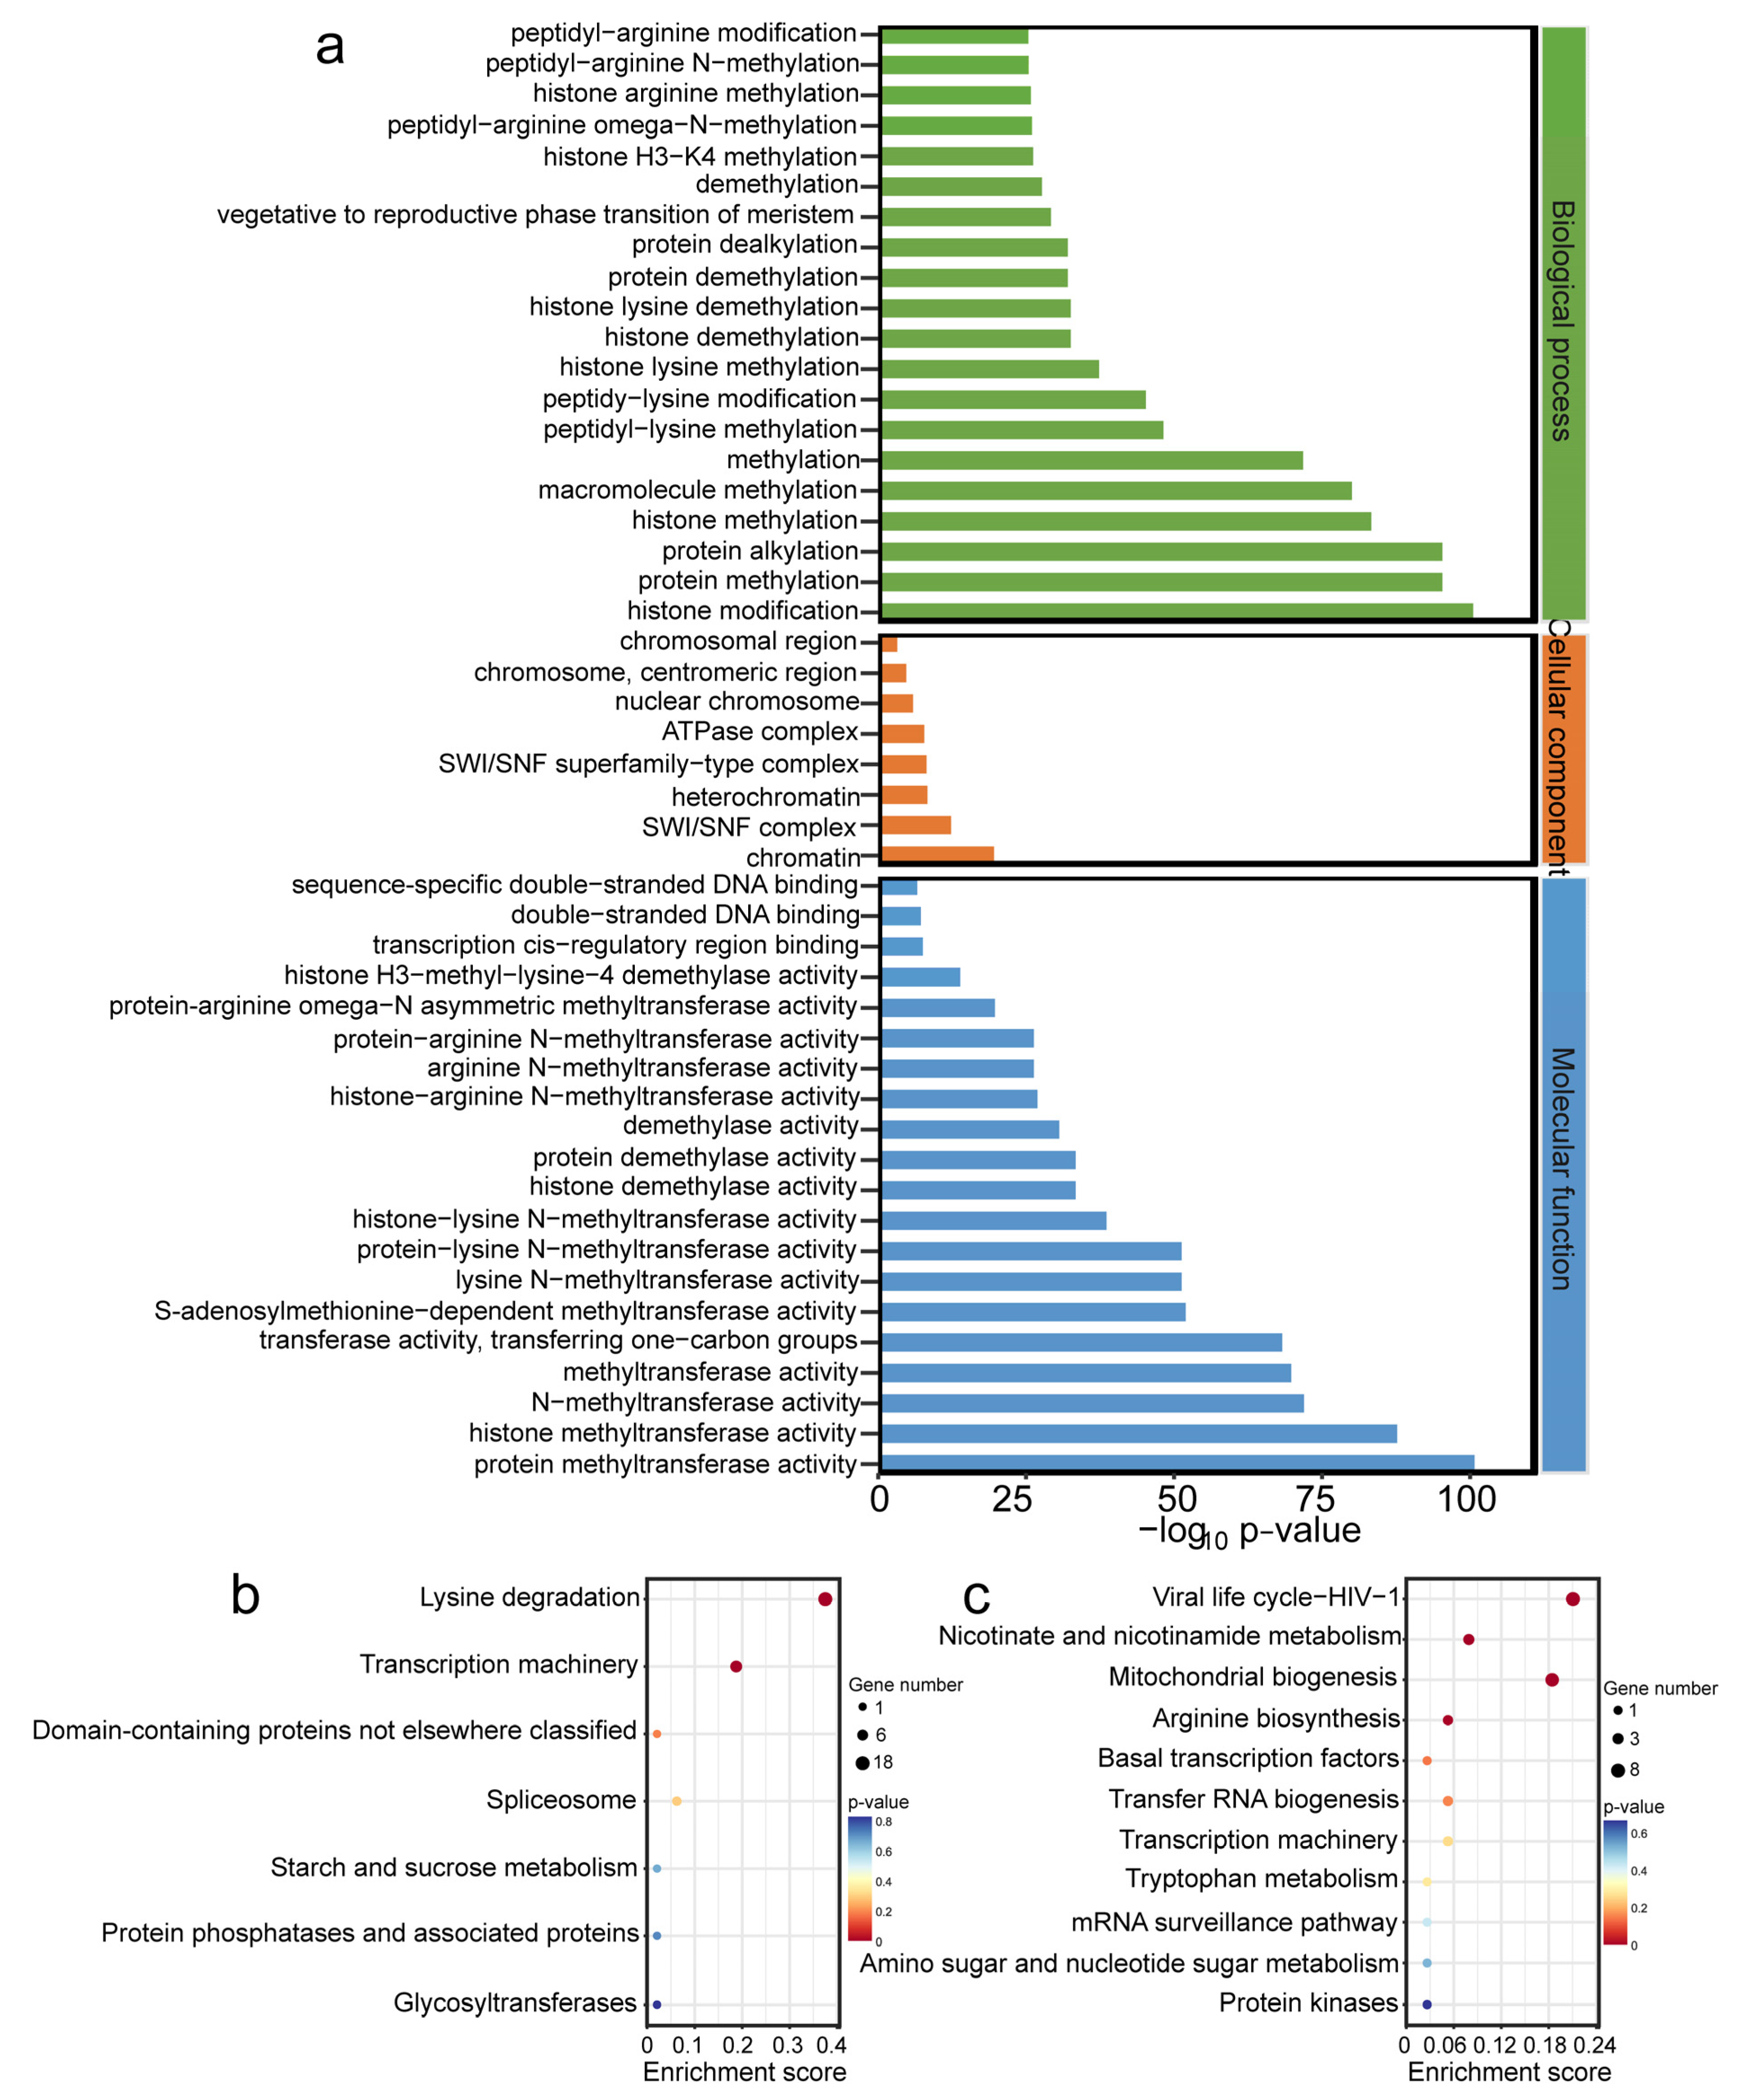
2.6. Functional Enrichment Analysis of OfHMs

An enrichment analysis was performed to uncover the potential biological functions of the OfHMs. The functions of all HM-modified genes were determined based on Gene Ontology (GO) categories, encompassing biological processes, molecular functions and cellular components (Figure 7a). In terms of biological processes, these genes exhibited enrichment in pathways such as methylation, macromolecule methylation, HM, protein alkylation, protein methylation and protein methylation. Regarding cellular components, the genes were more abundant in heterochromatin, the SWI/SNF complex and chromatin pathways. For molecular functions, enrichment was observed in pathways such as (N-)methyltransferase activity, histone methyltransferase activity, and protein methyltransferase activity. However, the histone acetylation modification genes did not exhibit enrichment within the relevant metabolic pathways.
Furthermore, analysis of the Kyoto Encyclopedia of Genes and Genomes (KEGG) pathways found that the genes associated with histone methylation modifications are enriched in the lysine degradation and transcription machinery pathways (Figure 7b). On the contrary, the histone acetylation modification genes were more abundant in pathways such as the viral life cycle of HIV-1, the metabolism of nicotinate and nicotinamide, mitochondrial biogenesis, arginine biosynthesis and basal transcription factors (Figure 7c). Consequently, these OfHM genes are presumed to play a variety of roles in cellular metabolism.

2.7. Prediction of Interactions of OfHM Proteins

For a more comprehensive understanding of the biological interactions involving the OfHM proteins, we performed a protein interaction network analysis. As illustrated in Figure 8, 93 proteins from 11 HM-related groups, consisting of 33 OfSDGs, 18 OfHAGs, 12 OfJMJs, 8 OfHDAs, 8 OfHDMAs, 5 OfPRMTs, 3 OfHACs, 2 OfHDTs, 2 OfSRTs, 1 OfHAF and 1 OfHAM, exhibited direct or indirect interactions with other proteins. Among them, the OfSDGs showed the highest number of interactions (202), followed by the OfHAGs (114), OfHDAs (91) and OfJMJs (73). Sixteen genes demonstrated interactions with more than 10 proteins, with OfHDA7 and OfHAG36 showing the most extensive interactions (21), followed by OfHDA11 (19), OfJMJ17 (17), OfSDG67 (15), OfSDG44 (14), OfSDG69 (13) and OfSDG64 (13). In contrast, 14 proteins, including OfHAG1/19/26, OfHDMA12, OfJMJ19, OfPRMT9 and OfSDG2/15/26/42/50/54/55/66, exhibited interactions with only one protein. These findings suggest that OfHMs participate in various biological processes by regulating or being regulated by other genes.

2.8. Expression Analysis of OfHMs in Different Tissues and Flowering Stages

To gain insights into the responsiveness of OfHMs during the flower opening and senescence stages, as well as under ethylene and Aza treatments, we examined their expression profiles utilizing publicly available transcriptome data [40]. Among the identified OfHMs, 182 genes with expression levels (fragments per kilobase of exon model per million mapped fragments values (FPKM)max > 1) were recognized across various tissues and flowering stages, comprising 11 diverse gene families (Figures S2 and S3). Within this set, 83 OfHMs, including 7 OfPRMTs, 28 OfSDGs, 7 OfHDMAs, 12 OfJMJs, 16 OfHAGs, 1 OfHAM, 3 OfHACs, 6 OfHDAs, 1 OfHDT and 2 OfSRTs, exhibited differential expression in three tissues (roots, stems and leaves) (Figure 9). The majority of OfHMs (61 genes, 73.49%), spanning various gene families involving OfPRMTs (6, 85.71%), OfSDGs (21, 75.00%), OfHDMAs (7, 100.00%), OfJMJs (7, 58.33%), OfHAGs (12, 75.00%), OfHAM (1, 100%), OfHACs (3, 100%), OfHDA (1, 16.67%), OfHDT (1, 100%) and OfSRTs (2, 100%), exhibited higher expression in leaves, while a small percentage (14.46%) demonstrated elevated expression in roots and 10.84% exhibited increased expression in stems (Figure 9).
During the process of flower opening and senescence, 56 differentially expressed OfHMs were identified (Figure 10). These genes represented various families, including 2 OfPRMTs, 21 OfSDGs, 5 OfHDMAs, 10 OfJMJs, 12 OfHAGs, 1 OfHAM, 1 OfHAC, 1 OfHDA, 2 OfHDTs and 1 OfSRT. Notably, 9 OfHMs (16.07%), i.e., OfSDG12/21/28/68, OfHDMA9, OfJMJ27, OfHAG17/22 and OfHAC1, exhibited a discernible upward trend, while 20 OfHMs, i.e., 8 OfSDGs, 2 OfHDMAs, 4 OfJMJs, 4 OfHAGs, 1 OfHAM and 1 OfHDT, displayed a stable trend. The remaining genes (27, accounting for 48.21%) showed a downward trend (Figure 10). It is noteworthy that the downregulated genes primarily represented eight gene families, namely OfPRMTs (2, 100.00%), OfHDTs (2, 100.00%), OfHDA (1, 100.00%), OfSRT (1, 100.00%), OfJMJs (5, 50.00%), OfHAGs (6, 50.00%), OfHDMAs (2, 40.00%) and OfSDGs (8, 38.10%) (Figure 10). Among them, the majority of genes (22, 81.48%) exhibited a decrease from S1 (linggeng stage) to S3 (early full flowering stage), an increase in S4 (full flowering stage) or S5 (late full flowering stage), and a subsequent decrease in S6 (abscission stage) (Figure 10).

2.9. Expression Analysis of OfHMs under Ethylene and 5′-Azacytidine (Aza) Treatment

In response to Aza or ethylene treatment, 132 OfHMs were expressed (FPKMmax > 1) (Table S4). Among them, 29 OfHMs, i.e., 4 OfPRMTs, 9 OfSDGs, 1 OfHDMA, 1 OfJMJ, 6 OfHAGs, 5 OfHDAs and 3 OfHDTs, were differentially expressed after Aza treatment (Figure 11a). Specifically, 22 genes (75.86%), including 1 OfHDMA (100.00%), 5 OfHAGs (83.33%), 4 OfHDAs (80.00%), 7 OfSDGs (77.78%), 3 OfPRMTs (75.00%) and 2 OfHDTs (66.67%), displayed upregulated expression after treatment, while 5 genes, comprising OfSDG42, OfJMJ28, OfHAG13, OfHDA5 and OfHDT3, showed downregulated expression. Furthermore, 26 OfHMs, i.e., 2 OfPRMTs, 9 OfSDGs, 1 OfHDMA, 1 OfJMJ, 5 OfHAGs, 5 OfHDAs and 3 OfHDTs, were differentially expressed after ethylene treatment (Figure 11b). Among them, 21 genes (80.77%), including 9 OfSDGs (100.00%), 5 OfHDAs (100.00%), 1 OfPRMT (50.00%), 1 OfHDMA (100.00%), 4 OfHAGs (80.00%) and 1 OfHDT (33.33%), demonstrated upregulated expression after treatment. Additionally, 18.52% of the genes, comprising OfPRMT6, OfJMJ28, OfHAG13, OfHDT3 and OfHDT7, exhibited downregulated expression after treatment. These findings indicate a crucial role of OfHMs in response to ethylene and Aza treatments, as well as in the processes of flower opening and senescence in O. fragrans.

2.10. Quantitative Real-Time Polymerase Chain Reaction (qRT-PCR) Analysis of OfHM Genes

To validate the reliability of the OfHM expression profiles derived from the RNA-seq data, we determined the expression levels of six OfHMs during the flower opening and senescence stages using qRT-PCR. The results revealed that the expression patterns of these OfHMs closely resembled those obtained in the RNA-seq analysis (Figure 12). Specifically, the expression of these genes, OfJMJ19, OfSRT3, OfSDG55, OfHDT7, OfHDMA4 and OfHAG9, showed a decreasing trend during flower opening and senescence (Figure 12a–f). Furthermore, the R2 value reached 0.72 through linear fitting between the qRT-PCR and FPKM data (Figure 12g), indicating a high degree of reliability in the OfHM gene profiles. Therefore, our transcriptome-based analysis of OfHM gene expression levels demonstrates high reproducibility and reliability, providing a robust reference for further studying the roles of OfHMs.

3. Discussion

Numerous previous studies have highlighted the pivotal role of HMs in plant growth and development processes, along with responses to both abiotic and biotic stresses, through the nuanced modulation of gene transcription [14,16]. Consequently, an increasing number of investigations have focused on understanding the functions of modifying enzymes in various plant species. Although substantial progress has been made in some model plants [7,8,16], this information has not been reported for O. fragrans until now. Here, we conducted a comprehensive characterization of OfHMs, providing insights into their gene location, conserved domains, phylogenetic relationships, gene expansion, cis-acting elements and gene structure. Furthermore, we analyzed the expression patterns of OfHMs during flower opening and senescence, and under stress treatments. The findings presented here contribute to the growing knowledge in this field and provide a basis for further research on O. fragrans.

3.1. O. fragrans HM Genes in Comparison with Other Plant Species

Here, we identified 208 OfHMs (Table S1). These included 81 OfHMTs (comprising 12 OfPRMTs and 69 OfSDGs), 51 OfHDMs (encompassing 17 OfHDMAs and 34 OfJMJs), 49 OfHATs (including 39 OfHAGs, 2 OfHAMs, 7 OfHACs and 1 OfHAF) and 27 OfHDACs (involving 17 OfHDAs, 3 OfSRTs and 7 OfHDTs) (Table S1). Notably, the number of OfHMs is comparable to that observed in other plants, such as MdHMs (198) [8,41], and 1.53 to 2.39-fold higher compared to SlHMs (124) [14], LcHMs (87) [15], CsHMs (136) [16] and AtHMs (102) [7] (Table S1). This observation suggests that the level of duplication of HM genes is higher during the evolutionary process of O. fragrans.
The uneven distribution of OfHMs in the genomes, as observed in Figure 6a, aligns with findings in citrus [16] and apple [8]. This pattern of uneven chromosome distribution suggests that these changes occurred prior to species differentiation.

3.2. Evolution and Amplification Analyses of OfHM Gene Family

The construction of phylogenetic trees, aligning genes across diverse botanical species, provides profound insights into the intricate tapestry of evolutionary interrelations among genes [42]. In this study, four phylogenetic trees, i.e., HMTs, HDMs, HATs and HDACs, were constructed, utilizing all members of the HM gene families from both O. fragrans and A. thaliana (Figure 1). The observed clustering pattern for each category of OfHMs is consistent with observations documented in other species, as reported in previous studies [7,8,14,17]. However, there are exceptions, exemplified by the clustering of HDAs on a particular branch, excluding AtHDT4 (Figure 1d). This divergence might be attributed to the partial matching of their protein sequences.
The structure of genes and conserved motifs are pivotal in shaping the evolution of gene families. In our study, different gene families within the OfHMs showcased conserved typical domains, as illustrated in Figure 2 and Figure 3 [7,8,14,17]. Notable examples include the presence of a PRMT5/MT domain in the OfPRMTs (Figure 2a), a characteristic SET domain in the OfSDGs (Figure 2b), and cupin_RmlC-like superfamily/JmjC and SWIRM conserved domains in the OfJMJs and OfHDMAs, respectively (Figure 2c). Furthermore, the domains AT, HAT_KAT11 and MOZ-SAS were identified in the OfHAGs, OfHACs and OfHAMs (Figure 3a,b), while the HDAC1, SIR2 and NPL domains were contained in the OfHDAs, OfSRTs and OfHDTs, respectively (Figure 3c). Additionally, various genes within each gene family harbored additional structural domains (Figure 2 and Figure 3). For instance, the I-type OfSDGs featured SET domains; the II-type OfSDGs included AWS domains; the III-type OfSDGs, excluding OfSDG5 (9), encompassed zf-HC5HC2H and FYRC/PWWP domains; and the V-type OfSDGs typically contained SRR/WIYLD and Pre-SET domains; and most of the VI/VII-type OfSDGs included rubis-subs-bind/AWS/TPR domains (Figure 2b). This conservation of domains within the same family/subfamily implies shared features across species. Furthermore, OfHMs with distinct structures and conserved motifs exhibited clustering at considerable distances, whereas those with analogous structures and motifs tended to cluster close together (Figure 2 and Figure 3). This clustering pattern is consistent with the observations in other species [8,16], indicating a potential correlation among phylogeny, gene structure and protein motifs. However, these correlations require validation through additional experiments.
Segmental and tandem duplications serve as fundamental mechanisms driving the expansion of gene families [39]. In our study, 89 OfHMs were identified as products of duplication events, and 86 HM segmental duplications existed between the OfHMs and AtHMs (Figure 6b). This discovery aligns with results in apple [8,41], where 67 pairs of MdHMs were reported. Most of the OfHM gene pairs exhibited a Ka/Ks ratio < 1 (Table S2), indicative of purifying selection and evolutionary conservation of their functions. In particular, 11 OfHM gene pairs, including 1 OfHDMA, 4 OfHACs, 2 OfJMJs, 1 OfHAG and 3 OfSDGs, exhibited a Ka/Ks ratio > 1 (Table S2). However, the majority of pairs of AtHM and OfHM genes displayed a Ka/Ks ratio > 1 (Table S3), indicating positive selection during evolution [43]. These results diverged from most studies [8,17,41]. For instance, gene pairs duplicated within apple, millet (Setaria italica), or between them and Arabidopsis generally exhibited Ka/Ks ratios < 1 (Table S3). These gene pairs with Ka/Ks ratios greater than 1 may have played a pivotal role in species adaptive evolution or in response to specific environmental stresses. Collectively, the OfHMs have undergone tandem and segmental duplications, contributing significantly to the expansion of the OfHMs and their subsequent structural and functional diversification.

3.3. OfHMs Are Involved in the Flowering Process and the Induction of Aza and Ethylene Responses

HM genes play a crucial role in the orchestration of plant growth and development [14,16]. The functional enrichment analysis revealed that OfHMs were enriched in lysine degradation, transcription machinery, viral life cycle of HIV-1, nicotinate and nicotinamide metabolism, mitochondrial biogenesis, arginine biosynthesis and basal transcription factors pathways (Figure 7b,c). The promoter region of the OfHM genes contained elements that respond to plant hormones, stress, light, and growth and development (Figure 4 and Figure 5), indicating their involvement in light responses, hormone responses, physiological stress, and the regulation of growth and development.
The expression patterns of genes provide vital information for the exploration of gene function [44,45]. Across three different tissues (roots, stems and leaves), 83 OfHMs exhibited differential expression patterns, with the majority of genes (73.49%) exhibiting increased expression in leaves (Figure 9). However, it should be noted that certain studies have observed nearly ubiquitous expression of TaHMs during the development stages of wheat grains, with numerous genes displaying elevated expression levels in specific layers of grain tissue [46], thus indicating potential species-specific differences.
In total, 56 OfHMs exhibited differential expression during the flower opening and senescence stages, with 27 genes, including OfPRMTs (2, 100.00%), OfHDTs (2, 100.00%), OfHDA (1, 100.00%), OfSRT (1, 100.00%), OfJMJs (5, 50.00%) and OfHAGs (6, 50.00%), OfHDMAs (2, 40.00%) and OfSDGs (8, 38.10%), downregulated or showing a down (S1–S3)–up (S4 or S5)–downregulated (S6) pattern (Figure 10). In Arabidopsis and rice, genes such as AtPRMT5 [47], AtHDMA [48], OfHDT1 [49], OfSRT1 [50], AtSDG [33,51,52,53], AtHDA [26,48,54] and AtJMJ [41,55] participate in flower development. It is noteworthy that genes within the same subfamily may exert different effects. For instance, members of Class III, such as AtJMJ27 and AtJMJ28, have been demonstrated to participate in the regulation of plant flowering. Specifically, AtJMJ27 inhibits flowering by directly or indirectly modulating the modification of H3K9me2 at the FLC and CONSTANS (CO) gene loci [56]. Conversely, AtJMJ28 interacts with FLOWERING BHLH (FBH) and affects flowering by removing H3K9me2, thereby activating CO expression [57]. Consequently, we hypothesize that the downregulated expression of OfPRMTs, OfHDTs, OfHDAs and OfSRTs promotes flower opening and senescence, while upregulated or downregulated expression of OfSDGs, OfHDMAs, OfJMJs and OfHAGs regulates flower opening and senescence. However, the specific roles of individual genes require further analysis.
After Aza treatment, the expression of 29 OfHMs showed significant differences, with 22 genes (1 OfHDMA (100.00%), 5 OfHAGs (83.33%), 4 OfHDAs (80.00%), 7 OfSDGs (77.78%), 3 OfPRMTs (75.00%) and 2 OfHDT (66.67%)) exhibiting upregulated expression (Figure 11a). Similarly, after ethylene treatment, 26 OfHMs exhibited significant differential expression, with 21 genes (9 OfSDGs (100.00%), 5 OfHDAs (100.00%), 1 OfPRMT (50.00%), 1 OfHDMA (100.00%), 4 OfHAGs (80.00%) and 1 OfHDT (33.33%)) displaying upregulated expression (Figure 11b). There are limited studies that have reported on the impact of Aza and ethylene treatments on HMs. In our previous studies, we observed that Aza treatment accelerated the flowering process of O. fragrans, inducing a change in flower color from yellow to orange [40]. This suggests that the DNA methylation inhibitor Aza induces ethylene synthesis, triggering premature opening and senescence phenotypes. The plant hormone ethylene influences various aspects of plant growth and development, including certain forms of programmed senescence, such as promoting flower opening and senescence [58,59]. Therefore, we hypothesize that the Aza or ethylene treatment can promote the expression of genes such as OfHAGs, OfHDAs and OfSDGs (Figure 11), thereby promoting the blooming and aging of O. fragrans. For example, AtJMJ12 can bind to regulatory genes of senescence, such as ETHYLENE INSENSITIVE 2 (EIN2), oxygen responsive element 1 (ORE1), NAM, ATAF1, 2, CUC2 (NAC3), NAC-like (NAP) and non-yellowing 1/2 (NYE1/2), and catalyze the demethylation of H3K27me3 in the promoter/CDS to activate gene expression and accelerate leaf senescence [60]. AtHDA5 forms a repressor complex with AtHDA6, FVE and FLD, which inhibits FLC and MAF1,2,4 (affecting flowering genes) through deacetylation of H3K9 and H3K14 lysine residues, playing a vital role in the control of flowering in Arabidopsis [26,48,54,61], especially in promoting flowering [61]. It is important to note that our results cannot conclusively identify which OfHMs are most closely associated with flower opening and senescence. Determining the core HMs involved in these processes requires further research for confirmation.

4. Materials and Methods

4.1. Identification and Chromosome Location of OfHM Gene Family

To identify members of the HM gene family in O. fragrans, various genomic data, including whole-genome data, CDS data, protein sequences and the General Feature Format version 3 (GFF3) file, were obtained from the National Center for Biotechnology Information (NCBI) database (PRJNA679852) [62]. Two methods were employed to identify members within the OfHM gene family. Firstly, hidden Markov Model (HMMER) files corresponding to specific domains (PF00583, 00850, 00856, 01853, 02146, 02373, 04433, 05185, 08214 and 09247) were acquired from the Pfam database (http://pfam.sanger.ac.uk/, accessed on 25 December 2023), following the approach of previous studies [14,16]. Additionally, an HMMER file was constructed using protein sequences encoded by four AtHDT genes, i.e., AtHDT14 (At3g44750, At5g22650, At5g03740 and At2g27840), obtained from the TAIR database (http://www.arabidopsis.org/, accessed on 25 December 2023). Subsequently, these 11 HMMER files served as queries to search the O. fragrans genome using HMMER3.0, with an E-value threshold set to <0.00001 [63]. Secondly, a total of 102 AtHM protein sequences [7] were retrieved from the TAIR website. A BLASTP alignment search was performed using these AtHM sequences as query sequences, with an expected value (E value) set at 0.00001 to identify candidate OfHMs. After eliminating redundant sequences, all candidate protein sequences were analyzed through the SMART database (http://smart.embl.de/, accessed on 28 December 2023) and the Conserved Domain Search (CDD) database (https://www.ncbi.nlm.nih.gov/Structure/bwrpsb/bwrpsb.cgi, accessed on 28 December 2023). Throughout this process, genes lacking known conserved domains were systematically excluded, resulting in the final identification of the OfHM genes. The OfHM genes, including HMTs (SDGs and PRMTs), HDMs (HDMAs and JMJs), HATs (HAGs, HAMs, HACs and HAFs) and HDACs (HDAs, SRTs and HDTs), were named according to their Chr orders, following the convention of a previous study [16].
The chromosomal location information for the OfHM genes were extracted from the O. fragrans genome, and the MG2C online tool (http://mg2c.iask.in/mg2c_v2.1/, accessed on 31 December 2023) was utilized to visually represent their chromosomal locations.

4.2. Physicochemical Characteristics Examination, Phylogenetic Tree Elaboration, and Gene Structure Research

ProtParam (https://web.expasy.org/protparam/, accessed on 13 January 2024) was employed for the analysis of the physical and chemical properties of proteins. Deep TMHMM (https://dtu.biolib.com/DeepTMHMM, accessed on 12 January 2024) was used to predict the transmembrane structure of the OfHM proteins. Additionally, the BUSCA website (http://busca.biocomp.unibo.it/, accessed on 13 January 2024) was used to predict their subcellular localization.
In conducting the phylogenetic analysis, molecular evolutionary genetics analysis (MEGA) v11.0 [64] was used to explore the phylogenetic relationships of HMs between O. fragrans and A. thaliana. The protein sequences of AtHMs and OfHMs were aligned by the MUSCLE program with default parameters. Subsequently, the resulting multiple sequence alignment files were utilized to construct phylogenetic trees with the neighbor-joining (NJ) or maximum likelihood method, with bootstrap values determined through 1000 times.
The TBtools software v2.061 [65] was employed to determine the positions of untranslated regions (UTRs), introns, CDSs and domains within the O. fragrans genome annotation file (gff3), and to visualize the gene structure. For the prediction of conserved motifs in OfHMs, the MEME website (https://meme-suite.org/meme/tools/meme, accessed on 30 December 2023) was utilized with the specified parameter motif = 20 and any number of repetitions in the site distribution. Subsequently, the identified motifs were visualized using the TBtools software [65]. The CDD database was employed to predict the conserved domains of OfHMs, and the results were visualized using the TBtools software [65].

4.3. Cis-Acting Regulatory Element Analysis of OfHM Genes

The 2000 bp base sequence upstream of the start codon (ATP) for each member of the HM gene family was extracted as the promoter region using TBtools [65]. Subsequently, Plant CARE (http://bioinformatics.psb.ugent. be/webtools/plantcare/html/, accessed on 1 January 2024) [66] was employed to predict cis-acting regulatory elements within these promoter regions. The identified cis-acting regulatory elements were then visualized using the TBtools software [65].

4.4. Tandem Duplication and Synteny Analyses

Tandem duplication and synteny relationships were explored. Tandem duplication of OfHMs genes was identified according to their physical locations in individual Chrs within the O. fragrans genome. Specifically, genes located within a 200 kb region on the Chr, exhibiting > 70% identity, were defined as tandem duplication genes [39]. Furthermore, synteny blocks among different O. fragrans Chrs were identified using the multiple collinearity scan (MCScanX) toolkit [67].
The Arabidopsis genome was obtained from the Phytozome v13 database (https://phytozome-next.jgi.doe.gov/info/Athaliana_Araport11, accessed on 14 April 2023). Collinearity maps of HM genes between the Arabidopsis and O. fragrans genomes were constructed using TBtools [65]. Additionally, DnaSP v5 [68] was utilized to calculate the Ka/Ks ratio at each site.

4.5. Protein–Protein Interaction Network Construction and Functional Enrichment Analysis of OfHM Genes

A BLASTP analysis was utilized to identify the homologous genes of OfHMs and AtHMs. Interaction pairs among the OfHMs were determined using the STRING database v12.0 (http://string-db.org, accessed on 21 January 2024). For this analysis, the network type was configured as the full STRING network, where the edges represent both functional and physical protein associations; the meaning of network edges was adjusted to reflect the confidence in thickness, indicative of the strength of the data support; and a minimum required interaction score of high confidence (>0.70) was applied to ensure the reliability of the identified interactions. The visualization of gene pairs with high confidence scores was achieved using Cytoscape v3.6.1 (http://www.cytoscape.org/, accessed on 22 January 2024). Furthermore, GO and KEGG enrichment analyses of histone methylation and acetylation genes were performed using the resources available at https://www.omicsshare.com/(accessed on 22 January 2024), respectively.

4.6. Plant Materials and Treatment

The experimental material for this study was a healthy and well-growing O. fragrans ‘Liuyejingui’ (OFL) tree located on the campus of Huazhong Agricultural University in Wuhan, Hubei, China (114°21′ W, 30°29′ N), as detailed by Chen et al. [62]. Various tissues, including roots, stems and leaves, were collected from the same tree, alongside samples from different stages of flowering (S1: linggeng stage, characterized by closed flower buds; S2: initial flowering stage, where flowers exhibit a slight opening with a petal angle of less than 45°; S3: early stage of full flowering, with flowers partially open and petal angles ranging from 45 to 90°; S4: full stage of flowering, where petals are fully expanded; S5: late stage of full flowering, marked by petals slightly losing turgor and darker pollen color; and S6: stage of abscission, during which petals lose turgor and undergo natural abscission) [62]. Detached branches that carried floral buds at stage S1 were treated with 200 mL of 10 mM 5′-azacytidine (Aza) or 500 mg L−1 ethephon (dissolved in ddH2O). In contrast, as a control, flowering branches were sprayed with 200 mL of ddH2O alone [40]. The spray treatment was repeated at 3-day intervals, specifically targeting flowers at stages S1, S3 and S5. Three independent biological replicates were performed for each treatment.

4.7. Identification of OfHM Expression Profiles Using High-Throughput Sequencing

Total RNA was extracted using TRIzol reagent (Invitrogen Co., Carlsbad, CA, USA) following the manufacturer’s protocol. RNA-seq libraries were prepared using the SMARTer cDNA synthesis kit (Clontech Laboratories, Mountain View, CA, USA), and subsequently processed on the MGI-SEQ 2000 platform (Frasergen Bioinformatics Co., Ltd., Wuhan, Hubei, China). Genes with FPKMmax values greater than 1 were selected from the O. fragrans samples. The FPKM data were then converted into TPM (transcripts per kilobase of exon model per million mapped reads) data, and the limma package [69] was applied to screen for differentially expressed genes (DEGs) between groups. The default filtering threshold for DEGs was set at |log2FoldChange| > 1 and q-value < 0.05. The generated heatmaps were visualized using the heatmap tool on https://cloud.oebiotech.com (accessed on 31 January 2024). This visualization process involved Z-score normalization and clustering of the row data, ensuring an accurate representation of the underlying patterns and trends within the dataset.

4.8. qRT-PCR Analysis of OfHM Genes

A total of 6 OfHMs, selected for their high expression from different gene families, underwent assessment of their expression levels at various stages of flowering using qRT-PCR. The qRT-PCR was performed using the Applied Biosystems 7500 Sequence Detection System (ABI7500; Thermo Fisher Scientific, Inc., Waltham, MA, USA). The primers sequences for qRT-PCR were designed using Prime Premier 5 (Table S5). The qRT-PCR reaction mixture, with a total volume of 15 μL, included 2 μL of cDNA, 0.8 μL of each forward and reverse primers, 10 μL of SYBR Mix and 6.4 μL of ddH2O. The expression level of OfRAN1 served as the reference, and qRT-PCR amplification was carried out under the following conditions: 94 °C for 30 s, followed by 40 cycles of 94 °C for 10 s and 60 °C for 30 s. Gene relative expression levels were calculated using the 2−ΔΔCT method [70], with each analysis comprising four replicates. The normalized log2 fold change for each gene was calculated using both RNA-seq and qRT-PCR data, with S1 data serving as the reference. Subsequently, linear fitting was applied to the RNA-seq and qRT-PCR datasets, and the correlation index (R2) was computed.

5. Conclusions

In this study, we systematically identified HM genes within the O. fragrans genome, providing comprehensive insights into their chromosomal location, gene structure, phylogenetic relationships and protein–protein interactions. Utilizing high-throughput RNA-seq data, we examined the expression patterns of these genes across the flower opening and senescence stages, various tissues, and in response to specific treatments. The comprehensive findings derived from our research offer a thorough understanding of OfHMs, contributing not only to the study of biological theory, but also laying the groundwork for future in-depth analyses.

Supplementary Materials

The following supporting information can be downloaded at: https://www.mdpi.com/article/10.3390/plants13060777/s1, Figure S1: The chromosomal localization of histone modification genes in Osmanthus fragrans; Figure S2: Heatmaps illustrating the expression of histone methylation genes from O. fragrans across various tissues and flowering stages; Figure S3: Heatmaps illustrating the expression of histone acetylation genes from O. fragrans across various tissues and the flowering stages; Table S1: Detailed information and physicochemical properties of OfHMs; Table S2: The Ka/Ks values of segmental and tandem duplications between OfHMs; Table S3: The Ka/Ks values of segmental duplications between OfHMs and AtHMs; Table S4: Differentially expressed OfHMs detected under Aza or ethylene treatment; Table S5: Gene primers used in the study.

Author Contributions

Conceptualization, J.Y. and J.Z.; methodology, X.C. (Xuan Cai); software, H.X.; validation, H.X. and Y.Z.; formal analysis, X.C. (Xuan Cai); investigation, X.Z.; resources, Z.L.; data curation, X.C. (Xiang Chen); writing—original draft, H.X.; writing—review and editing, Y.Z.; visualization, H.X.; supervision, H.C.; project administration, J.Y. and J.Z.; funding acquisition, J.Z., X.Z., X.C. (Xiang Chen) and Z.L. All authors have read and agreed to the published version of the manuscript.

Funding

This research was funded by the National Natural Science Foundation of China (32271951, 32101581, and 32372754), Hubei Provincial Central Leading Local Special Project (2022BGE263), Hubei Province Natural Science Foundation (2023AFB1063), Innovation Team Project from Hubei University of Science and Technology (2022T02) and a PhD grant from Hubei University of Science and Technology (BK202002).

Data Availability Statement

Data are contained within the article and Supplementary Materials.

Acknowledgments

The authors express their sincere gratitude to Qingyong Yang from Huazhong Agricultural University, China, for his invaluable assistance in acquiring the Osmanthus fragrans data.

Conflicts of Interest

The authors declare no conflicts of interest.

References

  1. Pfluger, J.; Wagner, D. Histone modifications and dynamic regulation of genome accessibility in plants. Curr. Opin. Plant Biol. 2007, 10, 645–652. [Google Scholar] [CrossRef] [PubMed]
  2. Wang, L.; Ahmad, B.; Liang, C.; Shi, X.; Sun, R.; Zhang, S.; Du, G. Bioinformatics and expression analysis of histone modification genes in grapevine predict their involvement in seed development, powdery mildew resistance, and hormonal signaling. BMC Plant Biol. 2020, 20, 412. [Google Scholar] [CrossRef] [PubMed]
  3. Liu, Y.; Wang, J.; Liu, B.; Xu, Z.Y. Dynamic regulation of DNA methylation and histone modifications in response to abiotic stresses in plants. J. Integr. Plant Biol. 2022, 64, 23. [Google Scholar] [CrossRef] [PubMed]
  4. Strahl, B.D.; Allis, C.D. David The language of covalent histone modifications. Nature 2000, 403, 41. [Google Scholar] [CrossRef] [PubMed]
  5. Klose, R.J.; Zhang, Y. Regulation of histone methylation by demethylimination and demethylation. Nat. Rev. Mol. Cell Biol. 2007, 8, 307–318. [Google Scholar] [CrossRef]
  6. Lusser, A.; Kolle, D.; Loidl, P. Histone acetylation: Lessons from the plant kingdom. Trends Plant Sci. 2001, 6, 59–65. [Google Scholar] [CrossRef] [PubMed]
  7. Pandey, R.; Müller, A.; Napoli, C.A.; Selinger, D.A.; Pikaard, C.S.; Richards, E.J.; Bender, J.; Mount, D.W.; Jorgensen, R.A. Analysis of histone acetyltransferase and histone deacetylase families of Arabidopsis thaliana suggests functional diversification of chromatin modification among multicellular eukaryotes. Nucleic Acids Res. 2002, 30, 5036–5055. [Google Scholar] [CrossRef]
  8. Fan, S.; Wang, J.; Lei, C.; Gao, C.; Yang, Y.; Li, Y.; An, N.; Zhang, D.; Han, M. Identification and characterization of histone modification gene family reveal their critical responses to flower induction in apple. BMC Plant Biol. 2018, 18, 173. [Google Scholar] [CrossRef]
  9. Verdone, L.; Caserta, M.; Mauro, E.D. Role of histone acetylation in the control of gene expression. Biochem. Cell Biol. 2005, 83, 344–353. [Google Scholar] [CrossRef]
  10. Chen, Z.J.; Tian, L. Roles of dynamic and reversible histone acetylation in plant development and polyploidy. BBA-Gene Struct. Expr. 2007, 1769, 295–307. [Google Scholar] [CrossRef]
  11. Fu, W.; Wu, K.; Duan, J. Sequence and expression analysis of histone deacetylases in rice. Biochem. Biophys. Res. Commun. 2007, 356, 843–850. [Google Scholar] [CrossRef] [PubMed]
  12. Zhang, X.; Bernatavichute, Y.V.; Cokus, S.; Jacobsen, P.S.E. Genome-wide analysis of mono-, di- and trimethylation of histone H3 lysine 4 in Arabidopsis thaliana. Genome Biol. 2009, 10, R62. [Google Scholar] [CrossRef] [PubMed]
  13. Peláez, I.M.; Kalogeropoulou, M.; Ferraro, A.; Voulgari, A.; Pankotai, T.; Boros, I.; Pintzas, A. Oncogenic RAS alters the global and gene-specific histone modification pattern during epithelial-mesenchymal transition in colorectal carcinoma cells. Int. J. Biochem. Cell Biol. 2010, 42, 911–920. [Google Scholar] [CrossRef] [PubMed]
  14. Aiese Cigliano, R.; Sanseverino, W.; Cremona, G.; Ercolano, M.R.; Consiglio, F.M. Genome-wide analysis of histone modifiers in tomato: Gaining an insight into their developmental roles. BMC Genom. 2013, 14, 57. [Google Scholar] [CrossRef] [PubMed]
  15. Manjun, P.; Peiyuan, Y.; Xuncheng, L.; Caiqin, L.; Rui, X.; Jianguo, L.; Minglei, Z. Genome-wide identification of histone modifiers and their expression patterns during fruit abscission in litchi. Front. Plant Sci. 2017, 8, 639. [Google Scholar]
  16. Xu, J.; Xu, H.; Liu, Y.; Wang, X.; Xu, Q.; Deng, X. Genome-wide identification of sweet orange (Citrus sinensis) histone modification gene families and their expression analysis during the fruit development and fruit-blue mold infection process. Front. Plant Sci. 2015, 6, 607. [Google Scholar] [CrossRef] [PubMed]
  17. Liu, X.; Luo, M.; Zhang, W.; Zhao, J.; Zhang, J.; Wu, K.; Tian, L.; Duan, J. Histone acetyltransferases in rice (Oryza sativa L.): Phylogenetic analysis, subcellular localization and expression. BMC Plant Biol. 2012, 12, 145. [Google Scholar] [CrossRef]
  18. Gu, T.; Han, Y.; Huang, R.; McAvoy, R.J.; Li, Y. Identification and characterization of histone lysine methylation modifiers in Fragaria vesca. Sci. Rep. 2016, 6, 23581. [Google Scholar] [CrossRef]
  19. Alinsug, M.V.; Yu, C.; Wu, K. Phylogenetic analysis, subcellular localization, and expression patterns of RPD3/HDA1 family histone deacetylases in plants. BMC Plant Biol. 2009, 9, 37. [Google Scholar] [CrossRef]
  20. Thorstensen, T.; Grini, P.E.; Aalen, R.B. SET domain proteins in plant development. BBA-Gene Regul. Mech. 2011, 1809, 407–420. [Google Scholar] [CrossRef]
  21. Liu, X.C.; Yang, S.G.; Zhao, M.L.; Luo, M.; Yu, C.W.; Chen, C.Y.; Tai, R.; Wu, K. Transcriptional repression by histone deacetylases in plants. Mol. Plant. 2014, 7, 764–772. [Google Scholar] [CrossRef] [PubMed]
  22. Li, Y.; Mukherjee, I.; Thum, K.E.; Tanurdzic, M.; Katari, M.S.; Obertello, M.; Edwards, M.B.; McCombie, W.R.; Martienssen, R.A.; Coruzzi, G.M. The histone methyltransferase SDG8 mediates the epigenetic modification of light and carbon responsive genes in plants. Genome Biol. 2015, 16, 79. [Google Scholar] [CrossRef] [PubMed]
  23. Tanaka, M.; Kikuchi, A.; Kamada, H. The Arabidopsis histone deacetylases HDA6 and HDA19 contribute to the repression of embryonic properties after germination. Plant Physiol. 2008, 146, 149–161. [Google Scholar] [CrossRef] [PubMed]
  24. Xiao, J.; Zhang, H.; Xing, L.; Xu, S.; Liu, H.; Chong, K.; Xu, Y. Requirement of histone acetyltransferases HAM1 and HAM2 for epigenetic modification of FLC in regulating flowering in Arabidopsis. J. Plant Physiol. 2013, 170, 444–451. [Google Scholar] [CrossRef] [PubMed]
  25. Deng, W.; Liu, C.; Pei, Y.; Deng, X.; Niu, L.; Cao, X. Involvement of the histone acetyltransferase AtHAC1 in the regulation of flowering time via repression of FLOWERING LOCUS C in Arabidopsis. Plant Physiol. 2007, 143, 1660–1668. [Google Scholar] [CrossRef]
  26. Wu, K.; Zhang, L.; Zhou, C.; Yu, C.; Chaikam, V. HDA6 is required for jasmonate response, senescence and flowering in Arabidopsis. J. Exp. Bot. 2008, 59, 225–234. [Google Scholar] [CrossRef] [PubMed]
  27. Kim, W.; Latrasse, D.; Servet, C.; Zhou, D. Arabidopsis histone deacetylase HDA9 regulates flowering time through repression of AGL19. Biochem. Biophys. Res. Commun. 2013, 432, 394–398. [Google Scholar] [CrossRef] [PubMed]
  28. Ning, Y.Q.; Chen, Q.; Lin, R.N.; Li, Y.Q.; Li, L.; Chen, S.; He, X.J. The HDA19 histone deacetylase complex is involved in the regulation of flowering time in a photoperiod-dependent manner. Plant J. 2019, 98, 448–464. [Google Scholar] [CrossRef]
  29. Yang, H.; Mo, H.; Fan, D.; Cao, Y.; Cui, S.; Ma, L. Overexpression of a histone H3K4 demethylase, JMJ15, accelerates flowering time in Arabidopsis. Plant Cell Rep. 2012, 31, 1297–1308. [Google Scholar] [CrossRef]
  30. Yang, H.; Han, Z.; Cao, Y.; Fan, D.; Li, H.; Mo, H.; Feng, Y.; Liu, L.; Wang, Z.; Yue, Y. A companion cell-dominant and developmentally regulated H3K4 demethylase controls flowering time in Arabidopsis via the repression of FLC expression. PLoS Genet. 2012, 8, e1002664. [Google Scholar] [CrossRef]
  31. Ning, Y.; Ma, Z.; Huang, H.; Mo, H.; Zhao, T.; Li, L.; Cai, T.; Chen, S.; Ma, L.; He, X. Two novel NAC transcription factors regulate gene expression and flowering time by associating with the histone demethylase JMJ14. Nucleic Acids Res. 2015, 43, 1469–1484. [Google Scholar] [CrossRef] [PubMed]
  32. Li, Y.; Qiu, L.; Huang, L.; Cao, J. BcJMJ30, the gene encoding jmjC domain-containing histone demethylase is associated with pollen development and fertilization in Brassica campestris ssp. chinensis. Plant Mol. Biol. Rep. 2011, 30, 529–538. [Google Scholar] [CrossRef]
  33. Berr, A.; Xu, L.; Gao, J.; Cognat, V.R.; Steinmetz, A. SET DOMAIN GROUP25 encodes a histone methyltransferase and is involved in FLOWERING LOCUS C activation and repression of flowering. Plant Physiol. 2009, 151, 1476–1485. [Google Scholar] [CrossRef] [PubMed]
  34. Wang, L.M.; Li, M.T.; Jin, W.W.; Li, S.; Zhang, S.Q.; Yu, L.J. Variations in the components of Osmanthus fragrans Lour. essential oil at different stages of flowering. Food Chem. 2009, 114, 233–236. [Google Scholar] [CrossRef]
  35. Wu, L.; Liu, J.; Huang, W.; Wang, Y.; Chen, Q.; Lu, B. Exploration of Osmanthus fragrans Lour.’s composition, nutraceutical functions and applications. Food Chem. 2021, 377, 131853. [Google Scholar] [CrossRef] [PubMed]
  36. Wang, B.; Luan, F.; Bao, Y.; Peng, X.; Rao, Z.; Tang, Q.; Zeng, N. Traditional uses, phytochemical constituents and pharmacological properties of Osmanthus fragrans: A review. J. Ethnopharmacol. 2022, 293, 115273. [Google Scholar] [CrossRef]
  37. Zou, J.; Cai, X.; Wang, C. The spatial and temporal distribution of programmed cell death (PCD) during petal senescence of Osmanthus fragrans. Acta Hortic. 2017, 1185, 315–324. [Google Scholar] [CrossRef]
  38. Zou, J.J.; Zhou, Y.; Cai, X.; Wang, C.Y. Increase in DNA fragmentation and the role of ethylene and reactive oxygen species in petal senescence of Osmanthus fragrans. Postharvest Biol. Technol. 2014, 93, 97–105. [Google Scholar] [CrossRef]
  39. Cannon, S.B.; Mitra, A.; Baumgarten, A.; Young, N.D.; May, G. The roles of segmental and tandem gene duplication in the evolution of large gene families in Arabidopsis thaliana. BMC Plant Biol. 2004, 4, 10. [Google Scholar] [CrossRef]
  40. Zou, J.J.; Cai, X.; Yang, J.; Zeng, X.; Liu, D.X.; Huang, S.; Chen, X.; Yang, Q.Y.; Wang, C.; Chen, H. DNA hypomethylation mediates flower opening and senescence in sweet osmanthus through auxin and ethylene responsive pathways. Postharvest Biol. Technol. 2023, 198, 112250. [Google Scholar] [CrossRef]
  41. Zheng, S.; Hu, H.; Ren, H.; Yang, Z.; Qiu, Q.; Qi, W.; Liu, X.; Chen, X.; Cui, X.; Li, S. The Arabidopsis H3K27me3 demethylase JUMONJI 13 is a temperature and photoperiod dependent flowering repressor. Nat. Commun. 2019, 10, 1033. [Google Scholar] [CrossRef]
  42. Kendall, M.; Colijn, C. Mapping phylogenetic trees to reveal distinct patterns of evolution. Mol. Biol. Evol. 2016, 33, 2735–2743. [Google Scholar] [CrossRef] [PubMed]
  43. Li, J.; Zhang, Z.; Vang, S.; Yu, J.; Wong, K.S.; Wang, J. Correlation between Ka/Ks and Ks is related to substitution model and evolutionary lineage. J. Mol. Evol. 2009, 68, 414–423. [Google Scholar] [CrossRef] [PubMed]
  44. Wong, D.C.; Sweetman, C.; Ford, C.M. Annotation of gene function in citrus using gene expression information and co-expression networks. BMC Plant Biol. 2014, 14, 186. [Google Scholar] [CrossRef] [PubMed]
  45. Thomas, J.; Bowman, M.J.; Vega, A.; Kim, H.R.; Mukherjee, A. Comparative transcriptome analysis provides key insights into gene expression pattern during the formation of nodule-like structures in Brachypodium. Funct. Integr. Genom. 2018, 18, 315–326. [Google Scholar] [CrossRef] [PubMed]
  46. Zheng, L.; Ma, S.; Shen, D.; Fu, H.; Huang, J. Genome-wide identification of Gramineae histone modification genes and their potential roles in regulating wheat and maize growth and stress responses. BMC Plant Biol. 2021, 21, 543. [Google Scholar] [CrossRef] [PubMed]
  47. Deng, X.; Gu, L.; Liu, C.; Lu, T.; Lu, F.; Lu, Z.; Cui, P.; Pei, Y.; Wang, B.; Hu, S.; et al. Arginine methylation mediated by the Arabidopsis homolog of PRMT5 is essential for proper pre-mRNA splicing. Proc. Natl. Acad. Sci. India Sect. B 2010, 107, 19114–19119. [Google Scholar] [CrossRef]
  48. Jiang, D.; Yang, W.; He, Y.; Amasino, R.M. Arabidopsis relatives of the human lysine-specific demethylase1 repress the expression of FWA and FLOWERING LOCUS C and thus promote the floral transition. Plant Cell 2007, 19, 2975–2987. [Google Scholar] [CrossRef]
  49. Li, C.; Huang, L.; Xu, C.; Zhao, Y.; Zhou, D.X. Altered levels of histone deacetylase OsHDT1 affect differential gene expression patterns in hybrid rice. PLoS ONE 2011, 6, e21789. [Google Scholar] [CrossRef]
  50. Zhong, X.; Zhang, H.; Zhao, Y.; Sun, Q.; Hu, Y.; Peng, H.; Zhou, D.X. The rice NAD+-dependent histone deacetylase OsSRT1 targets preferentially to stress- and metabolism-related genes and transposable elements. PLoS ONE 2013, 8, e66807. [Google Scholar] [CrossRef]
  51. Saleh, A.; Alvarez-Venegas, R.; Yilmaz, M.; Le, O.; Hou, G.; Sadder, M.; Al-Abdallat, A.; Xia, Y.; Lu, G.; Ladunga, I. The highly similar Arabidopsis homologs of trithorax ATX1 and ATX2 encode proteins with divergent biochemical functions. Plant Cell 2008, 20, 568–579. [Google Scholar] [CrossRef]
  52. Tamada, Y.; Yun, J.Y.; Woo, S.C.; Amasino, R.M. ARABIDOPSIS TRITHORAX-RELATED7 is required for methylation of lysine 4 of histone H3 and for transcriptional activation of FLOWERING LOCUS C. Plant Cell 2009, 21, 3257–3269. [Google Scholar] [CrossRef] [PubMed]
  53. Heo, J.B.; Sung, S. Vernalization-mediated epigenetic silencing by a long intronic noncoding RNA. Science 2011, 331, 76–79. [Google Scholar] [CrossRef] [PubMed]
  54. Luo, M.; Tai, R.; Yu, C.W.; Yang, S.; Chen, C.Y.; Lin, W.D.; Schmidt, W.; Wu, K. Regulation of flowering time by the histone deacetylase HDA 5 in Arabidopsis. Plant J. 2015, 82, 925–936. [Google Scholar] [CrossRef] [PubMed]
  55. Gan, E.S.; Xu, Y.; Wong, J.Y.; Geraldine Goh, J.; Sun, B.; Wee, W.Y.; Huang, J.; Ito, T. Jumonji demethylases moderate precocious flowering at elevated temperature via regulation of FLC in Arabidopsis. Nat. Commun. 2014, 5, 5098. [Google Scholar] [CrossRef] [PubMed]
  56. Dutta, A.; Choudhary, P.; Caruana, J.; Raina, R. JMJ27, an Arabidopsis H3K9 histone demethylase, modulates defense against Pseudomonas syringae and flowering time. Plant J. 2017, 91, 1015–1028. [Google Scholar] [CrossRef] [PubMed]
  57. Hung, F.Y.; Lai, Y.C.; Wang, J.; Feng, Y.R.; Wu, K. The Arabidopsis histone demethylase JMJ28 regulates CONSTANS by interacting with FBH transcription factors. Plant Cell 2021, 33, 1196–1211. [Google Scholar] [CrossRef] [PubMed]
  58. Han, B.S. Flowering induction of Guzmania by ethylene. Sci. Hortic. 2006, 110, 104–108. [Google Scholar]
  59. Grbi, V.; Bleecker, A.B. Ethylene regulates the timing of leaf senescence in Arabidopsis. Plant J. 1995, 8, 595–602. [Google Scholar] [CrossRef]
  60. Wang, X.; Gao, J.; Gao, S.; Song, Y.; Yang, Z.; Kuai, B. The H3K27me3 demethylase REF6 promotes leaf senescence through directly activating major senescence regulatory and functional genes in Arabidopsis. PLoS Genet. 2019, 15, e1008068. [Google Scholar] [CrossRef]
  61. Yu, C.; Liu, X.; Luo, M.; Chen, C.; Lin, X.; Tian, G.; Lu, Q.; Cui, Y.; Wu, K. HISTONE DEACETYLASE6 interacts with FLOWERING LOCUS D and regulates flowering in Arabidopsis. Plant Physiol. 2011, 156, 173–184. [Google Scholar] [CrossRef] [PubMed]
  62. Chen, H.; Zeng, X.; Yang, J.; Cai, X.; Shi, Y.; Zheng, R.; Wang, Z.; Liu, J.; Yi, X.; Xiao, S.; et al. Whole-genome resequencing of Osmanthus fragrans provides insights into flower color evolution. Hortic. Res. 2021, 8, 98. [Google Scholar] [CrossRef] [PubMed]
  63. Finn, R.D.; Clements, J.; Eddy, S.R. HMMER web server: Interactive sequence similarity searching. Nucleic Acids Res. 2011, 39, 29–37. [Google Scholar] [CrossRef] [PubMed]
  64. Tamura, K.; Stecher, G.; Peterson, D.; Filipski, A.; Kumar, S. MEGA6: Molecular evolutionary genetics analysis version 6.0. Mol. Biol. Evol. 2013, 30, 2725–2729. [Google Scholar] [CrossRef] [PubMed]
  65. Chen, C.; Chen, H.; Zhang, Y.; Thomas, H.R.; Xia, R. TBtools: An integrative toolkit developed for interactive analyses of big biological data. Mol. Plant. 2020, 13, 1194–1202. [Google Scholar] [CrossRef] [PubMed]
  66. Lescot, M.; Déhais, P.; Thijs, G.; Marchal, K.; Moreau, Y.; de Peer, Y.V.; Rouzé, P.; Rombauts, S. PlantCARE, a database of plant cis-acting regulatory elements and a portal to tools for in silico analysis of promoter sequences. Nucleic Acids Res. 2002, 30, 325–327. [Google Scholar] [CrossRef] [PubMed]
  67. Wang, Y.; Tang, H.; DeBarry, J.D.; Tan, X.; Li, J.; Wang, X.; Lee, T.; Jin, H.; Marler, B.; Guo, H.; et al. MCScanX: A toolkit for detection and evolutionary analysis of gene synteny and collinearity. Nucleic Acids Res. 2012, 40, e49. [Google Scholar] [CrossRef]
  68. Librado, P.; Rozas, J. DnaSP v5: A software for comprehensive analysis of DNA polymorphism data. Bioinformatics 2009, 25, 1451–1452. [Google Scholar] [CrossRef]
  69. Smyth, G.K. limma: Linear models for microarray data. In Bioinformatics and Computational Biology Solutions Using R and Bioconductor, 1st ed.; Gentleman, R., Carey, V.J., Huber, W., Irizarry, R.A., Dudoit, S., Eds.; Springer: New York, NY, USA, 2005; pp. 397–420. [Google Scholar]
  70. Livak, K.J.; Schmittgen, T.D. Analysis of relative gene expression data using real-time quantitative PCR. Methods 2002, 25, 402–408. [Google Scholar] [CrossRef]
Figure 1. Phylogenetic analysis of histone modification (HM) genes between O. fragrans and Arabidopsis. (a) Histone methyltransferases (HMTs). Triangle symbols represent SET domain group (SDG) genes, and square symbols represent protein arginine methyltransferase (PRMT) genes. Solid symbols represent O. fragrans genes and hollow symbols represent Arabidopsis genes. I–VII represent the different types of SDG genes, and “a” and “b” represent different types of PRMT genes. (b) Histone demethylases (HDMs). Circle symbols represent SWIRM and C-terminal domain (HDMA) genes, and square symbols represent JmjC domain protein family (JMJ) genes. Solid symbols represent O. fragrans genes, and hollow symbols represent Arabidopsis genes. Different colored squares represent the various types of JMJ genes. (c) Histone demethylases (HDMAs) and (d) histone deacetylases (HDACs). Solid circles represent O. fragrans genes and hollow circles denote Arabidopsis genes. Different colors represent genes from different gene families.
Plants 13 00777 g001
Figure 2. The domain, conserved structure and motif analyses of histone methylation modification genes in O. fragrans. (a) OfPRMTs; (b) OfSDGs. I–VII, represent different types of OfSDG genes. (c) OfHDMs. OfHDMs include OfHDMAs and OfJMJs.
Plants 13 00777 g002
Figure 3. The analysis of domains, conserved structures and motifs of histone acetylation modification genes in O. fragrans. (a) OfHAGs (GCN5-, ELP3- and HAT1-like histone acetylases); (b) OfHAMs (MOZ-YBF2 (MYST) domain), OfHACs (HAT_KAT11 domain) and OfHAFs (TATA binding protein-related factor TAF); and (c) OfHDMs. II, IV, and I, represent different types of OfHDM genes.
Plants 13 00777 g003
Figure 4. Analysis of cis-acting elements in the promoters of histone methylation modification genes. (a) OfHMTs and (b) OfHDMs. The figure on the left shows the different cis-acting elements, which are represented by boxes in different columns. The picture on the right provides the statistics regarding the number of each of the four kinds of cis-acting elements in the OfHM promoters.
Plants 13 00777 g004
Figure 5. Analysis of cis-acting elements in the promoters of histone acetylation modification genes. (a) OfHATs and (b) OfHDACs. The figure on the left shows the different cis-acting elements, which are represented by boxes in different columns. The picture on the right provides the statistics regarding the number of each of the four kinds of cis-acting elements in the OfHM promoters.
Plants 13 00777 g005
Figure 6. Gene collinearity analysis. (a) Synteny of OfHMs genes in the O. fragrans genome. Colored lines connecting two genes indicate syntenic regions. (b) Synteny of HM genes between O. fragrans and Arabidopsis genomes. Colored lines connecting two genes indicate syntenic regions.
Plants 13 00777 g006
Figure 7. Functional enrichment analysis of OfHM genes. (a) GO enrichment analysis of histone methylation genes. The top 20 pathways with a gene number greater than 5 are shown. The x-axis represents -log10(p-value) and the y-axis represents the enriched GO terms. (b) KEGG analysis of histone methylation genes; (c) KEGG analysis of histone acetylation genes. In these analyses, the colors and sizes of the dots correspond to the significance (p) and the number of genes, respectively.
Plants 13 00777 g007
Figure 8. Interaction analysis of OfHM proteins. Circles represent genes, and lines represent OfHM gene pairs that may interact.
Plants 13 00777 g008
Figure 9. Heatmaps depicting the expression patterns of differentially expressed OfHMs in various tissues. (a) OfPRMTs; (b) OfSDGs; (c) OfHDMAs; (d) OfJMJs; (e) OfHAGs; (f) OfHAMs; (g) OfHACs; (h) OfHDAs; (i) OfHDTs (HD2); and (j) OfSRTs (silent information regulator 2). The differently colored squares represent the genes, with red and blue representing high and low expression levels.
Plants 13 00777 g009
Figure 10. Heatmaps depicting the expression patterns of differentially expressed OfHMs during the process of flower opening and senescence. (a) OfPRMTs; (b) OfSDGs; (c) OfJMJs; (d) OfHDMAs; (e) OfHAGs; (f) OfHAMs, OfHACs, OfHDAs, OfHDTs and OfSRTs. The differently colored squares within the heatmaps represent the genes, with red and blue representing high and low expression levels.
Plants 13 00777 g010
Figure 11. Heatmaps depicting the expression patterns of differentially expressed OfHMs in response to Aza or ethylene treatment. (a) After Aza treatment; (b) after ethylene treatment. The differently colored squares represent the genes, with red and blue representing high and low expression levels.
Plants 13 00777 g011
Figure 12. The expression levels of OfHMs were validated utilizing quantitative real-time polymerase chain reaction (qRT-PCR). (a) OfJMJ19; (b) OfSRT3; (c) OfSDG55; (d) OfHDT7; (e) OfHDMA4; and (f) OfHAG9. The x-axis represents the different flowering stages, including S1, S2, S3, S4 and S6. The right and left y-axes represent the fragments per kilobase of exon model per million mapped fragments (FPKM) values and the relative expression levels (REL), respectively. The values are presented as the mean ± standard deviation. (g) A linear fitting analysis was performed on the qRT-PCR and FPKM data. The x-axis represents the qRT-PCR data, and the y-axis represents the FPKM data.
Plants 13 00777 g012
Disclaimer/Publisher’s Note: The statements, opinions and data contained in all publications are solely those of the individual author(s) and contributor(s) and not of MDPI and/or the editor(s). MDPI and/or the editor(s) disclaim responsibility for any injury to people or property resulting from any ideas, methods, instructions or products referred to in the content.

