Article

Effects of Long-Term Controlled-Release Urea on Soil Greenhouse Gas Emissions in an Open-Field Lettuce System

1
Institute of Plant Nutrition, Resources and Environment, Beijing Academy of Agriculture and Forestry Sciences, Beijing 100097, China
2
Beijing Engineering Technology Research Center for Slow, Controlled-Release Fertilizer, Beijing 100097, China
3
College of Land and Resources, Hebei Agricultural University, Baoding 071001, China
*
Authors to whom correspondence should be addressed.
Plants 2024, 13(8), 1071; https://doi.org/10.3390/plants13081071
Submission received: 16 November 2023 / Revised: 2 January 2024 / Accepted: 11 January 2024 / Published: 10 April 2024
(This article belongs to the Special Issue Advances in Plant Nutrition and Novel Fertilizers)

Abstract

:
Controlled-release urea (CRU) fertilizers are widely used in agricultural production to reduce conventional nitrogen (N) fertilization-induced agricultural greenhouse gas emissions (GHGs) and improve N use efficiency (NUE). However, the long-term effects of different CRU fertilizers on GHGs and crop yields in vegetable fields remain relatively unexplored. This study investigated the variations in GHG emissions at four growth stages of lettuce in the spring and autumn seasons based on a five-year field experiment in the North China Plain. Four treatments were setup: CK (without N application), U (conventional urea—N application), ON (20% reduction in urea—N application), CRU (20% reduction in polyurethane-coated urea without topdressing), and DCRU (20% reduction in polyurethane-coated urea containing dicyandiamide [DCD] without topdressing). The results show that N application treatments significantly increased the GHG emissions and the lettuce yield and net yield, and DCRU exhibited the lowest N2O and CO2 emissions, the highest lettuce yield and net yield, and the highest lettuce N content of the N application treatments. When compared to U, the N2O emission peak under CRU and DCRU treatments was notably decreased and delayed, and their average N2O emission fluxes were significantly reduced by 10.20–20.72% and 17.51–29.35%, respectively, leading to a significant reduction in mean cumulative N2O emissions during the 2017–2021 period. When compared to U, the CO2 fluxes of DCRU significantly decreased by 8.0–16.54% in the seedling period, and mean cumulative CO2 emission decreased by 9.28%. Moreover, compared to U, the global warming potential (GWP) and greenhouse gas intensity (GHGI) of the DCRU treatment was significantly alleviated by 9.02–17.13% and 16.68–20.36%, respectively. Compared to U, the N content of lettuce under DCRU was significantly increased by 6.48–17.25%, and the lettuce net yield was also significantly increased by 5.41–7.71%. These observations indicated that the simple and efficient N management strategy to strike a balance between enhancing lettuce yields and reduce GHG emissions in open-field lettuce fields could be obtained by applying controlled-release urea containing DCD without topdressing.

1. Introduction

As an important part of the terrestrial ecosystem, agroecosystems are a major source of global greenhouse gas (GHG) emissions [1], including nitrous oxide (N2O), methane (CH4), and carbon dioxide (CO2), accounting for 14–17% of global directly anthropogenic GHG emissions [2,3,4]. The contribution of these GHGs depends on their global warming potentials and atmospheric lifespans. Specifically, CO2 is the leading contributor to climate change, while non-CO2 GHGs (N2O and CH4) also play a crucial role despite their lower emissions. N2O has 298 times the global warming potential of CO2 based on a 100-year timescale [2,5]. GHG emissions from croplands depend on both environmental variations associated with climate and soil type and agricultural management such as tillage, fertilization and irrigation [6,7]. The excessive use of nitrogen (N) fertilizer has improved crop yields [8], but has also become the largest contributor of GHGs from farmland, accounting for more than 25% of total global N2O emissions [9,10]. Hence, there exists an urgent need to develop optimized N fertilization strategies that can mitigate GHG emissions without detrimental impacts on crop yields [5,11].
Many studies have suggested that controlled-release urea (CRU), a newly developed long-acting N fertilizer, could be adopted as an optimal N management practice to improve N use efficiency (NUE), increase crop yields, and reduce GHG emissions. CRU can better match fertilizer nutrient release with crop uptake without additional topdressing [10,12,13]. Previous meta-analyses indicated that CRU could be applied once as basal fertilizer with no effect on grain yields while reducing reactive N losses by 49% worldwide [14], thus decreasing the use of N fertilizer and promoting time- and labor-saving crop production [15,16]. The advantageous effects of CRU on grain yield and NUE depend largely on the synchronization of the N release rate with the N requirements of crops [10]. The application of CRU slows down the release of available N through its physical coating, influences soil NH4+-N and NO3-N content and C/N ratio [17], and alters the structure and activity of the soil microbial community [18]. This may affect soil C and N cycling and then alter CO2 and/or reduce N2O emissions [12,18]. Although the coated material can control the release rate of nutrients, it cannot control the transformation of dissolved urea in soil, thereby still causing some N losses [13].
The combined application of an nitrification inhibitor (NI) and urea is another way to reduce N2O emissions, which can control N transformation in soil and improve the NUE [19,20,21]. Dicyandiamide (DCD) is the most widely used NI with relatively low volatility. Previous studies demonstrated that DCD reduced the N2O emission by suppressing nitrification and denitrification in soil [19,22,23,24]. Additionally, a three-year field experiment indicated that the application of DCD reduced CO2 emissions by 7% [25]. Ahmed et al. [3] reported that urea applied with 1.5% DCD decreased the CO2 and N2O emissions in soil by 22–172% and up to 94-fold, respectively, compared with those under conventional N fertilizer application. However, the performance and stability of DCD and the transformation of dissolved urea released from CRU vary with soil properties such as soil temperature, pH, and water content [26,27]. Fan et al. [19] confirmed that the CRU amended with 3,4-dimethylpyrazole phosphate (DMPP) could reduce the GHG emissions of open-field vegetables, and that the mitigation effect was made more significant by combining CRU with DMPP. Ge et al. [27] confirmed that the application of CRU and DCD led to significant improvement in wheat yield and NUE, the effect of which was more pronounced under the synergistic use of resin-coated urea and NI.
Vegetable production usually involves intensive fertilization with high N loss potential and contributes to 9% of global cropland N2O emissions [28]. China is the largest producer of vegetables in the world, accounting for 41% of total global production [29]. Intensive vegetable production systems take up 13% of the Chinese crop planting area and consume 25% of the national production of chemical fertilizers while emitting 35% of crop-sourced GHGs due to the excessive N (inorganic and organic) inputs, multicropping, and frequent irrigation [30,31]. Therefore, it is imperative to develop appropriate strategies to mitigate GHG emissions from vegetable fields. Some studies have indicated that optimizing N fertilizer management could significantly reduce GHG emissions and maintain the high vegetable yields of Chinese vegetable production systems [13,31]. However, the combined effects of CRU and DCD and the effects of coated urea containing DCD on the GHG emissions from vegetable production systems remain unknown. Lettuce is widely planted in northern China, and mainly cultivated in open fields during spring and autumn. The impacts of optimized N fertilizer management on GHG emissions from open-field lettuce production demand in-depth exploration.
Therefore, a five-year field experiment was conducted to investigate the GHG emissions from an open-field lettuce system fertilized with two types of CRU in northern China. The objectives of this study were to: (1) investigate the long-term effects of different N fertilization treatments on GHG emissions (i.e., N2O and CO2), soil available N contents, lettuce yield, and N uptake; (2) elucidate the underlying mechanisms and provide guidance for local farmers to optimize N fertilization strategies for the sustainable production of open-field vegetables.

2. Results

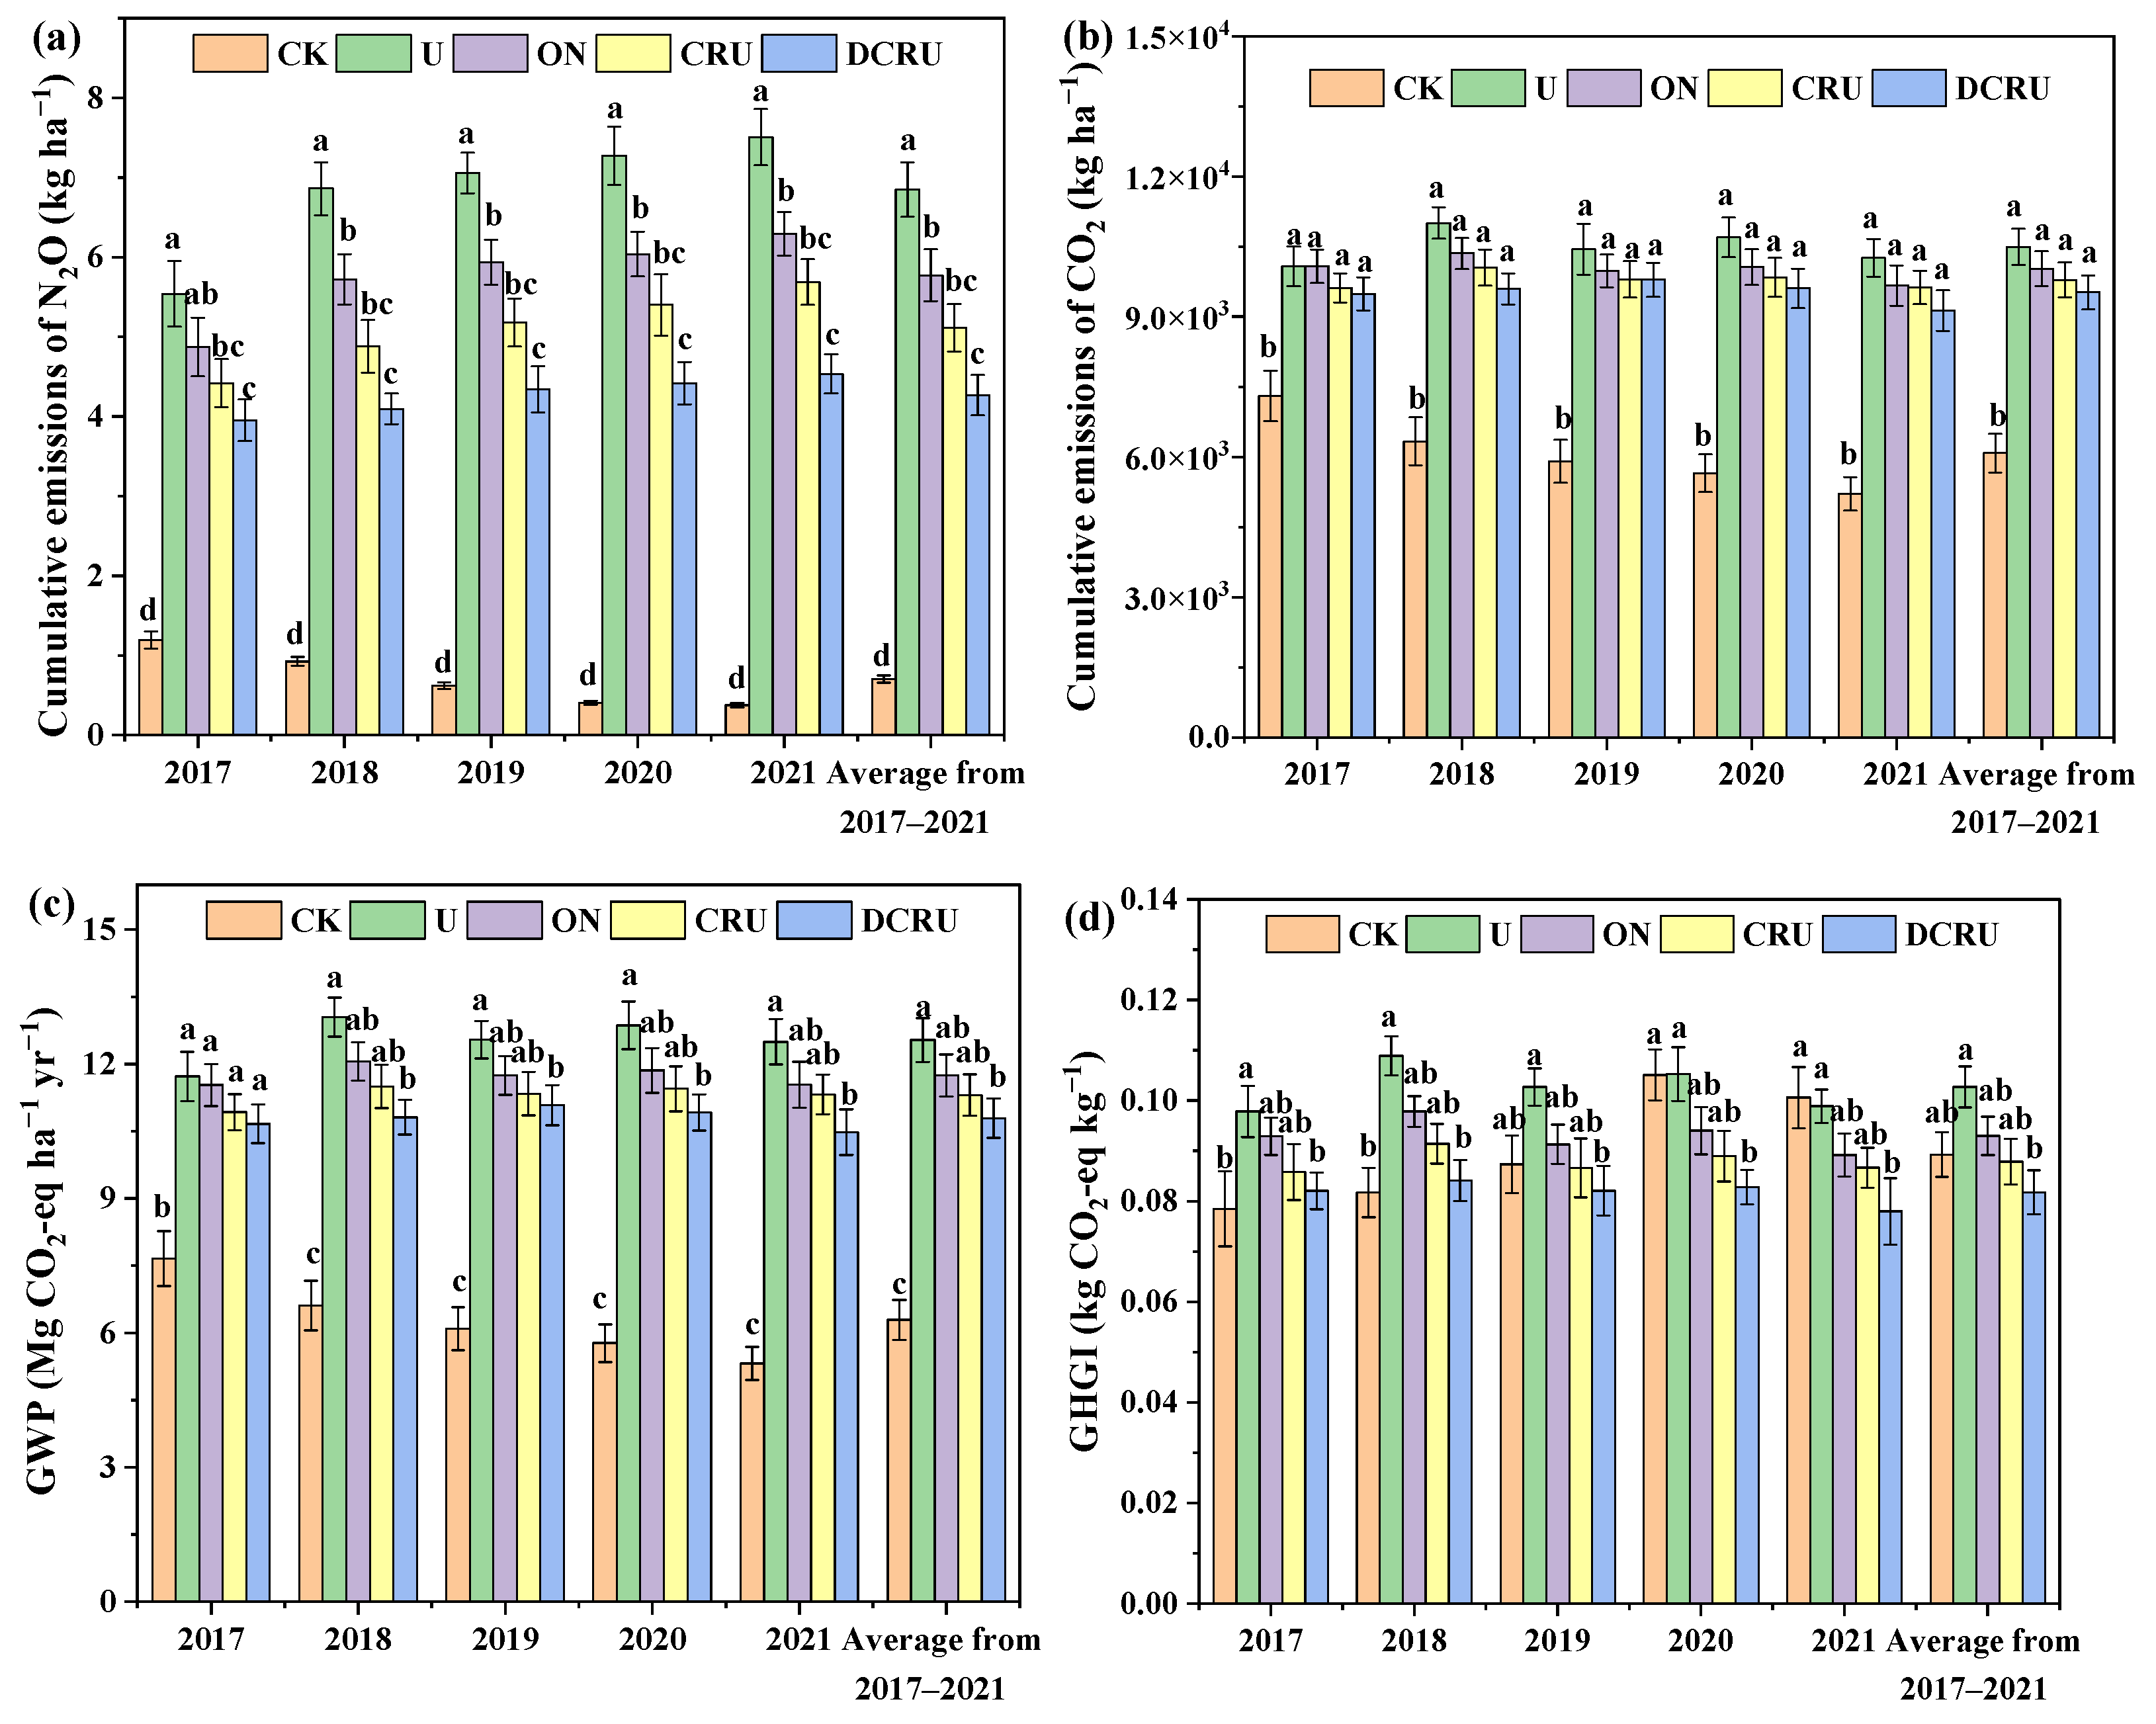
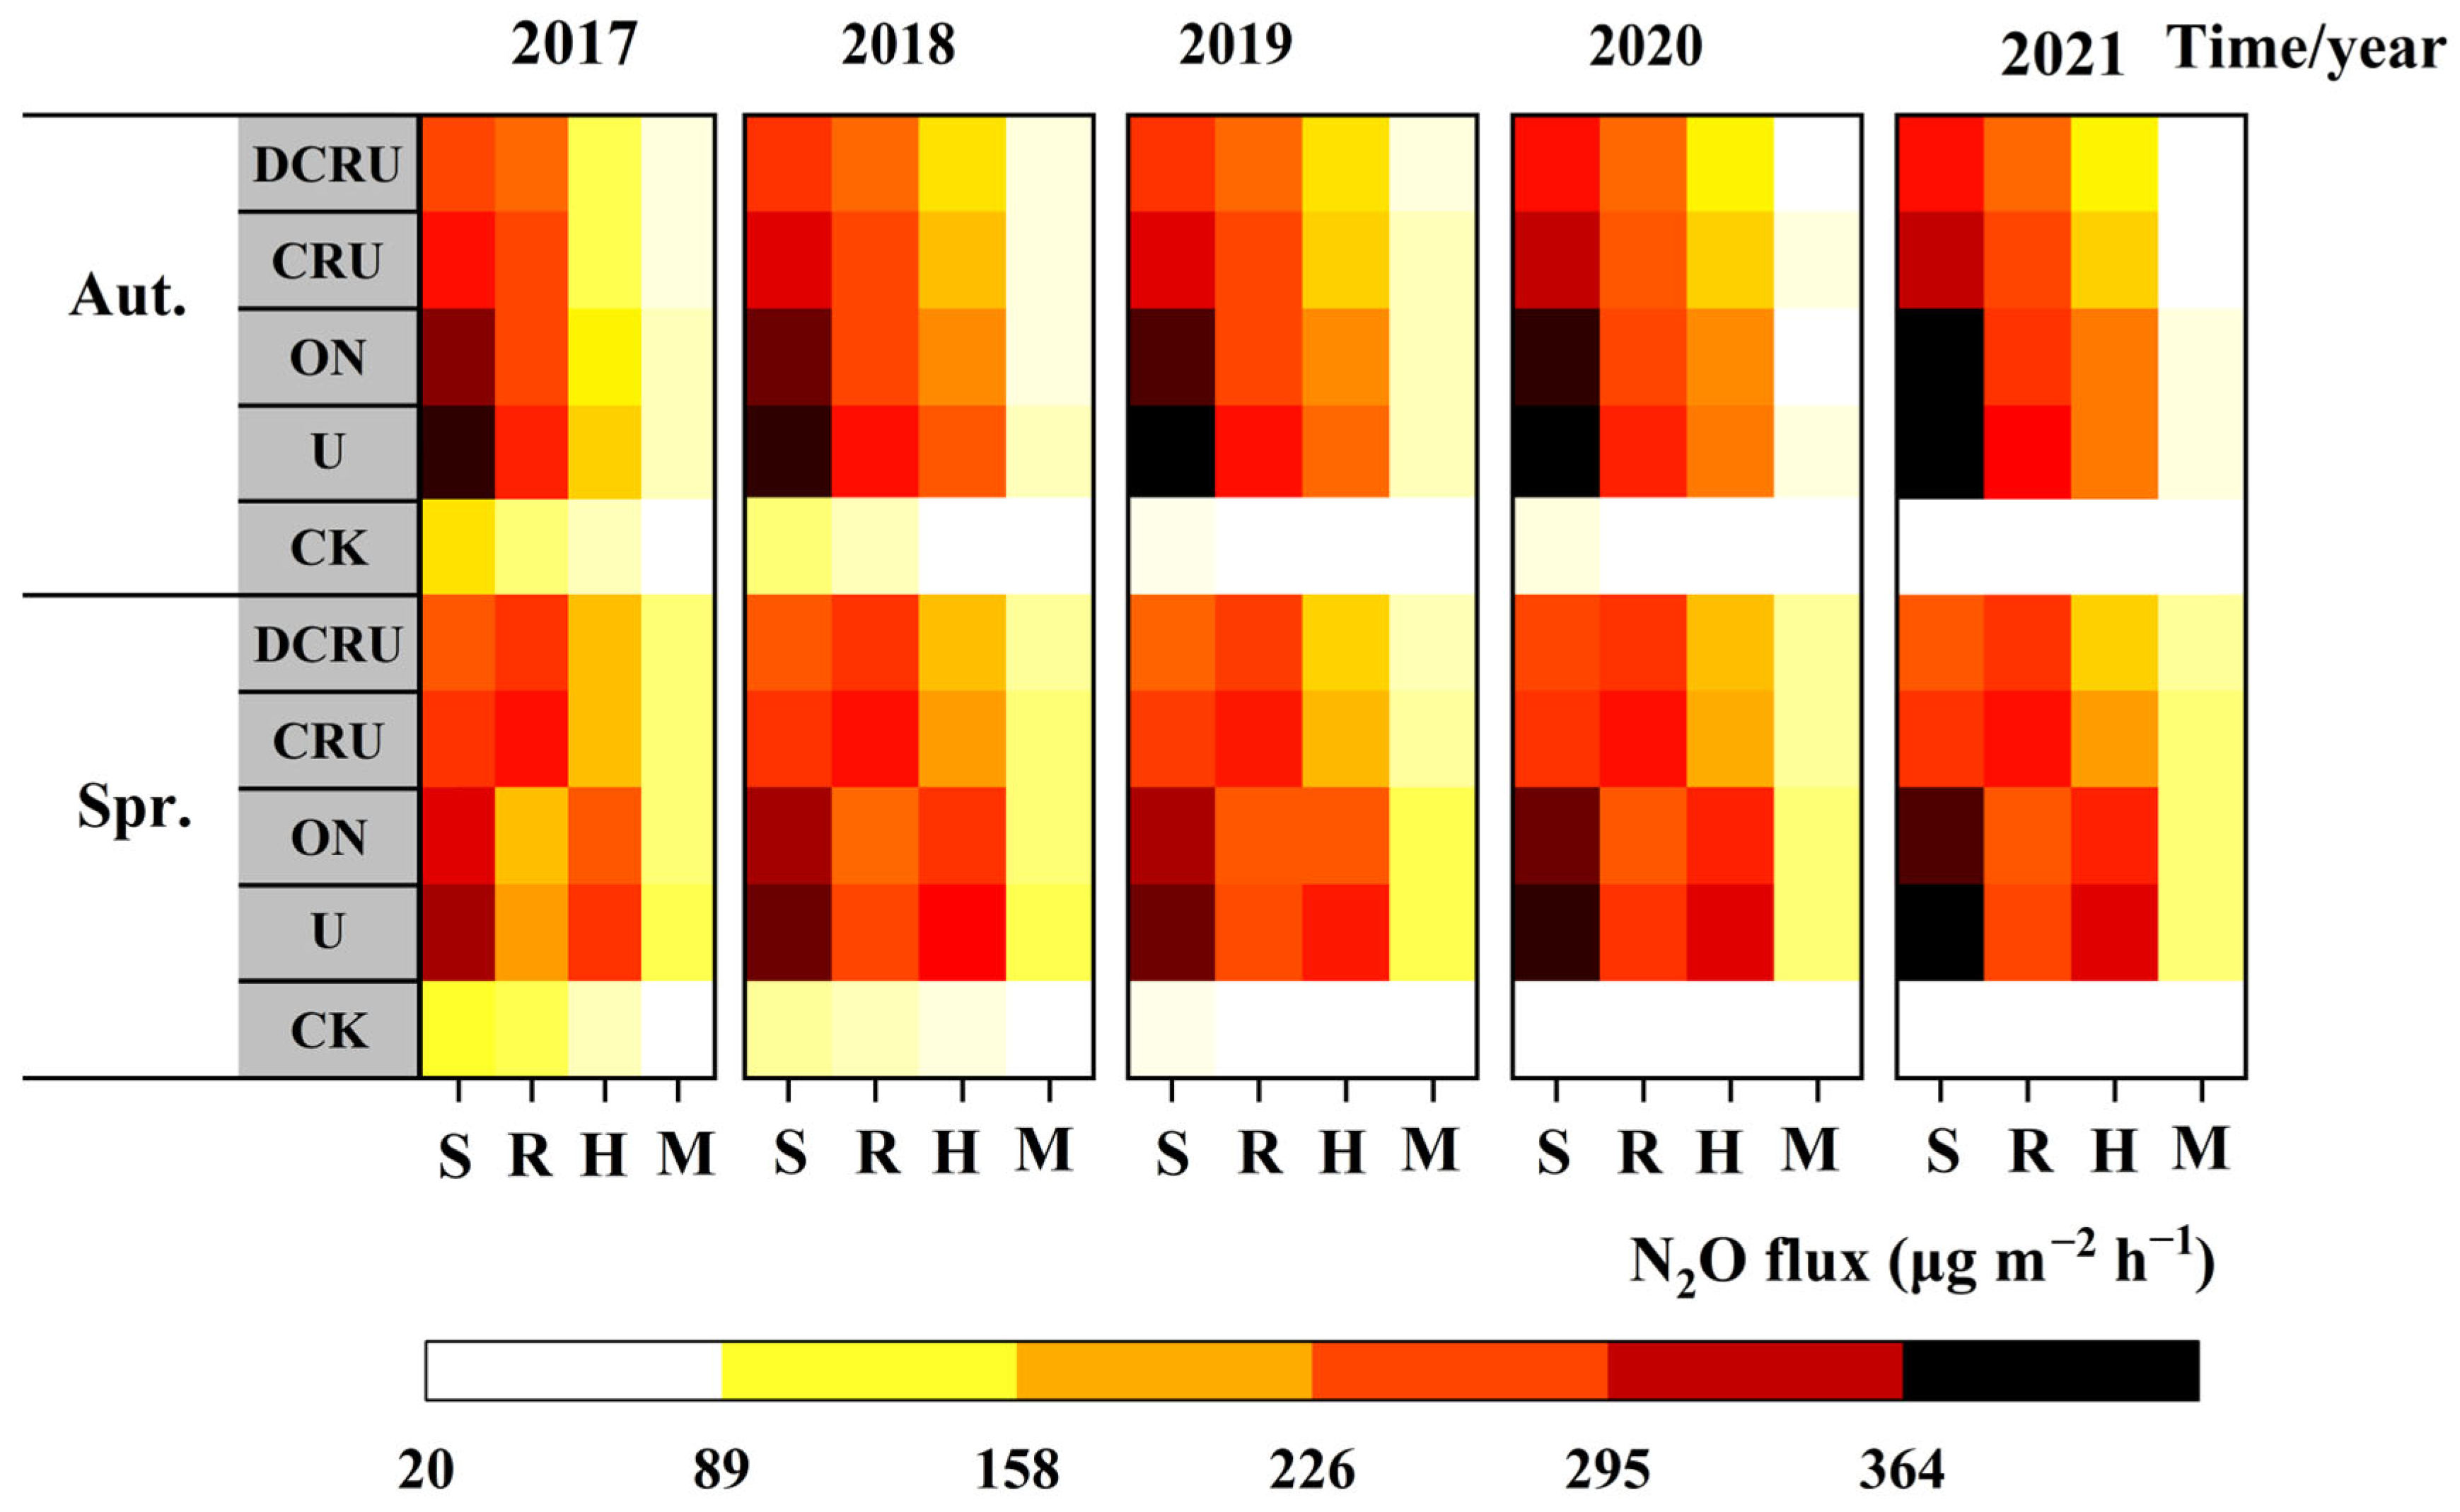
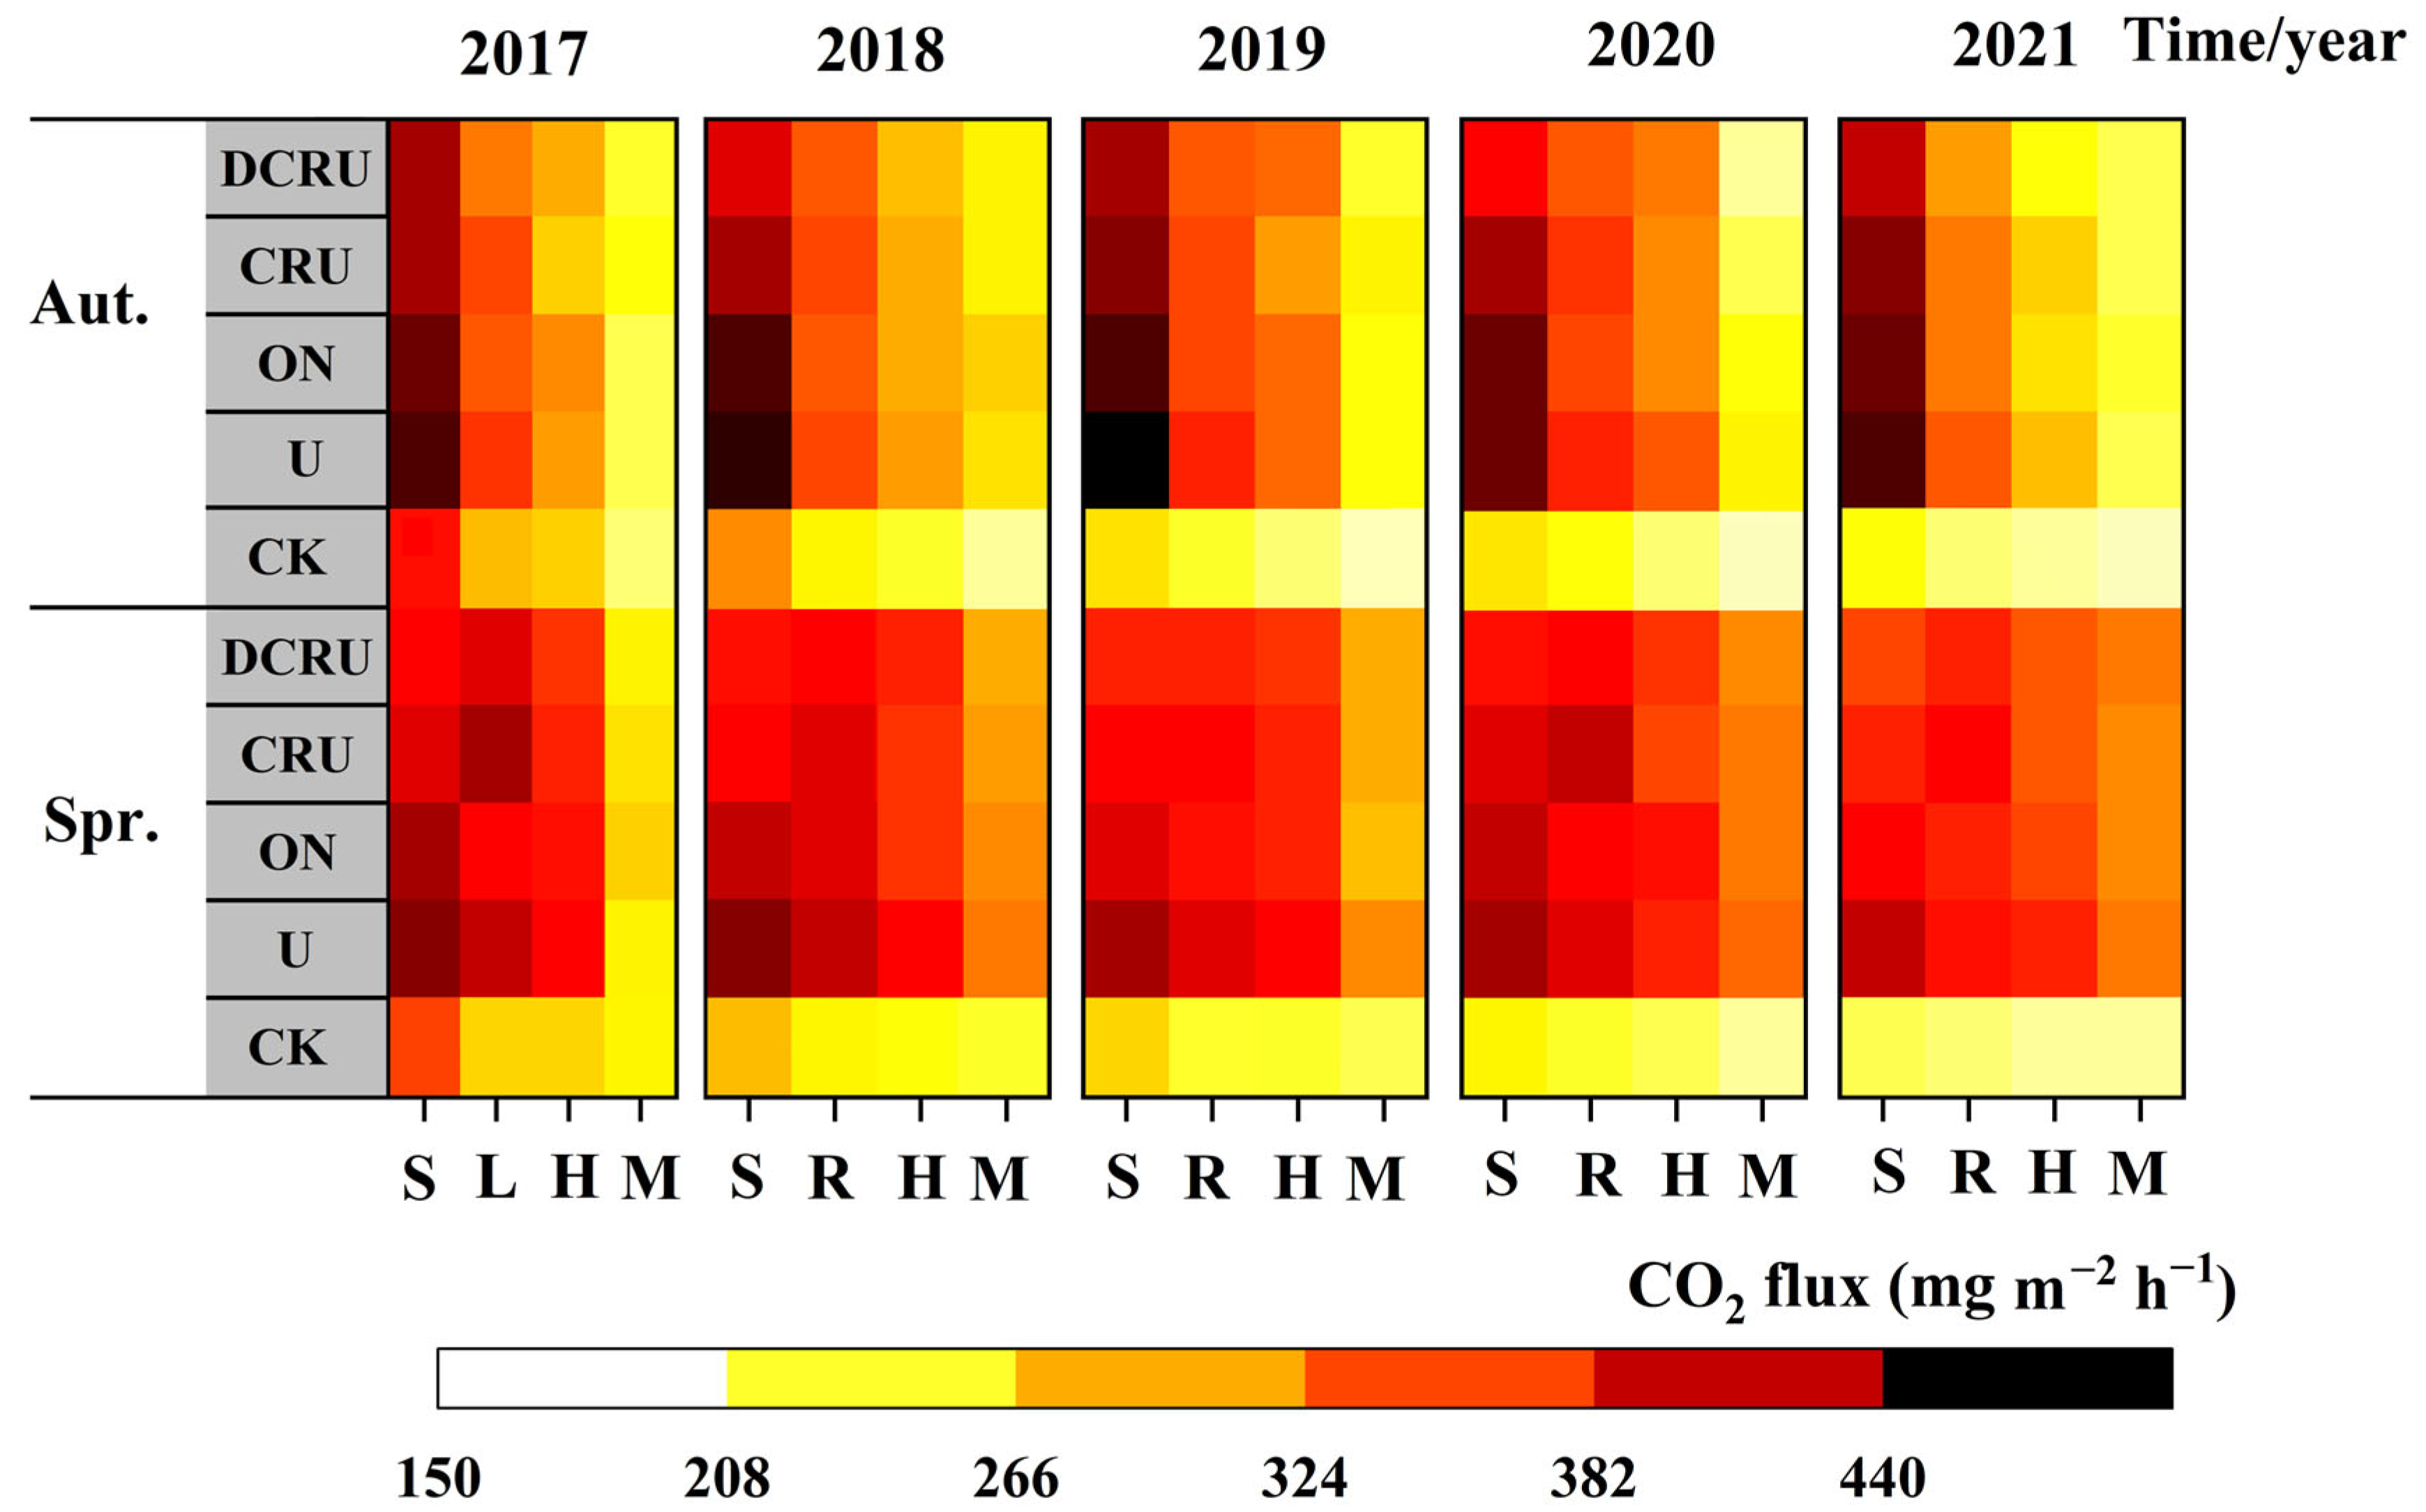
2.1. N2O and CO2 Emissions
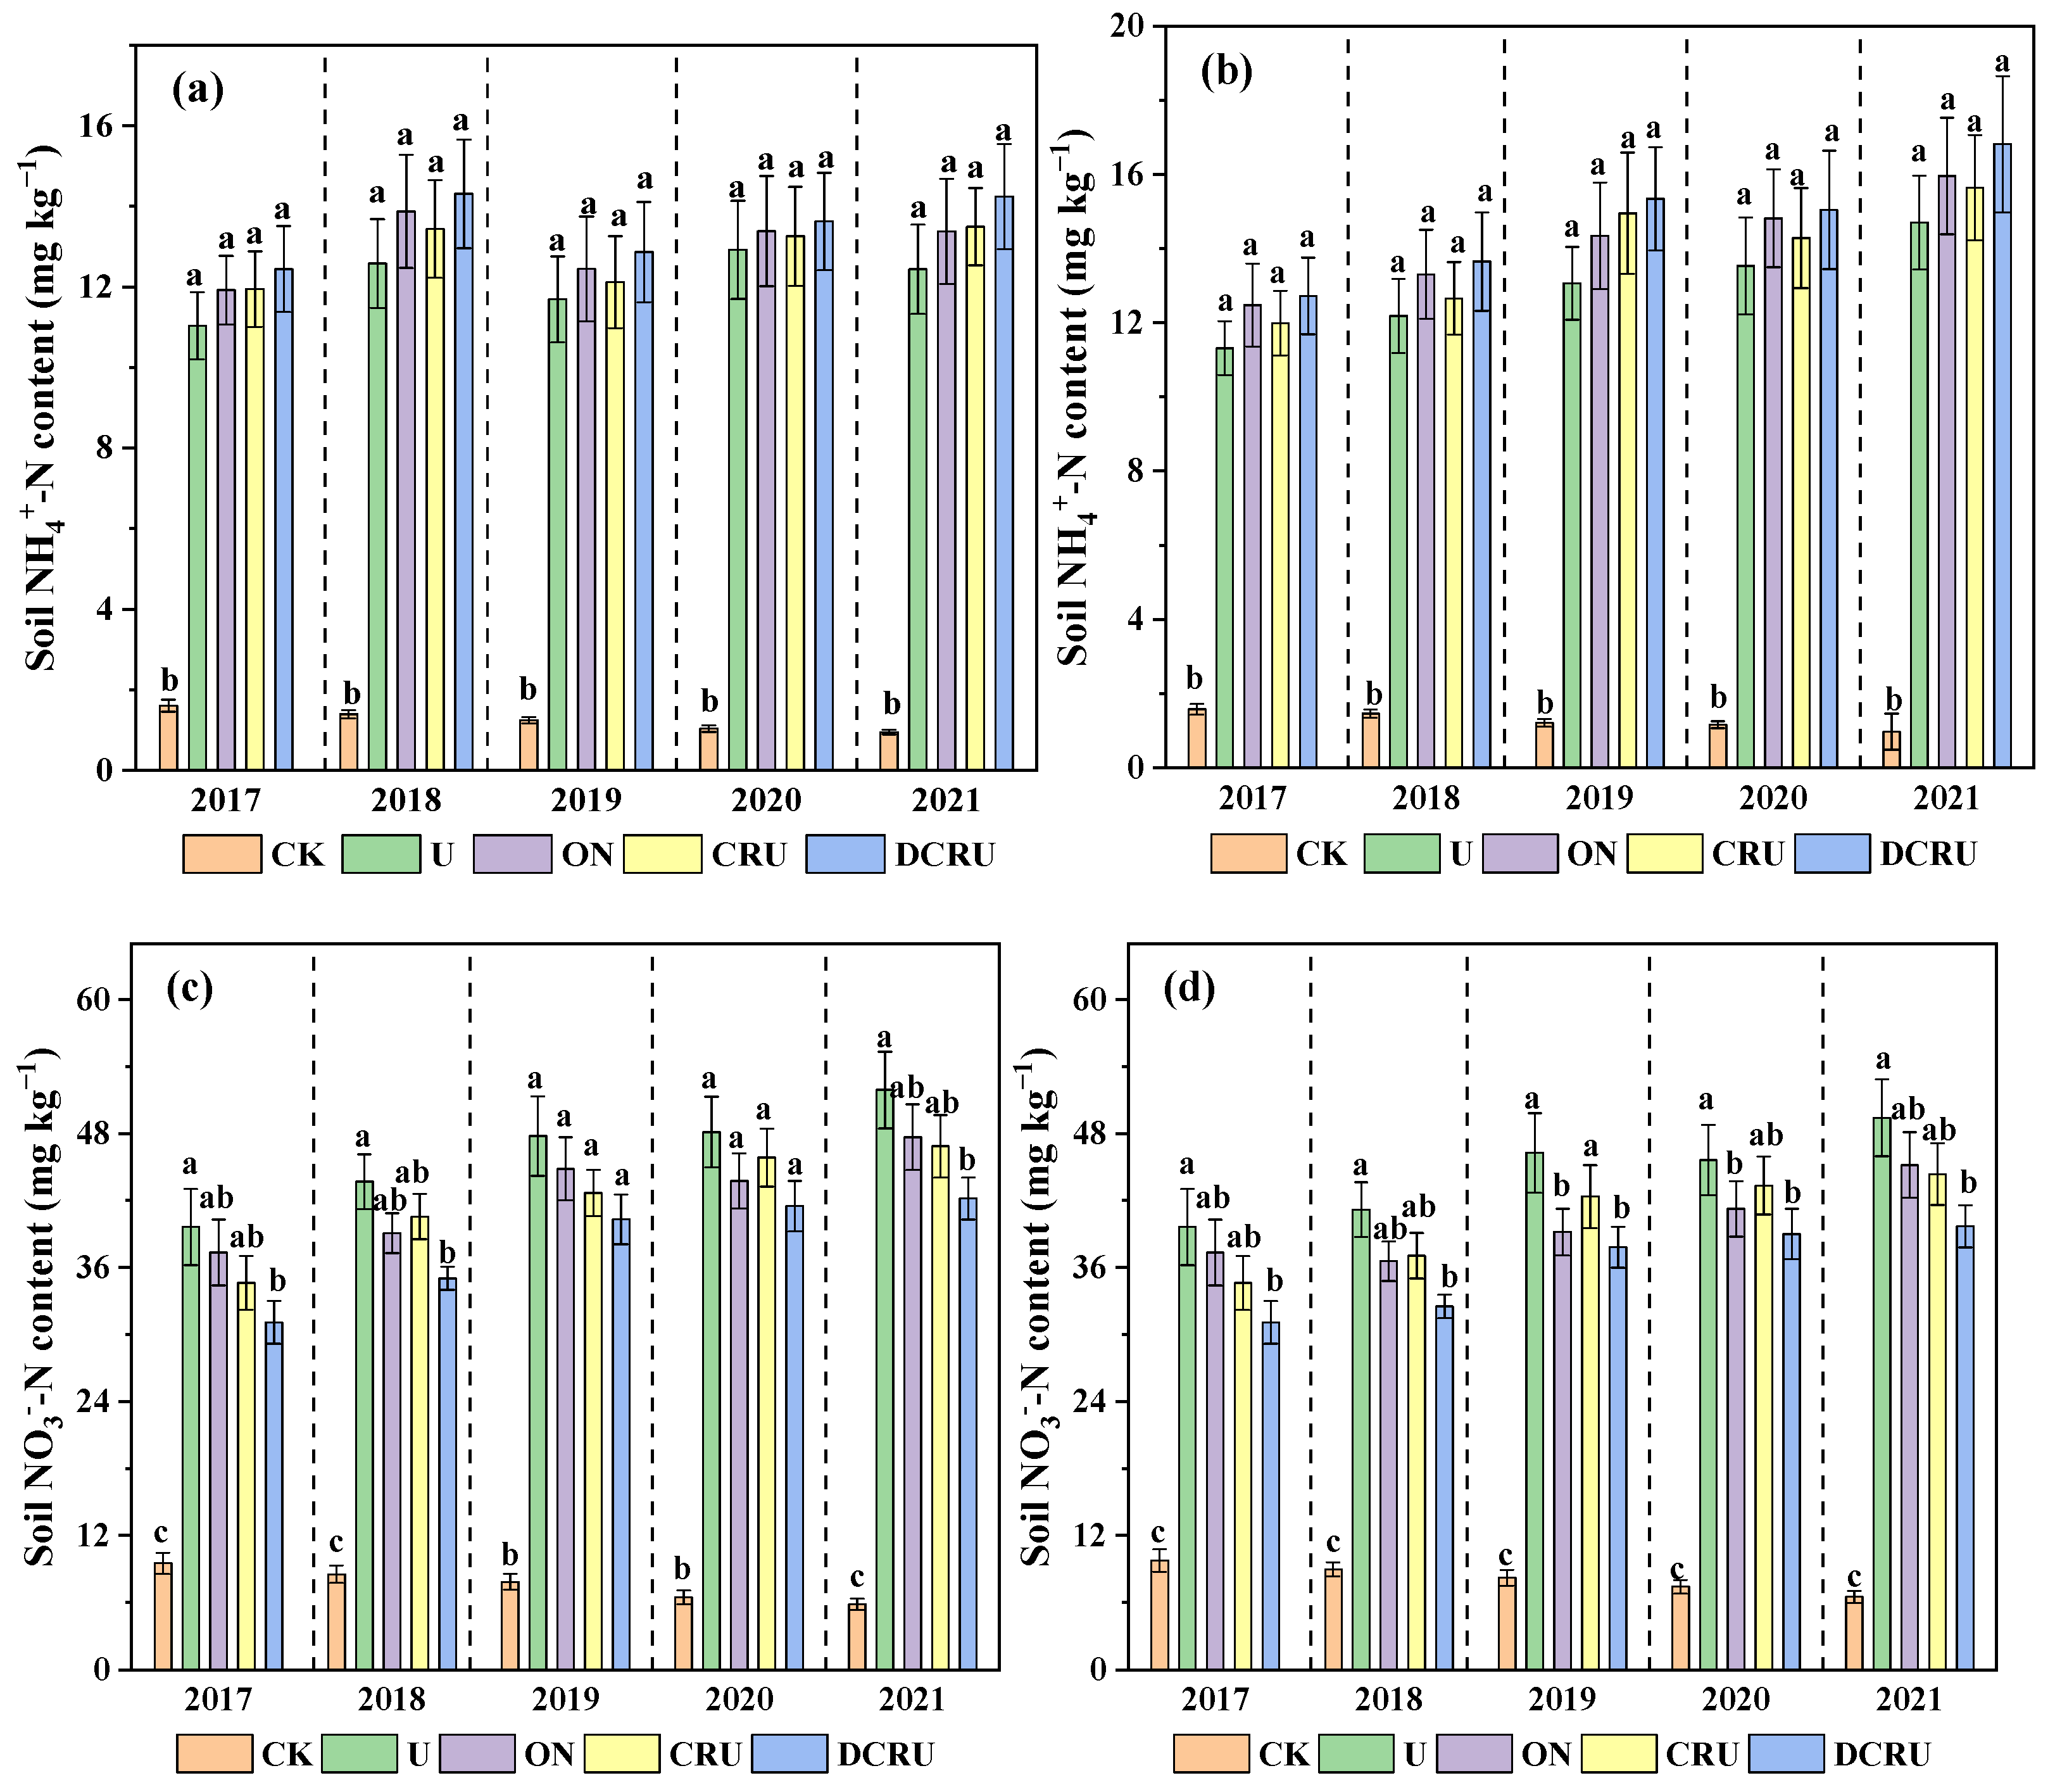
Compared with CK, soil N2O emission fluxes increased significantly in N application treatments. The N fertilization treatment significantly affected soil N2O emission fluxes from lettuce soil, without significant inter-annual or inter-seasonal differences (Table 1). From 2017 to 2021, the average N2O fluxes were 169.34–231.12 μg m−2 h−1 under different N fertilization treatments, with a trend as follows: U > ON > CRU > DCRU. Compared with U and ON, the N2O fluxes of DCRU in spring were significantly reduced by 17.51–29.35% (p < 0.05) and 7.81–19.81% (p > 0.05). Those of CRU were reduced by 10.20–20.72% (p > 0.05) and −0.36–8.40% (p > 0.05), respectively. The N2O fluxes of DCRU in autumn were significantly reduced by 25.81–28.62% (p < 0.05) and 14.68–19.81% (p > 0.05). Those of CRU were reduced by 17.28–19.83% and 5.33–9.44% (p > 0.05), respectively (Table 1). The average N2O fluxes reached their lowest level during the mature period, and those in spring were higher than autumn (Figure 1). However, the N2O fluxes of U and ON were at their highest at the seedling stage, with those in autumn higher than in spring. The average N2O fluxes of CRU and DCRU at the lotus stage were higher than those of other periods in spring, similar to the seedling stage in autumn. The results indicate that the long-term use of controlled-release fertilizers had a significant effect on N2O reduction without significant inter-annual or inter-seasonal differences.
Compared with CK, soil CO2 emission fluxes were significantly increased in the N application treatments. The CRU and DCRU reduced the CO2 emission fluxes from lettuce soil (p > 0.05); however, there were no significant differences between different years and seasons (Table 2). In 2017 to 2021, the average CO2 fluxes were 347.99–362.82 mg m−2 h−1 under different N fertilization treatments during the autumn, i.e., lower than those of the spring (Table 2). The average CO2 fluxes gradually decreased from the seedling to the harvest stage in autumn, and those of CRU and DCRU at the lotus stage were higher than those of other periods in spring. The CO2 fluxes from seedlings in autumn was higher than that in spring (Figure 2). During the seedling period, compared with U, the CO2 fluxes of DCRU were reduced by 8.0–16.54% (Figure 2). The results indicate that the long-term use of DCRU fertilizer could effectively reduce CO2 emissions.
The cumulative emissions of N2O and CO2 were consistent with the patterns of N2O and CO2 fluxes (Figure 3a,b). The cumulative emissions of N2O and CO2 were 3.95–7.51 kg ha−1and 9127.18–11003.84 kg ha−1 in the N application treatments, respectively, and decreased under CRU and DCRU treatments in the 2017–2021 period, achieving the lowest values under DCRU. Notably, compared with U, the cumulative emissions of N2O from ON, CRU, and DCRU were significantly reduced by 15.70%, 25.34%, and 37.68% (p < 0.05), and CO2 by 4.46%, 6.77%, and 9.28% (p > 0.05), respectively (Figure 3a,b). The GWP was 10.66–13.05 Mg CO2-eq ha−1 yr−1 in this research, compared to U, which decreased by 1.62–7.82%, 6.76–11.85%, and 9.02–17.13% under ON, CRU, and DCRU, respectively, and the GWP of DCRU was significantly reduced by 13.91% (p < 0.05) from 2017 to 2021 (Figure 3c). The GHGI was 0.078–0.109 in this research, compared to U, which decreased by 5.06–11.10%, 9.47–17.79%, and 16.68–20.17% in ON, CRU, and DCRU, respectively. Compared with U, the GHGI of DCRU from 2017 to 2021 was significantly reduced by 20.36% (p < 0.05) (Figure 3d). The results indicate that the long-term use of DCRU had a significant mitigation effect on the cumulative N2O emissions.

2.2. Soil NH4+-N and NO3-N Contents

Compared with CK, the average soil NH4+-N and NO3-N content was significantly increased in N application treatments. The average soil NH4+-N content of N application treatments was 10.42–15.23 mg kg−1 in spring and 11.38–16.82 mg kg−1 in autumn during the lettuce growing seasons in 2017 to 2021; compared with U, those of ON, CRU, and DCRU were increased by 3.62–10.31%, 2.64–14.47%, and 5.48–17.42%, respectively (Figure 4a,b). The average soil NO3-N content of N application treatments was 31.07–49.25 mg kg−1 in spring and 32.57–51.90 mg kg−1 in autumn; compared with U, those of ON, CRU, and DCRU were reduced by 5.77–15.34%, 4.75–12.65% (p > 0.05), and 13.78–21.59% (p < 0.05), respectively (Figure 4c,d). These results indicated that the long-term use of DCRU increased soil NH4+-N and reduced NO3-N content.

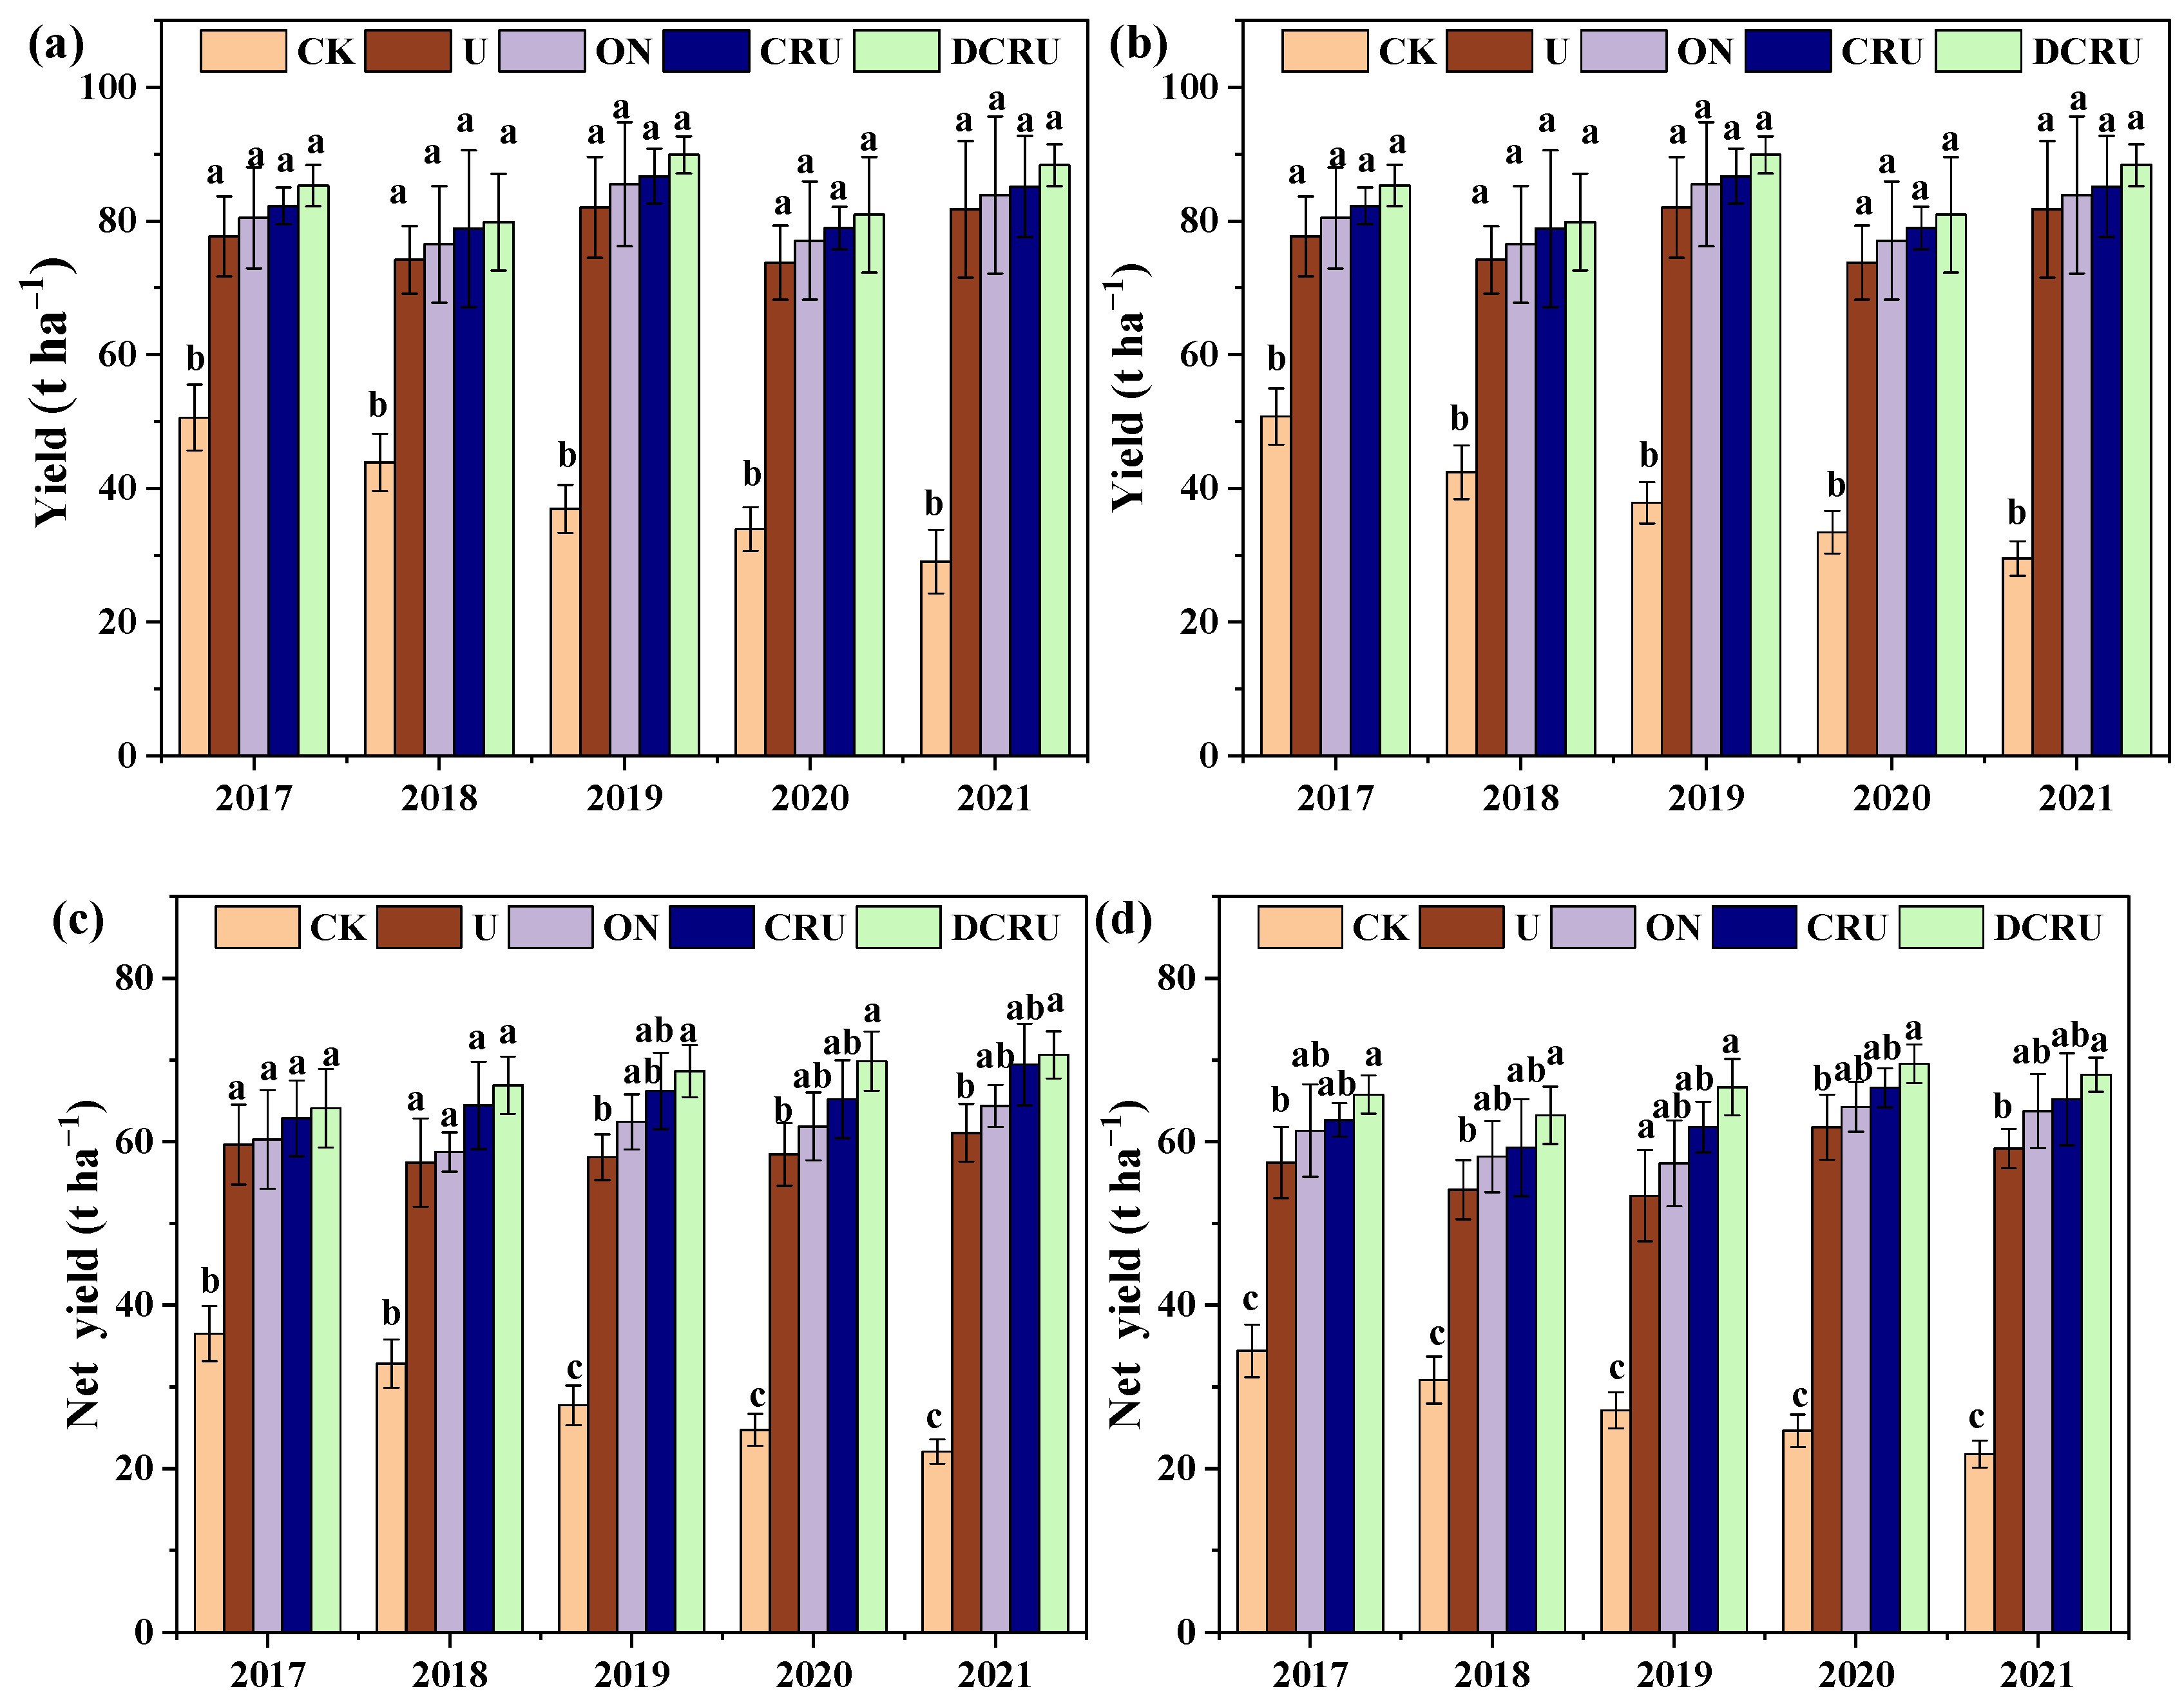
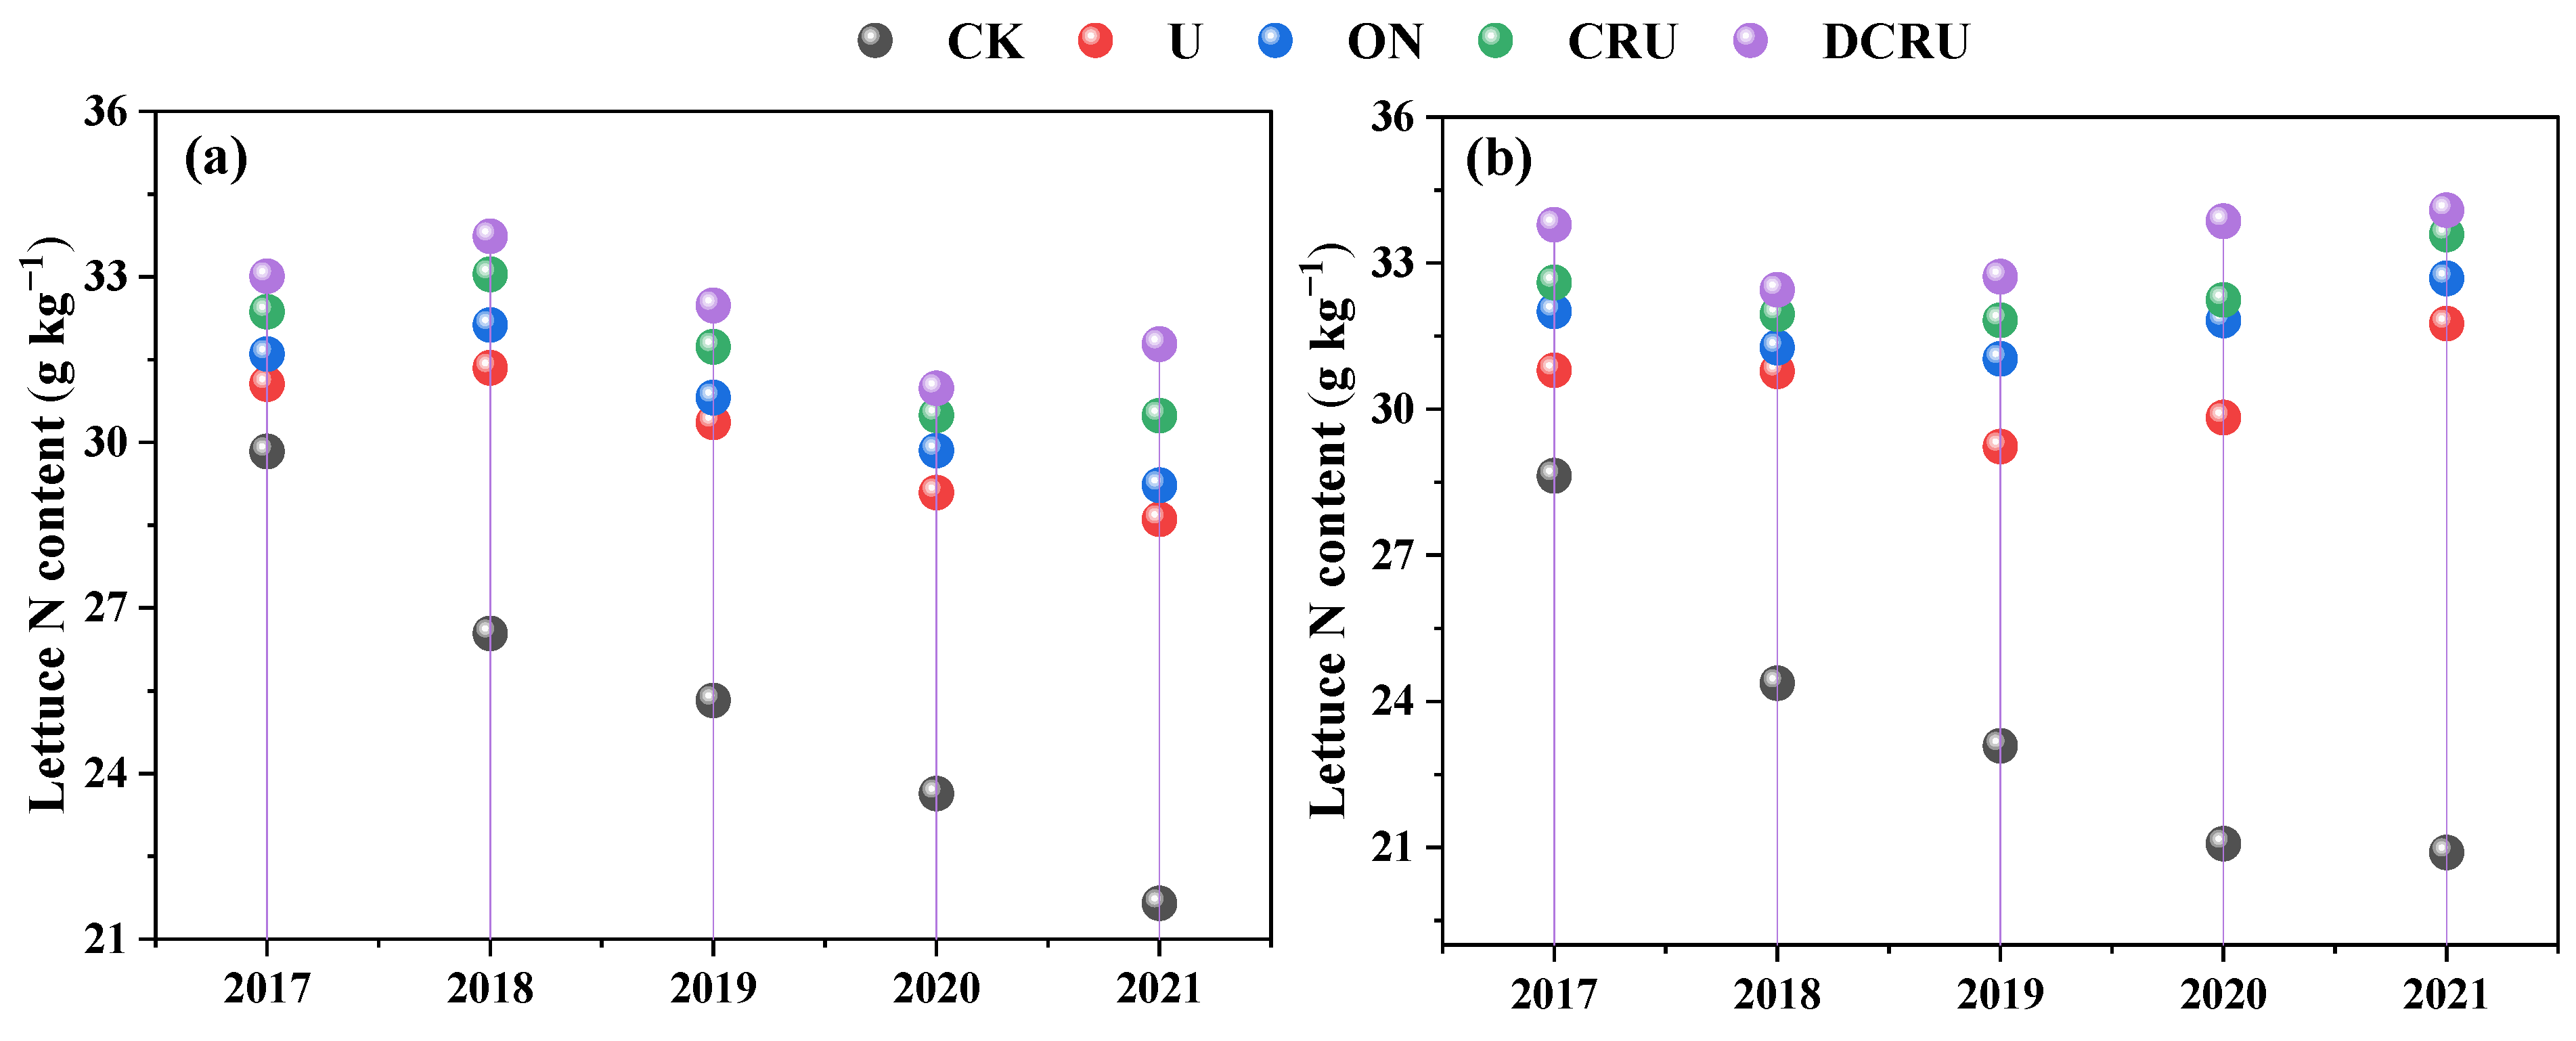
2.3. Lettuce Yield and N Content

Compared with CK, the lettuce yield and net yield was significantly increased in N application treatments (Figure 5a–d). Compared with CK, the lettuce yield of ON, CRU and DCRU treatments slightly increased with no significant differences (p > 0.05) (Figure 5a,b). Compared with U, the net yield of DCRU was significantly increased by 7.47%, 5.83%, and 5.41% (p < 0.05) during the spring season in 2019, 2020, and 2021, respectively, and by 6.79%, 7.48%, 7.35%, and 7.71% during the autumn season in 2017, 2018, 2019, and 2021, respectively (Figure 5c,d). The results indicated that the long-term use of DCRU fertilizer increased the net yield.
Compared with CK, the N content of lettuce was significantly increased in N application treatments (Figure 6a,b). The N content of lettuce showed no significant differences across different N treatments, seasons, and years (Figure 6a,b). Compared with U, the N content of spring lettuce in ON, CRU, and DCRU was increased by 3.51–4.67%, 5.27–7.63%, and 7.35–12.20%, and that of autumn lettuce was increased by 3.60–8.82%, 3.72–9.96%, and 6.48–17.25%. The results indicated that the long-term use of DCRU could effectively increase the N content of lettuce.

3. Discussion

3.1. Effects of Different Fertilization Treatments on N2O Emissions

The N2O in soil originate from the microbial nitrification processes under aerobic conditions and the denitrification processes under anaerobic conditions [32]. The N2O emissions are affected by soil inorganic N content, soil temperature and water filled pore space (WFPS) [33,34]. In general, vegetable soils with high chemical N fertilizer inputs and frequent irrigation are major sources of N2O [11,34,35]. Wang et al. [31] conducted a meta-analysis focused on Chinese vegetable production systems and found that N2O emissions had a positively linear correlation with fertilizer N application rates. Our results were consistent with previous studies. Due to the large amount of N fertilization, the annual N2O emissions from the open-field lettuce system reached 7.51 kg ha−1 under conventional N application practices (spring and autumn, N 480) (Figure 3a) in this study, which were 1.41 times higher than a wheat–corn rotation system (3.12 kg ha−1) in the same region [36]. In this study, cumulative N2O emissions were reduced by 15.70% under ON compared to U. Therefore, it is necessary to establish optimized N management strategies in open-field lettuce systems to decrease the N2O emissions in this region [7].
Our findings suggest that, compared to CK, the N fertilization treatments significantly affected N2O emissions. The CRU significantly decreased the soil N2O emissions from lettuce fields compared to conventional N fertilization (Figure 1 and Figure 3), which was in accordance with previous findings [10,14,37]. The soil NH4+-N and NO3-N levels were significantly lower under CRU than ON, possibly because conventional urea dissolved rapidly in the soil solution upon entering the soil. This rapid dissolution leads to a short-term increase in soil N content, reducing N uptake due to limited lettuce growth. As a result, greater accumulation of extra N substrates promotes the nitrification and denitrification processes, ultimately leading to increased N2O production [38,39,40]. In our study, the polyurethane film as the outer layer of CRU prevented water penetration into the fertilizer, thereby slowing down the release of N, promoting lettuce uptake of mineral N from the soil, increasing N fertilizer utilization and lettuce yield, reducing substrate N concentrations required for N2O formation, and suppressing soil nitrification and denitrification, ultimately resulting in decreased N2O emissions [36,41,42]. Except for the high N2O fluxes under traditional urea fertilization in 2017–2021 due to the high soil NO3-N contents, the N2O fluxes of the seedling stage (basal fertilization) were higher than those of the mature period. This was possibly because the basal fertilizer was applied with 40% of the total N inputs, and the lower N requirement for lettuce growth during the seedling stage, resulting in higher soil NH4+-N and NO3-N contents during the seedling stage than the mature period, thus stimulating N2O emissions and leading to higher N2O fluxes than those from the mature period. Moreover, high concentration of NO3 may also inhibit the reduction of soil N2O to N2, which thus increases the soil N2O emissions under higher WFPS [43].
Our study found that the DCRU fertilizer outperformed other treatments in mitigating N2O emissions from the open-field lettuce system, possibly due to the synergistic effects of NIs and CRU fertilizers. Previous findings showed that NI amendments are an effective approach to decrease direct soil N2O emissions [19,21,44]. The inhibition of the abundance of nitrifiers by NIs directly reduced the nitrification rate, and lowered the soil NO3 availability as the substrate for denitrification [13], leading to a reduction in direct N2O emissions. Our study also found that compared with conventional N fertilization, the DCRU treatment decreased soil NO3-N by 13.78–21.59%, which probably led to the decrease in N2O (17.51–29.35%).
In addition to fertilization, other factors such as the irrigation amount [30] and soil properties [11] have also been reported to significantly affect N2O emissions in vegetable production systems. Our study found that frequent irrigation and precipitation during the two lettuce seasons (May and June in spring and August and September in autumn) resulted in high soil WFPS (50–73%) and temperature (mean: 13.28–24.58 °C) (Table S1). This was beneficial to N2O generation, which was mostly produced via denitrification and oxidizer-denitrification [30,34]. The N2O fluxes during the seedling stage in autumn were higher than those in the spring season (Figure 1), due to higher soil temperature and moisture during the seedling stage in autumn and the stimulated soil microbial activity involved in the N cycle, subsequently promoting soil N2O production [35]. CRU controls the release rate of N based on soil moisture and temperature [45]. The N2O fluxes of CRU and DCRU at the lotus stage in spring and the seedling stage in autumn were higher than those of the other periods, which was possibly because the soil moisture and temperature at this stage favored the rapid release of N and enhanced the N substrate for N2O production.

3.2. Effects of Different Fertilization Treatments on CO2 Emissions

The results of this study indicated that N fertilization practices imposed a significant impact on CO2 emissions, with the highest being observed from conventional N fertilization. Our results are consistent with previous studies [46,47]. Huang et al. [48] found that CO2 emissions under urea fertilized treatments were two-fold higher compared to non-fertilized treatments. Zhong et al. [47] showed that soil CO2 emissions in farmland ecosystems increased with the N application rate. Lin et al. [49] found that, over six growing seasons, the mean growing season soil C emissions were increased by 11.6–29.7% under N fertilization. This could be due to the fact that moderate N application promoted crop root growth, soil microbial activity, and the decomposition of soil organic matter, and consequently increased soil CO2 emissions [50]. Another reason is that the decomposition of urea in soil by urease can directly generate CO2, further increasing CO2 emissions from urea application treatments [51,52]. However, the CO2 emission factor from urea for warm and cold cropping seasons in soils in the North Plain of China (the research area) was still unclear, which need to be further explored.
The lowest CO2 emissions were observed under the DCRU treatment, except for CK treatment. This is consistent with previous studies reporting that reduced N fertilizer and CRU application had a positive effect on CO2 reduction [52,53]. DCD application partially inhibited soil CO2 emission [44]. The results of a 3-year field study showed that the application of DCD decreased CO2 emissions by 7% [25]. Another study reported that DCD minimized CO2 emissions from acidic soils [54]. Similarly, Raza et al. [26] also stated that DCD significantly decreased CO2 emissions from calcareous soils. However, few studies have reported the mechanism of DCD effects on soil respiration and mineralization, which needs to be varied further under field conditions.
Soil CO2 is mainly produced by crop root respiration and decomposition of organic matter by soil microorganisms, which is affected by soil temperature and moisture content [55]. Our results showed slightly higher CO2 emissions in spring than in autumn, and this can be associated with higher soil temperature and stronger microbial activity in spring than in autumn [56]. The highest CO2 fluxes were observed in the seedling stage, except those of CRU and DCRU at the lotus stage in spring. This may have resulted from the altered soil nutrient availability and carbon supply under N fertilizer application [57]. After basal fertilization, the chemical N fertilizer application increased the contents of inorganic N in soil, and provided a sufficient N source for microorganisms, thereby increasing the soil CO2 emissions in the seedling period. At the lotus stage in spring, CRU and DCRU released more N due to the higher soil temperature, and provided sufficient N for soil microbial activities, which could be attributed to increased soil CO2. This study observed that the CO2 fluxes from the seedling stage in autumn were higher than those in spring. A possible reason may be that, in the seedling stage, the higher temperature and WFPS of the soil promote microbial respiration and decomposition activity, and increased the rate of CO2 produced by urea decomposition in the autumn over that in spring.

3.3. Responses of Lettuce Yields and GHGI to N Application

Within a certain range of N fertilizer application rates, the crop yields and quality increased with increasing N inputs [58]. Nevertheless, excessive N application could not improve yield, and caused low N fertilizer utilization efficiency, which not only wastes resources but also reduces soil quality [59]. These results were supported by our study, showing that neither reducing N inputs nor applying CRU fertilizer led to a reduction in lettuce yield. The previous studies confirmed that CRU had the potential to balance wheat yield and NUE by promoting plant N uptake and utilization due to the rational supply of nutrients, without decreasing grain productivity compared with conventional urea, even in soils with high fertility [60,61]. Similar to previous studies, our results also showed that CRU simultaneously improved lettuce yield and net yield compared with conventional urea at the same N rate. In contrast to CRU, urea dissolved rapidly into the soil after fertilization, resulting in the loss of a large amount of N that failed to be absorbed by plants in time, and making it difficult for plants to absorb sufficient N for growth at the middle and late growth stages, thus decreasing lettuce yield and N use efficiency [34]. The CRU may synchronize N release with crop demand compared to traditional fertilizers [4] and can better meet the crop nutrient requirements and improve plant N uptake (Figure 6), contributing greatly to lettuce N accumulation and yield [61]. Notably, our results indicated that the net yield could be significantly increased under long-term use of DCRU fertilizers by 5.41–7.71%, due to the simultaneous limitation of N fertilizer release and inhibition of nitrification in soil. Therefore, DCRU application is a simple and efficient N management strategy to obtain target vegetable yields and economic benefits while increasing NUE and alleviating environmental risks. However, the effect of DCRU on the NUE and yields with changes in soil inorganic N content were unclear, and it is worth exploring in the following experiment.
The mean GWP decreased with N application rate, but the inhibitory effect under ON was much less than that of CRU and DCRU (Figure 4). In comparison with conventional urea, DCRU significantly decreased the GWP. The decrease in GWP under CRU and DCRU was mainly due to the reduced N2O emissions, which was in accordance with previous studies [16,18,27]. Therefore, the reasonable application of DCRU may be an important measure for slowing down GHG emissions from vegetable systems in the future.
The GHGI is a comprehensive indicator of the greenhouse effect and the economic benefits of farmland [31,62,63]. We found that compared with conventional urea, CRU and DCRU decreased GHGI. Meanwhile, GHGI was found to decrease by CRU in the previous study [10]. Therefore, the trade-offs between crop yields and GHG emissions in vegetable fields could be obtained by controlled-release fertilizer combined with DCD.
This study provided a scientific basis for promoting environmentally friendly, low-cost, and efficient fertilization practices to achieve global C neutrality. However, to date, our understanding of the effects of the fertilizer coating materials on soil and plants and the long-term effects of different fertilization methods is still insufficient. Future research should take various soil properties and agricultural practices into consideration, and investigate the long-term effects of controlled-release N fertilizer combined with DCD on soil and crops.

4. Materials and Methods

4.1. Study Site

A five-year experiment was conducted from 2017 to 2021 at Yongsheng Garden agricultural planting center (116°41′32″ E, 39°41′2″ N) located in Tongzhou District in the suburb of Beijing in northern China. It has a temperate continental monsoon climate, with an average annual air temperature of 11.3 °C and an average annual precipitation of 620 mm (mostly occurring in July and August). The soil at the experimental site is classified as sandy soil (sand 55.8%, clay 34.9%, silt 9.3%) according to the Chinese Soil Taxonomy System. A 6 yr wheat–maize rotation was carried out prior to this experiment. The soil characteristics (0–20 cm) are listed as follows: pH 8.12, organic carbon 1.58 g kg−1, NH4+-N 1.53 mg kg−1, NO3-N 9.80 mg kg−1, total nitrogen 1.90 g kg−1.

4.2. Experimental Design

Four different N fertilizer management treatments were established: (1) CK: without N fertilizer; (2) U: conventional urea fertilizer (46% N, according to local farmers’ practice) applied at 300 kg N ha−1; (3) ON: conventional urea fertilizer applied at 240 kg N ha−1; (4) CRU: polyurethane-coated urea (42% N, 60-day release, developed by the Institute of Plant Nutrition, Resources and Environment at the Beijing Academy of Agriculture and Forestry Sciences) at 240 kg N ha−1; (5) DCRU: polyurethane-coated urea containing DCD (DCD mixed with urea was coated by polyurethane after granulation, DCD:N = 1:100) at 240 kg N ha−1.
All treatments were arranged in a randomized complete block design with four replicates. The area of each plot was 28 m2 (7 m × 4 m). A ridge with 0.3 m width and 0.3 m height was set up to prevent the exchange of water and nutrients between plots. The open field was planted with the lettuce (Lactuca sativa) ‘Sheshou No. 101’, which is a common local cultivar with a growth period of approximately 60 days in the spring and autumn. The lettuce seedlings were transplanted on 15 April or 18 April and 19 August or 23 August in the spring and autumn, respectively.
For the U and ON treatments, 40%, 20%, 20%, and 20% of the total N was applied as basal, first, second, and third topdressing fertilizers at the seedling, lotus, and heading stages, respectively. For the CRU and DCRU treatments, the total N was applied all at once as basal fertilization. For all treatments, P and K fertilizers were applied at rates of 78 kg P ha−1 and 184 kg K ha−1, and all the P and K fertilizers were applied as basal fertilization. Basal fertilizer was surface broadcast by hand, whereas the topdressing fertilizers were dissolved and applied with drip irrigation. The irrigation amount during the entire growth period was 945 m3 ha−1. The U and ON treatments had topdressing irrigation every 10 days, a total of 3 times, with each fertilization irrigation of 120–150 m3 ha−1, and the CK, CRU, and DCRU treatments were irrigated with equal amounts of clean water. The experiment was repeated for five years (from 2017 to 2021).

4.3. Sampling and Measurement

Six fresh plants were randomly collected from each plot at the mature stage, and the fresh lettuce plants were weighed for lettuce yield, then removed the inedible parts and weighed to obtain the net lettuce yield. All lettuce plants were dried in an oven at 70 °C for over 48 h and then weighed for the aboveground dry matter yield. The N content of aboveground lettuce biomass was determined using the Kjeldahl digestion method.
Six soil samples (0–20 cm) were randomly collected from each plot each time at the seedling (on the 6th day after basal fertilizer), rosette (on the 5th day after first topdressing), heading (on the 5th day after third topdressing), and mature stages during the growing season of the lettuce using a stainless-steel soil sampling auger (diameter 4.5 cm). The collected soil samples in the same plot were homogeneously mixed into a composite sample for further chemical analysis. The CRU particles were picked out to ensure that the soil does not contain fertilizer particles.
The soil pH was measured by a potentiometer (Delite B1020, Beijing, China) using a water-to-soil ratio of 5:1. Soil organic carbon (SOC) and total N was determined using an elemental analyzer (Flash Smart NC SOIL, Beijing, China). Soil NO3-N and NH4+-N were extracted by dissolving 20 g of fresh soil with 100 mL of 1 mol L−1 KCl solution. The soil extracts were then colorimetrically detected for NO3-N and NH4+-N contents using a continuous flow injection analyzer (Auto Analytic 3, Seal Analytical, Germany).
The soil emissions of N2O and CO2 were measured by the static closed-chamber technique in the seedling, rosette, heading, and mature stages. The chamber consists of a plexiglass base collar (50 cm L × 40 cm W × 20 cm H) and a removable top chamber (50 cm L × 40 cm W × 50 cm H) equipped with a battery driven 12 V fan at the center of its inner top. The gas measurements were performed between the lettuce plants. Throughout the lettuce growing season in each year, the sampling was carried out in the morning between 9:00 am and 11:00 am every 2 days for 8 days during the base fertilizer period, every three days after every topdressing N fertilization or irrigation event for 10 days, or once every 7 days otherwise. Four gas samples were successively collected per plot at an interval of 10 min (0, 10, 20, and 30 min) from the chamber headspace using a 25-mL gas-tight syringe, then immediately transferred to 12 mL air-evacuated gas-tight glass vials. The samples were analyzed by using a gas chromatograph (Agilent, HP7890, Agilent, Santa Clara, USA) equipped with an electron capture detector (ECD) to detect N2O and a flame ionization detector (FID) to detect CO2 [64]. The CO2 and N2O exchange fluxes were calculated using Equation (1) [65]:
F = ρ × h × c t × 273 273 + T
where F in CO2 is mg m−2 h−1 and N2O is μg m−2 h−1, ρ is the concentration of N2O and CO2 (e.g., N2O: 1.977 kg m−3, CO2: 1.997 kg m−3). h is the height of the effective space in the chamber (m), c   is the gas concentration difference, t is the time interval, and T is the mean soil temperature for each sampling (°C).
The cumulative emissions of CO2 and N2O were calculated for each treatment according to Equation (2) [31]:
  C G E = i = 1 n ( V i + 1 + V i ) / 2 × ( t i + 1 t i ) × 24
where CGE is the cumulative emission (kg ha−1) for each gas, n is the total sampling time, Vi and Vi+1 are the measured fluxes of two consecutive sampling days, and (ti+1ti) is the time interval between two adjacent sampling days.
The warming potentials (GWP) of N2O are 298 times that of CO2, on a 100-year timescale [2]; therefore, the equation for calculating the GWP (kg CO2-eq ha−1) is Equation (3):
GWP = GCO2 + 298GN2O
where GCO2 (kg CO2 ha−1) and GN2O (kg N2O ha−1) are the cumulative CO2 and N2O emissions, respectively.
Greenhouse gas intensity (GHGI) refers to the comprehensive warming potential per unit of output, and is calculated according to Equation (4):
GHGI = GWP/Y
where GHGI is the GHG emission intensity (kg CO2-eq kg−1 lettuce yield), GWP is the total amount of greenhouse gas emissions (kg CO2 eq ha−1), Y is the yield of lettuce (kg ha−1).

4.4. Statistical Analysis

Statistical analysis was performed using SPSS 24.0 (IBM Co., New York, NY, USA). Before the analysis, a Shapiro–Wilk test and Levene test were employed to check the normality and variance homogeneity of the data. One-way analysis of variance (ANOVA) was performed to assess the effects of different treatments on lettuce yield, N uptake, soil NH4+-N and NO3-N content, and N2O emissions. The means of significant effects were compared using Duncan’s multiple range test (p < 0.05). All the figures were drawn with Origin 2023 (OriginLab Co., Northampton, MA, USA).

5. Conclusions

In comparison with conventional urea, N2O emissions reduced but the reduction effect on CO2 emissions was not obvious, and lettuce yield and net yield were maintained in ON. CRU was effective in controlling N2O by prolonged NH4+-N availability in the soil of the open-field lettuce system and in improving the N content of lettuce and net yield. DCRU was the most effective in mitigating N2O and CO2 fluxes and the mean cumulative effect of N2O and CO2 emissions, with a reduction of up to 37.68% and 9.28%%, respectively, and the net yield was also significantly increased by 5.41–7.71%, due to the improved N absorption of the lettuce in higher soil NH4+-N, lower NO3-N content under the long-term use of DCRU. Therefore, the simple and efficient N management strategy to obtain trade-offs between GHG emissions and lettuce yields in the open-field lettuce system could be obtained by controlled release of fertilizer containing DCD without topdressing. This study provided a theoretical basis for the efficient and sustainable development of open-field vegetable production by adopting optimized N management practices.

Supplementary Materials

The following supporting information can be downloaded at: https://www.mdpi.com/article/10.3390/plants13081071/s1, Table S1: Changes in soil temperature, WFPS, and precipitation in the lettuce growing seasons (means ± SE).

Author Contributions

Conceptualization, J.W. and L.L.; methodology, B.C.; software, X.W. and M.Z.; validation, Y.Z. and Y.C.; formal analysis, X.W.; investigation, J.Z. and M.Z.; resources, B.C. and Y.C.; data curation, X.W. and L.L.; writing—original draft preparation, X.W. and J.W.; writing—review and editing, X.W., J.W. and M.Z.; visualization, X.W.; supervision, X.W., L.L. and J.Z.; project administration, J.W. and Y.Z.; funding acquisition, J.W., L.L. and Y.Z. All authors have read and agreed to the published version of the manuscript.

Funding

This study was financially supported by the National key research and development program (2022YFD1901300), Beijing Academy of Agricultural and Forestry Sciences Science and the Technology Innovation Capacity Construction Project (KJCX20230207), and the Beijing Industrial Economy and Policy Innovation Team (BAIC11-2023).

Data Availability Statement

The data presented in this study are available on request from the corresponding author. The data are not publicly available due to the project was not yet completed.

Acknowledgments

We fully appreciate the editors and all anonymous reviewers for their constructive comments on this manuscript.

Conflicts of Interest

The authors declare no conflicts of interest. The funding sponsors had no role in the design of this study; in the collection, analyses, or interpretation of the data; in the writing of the manuscript; or in the decision to publish the results.

References

  1. Carlson, K.M.; Gerber, J.S.; Mueller, N.D.; Herrero, M.; West, P.C. Greenhouse gas emissions intensity of global croplands. Nat. Clim. Chang. 2017, 7, 63–68. [Google Scholar] [CrossRef]
  2. IPCC. Climate Change and Land: An IPCC Special Report on Climate Change, Desertification, Land Degradation, Sustainable Land Management, Food security, and Greenhouse Gas Fluxes in Terrestrial Ecosystems; Ng, C.C., Ed.; IPCC: Geneva, Switzerland, 2019; pp. 243–343. [Google Scholar]
  3. Ahmed, M. Introduction to modern climate change. Sci. Total Environ. 2020, 734, 139397. [Google Scholar] [CrossRef]
  4. Sun, Q.H.; Miao, C.Y.; Hanel, M.; Borthwick, A.G.L.; Duan, Q.Y.; Ji, D.Y.; Li, H. Global heat stress on health, wildfires, and agricultural crops under different levels of climate warming. Environ. Int. 2019, 128, 125–136. [Google Scholar] [CrossRef]
  5. Khatri-Chhetri, A.; Costa, J.C.; Wollenberg, E. Greenhouse gas mitigation co-benefits across the global agricultural development programs. Glob. Environ. Chang. 2022, 76, 102586. [Google Scholar] [CrossRef]
  6. Shakoor, A.; Gan, M.Q.; Yin, H.X.; Yang, W.; He, F.; Zuo, H.F.; Ma, Y.H.; Yang, S.Y. Influence of nitrogen fertilizer and straw returning on CH4 emission from a paddy field in chao lake basin, China. Appl. Ecol. Environ. Res. 2020, 18, 1585–1600. [Google Scholar] [CrossRef]
  7. Huang, T.; Hu, X.K.; Gao, B.; Yang, H.; Huang, C.C.; Ju, X.T. Improved nitrogen management as a key mitigation to net global warming potential and greenhouse gas intensity on the North China plain. Soil Sci. Soc. Am. J. 2018, 82, 136–146. [Google Scholar] [CrossRef]
  8. Mueller, N.D.; Gerber, J.S.; Johnston, M.; Ray, D.K.; Ramankutty, N.; Foley, J.A. Closing yield gaps through nutrient and water management. Nature 2012, 490, 254–257. [Google Scholar] [CrossRef]
  9. Cheng, K.; Pan, G.X.; Smith, P.; Luo, T.; Li, L.Q.; Zheng, J.W.; Zhang, X.H.; Han, X.J.; Yan, M. Carbon footprint of China’s crop production-An estimation using agro-statistics data over 1993–2007. Agric. Ecosyst. Environ. 2011, 142, 231–237. [Google Scholar] [CrossRef]
  10. Xu, Q.; Dai, L.X.; Shang, Z.Y.; Zhou, Y.; Li, J.Y.; Dou, Z.; Yuan, X.C.; Gao, H. Application of controlled-release urea to maintain rice yield and mitigate greenhouse gas emissions of rice–crayfish coculture field. Agric. Ecosyst. Environ. 2023, 344, 108312. [Google Scholar] [CrossRef]
  11. Ding, W.H.; Chang, N.J.; Zhang, J.; Li, G.C.; Zhang, J.F.; Ju, X.H.; Zhang, G.L.; Li, H. Optimized fertigation mitigates N2O and NO emissions and enhances NH3 volatilizations in an intensified greenhouse vegetable system. Agric. Water Manag. 2022, 272, 107797. [Google Scholar] [CrossRef]
  12. Sun, Y.; Mi, W.H.; Su, L.J.; Shan, Y.Y.; Wu, L.H. Controlled-release fertilizer enhances rice grain yield and N recovery efficiency in continuous non-flooding plastic film mulching cultivation system. Field Crops Res. 2019, 231, 122–129. [Google Scholar] [CrossRef]
  13. Zhang, G.X.; Zhao, D.H.; Liu, S.J.; Liao, Y.C.; Han, J. Can controlled-release urea replace the split application of normal urea in China? A meta-analysis based on crop grain yield and nitrogen use efficiency. Field Crops Res. 2022, 275, 108343. [Google Scholar] [CrossRef]
  14. Yang, M.; Hou, Z.H.; Guo, N.X.; Yang, E.; Sun, D.; Fang, Y.T. Effects of enhanced-efficiency nitrogen fertilizers on CH4 and CO2 emissions in a global perspective. Field Crops Res. 2022, 288, 108694. [Google Scholar] [CrossRef]
  15. Chen, Z.M.; Wang, Q.; Ma, J.W.; Zou, P.; Jiang, L.N. Impact of controlled-release urea on rice yield, nitrogen use efficiency and soil fertility in a single rice cropping system. Sci. Rep. 2020, 10, 10432. [Google Scholar] [CrossRef] [PubMed]
  16. Fan, D.J.; He, W.T.; Jiang, R.; Song, D.P.; Zou, G.Y.; Chen, Y.H.; Cao, B.; Wang, J.C.; Wang, X.X. Enhanced efficiency fertilizers impact on nitrogen use efficiency and nitrous oxide emissions from an open-field vegetable system in North China. Plants 2023, 12, 81. [Google Scholar] [CrossRef] [PubMed]
  17. Chi, Y.; Yang, P.; Ren, S.; Ma, N.; Yang, J.; Xu, Y. Effects of fertilizer types and water quality on carbon dioxide emissions from soil in wheat-maize rotations. Sci. Total Environ. 2020, 698, 134010. [Google Scholar] [CrossRef]
  18. Liang, Z.H.; Jin, X.; Zhai, P.F.; Zhao, Y.; Cai, J.W.; Li, S.P.; Yang, S.Y.; Li, C.Z.; Li, C.J. Combination of organic fertilizer and slow-release fertilizer increases pineapple yields, agronomic efficiency and reduces greenhouse gas emissions under reduced fertilization conditions in tropical areas. J. Clean. Prod. 2022, 343, 131054. [Google Scholar] [CrossRef]
  19. Fan, D.J.; Wang, X.X.; Song, D.P.; Shi, Y.Y.; Chen, Y.H.; Wang, J.C.; Cao, B.; Zou, G.Y.; He, W.T. Optimizing nitrogen management to mitigate gaseous losses and improve net benefits of an open-field Chinese cabbage system. J. Environ. Manag. 2022, 318, 115583. [Google Scholar] [CrossRef]
  20. Abalos, D.; Jeffery, S.; Sanz-Cobena, A.; Guardia, G.; Vallejo, A. Meta-analysis of the effect of urease and nitrification inhibitors on crop productivity and nitrogen use efficiency. Agric. Ecosyst. Environ. 2014, 189, 136–144. [Google Scholar] [CrossRef]
  21. Tufail, M.A.; Naeem, A.; Arif, M.S.; Farooq, T.H.; Shahzad, S.M.; Dar, A.A.; Albasher, G.; Shakoor, A. Unraveling the efficacy of nitrification inhibitors (DCD and DMPP) in reducing nitrogen gases emissions across agroecosystems: A three-decade global data synthesis (1993–2021). Fuel 2022, 324, 124725. [Google Scholar] [CrossRef]
  22. Moir, J.L.; Malcolm, B.J.; Cameron, K.C.; Di, H.J. The effect of dicyandiamide on pasture nitrate concentration, yield and N offtake under high N loading in winter and spring. Grass Forage Sci. 2012, 67, 391–402. [Google Scholar] [CrossRef]
  23. Yin, M.; Gao, X.; Kuang, W.; Zhang, Y.H. Meta-analysis of the effect of nitrification inhibitors on the abundance and community structure of N2O-related functional genes in agricultural soils. Sci. Total Environ. 2023, 865, 161215. [Google Scholar] [CrossRef] [PubMed]
  24. Luo, Y.; Li, G.; Luo, W.; Schuchardt, F.; Jiang, T.; Xu, D. Effect of phosphogypsum and dicyandiamide as additives on NH3, N2O and CH4 emissions during composting. J. Environ. 2013, 25, 1338–1345. [Google Scholar] [CrossRef]
  25. Weiske, A.; Benckiser, G.; Herbert, T.; Ottow, J. Influence of the nitrification inhibitor 3, 4-dimethylpyrazole phosphate (DMPP) in comparison to dicyandiamide (DCD) on nitrous oxide emissions, carbon dioxide fluxes and methane oxidation during 3 years of repeated application in field experiments. Biol. Fert. Soils 2001, 34, 109–117. [Google Scholar]
  26. Raza, S.; Yun, J.; Elrys, A.S.; Tao, J.; Zhou, J. Dicyandiamide efficacy of inhibiting nitrification and carbon dioxide emission from calcareous soil depends on temperature and moisture contents. Arch. Agron. Soil Sci. 2021, 68, 1413–1429. [Google Scholar] [CrossRef]
  27. Ge, Y.; Yu, L.I.; Dong, Y.J.; He, M.R.; Dai, X.L. Effect of synergistic urea by nitrification inhibitor coated with resin on wheat growth and soil nitrogen supply. Pedosphere 2023, 33, 1–12. [Google Scholar] [CrossRef]
  28. Rashti, M.R.; Wang, W.; Moody, P.; Chen, C.; Ghadiri, H. Fertiliser-induced nitrous oxide emissions from vegetable production in the world and the regulating factors: A review. Atmos. Environ. 2015, 112, 225–233. [Google Scholar] [CrossRef]
  29. Zhang, F.; Liu, F.B.; Ma, X.; Guo, G.Z.; Liu, B.; Cheng, T.H.; Liang, T.; Tao, W.L.; Chen, X.P.; Wang, X.Z. Greenhouse gas emissions from vegetables production in China. J. Clean. Prod. 2021, 317, 128449. [Google Scholar] [CrossRef]
  30. Yao, Z.; Yan, G.; Wang, R.; Zheng, X.; Liu, C.; Butterbach-Bahl, K. Drip irrigation or reduced N-fertilizer rate can mitigate the high annual N2O+NO fluxes from Chinese intensive greenhouse vegetable systems. Atmos. Environ. 2019, 212, 183–193. [Google Scholar] [CrossRef]
  31. Wang, X.Z.; Zou, C.Q.; Gao, X.P.; Guan, X.L.; Zhang, W.H.; Zhang, Y.Q.; Shi, X.J.; Chen, X.P. Nitrous oxide emissions in Chinese vegetable systems: A meta-analysis. Environ. Pollut. 2018, 239, 375–383. [Google Scholar] [CrossRef] [PubMed]
  32. Hu, H.W.; Chen, D.L.; He, J.Z. Microbial regulation of terrestrial nitrous oxide formation: Understanding the biological pathways for prediction of emission rates. FEMS Microbiol. Rev. 2015, 39, 729–749. [Google Scholar] [CrossRef] [PubMed]
  33. Ye, X.H.; Han, B.; Li, W.; Zhang, X.C.; Zhang, Y.L.; Lin, X.G.; Zou, H.T. Effects of different irrigation methods on nitrous oxide emissions and ammonia oxidizers microorganisms in greenhouse tomato fields. Agric. Water Manag. 2018, 203, 115–123. [Google Scholar] [CrossRef]
  34. Zhou, P.; Bai, X.L.; Wang, H.Y.; Yang, M.X.; Bao, L.; Deng, X.F.; Chen, Z.J.; Zhou, J.B. Optimizing nitrogen and water management for sustainable greenhouse vegetable production with less greenhouse gas emissions. Agric. Ecosyst. Environ. 2023, 352, 108529. [Google Scholar] [CrossRef]
  35. Qasim, W.; Xia, L.L.; Lin, S.; Wan, L.; Zhao, Y.M.; Butterbach-Bahl, K. Global greenhouse vegetable production systems are hotspots of soil N2O emissions and nitrogen leaching: A meta-analysis. Environ. Pollut. 2021, 272, 116372. [Google Scholar] [CrossRef]
  36. Lin, J.T.; Xu, Z.Y.; Xue, Y.H.; Sun, R.H.; Yang, R.G.; Cao, X.X.; Li, H.; Shao, Q.; Lou, Y.H.; Wang, H.; et al. N2O emissions from soils under short-term straw return in a wheat-corn rotation system are associated with changes in the abundance of functional microbes. Agric. Ecosyst. Environ. 2023, 341, 108217. [Google Scholar] [CrossRef]
  37. Akiyama, H.; Morimoto, S.; Hayatsu, M.; Hayakawa, A.; Sudo, S.; Yagi, K. Nitrification, ammonia-oxidizing communities, and N2O and CH4 fluxes in an imperfectly drained agricultural field fertilized with coated urea with and without dicyandiamide. Biol. Fert. Soils 2013, 49, 213–233. [Google Scholar] [CrossRef]
  38. Chen, M.; Pan, H.; Sun, M.; He, W.; Wei, M.; Lou, Y.; Wang, H.; Yang, Q.; Feng, H.; Zhuge, Y. Nitrosospira cluster 3 lineage of AOB and nirK of Rhizobiales respectively dominated N2O emissions from nitrification and denitrification in organic and chemical N fertilizer treated soils. Ecol. Indic. 2021, 127, 107722. [Google Scholar] [CrossRef]
  39. Cheng, Y.; Elrys, A.S.; Wang, J.; Xu, C.; Ni, K.; Zhang, J.; Wang, S.; Cai, Z.; Pacholski, A. Application of enhanced-efficiency nitrogen fertilizers reduces mineral nitrogen usage and emissions of both N2O and NH3 while sustaining yields in a wheat-paddy rotation system. Agric. Ecosyst. Environ. 2022, 324, 107720. [Google Scholar] [CrossRef]
  40. Ni, B.; Zhang, W.; Xu, X.C.; Wang, L.G.; Bol, R.; Wang, K.Y.; Hu, Z.J.; Zhang, H.X.; Meng, F.Q. Exponential relationship between N2O emission and fertilizer nitrogen input and mechanisms for improving fertilizer nitrogen efficiency under intensive plastic-shed vegetable production in China: A systematic analysis. Agric. Ecosyst. Environ. 2021, 312, 107353. [Google Scholar] [CrossRef]
  41. Zhang, Z.W.; Chen, G.L.; Yu, X.Y.; Liang, D.; Xu, C.; Ji, C.; Wang, L.; Ma, H.B.; Wang, J.D. A slow-release fertilizer containing cyhalofop-butyl reduces N2O emissions by slowly releasing nitrogen and down-regulating the relative abundance of nirK. Sci. Total Environ. 2024, 906, 167493. [Google Scholar] [CrossRef] [PubMed]
  42. Min, J.; Sun, H.; Kronzucker, H.J.; Wang, Y.; Shi, W. Comprehensive assessment of the effects of nitrification inhibitor application on reactive nitrogen loss in intensive vegetable production systems. Agric. Ecosyst. Environ. 2021, 307, 107227. [Google Scholar] [CrossRef]
  43. Giles, M.; Morley, N.; Baggs, E.M.; Daniell, T.J. Soil nitrate reducing processes—drivers, mechanisms for spatial variation, and significance for nitrous oxide production. Front. Microbiol. 2012, 3, 407. [Google Scholar] [CrossRef] [PubMed]
  44. Yang, M.; Guo, N.X.; Zhang, J.T.; Hou, Z.H.; Chen, Z.X.; Sun, D.; Zou, H.T. Enhanced efficiency nitrogen fertilizer provides a reliable option for mitigating global warming potential in agroecosystems worldwide. Sci. Total Environ. 2023, 26, 168080. [Google Scholar]
  45. Bortoletto-Santos, R.; Guimaraes, G.G.F.; Roncato, V.; da Cruz, D.F.; Polito, W.L.; Ribeiro, C. Biodegradable oil-based polymeric coatings on urea fertilizer: N release kinetic transformations of urea in soil. Sci. Agric. 2020, 77, 20180033. [Google Scholar] [CrossRef]
  46. Chataut, G.; Bhatta, B.; Joshi, D.; Subedi, K.; Kafle, K. Greenhouse gases emission from agricultural soil: A review. J. Agric. Food Chem. 2023, 11, 100533. [Google Scholar] [CrossRef]
  47. Zhong, Y.Q.W.; Yan, W.M.; Shangguan, Z.P. The effects of nitrogen enrichment on soil CO2 fluxes depending on temperature and soil properties. Glob. Ecol. Biogeogr. 2016, 25, 475–488. [Google Scholar] [CrossRef]
  48. Huang, J.Y.; Richard, H.; Zheng, S.F. Effects of nitrogen fertilization on soil labile carbon fractions of freshwater marsh soil in Northeast China. Int. J. Environ. Sci. Technol. 2014, 11, 2009–2014. [Google Scholar] [CrossRef]
  49. Lin, S.; Zhang, S.P.; Shen, G.T.; Shaaban, M.; Ju, W.L.; Cui, Y.X.; Duan, C.J.; Fang, L.C. Effects of inorganic and organic fertilizers on CO2 and CH4 fluxes from tea plantation soil. Elem.-Sci. Anthr. 2021, 9, 90–99. [Google Scholar] [CrossRef]
  50. Huang, M.; Chen, X.P.; Degen, A.A.; Guo, R.Y.; Zhan, T.; Luo, B.Y.; Li, H.Y.; Zhao, J.X.; Shang, Z.H. Nitrogen addition stimulated soil respiration more so than carbon addition in alpine meadows. Environ. Res. 2023, 233, 116501. [Google Scholar] [CrossRef]
  51. Kim, G.W.; Alam, M.A.; Lee, J.J.; Kim, G.Y.; Kim, P.J.; Khan, M.I. Assessment of direct carbon dioxide emission factor from urea fertilizer in temperate upland soil during warm and cold cropping season. Eur. J. Soil Biol. 2017, 83, 76–83. [Google Scholar] [CrossRef]
  52. Kim, G.W.; Jeong, S.T.; Kim, G.Y.; Kim, P.J.; Kim, S.Y. Evaluation of carbon dioxide emission factor from urea during rice cropping season: A case study in Korean paddy soil. Atmos. Environ. 2016, 139, 139–146. [Google Scholar] [CrossRef]
  53. Zhang, K.P.; Wang, Z.Y.; Xu, Q.W.; Liu, B.Y.; Duan, M.C.; Wang, L.C. Effect of controlled-release urea fertilizers for oilseed rape (brassica napus l.) on soil carbon storage and CO2 emission. Environ. Sci. Pollut. Res. 2020, 27, 31983–31994. [Google Scholar] [CrossRef] [PubMed]
  54. Elrys, A.S.; Raza, S.; Elnahal, A.S.M.; Na, M.; Ahmed, M.; Zhou, J.B.; Chen, Z.J. Do soil property variations affect dicyandiamide efficiency in inhibiting nitrification and minimizing carbon dioxide emissions? Ecotoxicol. Environ. Saf. 2020, 202, 110875. [Google Scholar] [CrossRef] [PubMed]
  55. Cleveland, C.C.; Townsend, A.R. Nutrient additions to a tropical rain forest drive substantial soil carbon dioxide losses to the atmosphere. Proc. Natl. Acad. Sci. USA 2019, 103, 10316–10321. [Google Scholar] [CrossRef] [PubMed]
  56. Xiao, Y.; Che, Y.; Zhang, F.; Li, Y.; Liu, M. Effects of biochar, n fertilizer, and crop residues on greenhouse gas emissions from acidic soils. CLEAN–Soil Air Water 2018, 46, 1700346. [Google Scholar] [CrossRef]
  57. Wang, X.; Bai, J.H.; Xie, T.; Wang, W.; Zhang, G.L.; Yin, S.; Wang, D.W. Effects of biological nitrification inhibitors on nitrogen use efficiency and greenhouse gas emissions in agricultural soils: A review. Ecotoxicol. Environ. Saf. 2021, 220, 112338. [Google Scholar] [CrossRef] [PubMed]
  58. Xiao, Y.S.; Peng, F.T.; Zhang, Y.F.; Wang, J.; Zhuge, Y.P.; Zhang, S.S.; Gao, H.F. Effect of bag-controlled release fertilizer on nitrogen loss, greenhouse gas emissions, and nitrogen applied amount in peach production. J. Clean. Prod. 2019, 234, 258–274. [Google Scholar] [CrossRef]
  59. Liu, Y.D.; Ma, C.; Li, G.H.; Jiang, Y.; Hou, P.F.; Xue, L.H.; Yang, L.Z.; Ding, Y.F. Lower dose of controlled/slow release fertilizer with higher rice yield and N utilization in paddies: Evidence from a meta-analysis. Field Crops Res. 2023, 294, 108879. [Google Scholar] [CrossRef]
  60. Gao, Y.X.; Feng, H.J.; Zhang, M.; Shao, Y.Q.; Wang, J.Q.; Liu, Y.L.; Li, C.L. Straw returning combined with controlled-release nitrogen fertilizer affected organic carbon storage and crop yield by changing humic acid composition and aggregate distribution. J. Clean. Prod. 2023, 415, 137783. [Google Scholar] [CrossRef]
  61. Yu, K.; Fang, X.T.; Zhang, Y.H.; Miao, Y.C.; Liu, S.W.; Zou, J.W. Low greenhouse gases emissions associated with high nitrogen use efficiency under optimized fertilization regimes in double-rice cropping systems. Appl. Soil Ecol. 2021, 160, 103846. [Google Scholar] [CrossRef]
  62. Zhang, M.; Fan, C.H.; Li, Q.L.; Li, B.; Zhu, Y.Y.; Xiong, Z.Q. A 2-yr field assessment of the effects of chemical and biological nitrification inhibitors on nitrous oxide emissions and nitrogen use efficiency in an intensively managed vegetable cropping system. Agric. Ecosyst. Environ. 2015, 201, 43–50. [Google Scholar] [CrossRef]
  63. Xu, Y.; Wang, Y.; Ma, X.; Liu, X.; Zhang, P.; Cai, T.; Jia, Z. Ridge-furrow mulching system and supplementary irrigation can reduce the greenhouse gas emission intensity. Sci. Total Environ. 2020, 717, 137262. [Google Scholar] [CrossRef] [PubMed]
  64. Zhang, Z.S.; Chen, J.; Liu, T.Q.; Cao, C.G.; Li, C.F. Effects of nitrogen fertilizer sources and tillage practices on greenhouse gas emissions in paddy fields of central China. Atmos. Environ. 2016, 144, 274–281. [Google Scholar] [CrossRef]
  65. Wu, P.; Liu, F.; Li, H.; Cai, T.; Zhang, P.; Jia, Z. Suitable fertilizer application depth can increase nitrogen use efficiency and maize yield by reducing gaseous nitrogen losses. Sci. Total Environ. 2021, 781, 146787. [Google Scholar] [CrossRef]
Figure 1. Soil N2O emission flux during the experimental period (2017 to 2021) under different treatments. (Note: S—seedling, L—lotus, H—heading, M—mature, Spr.—spring, Aut.—autumn). CK, without N application; U, according to the local farmers’ practice; ON, conventional urea at a reduced 20% N rate; CRU, polyurethane-coated urea at a reduced 20% N rate; DCRU, polyurethane-coated urea containing DCD at a reduced 20% N rate.
Plants 13 01071 g001
Figure 2. Soil CO2 emission flux during the experimental period (2017–2021) under different treatments. Note: S—seedling, L—lotus, H—heading, M—mature, Spr.—spring, Aut.—autumn. CK, without N application; U, according to the local farmers’ practice; ON, conventional urea at a reduced 20% N rate; CRU, polyurethane-coated urea at a reduced 20% N rate; DCRU, polyurethane-coated urea containing DCD at a reduced 20% N rate.
Plants 13 01071 g002
Figure 3. The mean cumulative emissions of N2O (a) and CO2 (b), GWP (c) and GHGI (d) during experimental period (2017–2021) under different treatments. Note: Means with the same lower-case letter across treatments within each figure are not significantly different at p < 0.05. The error bars represent the standard error. CK, without N application; U, according to local farmers’ practice; ON, conventional urea at a reduced 20% N rate; CRU, polyurethane-coated urea at a reduced 20% N rate; DCRU, polyurethane-coated urea containing DCD at a reduced 20% N rate.
Plants 13 01071 g003
Figure 4. Soil NH4+-N ((a), spring; (b), autumn) and NO3-N ((c), spring; (d), autumn) contents during the experimental period (2017–2021) under different treatments. Note: Means with the same lower-case letter across treatments within each figure are not significantly different at p < 0.05. The error bars represent the standard error. CK, without N application; U, according to the local farmers’ practice; ON, conventional urea at a reduced 20% N rate; CRU, polyurethane-coated urea at a reduced 20% N rate; DCRU, polyurethane-coated urea containing DCD at a reduced 20% N rate.
Plants 13 01071 g004
Figure 5. The lettuce yield ((a), spring; (b), autumn) and net yield ((c), spring; (d), autumn) during the experimental period (2017 to 2021) under different treatments. Note: Means with the same lower-case letter across treatments within each figure are not significantly different at p < 0.05. The error bars represent the standard error. CK, without N application; U, according to the local farmers’ practice; ON, conventional urea at a reduced 20% N rate; CRU, polyurethane-coated urea at a reduced 20% N rate; DCRU, polyurethane-coated urea containing DCD at a reduced 20% N rate.
Plants 13 01071 g005
Figure 6. Lettuce N contents in spring (a) and autumn (b) during the experimental period (2017–2021) under different treatments. Note: CK, without N application; U, according to the local farmers’ practice; ON, conventional urea at a reduced 20% N rate; CRU, polyurethane-coated urea at a reduced 20% N rate; DCRU, polyurethane-coated urea containing DCD at a reduced 20% N rate.
Plants 13 01071 g006
Table 1. Effect of different treatments on N2O emission fluxes (μg m−2 h−1) in the lettuce growing seasons.
YearSeasonsCKUONCRUDCRU
2017Spring60.83 ± 7.66 c203.29 ± 22.58 a181.89 ± 27.80 ab182.55 ± 28.23 ab167.69 ± 21.21 b
Autumn64.44 ± 7.31 c200.22 ± 24.50 a178.23 ± 32.56 ab160.51 ± 31.33 ab142.92 ± 24.19 b
2018Spring42.79 ± 5.71 c233.69 ± 26.21 a207.62 ± 31.30 ab190.18 ± 26.94 ab169.48 ± 25.88 b
Autumn40.87 ± 6.26 c226.40 ± 30.50 a197.83 ± 27.90 ab183.61 ± 28.93 ab165.17 ± 22.53 b
2019Spring22.62 ± 2.04 c241.27 ± 29.95 a203.64 ± 30.02 ab192.25 ± 31.63 ab172.12 ± 27.54 b
Autumn23.30 ± 3.18 c228.76 ± 28.82 a199.67 ± 29.15 ab186.42 ± 30.18 ab167.78 ± 26.93 b
2020Spring16.62 ± 1.77 c245.31 ± 32.08 a215.63 ± 28.31 ab197.23 ± 32.14 ab175.75 ± 28.89 b
Autumn18.31 ± 2.05 c231.94 ± 28.89 a200.35 ± 27.31 ab189.66 ± 30.34 ab170.95 ± 30.05 b
2021Spring15.30 ± 1.75 c259.57 ± 30.23 a227.81 ± 35.94 ab209.14 ± 31.33 ab183.04 ± 28.23 b
Autumn16.22 ± 1.70 c253.22 ± 31.69 a221.72 ± 28.55 ab204.51 ± 30.59 ab178.95 ± 32.60 b
2017–2021Spring–autumn32.13 ± 7.66 c231.12 ± 27.68 a202.44 ± 31.83 ab189.01 ± 30.47 ab169.34 ± 26.32 b
Note: Values are means ± SE (standard error) of four replicates. The same letter within a row means no significant difference at the level of 0.05. CK, without N application; U, according to the local farmers’ practice; ON, conventional urea at a reduced 20% N rate; CRU, polyurethane-coated urea at a reduced 20% N rate; DCRU, polyurethane-coated urea containing DCD at a reduced 20% N rate.
Table 2. Effect of different treatments on CO2 emission fluxes (mg m−2 h−1) in the lettuce growing seasons.
YearSeasonsCKUONCRUDCRU
2017Spring251.92 ± 12.86 b347.99 ± 22.78 a344.89 ± 18.19 a340.05 ± 19.77 a327.16 ± 19.48 a
Autumn256.22 ± 20.44 b311.12 ± 28.38 a306.29 ± 25.15 a301.86 ± 25.75 a295.55 ± 19.82 a
2018Spring231.80 ± 6.61 b362.82 ± 16.91 a347.17 ± 13.28 a341.81 ± 12.47 a333.55 ± 11.40 a
Autumn214.90 ± 11.79 b322.07 ± 20.78 a314.22 ± 21.50 a306.16 ± 22.29 a299.99 ± 18.98 a
2019Spring206.35 ± 7.76 b354.67 ± 13.48 a337.91 ± 14.42 a335.03 ± 13.06 a326.79 ± 22.95 a
Autumn200.78 ± 8.30 b330.01 ± 26.06 a321.36 ± 22.63 a312.77 ± 23.07 a309.25 ± 19.74 a
2020Spring191.16 ± 7.66 b357.43 ± 15.97 a351.70 ± 10.04 a343.92 ± 13.29 a336.76 ± 19.28 a
Autumn192.56 ± 6.50 b331.89 ± 21.33 a315.24 ± 22.79 a306.89 ± 24.08 a295.95 ± 20.53 a
2021Spring198.52 ± 7.04 b349.79 ± 14.64 a333.88 ± 12.92 a327.97 ± 19.77 a323.16 ± 22.52 a
Autumn190.31 ± 6.54 b302.37 ± 25.20 a295.28 ± 26.72 a283.10 ± 16.86 a272.86 ± 18.58 a
2017–2021Spring–autumn209.45 ± 10.15 b337.02 ± 9.95 a326.79 ± 7.03 a319.96 ± 7.84 a312.10 ± 9.53 a
Note: Values are means ± SE (standard error) of four replicates. The same letter within row means no significant difference at the level of 0.05. CK, without N application; U, according to the local farmers’ practice; ON, conventional urea at a reduced 20% N rate; CRU, polyurethane-coated urea at a reduced 20% N rate; DCRU, polyurethane-coated urea containing DCD at a reduced 20% N rate.
Disclaimer/Publisher’s Note: The statements, opinions and data contained in all publications are solely those of the individual author(s) and contributor(s) and not of MDPI and/or the editor(s). MDPI and/or the editor(s) disclaim responsibility for any injury to people or property resulting from any ideas, methods, instructions or products referred to in the content.

