

Mining of QTLs for Spring Bread Wheat Spike Productivity by Comparing Spring Wheat Cultivars Released in Different Decades of the Last Century
 ,
,  , , , and
Abstract
1. Introduction
2. Results
2.1. Phenotyping
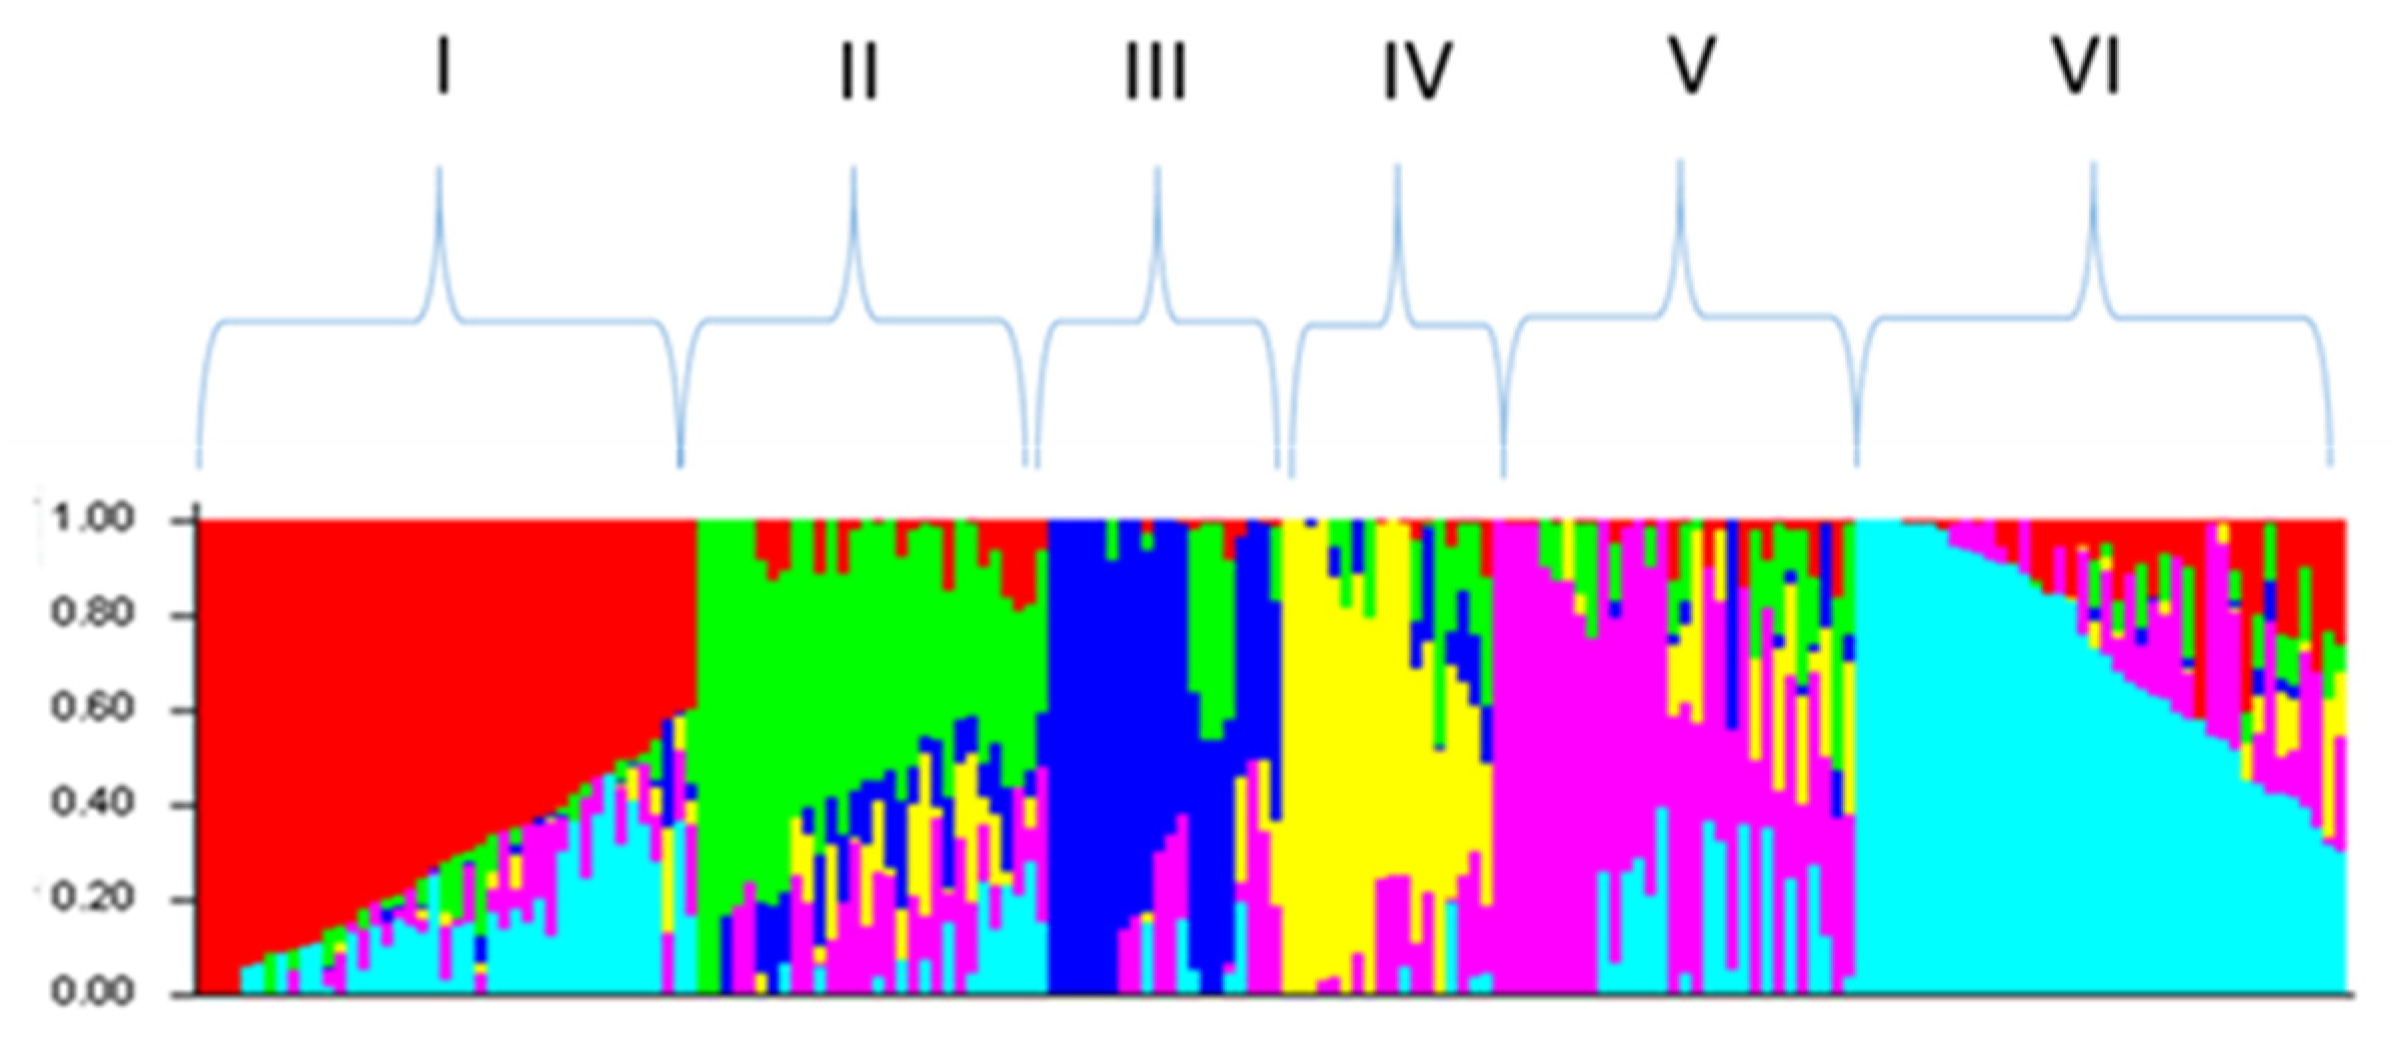
2.2. Analysis of Genotyping Data
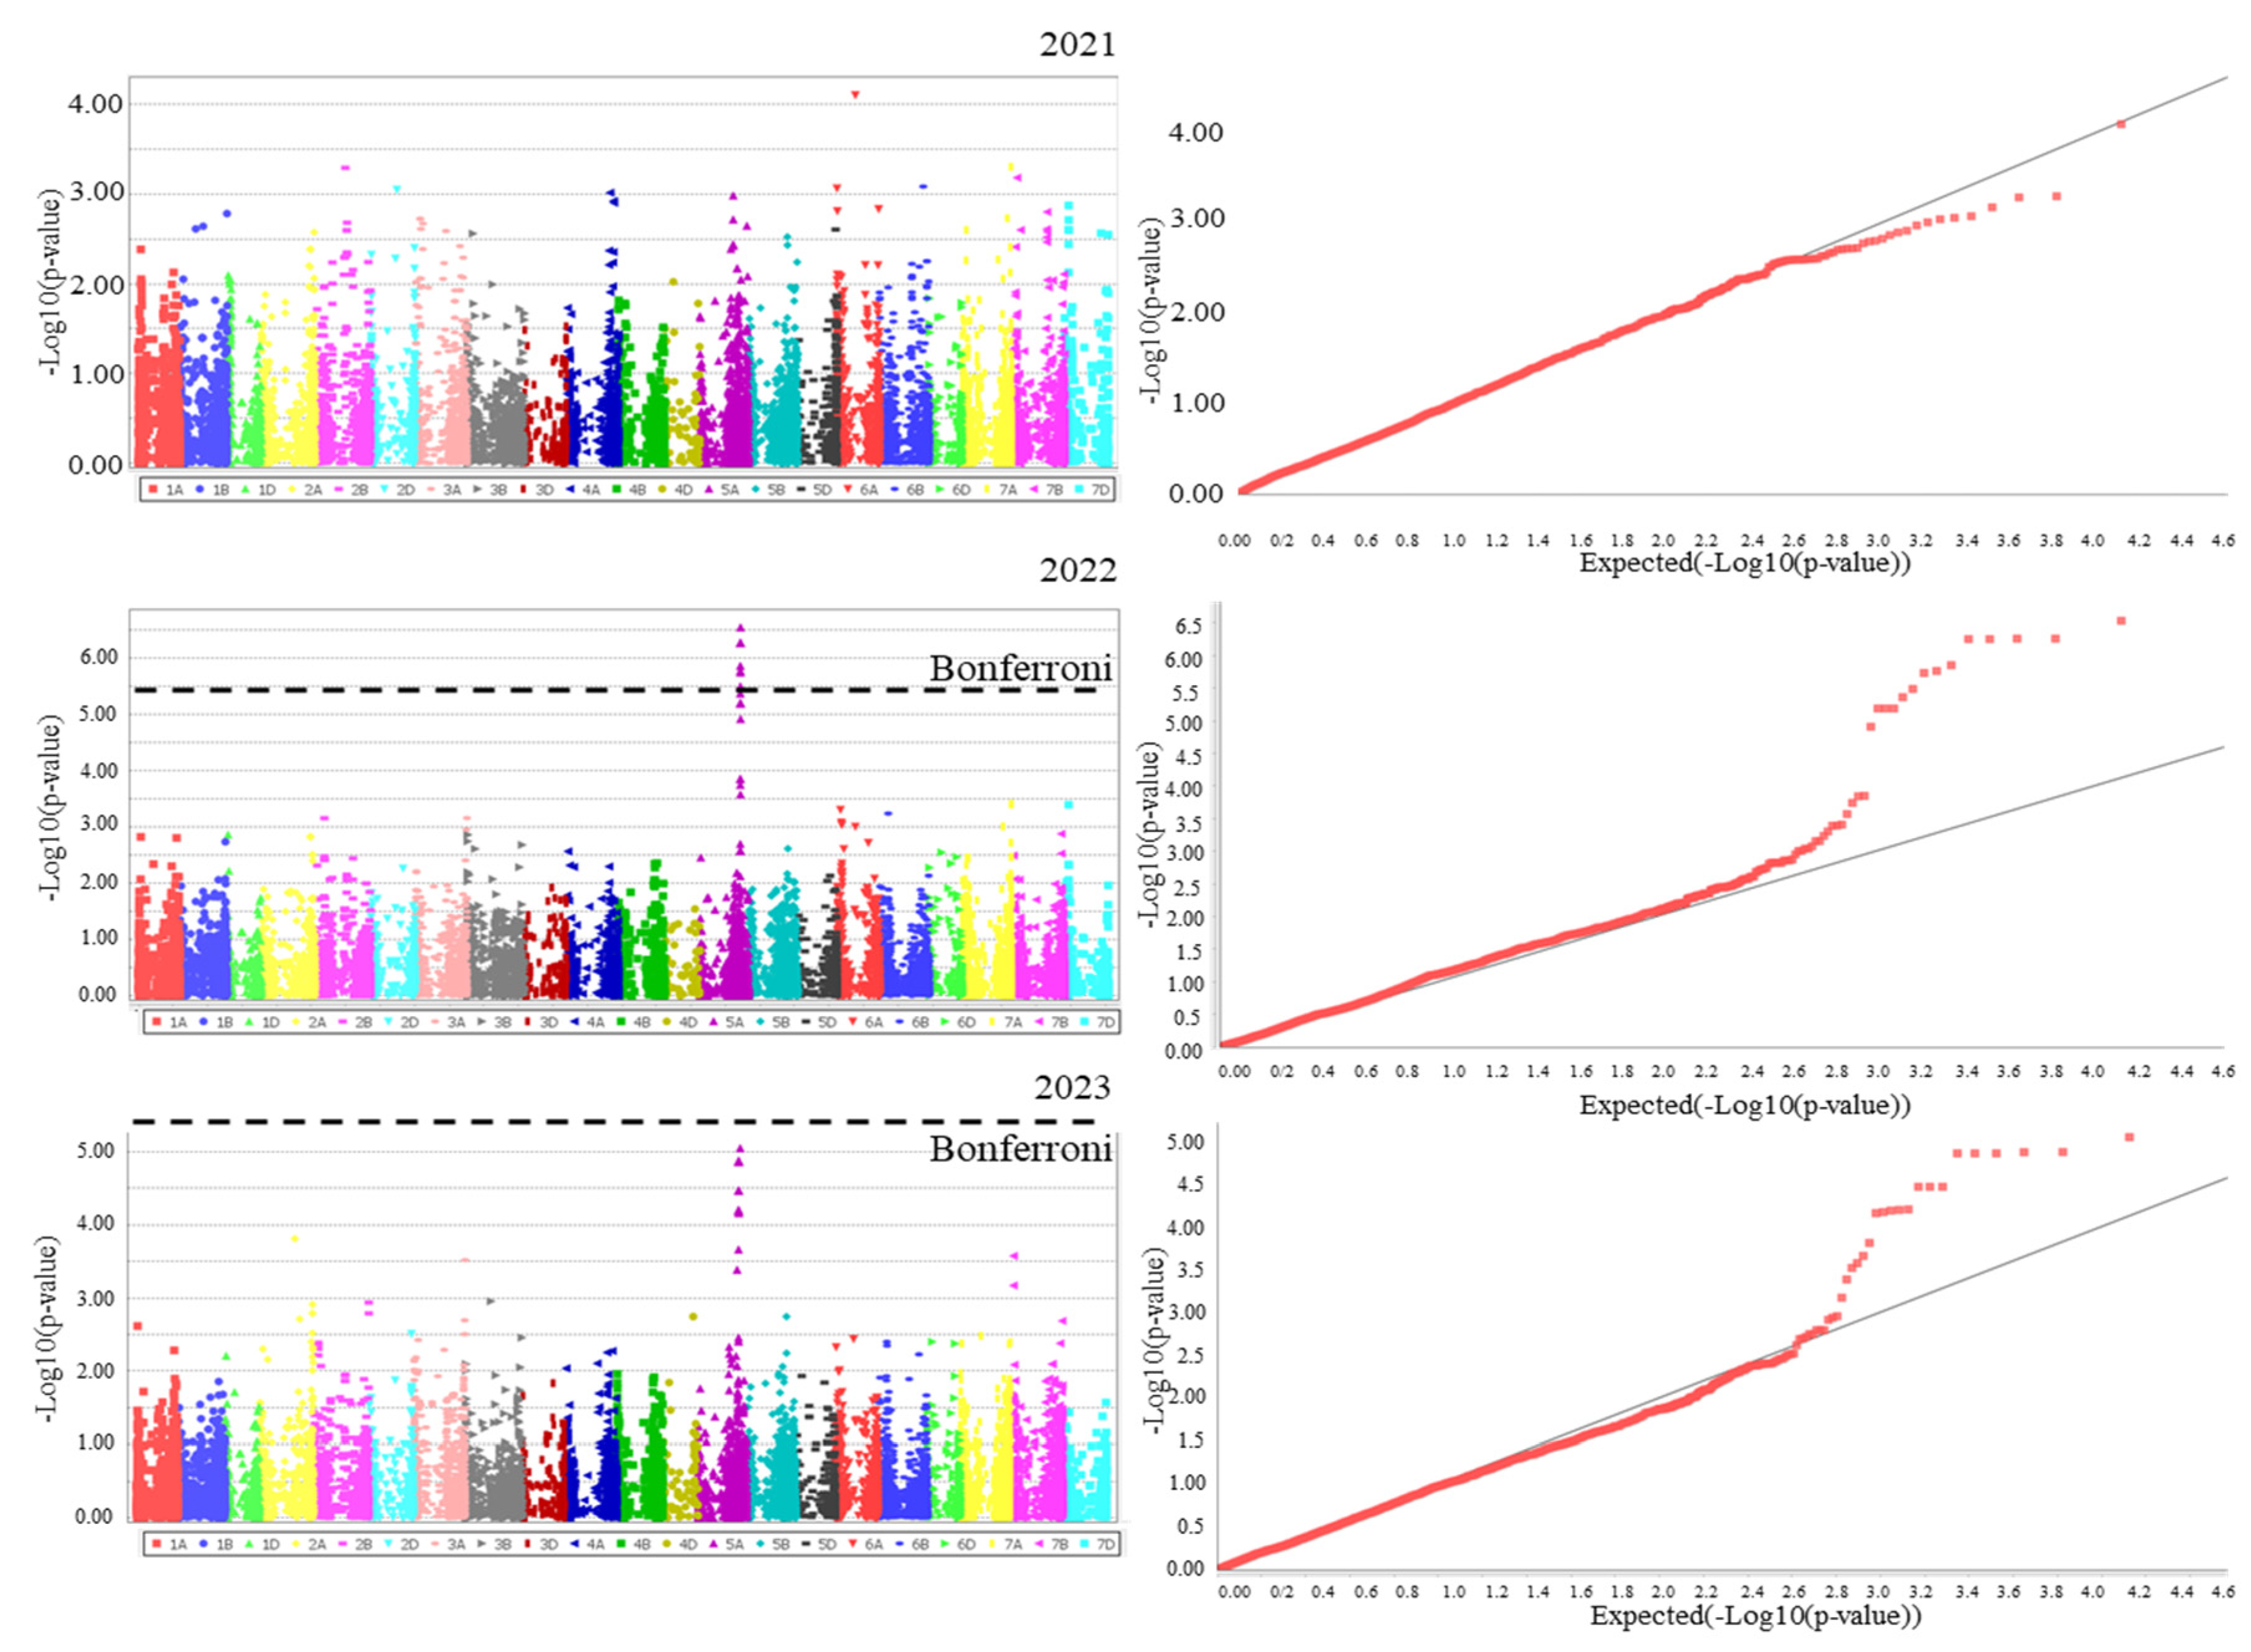
2.3. Association Analysis
2.3.1. Productivity
2.3.2. Technological Evaluation
- (1)
- Protein content is one of the main indicators of the nutritional value of grain. It is considered that this parameter does not depend directly on gluten quality. In some cases, its antagonism is observed in relation to grain quality indicators associated with gluten properties.
- (2)
- Ash content also characterizes the nutritional and forage value of grain. Its increased values are regarded as an unfavorable factor that reduces the nutritional value.
- (3)
- Test weight is one of the important criteria for assessing technological properties of wheat grain. It has a direct impact on flour yield during grain milling. Moreover, this indicator is not directly linked to gluten or starch quality, which makes it an independent characteristic in the genetic sense. Test weight can be affected by grain size and its density.
- (4)
- Flour color. This indicator was assessed in whole-grain flour; therefore, its intensity, aside from the color of endosperm particles, depended on the ratio of grain hulls to endosperm. The higher its value, the more this ratio was shifted towards endosperm.
- (5)
- Sedimentation value. The sedimentation method is widely used in grain quality evaluation. The SDS-sedimentation techniques have received most recognition in breeding and genetic research for the large-scale evaluation of breeding material. Sedimentation value is considered to be a generalized criterion of grain quality that characterizes the capacity of ground grain for stable swelling, as well as the quality of storage proteins and gluten. Such an approach to grain quality evaluation is highly efficient and involves low material consumption. Sedimentation value was noted to have a high level of heritability in progenies compared to other criteria of grain quality.
3. Discussion
4. Materials and Methods
4.1. Plant Material and Genotyping Data
4.2. Field Experiment and Phenotyping
4.3. DNA Isolation
4.4. Sample Genotyping
4.5. Population Structure
4.6. Statistical Analysis
4.7. Association Analysis
4.8. Meta-Analysis
4.9. Technological Evaluation of Grain
5. Conclusions
Supplementary Materials
Author Contributions
Funding
Data Availability Statement
Conflicts of Interest
References
- Masalov, V.N.; Berezina, N.A.; Chervonova, I.V. The state of the grain farming in Russia, the role of grain crops in the feeding of agricultural animals and human diet. Vestn. Agrar. Nauk. 2021, 89, 3–15. [Google Scholar] [CrossRef]
- Andersson, A.A.; Andersson, R.; Piironen, V.; Lampi, A.M.; Nystrom, L.; Boros, D.; Aman, P. Contents of dietary fibre components and their relation to associated bioactive components in whole grain wheat samples from the HEALTHGRAIN diversity screen. Food Chem. 2013, 136, 1243–1248. [Google Scholar] [CrossRef]
- Darrier, L.D.; Ramsay, B.; Russell, J.; Milner, S.G.; Hedley, P.E.; Shaw, P.D.; Ma-caulay, M.; Halpin, C.; Mascher, M.; Fleury, D.L.; et al. Comparison of mainstream genotyping platforms for the evaluation and use of barley genetic resources. Front. Plant Sci. 2019, 10, 544. [Google Scholar] [CrossRef]
- Song, Q.L.; Fickus, E.W.; Cregan, P.B. Characterization of trinucleotide SSR motifs in wheat. Theor. Appl. Genet. 2002, 104, 286–293. [Google Scholar] [CrossRef]
- Luo, M.C.; Gu, Y.Q.; Puiu, D.; Wang, H.; Twardziok, S.O.; Deal, K.R.; Huo, N.; Zhu, T.; Wang, L.; Wang, Y.; et al. Genome sequence of the progenitor of the wheat D genome Aegilops tauschii. Nature 2017, 551, 498–502. [Google Scholar] [CrossRef]
- Maccaferri, M.; Harris, N.S.; Twardziok, S.O.; Pasam, R.K.; Gundlach, H.; Spannagl, M.; Ormanbekova, D.; Lux, T.; Prade, V.M.; Milner, S.G.; et al. Durum wheat genome highlights past domestication signatures and future improvement targets. Nat. Genet. 2019, 51, 885–895. [Google Scholar] [CrossRef]
- Ling, H.Q.; Ma, B.; Shi, X.; Liu, H.; Dong, L.; Sun, H.; Cao, Y.; Gao, Q.; Zheng, S.; Li, Y.; et al. Genome sequence of the progenitor of wheat A subgenome Triticum urartu. Nature 2018, 557, 424–428. [Google Scholar] [CrossRef]
- Jaiswal, V.; Gahlaut, V.; Meher, P.K.; Mir, R.R.; Jaiswal, J.P.; Rao, A.R.; Balyan, H.S.; Gupta, P.K. Genome Wide Single Locus Single Trait, Multi-Locus and Multi-Trait Association Mapping for Some Important Agronomic Traits in Common Wheat (T. aestivum L.). PLoS ONE 2016, 11, e0159343. [Google Scholar] [CrossRef]
- Wang, D.G.; Fan, J.B.; Siao, C.J.; Berno, A.; Young, P.; Sapolsky, R.; Ghandour, G.; Perkins, N.; Winchester, E.; Spencer, J.; et al. Large-scale identification, mapping, and genotyping of single-nucleotide polymorphisms in the human genome. Science 1998, 280, 1077–1082. [Google Scholar] [CrossRef]
- Leonova, I.; Kiseleva, A.; Berezhnaya, A.; Orlovskaya, O.; Salina, E. Novel Genetic Loci from Triticum timopheevii Associated with Gluten Content Revealed by GWAS in Wheat Breeding Lines. Int. J. Mol. Sci. 2023, 24, 13304. [Google Scholar] [CrossRef]
- Amalova, A.; Yessimbekova, M.; Ortaev, A.; Rsaliyev, S.; Griffiths, S.; Burakhoja, A.; Turuspekov, Y.; Abugalieva, S. Association Mapping of quantitative trait loci for agronomic traits in a winter wheat collection grown in Kazakhstan. Agronomy 2023, 8, 2054. [Google Scholar] [CrossRef]
- Juliana, P.; Singh, R.P.; Singh, P.K.; Poland, J.A.; Bergstrom, G.C.; Huerta-Espino, J.; Bhavani, S.; Crossa, J.; Sorrells, M.E. Genome-wide association mapping for resistance to leaf rust, stripe rust and tan spot in wheat reveals potential candidate genes. Theor. Appl. Genet. 2018, 131, 1405–1422. [Google Scholar] [CrossRef] [PubMed]
- Lasky, J.; Josephs, E.; Morris, G. Genotype–environment associations to reveal the molecular basis of environmental adaptation. Plant Cell 2023, 35, 125–138. [Google Scholar] [CrossRef] [PubMed]
- Bradbury, P.J.; Zhang, Z.; Kroon, D.E.; Casstevens, T.M.; Ramdoss, Y.; Buckler, E.S. TASSEL: Software for association maping of complex traits in diverse samples. Bioinformatics 2007, 23, 2633–2635. [Google Scholar] [CrossRef] [PubMed]
- Guo, Z.; Chen, D.; Alqudah, A.M.; Ganal, M.W.; Schnurbusch, T. Genome-wide association analyses of 54 traits identified multiple loci for the determination of floret fertility in wheat. New Phytol. 2017, 214, 257–270. [Google Scholar] [CrossRef] [PubMed]
- Bhatta, M.; Shamanin, V.; Shepelev, S.; Baenziger, P.S.; Pozherukova, V.; Pototskaya, I.; Morgounov, A. Marker-Trait Associations for Enhancing Agronomic Performance, Disease Resistance, and Grain Quality in Synthetic and Bread Wheat Accessions in Western Siberia. G3 Genes Genomes Genet. 2019, 9, 4209–4222. [Google Scholar] [CrossRef] [PubMed]
- Klug, W.; Cummings, M.; Spencer, C.A. Essentials of Genetics; Tekhnosphere: Moscow, Russia, 2021; Available online: https://www.studentlibrary.ru/book/ISBN9785948366234.html (accessed on 17 January 2024).
- Hagel, I.; Ewald, D.; Kok, D.; Luit, D. Sulfur and baking-quality of breadmaking wheat. Landbauforsch Völkenrode 2005, 283, 23–36. [Google Scholar]
- Morozova, E.V.; Pshenichnikova, T.A.; Simonov, A.V.; Shchukina, L.V.; Chistyakova, A.K.; Khlestkina, E.K. A comparative study of grain and flour quality parameters among Russian bread wheat cultivars developed in different historical periods and their association with certain molecular markers. EWAC Newsl. 2016, 16, 49–56. [Google Scholar]
- Merezhko, A.F.; Udachin, R.A.; Zuev, E.V.; Filatenko, A.A.; Serbin, A.A.; Lyapunova, O.A.; Kosov, V.Y.; Kurkiev, U.K.; Okhotnikova, T.V.; Navruzbekov, N.A.; et al. Replenishment, preservation and study of the world’s collection of wheat, aegilops and triticale. (Methodol. Instr.) St. Petersburg VIR 1999, 81, 30–47. [Google Scholar]
- Donini, P.; Law, J.R.; Koebner, R.M.D.; Reeves, J.C.; Cooke, R.J. Temporal trends in the diversity of UK wheat. Theor. Appl. Genet. 2000, 100, 912–917. [Google Scholar] [CrossRef]
- Manifesto, M.M.; Schlatter, A.R.; Hopp, H.E.; Suarez, E.Y.; Dubcovsky, J. Quantitative evaluation of genetic diversity in wheat germplasm using molecular markers. Crop Sci. 2001, 41, 682–690. [Google Scholar] [CrossRef]
- Khlestkina, E.K.; Huang, X.; Quenun, S.Y.B.; Chebotar, S.; Röder, M.S.; Börner, A. Genetic diversity in cultivated plants—Loss or stability. Theor. Appl. Genet. 2004, 108, 1466–1472. [Google Scholar] [CrossRef]
- Khlestkina, E.K.; Röder, M.S.; Efremova, T.T.; Börner, A.; Shumny, V.K. The genetic diversity of old and modern Siberian varieties of common spring wheat determined by microsatellite markers. Plant Breed. 2004, 123, 122–127. [Google Scholar] [CrossRef]
- Marone, D.; Russo, M.A.; Mores, A.; Ficco, D.B.M.; Laidò, G.; Mastrangelo, A.M.; Borrelli, G.M. Importance of Landraces in Cereal Breeding for Stress Tolerance. Plants 2021, 10, 1267. [Google Scholar] [CrossRef]
- Adhikari, S.; Kumari, J.; Jacob, S.R.; Prasad, P.; Gangwar, O.P.; Lata, C.; Thakur, R.; Singh, A.K.; Bansal, R.; Kumar, S.; et al. Landraces-potential treasure for sustainable wheat improvement. Genet. Resour. Crop Evol. 2022, 69, 499–523. [Google Scholar] [CrossRef]
- Ermakova, M.F.; Chistyakova, A.K.; Shchukina, L.V.; Morozova, E.V.; Khlestkina, E.K.; Pshenichnikova, T.A. The diversity of Siberian bread wheat cultivars on grain quality in dependence of breeding period. EWAC Newsl. 2008, 14, 174–176. [Google Scholar]
- Mulugeta, B.; Tesfaye, K.; Ortiz, R.; Geleta, M.; Haileselassie, T.; Hammenhag, C.; Hailu, F.; Johansson, E. Unlocking the genetic potential of Ethiopian durum wheat landraces with high protein quality: Sources to be used in future breeding for pasta production. Food Energy Secur. 2024, 13, 511. [Google Scholar] [CrossRef]
- Khlestkina, E.K.; Pshenichnikova, T.A.; Usenko, N.I.; Otmakhova, Y.S. Promising opportunities of using molecular genetic approaches for managing wheat grain technological properties in the context of the “grain–flour–bread” chain. Russ. J. Genet. Appl. Res. 2017, 7, 459–476. [Google Scholar] [CrossRef]
- Kuluev, B.R.; Mikhailova, E.V.; Kuluev, A.R.; Galimova, A.A.; Zaikina, E.A.; Khlestkina, E.K. Genome Editing in Species of the Tribe Triticeae with the CRISPR/Cas System. Mol. Biol. 2022, 56, 949–968. [Google Scholar] [CrossRef]
- Li, L.; Xu, D.; Bian, Y.; Liu, B.; Zeng, J.; Xie, L.; Liu, S.; Tian, X.; Liu, J.; Xia, X.; et al. Fine mapping and characterization of a major QTL for plant height on chromosome 5A in wheat. Theor. Appl. Genet. 2023, 136, 167. [Google Scholar] [CrossRef]
- He, X.; Lillemo, M.; Shi, J.; Wu, J.; Bjørnstad, Å.; Belova, T.; Dreisigacker, S.; Duveiller, E.; Singh, P. QTL characterization of fusarium head blight resistance in CIMMYT bread wheat line soru#1. PLoS ONE 2016, 11, e0158052. [Google Scholar]
- Xu, Q.; Xu, F.; Qin, D.; Li, M.; Fedak, G.; Cao, W.; Yang, L.; Dong, J. Molecular mapping of QTLs conferring fusarium head blight resistance in Chinese wheat cultivar Jingzhou 66. Plants 2020, 9, 1021. [Google Scholar] [CrossRef]
- Jin, J.; Liu, D.; Qi, Y.; Ma, J.; Zhen, W. Major QTL for seven yield-related traits in common wheat (Triticum aestivum L.). Front. Genet. 2020, 11, 1012. [Google Scholar] [CrossRef]
- Ji, G.; Xu, Z.; Fan, X.; Zhou, Q.; Yu, Q.; Liu, X.; Liao, S.; Feng, B.; Wang, T. Identification of a major and stable QTL on chromo-some 5A confers spike length in wheat (Triticum aestivum L.). Mol. Breed. 2021, 41, 56. [Google Scholar] [CrossRef] [PubMed]
- Marza, F.; Bai, G.H.; Carver, B.F.; Zhou, W.C. Quantitative trait loci for yield and related traits in the wheat population Ning7840 x Clark. Theor. Appl. Genet. 2006, 112, 688–698. [Google Scholar] [CrossRef]
- Cui, F.; Li, J.; Ding, A.; Zhao, C.; Wang, L.; Wang, X.; Li, S.; Bao, Y.; Li, X.; Feng, D.; et al. Conditional QTL mapping for plant height with respect to the length of the spike and internode in two mapping populations of wheat. Theor. Appl. Genet. 2011, 122, 1517–1536. [Google Scholar] [CrossRef] [PubMed]
- Sourdille, P.; Tixier, M.H.; Charmet, G.; Gay, G.; Cadalen, T.; Bernard, S.; Bernard, M. Location of genes involved in ear compactness in wheat (Triticum aestivum) by means of molecular markers. Mol. Breed. 2006, 6, 247–255. [Google Scholar] [CrossRef]
- Campbell, K.G.; Bergman, C.J.; Gualberto, D.G.; Anderson, J.A.; Giroux, M.J.; Hareland, G.; Fulcher, R.G.; Sorrells, M.E.; Finney, P.L. Quantitative Trait Loci Associated with Kernel Traits in a Soft Hard Wheat Cross. Crop Sci. 1999, 39, 1184–1195. [Google Scholar] [CrossRef]
- Huang, X.Q.; Coster, H.; Ganal, M.W.; Roder, M.S. Advanced backcross QTL analysis for the identification of quantitative trait loci alleles from wild relatives of wheat (Triticum aestivum L.). Theor. Appl. Genet. 2003, 106, 1379–1389. [Google Scholar] [CrossRef]
- Ramya, P.; Chaubal, A.; Kulkarni, K.; Gupta, L.; Kadoo, N.; Dhaliwal, H.S.; Chhuneja, P.; Lagu, M.; Gupt, V. QTL mapping of 1000-kernel weight, kernel length, and kernel width in bread wheat (Triticum aestivum L.). J. Appl. Genet. 2010, 51, 421–429. [Google Scholar] [CrossRef]
- Li, S.; Jia, J.; Wei, X.Y.; Zhang, X.; Li, L.; Chen, H.; Fan, Y.; Sun, H.; Zhao, X.; Lei, T.; et al. A intervarietal genetic map and QTL analysis for yield traits in wheat. Mol. Breed. 2007, 20, 167–178. [Google Scholar] [CrossRef]
- Liu, G.; Jia, L.; Lu, L.; Qin, D.; Zhang, J.; Guan, P.; Ni, Z.; Yao, Y.; Sun, Q.; Peng, H. Mapping QTLs of yield-related traits using RIL population derived from common wheat and Tibetan semi-wild wheat. Theor. Appl. Genet. 2014, 127, 2415–2432. [Google Scholar] [CrossRef] [PubMed]
- Roder, M.S.; Huang, X.Q.; Borner, A. Fine mapping of the region on wheat chromosome 7D controlling grain weight. Funct. Integr. Genom. 2008, 8, 79–86. [Google Scholar] [CrossRef] [PubMed]
- Sun, X.-Y.; Wu, K.; Zhao, Y.; Kong, F.-M.; Han, G.-Z.; Jiang, H.-M.; Huang, X.-J.; Li, R.-J.; Wang, H.-G.; Li, S.-S. QTL analysis of kernel shape and weight using recom-binant inbred lines in wheat. Euphytica 2009, 165, 165–615. [Google Scholar] [CrossRef]
- Simmonds, J.; Scott, P.; Leverington-Waite, M.; Turner, A.S.; Brinton, J.; Korzun, V.; Snape, J.; Uauy, C. Identification and independent validation of a stable yield and thousand grain weight QTL on chromosome 6A of hexaploid wheat (Triticum aestivum L.). BMC Plant Biol. 2014, 14, 191. [Google Scholar] [CrossRef] [PubMed]
- Zanke, C.D.; Ling, J.; Plieske, J.; Kollers, S.; Ebmeyer, E.; Korzun, V.; Argillier, O.; Stiewe, G.; Hinze, M.; Neumann, F.; et al. Analysis of main effect QTL for thousand grain weight in European winter wheat (Triticum aestivum L.) by genome-wide association mapping. Front. Plant Sci. 2015, 6, 644. [Google Scholar] [CrossRef] [PubMed]
- Liu, T.; Wu, L.; Gan, X.; Chen, W.; Liu, B.; Fedak, G.; Zhang, B. Mapping quantitative trait loci for 1000-grain weight in a double haploid population of common wheat. Int. J. Mol. Sci. 2020, 21, 3960. [Google Scholar] [CrossRef] [PubMed]
- Asplund, L.; Bergkvist, G.; Leino, M.W.; Westerbergh, A.; Weih, M. Swedish spring wheat varieties with the rare high grain protein allele of NAM-B1 differ in leaf senescence and grain mineral content. PLoS ONE 2013, 8, e59704. [Google Scholar] [CrossRef] [PubMed]
- Khlestkina, E.K.; Giura, A.; Röder, M.S.; Börner, A. A new gene controlling the flowering response to photoperiod in wheat. Euphytica 2009, 165, 579–585. [Google Scholar] [CrossRef]
- Pshenichnikova, T.A.; Ermakova, M.F.; Chistyakova, A.K.; Shchukina, L.V.; Bere-zovskaya, E.V.; Lochwasser, U.; Roeder, M.; Berner, A. Mapping of quantitative trait loci (QTL) associated with quality indicators of soft wheat grain grown un-der various environmental conditions. Genetics 2008, 44, 74–84. [Google Scholar]
- Borrelli, G.M.; Troccoli, A.; Di Fonzo, N.; Fares, C. Durum wheat lipoxygenase activity and other quality parameters that affect pasta color. Cereal Chem. 1999, 76, 335–340. [Google Scholar] [CrossRef]
- Hessler, T.G.; Thomson, M.J.; Benscher, D.; Nachit, M.M.; Sorrells, M.E. Association of a lipoxygenase locus, Lpx-B1, with variation in lipoxygenase activity in durum wheat seeds. Crop Sci. 2002, 42, 1695–1700. [Google Scholar] [CrossRef]
- Zhang, F.; Chen, F.; Wu, P.; Zhang, N.; Cui, D. Molecular characterization of lipoxygenase genes on chromosome 4BS in Chinese bread wheat (Triticum aestivum L.). Theor. Appl. Genet. 2015, 128, 1467–1479. [Google Scholar] [CrossRef] [PubMed]
- Parker, G.D.; Chalmers, K.J.; Rathjen, A.J.; Langridge, P. Mapping loci associated with flour colour in wheat (Triticum aestivum L.). Theor. Appl. Genet. 1998, 97, 238–245. [Google Scholar] [CrossRef]
- Parker, G.D.; Langridge, P. Development of a STS marker linked to a major locus controlling flour colour in wheat (Triticum aestivum L.). Mol. Breed. 2000, 6, 169–174. [Google Scholar] [CrossRef]
- He, X.Y.; He, Z.H.; Ma, W.; Appels, R.; Xia, X.C. Allelic variants of phytoene synthase 1 (Psy1) genes in Chinese and CIMMYT wheat cultivars and development of functional markers for flour colour. Mol. Breed. 2009, 23, 553–563. [Google Scholar] [CrossRef]
- Carrera, A.; Echenique, V.; Zhang, W.; Helguera, M.; Manthey, F.; Schrager, A.; Picca, A.; Cervigni, G.; Dubcovsky, J. A deletion at the LpxB1 locus is associated with low lipoxygenase activity and improved pasta color in durum wheat (Triticum turgidum ssp. durum). J. Cereal Sci. 2007, 45, 67–77. [Google Scholar] [CrossRef]
- Dorofeev, V.F.; Filatenko, A.A.; Migushova, E.F.; Udachin, R.A.; Jacubziner, M.M. Cultural Flora of USSR. In Wheat; Kolos: Leningrad, Russia, 1979; pp. 1–348. [Google Scholar]
- Qiagen. BDP Handbook 2005. Available online: http://www.qiagen.com/handbooks (accessed on 8 April 2024).
- Soleimani, B.; Lehnert, H.; Keilwagen, J.; Plieske, J.; Ordon, F.; Naseri Rad, S.; Perovic, D. Comparison between core set selection methods using different Illumina marker platforms: A case study of assessment of diversity in wheat. Front. Plant Sci. 2020, 11, 1040. [Google Scholar] [CrossRef] [PubMed]
- Allen, A.M.; Winfield, M.O.; Burridge, A.J.; Downie, R.C.; Benbow, H.R.; Barker, G.L.; Wilkinson, P.A.; Coghill, J.; Waterfall, C.; Davassi, A.; et al. Characterisation of a wheat breeders’ array suitable for high throughput SNP genotyping of global accessions of hexaploid bread wheat (Triticum aestivum). Plant Biotechnol. J. 2016, 15, 390–401. [Google Scholar] [CrossRef]
- Pritchard, J.K.; Stephens, M.; Donnelly, P. Inference of population structure using multilocus genotype data. Genetics 2000, 155, 945–959. [Google Scholar] [CrossRef]
- Dospekhov, B.A. Methodology of Field Experience (with the Basics of Statistical Processing of Research Results), 6th ed.; Alliance Publishing: Moscow, Russia, 2011; 350p. [Google Scholar]
- Jackson, D.; Turner, R. Power analysis for random-effects meta-analysis. Res. Synth. Methods 2017, 8, 290–302. [Google Scholar] [CrossRef] [PubMed]
- Cinar, O.; Viechtbauer, W. The poolr Package for Combining Independent and Dependent p Values. J. Stat. Softw. 2022, 101, 1–42. [Google Scholar] [CrossRef]
- Nyholt, D.R. A simple correction for multiple testing for single-nucleotide poly-morphisms in linkage disequilibrium with each other. Am. J. Hum. Genet. 2004, 74, 765–769. [Google Scholar] [CrossRef] [PubMed]
- Vasilenko, I.I.; Komarov, V.I. Grain quality assessment: Reference book. M. Ag-Ropromizdat 1987, 208, 12–13. [Google Scholar]
- Bebyakin, V.M.; Buntina, M.V. Efficiency of grain assessment of spring soft wheat using the SDS test. Vestn. Agric. Sci. Sci. 1991, 1, 66–70. [Google Scholar]


| Characteristic | Mean for Each of the Three Years | Max | Min | ||||||
|---|---|---|---|---|---|---|---|---|---|
| 2021 | 2022 | 2023 | 2021 | 2022 | 2023 | 2021 | 2022 | 2023 | |
| Resistance to lodging (RL) | 8.0 ± 1.6 | 7 ± 2.3 | 7.9 ± 1.4 | 9 | 9 | 9 | 1 | 3 | 3 |
| Spike length (SL) | 8.4 ± 1.0 | 8.3 ± 1.2 | 7.1 ± 1.0 | 11.6 | 11.2 | 9.5 | 4.7 | 4.1 | 3.3 |
| Plant height (PH) | 92 ± 11 | 103 ± 14.7 | 86.1 ± 14.9 | 110 | 140 | 125 | 60 | 73 | 52.5 |
| Thousand grain weight (TGW) | 33.1 ± 5.6 | 45.9 ± 6.8 | 31.4 ± 7.2 | 46.6 | 61.7 | 49.4 | 20 | 23.1 | 14.7 |
| Number of spikelets per spike (SN) | 14.7 ± 1.5 | 15 ± 2.0 | 13.3 ± 2.1 | 19.2 | 22 | 20.2 | 11 | 9 | 8 |
| Characteristic | Marker | Chr | Position | p-Value |
|---|---|---|---|---|
| PH | RAC875_rep_c113313_607meta | 5A | 585240573 | 2.74 × 10⁻⁶ |
| wsnp_Ex_c31799_405454782022,meta | 5A | 585403218 | 5.3 × 10⁻⁷ | |
| wsnp_Ex_c31799_40545376meta | 5A | 585403320 | 1.08 × 10⁻⁶ | |
| Excalibur_c7729_144meta | 5A | 585412831 | 1.05 × 10⁻⁷ | |
| tplb0038h19_13942022,meta | 5A | 585431093 | 1.05 × 10⁻⁶ | |
| RAC875_c9984_1003meta | 5A | 585458474 | 8.87 × 10⁻⁷ | |
| wsnp_Ex_rep_c66689_650109882022,meta | 5A | 585609287 | 9.26 × 10⁻⁸ | |
| BS00022071_512022,meta | 5A | 586604587 | 9.46 × 10⁻⁸ | |
| TG0052meta | 5A | 587412057 | 1.08 × 10⁻⁶ | |
| TG0053meta | 5A | 587412186 | 1.25 × 10⁻⁶ | |
| TG00192022,meta | 5A | 587423597 | 9.74 × 10⁻⁷ | |
| TG00412022,meta | 5A | 588550278 | 5.97 × 10⁻⁸ | |
| wsnp_BF293620A_Ta_2_12022,meta | 5A | 588555309 | 1.04 × 10⁻⁷ | |
| TA001896-0654meta * | 5A | 588848205 | 3.49 × 10⁻⁶ | |
| AX-949207112023 * | 5A | 609276661 | 9.01 × 10⁻⁶ | |
| RL | wsnp_CAP11_rep_c4105_19409852021 * | 2B | 448080584 | 1.91 × 10⁻⁵ |
| tplb0050d17_14012021 * | 6A | 613770166 | 3.87 × 10⁻⁵ | |
| Tdurum_contig45618_10892023 * | 7A | 736690246 | 9.18 × 10⁻⁶ | |
| BS00024643_512023 * | 2A | 779207402 | 4.98 × 10⁻⁵ | |
| Excalibur_c16329_493meta * | 2D | 634296660 | 8.07 × 10⁻⁵ | |
| SL | RAC875_c48456_444meta | 6B | 470800981 | 1.21 × 10⁻⁶ |
| Excalibur_rep_c92855_977meta * | 6A | 410914096 | 3.8 × 10⁻⁶ | |
| TGW | Excalibur_c4325_1150meta * | 4A | 684616475 | 2.38 × 10⁻⁵ |
| SN | AX-94505099meta * | 7B | 648926257 | 6.31 × 10⁻⁶ |
| Structural Indicators | Indicators | ||||
|---|---|---|---|---|---|
| Protein Content, % | Ash Content, % | Flour Color, % | Test Weight, g/L | Sedimentation Value, mL | |
| Limits of variation | 11.5–20.7 | 1.53–2.80 | 74.8–84.1 | 622–832 | 16–82 |
| Experiment mean value | 14.79 | 1.99 | 81.27 | 760.27 | 61.49 |
| F-criterion (intercultivar) | 3.51 * | 3.19 * | 1.76 * | 2.75 * | 3.62 * |
| HCP | 2.22 | 0.27 | 3.83 | 45.28 | 13.44 |
| Indicator | Marker | Chr | Position | p-Value |
|---|---|---|---|---|
| Test weight | Excalibur_c82557_201 * | 1A | 9123021 | 7.20 × 10⁻⁵ |
| BS00009789_51 * | 5A | 451478823 | 2.85 × 10⁻⁵ | |
| BobWhite_c8202_245 * | 5A | 445191670 | 9.29 × 10⁻⁵ | |
| IAAV8870 * | 5B | 473114741 | 1.64 × 10⁻⁵ | |
| AX-94541836 * | 5B | 572140495 | 6.59 × 10⁻⁵ | |
| BobWhite_rep_c48956_706 * | 6A | 149925808 | 8.25 × 10⁻⁵ | |
| IAAV8065 * | 6B | 411097830 | 8.22 × 10⁻⁵ | |
| RAC875_c17185_90 * | 7A | 20164436 | 6.49 × 10⁻⁵ | |
| Kukri_c49828_316 * | 7B | 702501105 | 6.77 × 10⁻⁵ | |
| Grain protein content | IAAV5730 | 1A | 344480854 | 5.00 × 10⁻⁶ |
| TA004690-1102 | 1D | 435801686 | 3.33 × 10⁻⁶ | |
| AX-94602991 | 2A | 776022491 | 3.28 × 10⁻⁶ | |
| IACX8602 | 2A | 776040004 | 3.33 × 10⁻⁶ | |
| JD_c63957_1176 * | 2D | 20769330 | 2.20 × 10⁻⁵ | |
| Ash content | AX-94726440 * | 3A | 197860384 | 6.66 × 10⁻⁶ |
| BS00065543_51 * | 5B | 17575036 | 7.19 × 10⁻⁶ | |
| AX-94519170 * | 6D | 464735570 | 4.00 × 10⁻⁶ | |
| RAC875_c17185_90 * | 7A | 20164436 | 1.25 × 10⁻⁵ | |
| Flour color | Kukri_c57491_156 * | 2B | 440825097 | 4.34 × 10⁻⁶ |
| wsnp_Ex_c19647_28632894 | 5A | 470033197 | 1.87 × 10⁻⁶ | |
| wsnp_JD_c6160_7327405 | 5A | 472344585 | 1.87 × 10⁻⁶ | |
| RFL_Contig2187_1025 | 5A | 472346644 | 1.87 × 10⁻⁶ | |
| IACX12578 | 5A | 467379740 | 2.71 × 10⁻⁶ | |
| BobWhite_c46338_76 | 5A | 468462719 | 2.71 × 10⁻⁶ | |
| Kukri_c17430_972 | 5A | 468467336 | 2.71 × 10⁻⁶ | |
| AX-94436930 * | 5A | 473312305 | 5.69 × 10⁻⁶ | |
| RAC875_c79944_269 * | 5A | 468463193 | 7.50 × 10⁻⁶ | |
| Flour sedimentation | Kukri_c9898_1766 | 0 | 0 | 2.91 × 10⁻⁸ |
| AX-94881376 | 1A | 30136011 | 3.78 × 10⁻⁸ | |
| wsnp_BF474340A_Ta_2_1 | 1A | 556942097 | 4.63 × 10⁻⁸ | |
| IAAV5776 | 1B | 675560975 | 3.13 × 10⁻⁶ | |
| AX-94414376 * | 1B | 552777509 | 6.20 × 10⁻⁶ | |
| AX-95213897 * | 2A | 510805288 | 9.11 × 10⁻⁶ | |
| Kukri_c63797_354 | 3B | 761853919 | 1.89 × 10⁻⁸ | |
| AX-94467468 * | 4A | 599326520 | 9.08 × 10⁻⁶ | |
| Tdurum_contig8028_870 * | 4B | 586069506 | 5.78 × 10⁻⁶ | |
| wsnp_Ku_c23772_33711538 | 5A | 476603824 | 4.11 × 10⁻⁸ | |
| RAC875_rep_c109969_119 | 5A | 593332300 | 3.40 × 10⁻⁷ | |
| RAC875_c2105_740 | 5B | 555011247 | 3.68 × 10⁻⁸ | |
| Kukri_c13224_551 | 5B | 87230041 | 3.95 × 10⁻⁸ | |
| AX-94878420 | 5B | 449201643 | 4.28 × 10⁻⁸ |
| Accession Status | Number of Wheat Accessions | |
|---|---|---|
| From Russia | From Germany | |
| Landraces | 19 | 10 |
| Cultivars released before 1950 | 19 | 51 |
| Cultivars released in 1951–1991 | 42 | 30 |
| Modern improved cultivars | 14 | 1 |
| Total | 94 | 92 |
Disclaimer/Publisher’s Note: The statements, opinions and data contained in all publications are solely those of the individual author(s) and contributor(s) and not of MDPI and/or the editor(s). MDPI and/or the editor(s) disclaim responsibility for any injury to people or property resulting from any ideas, methods, instructions or products referred to in the content. |
© 2024 by the authors. Licensee MDPI, Basel, Switzerland. This article is an open access article distributed under the terms and conditions of the Creative Commons Attribution (CC BY) license (https://creativecommons.org/licenses/by/4.0/).
Share and Cite
Shvachko, N.; Solovyeva, M.; Rozanova, I.; Kibkalo, I.; Kolesova, M.; Brykova, A.; Andreeva, A.; Zuev, E.; Börner, A.; Khlestkina, E. Mining of QTLs for Spring Bread Wheat Spike Productivity by Comparing Spring Wheat Cultivars Released in Different Decades of the Last Century. Plants 2024, 13, 1081. https://doi.org/10.3390/plants13081081
Shvachko N, Solovyeva M, Rozanova I, Kibkalo I, Kolesova M, Brykova A, Andreeva A, Zuev E, Börner A, Khlestkina E. Mining of QTLs for Spring Bread Wheat Spike Productivity by Comparing Spring Wheat Cultivars Released in Different Decades of the Last Century. Plants. 2024; 13(8):1081. https://doi.org/10.3390/plants13081081
Chicago/Turabian StyleShvachko, Natalia, Maria Solovyeva, Irina Rozanova, Ilya Kibkalo, Maria Kolesova, Alla Brykova, Anna Andreeva, Evgeny Zuev, Andreas Börner, and Elena Khlestkina. 2024. "Mining of QTLs for Spring Bread Wheat Spike Productivity by Comparing Spring Wheat Cultivars Released in Different Decades of the Last Century" Plants 13, no. 8: 1081. https://doi.org/10.3390/plants13081081
APA StyleShvachko, N., Solovyeva, M., Rozanova, I., Kibkalo, I., Kolesova, M., Brykova, A., Andreeva, A., Zuev, E., Börner, A., & Khlestkina, E. (2024). Mining of QTLs for Spring Bread Wheat Spike Productivity by Comparing Spring Wheat Cultivars Released in Different Decades of the Last Century. Plants, 13(8), 1081. https://doi.org/10.3390/plants13081081