
Modeling the Potential Distribution Patterns of the Invasive Plant Species Phytolacca americana in China in Response to Climate Change

Abstract
:1. Introduction
2. Materials and Methods
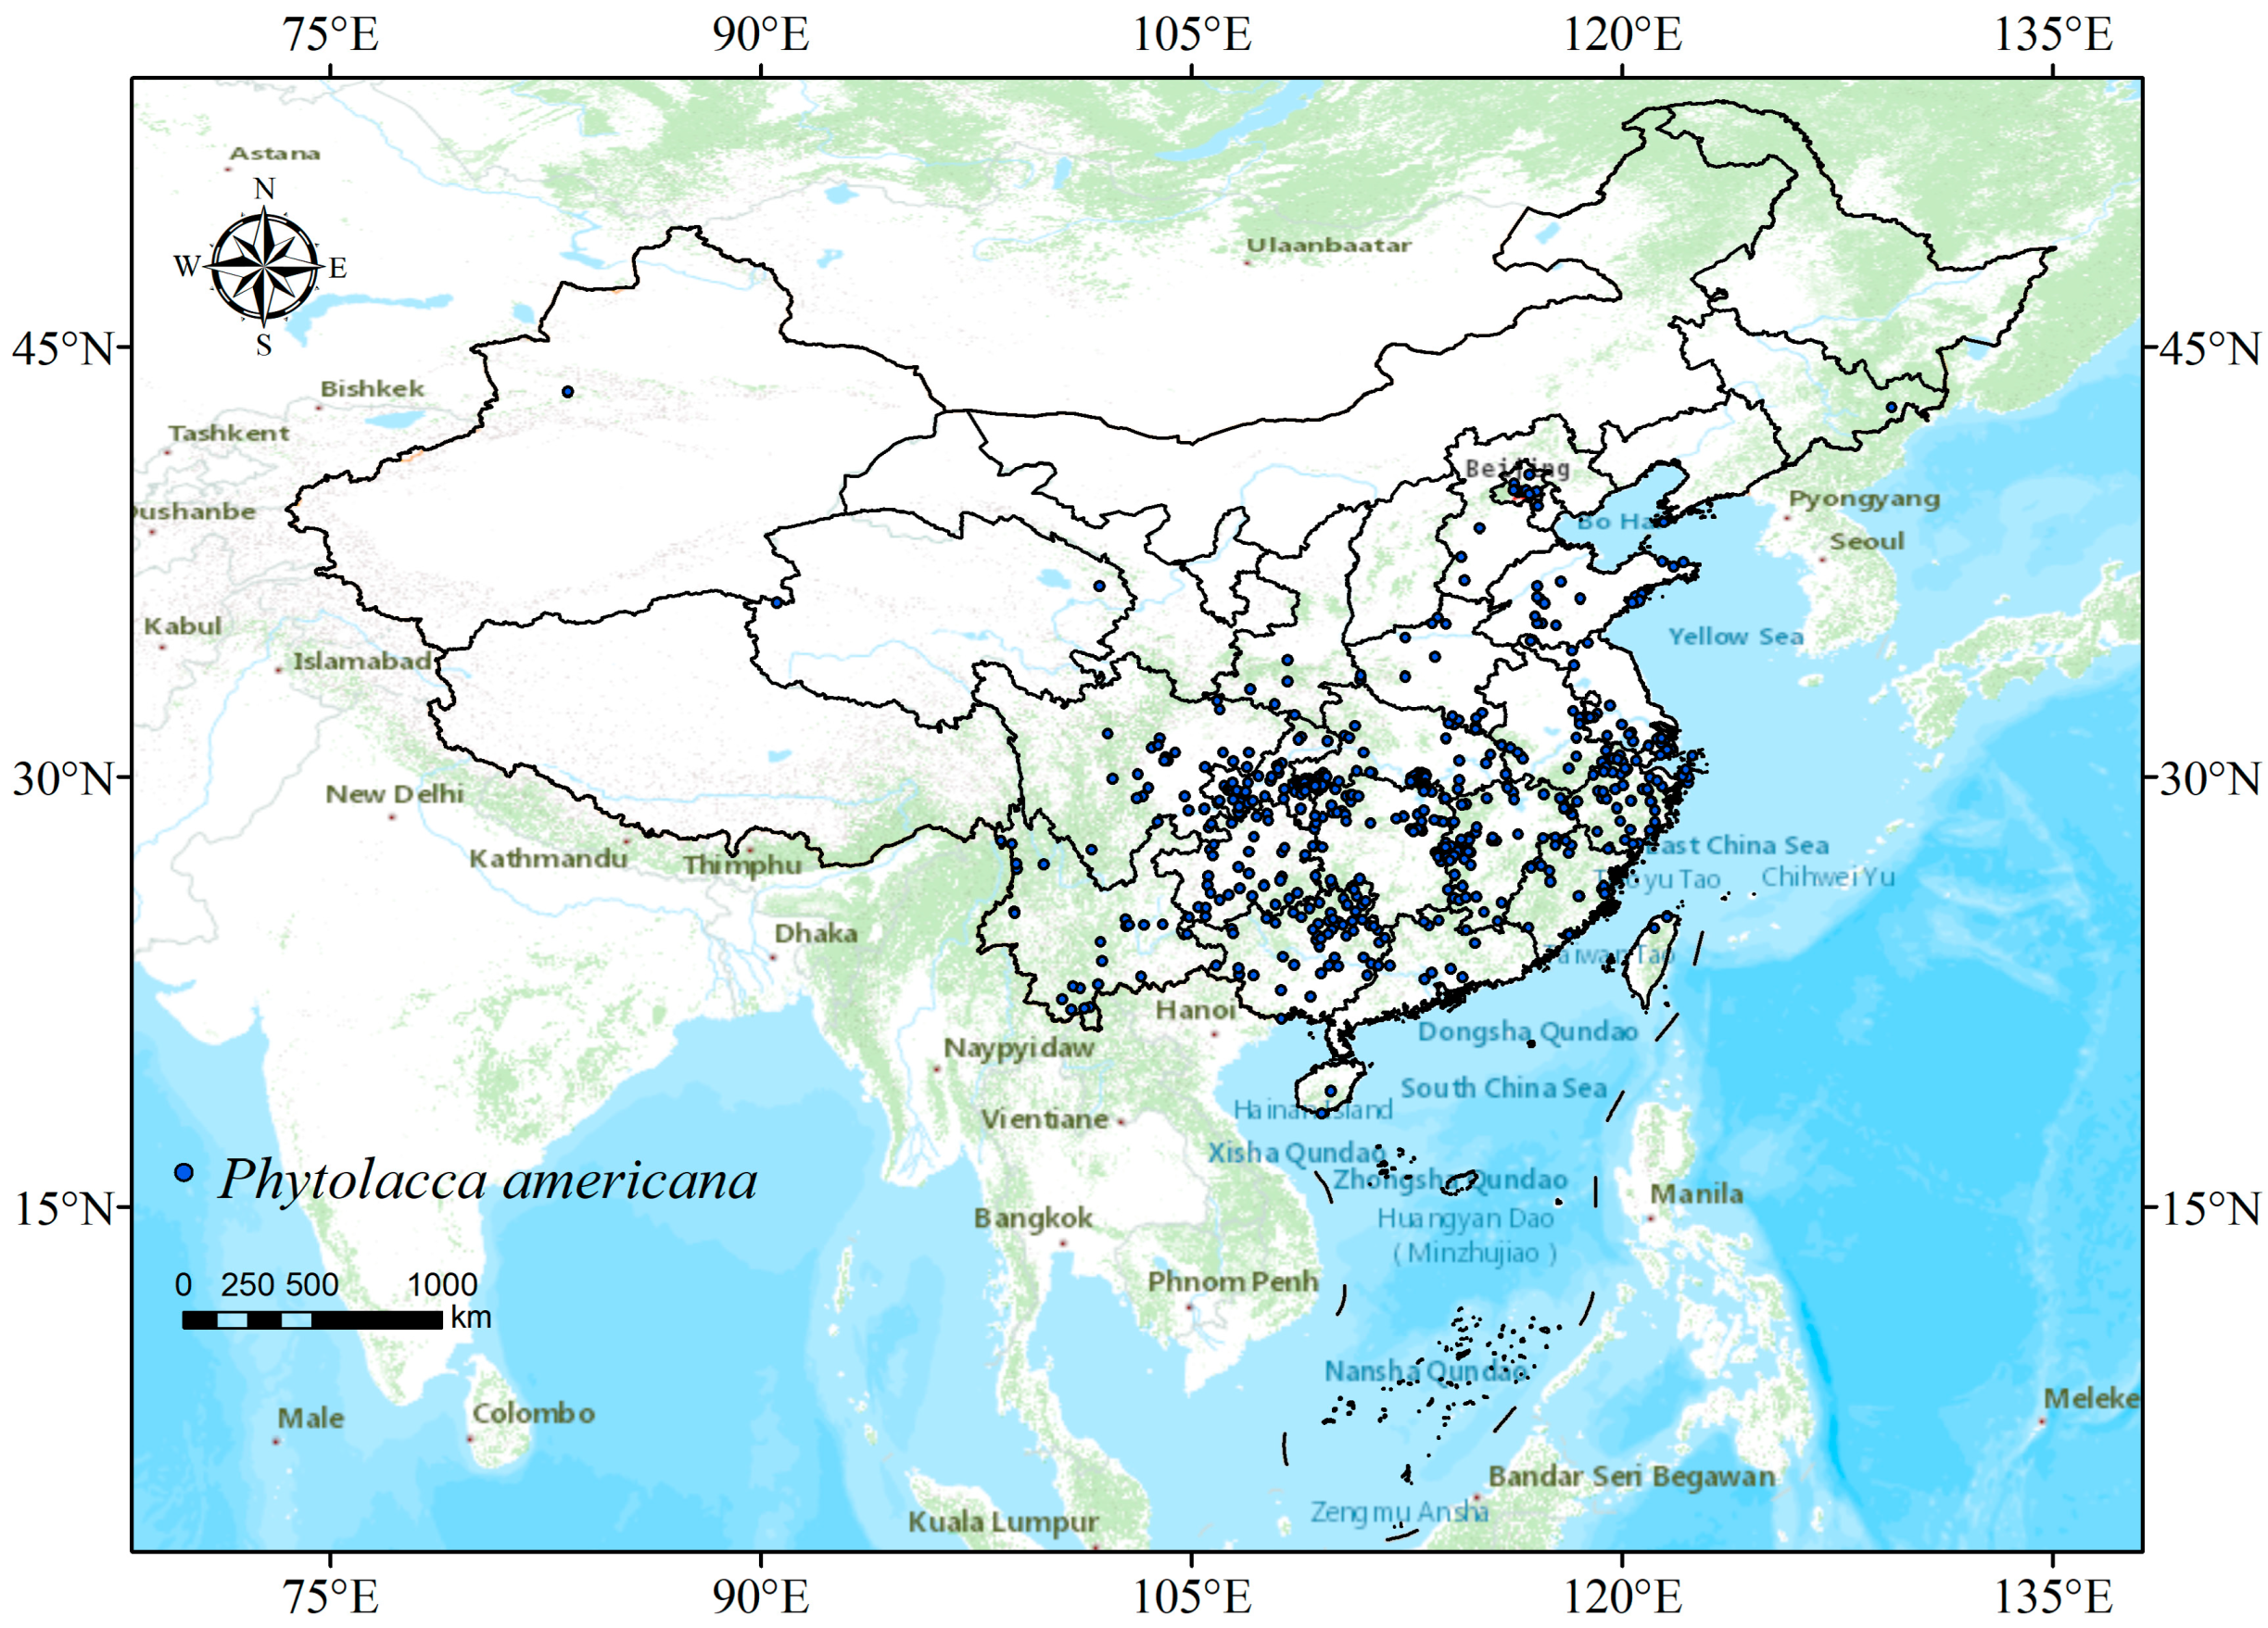
2.1. Collection and Screening of Species Occurrence Data
2.2. Data Acquisition and Variables
2.3. Variable Selection
2.4. Parameter Selection and Model Accuracy Evaluation
2.5. Classification of Suitable Areas
3. Results
3.1. Analysis of the Contribution of Environmental Variables
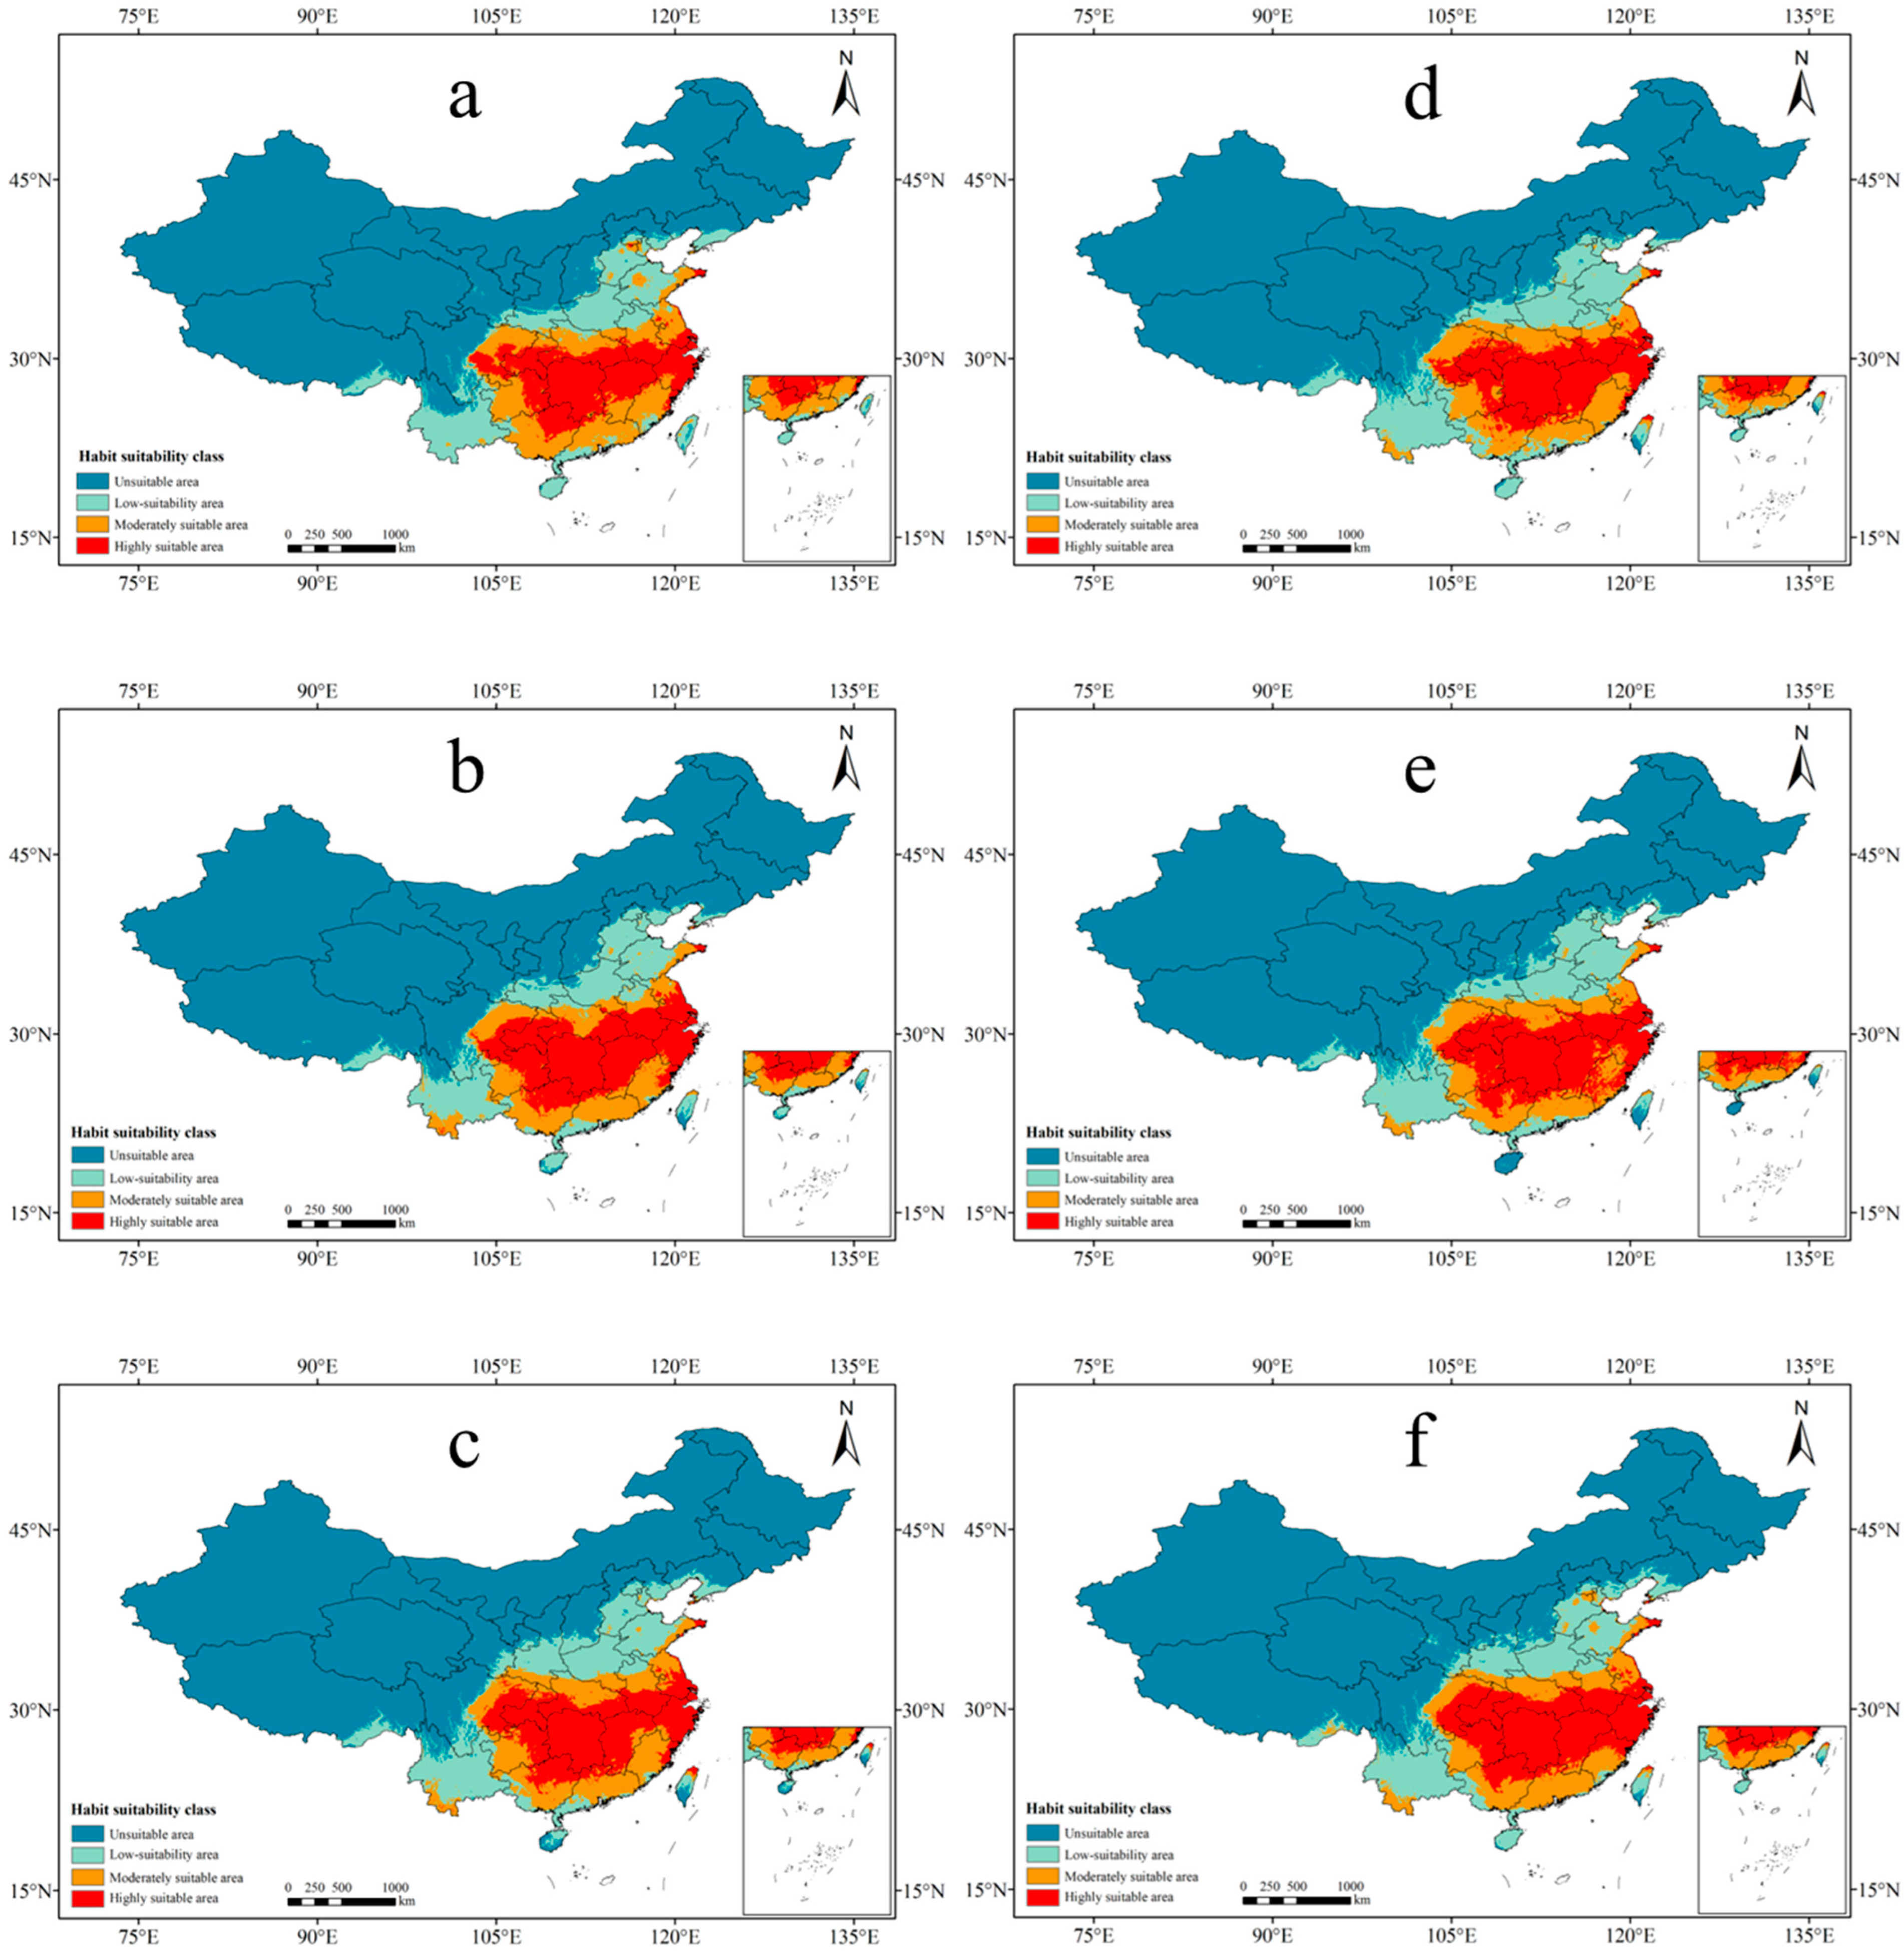
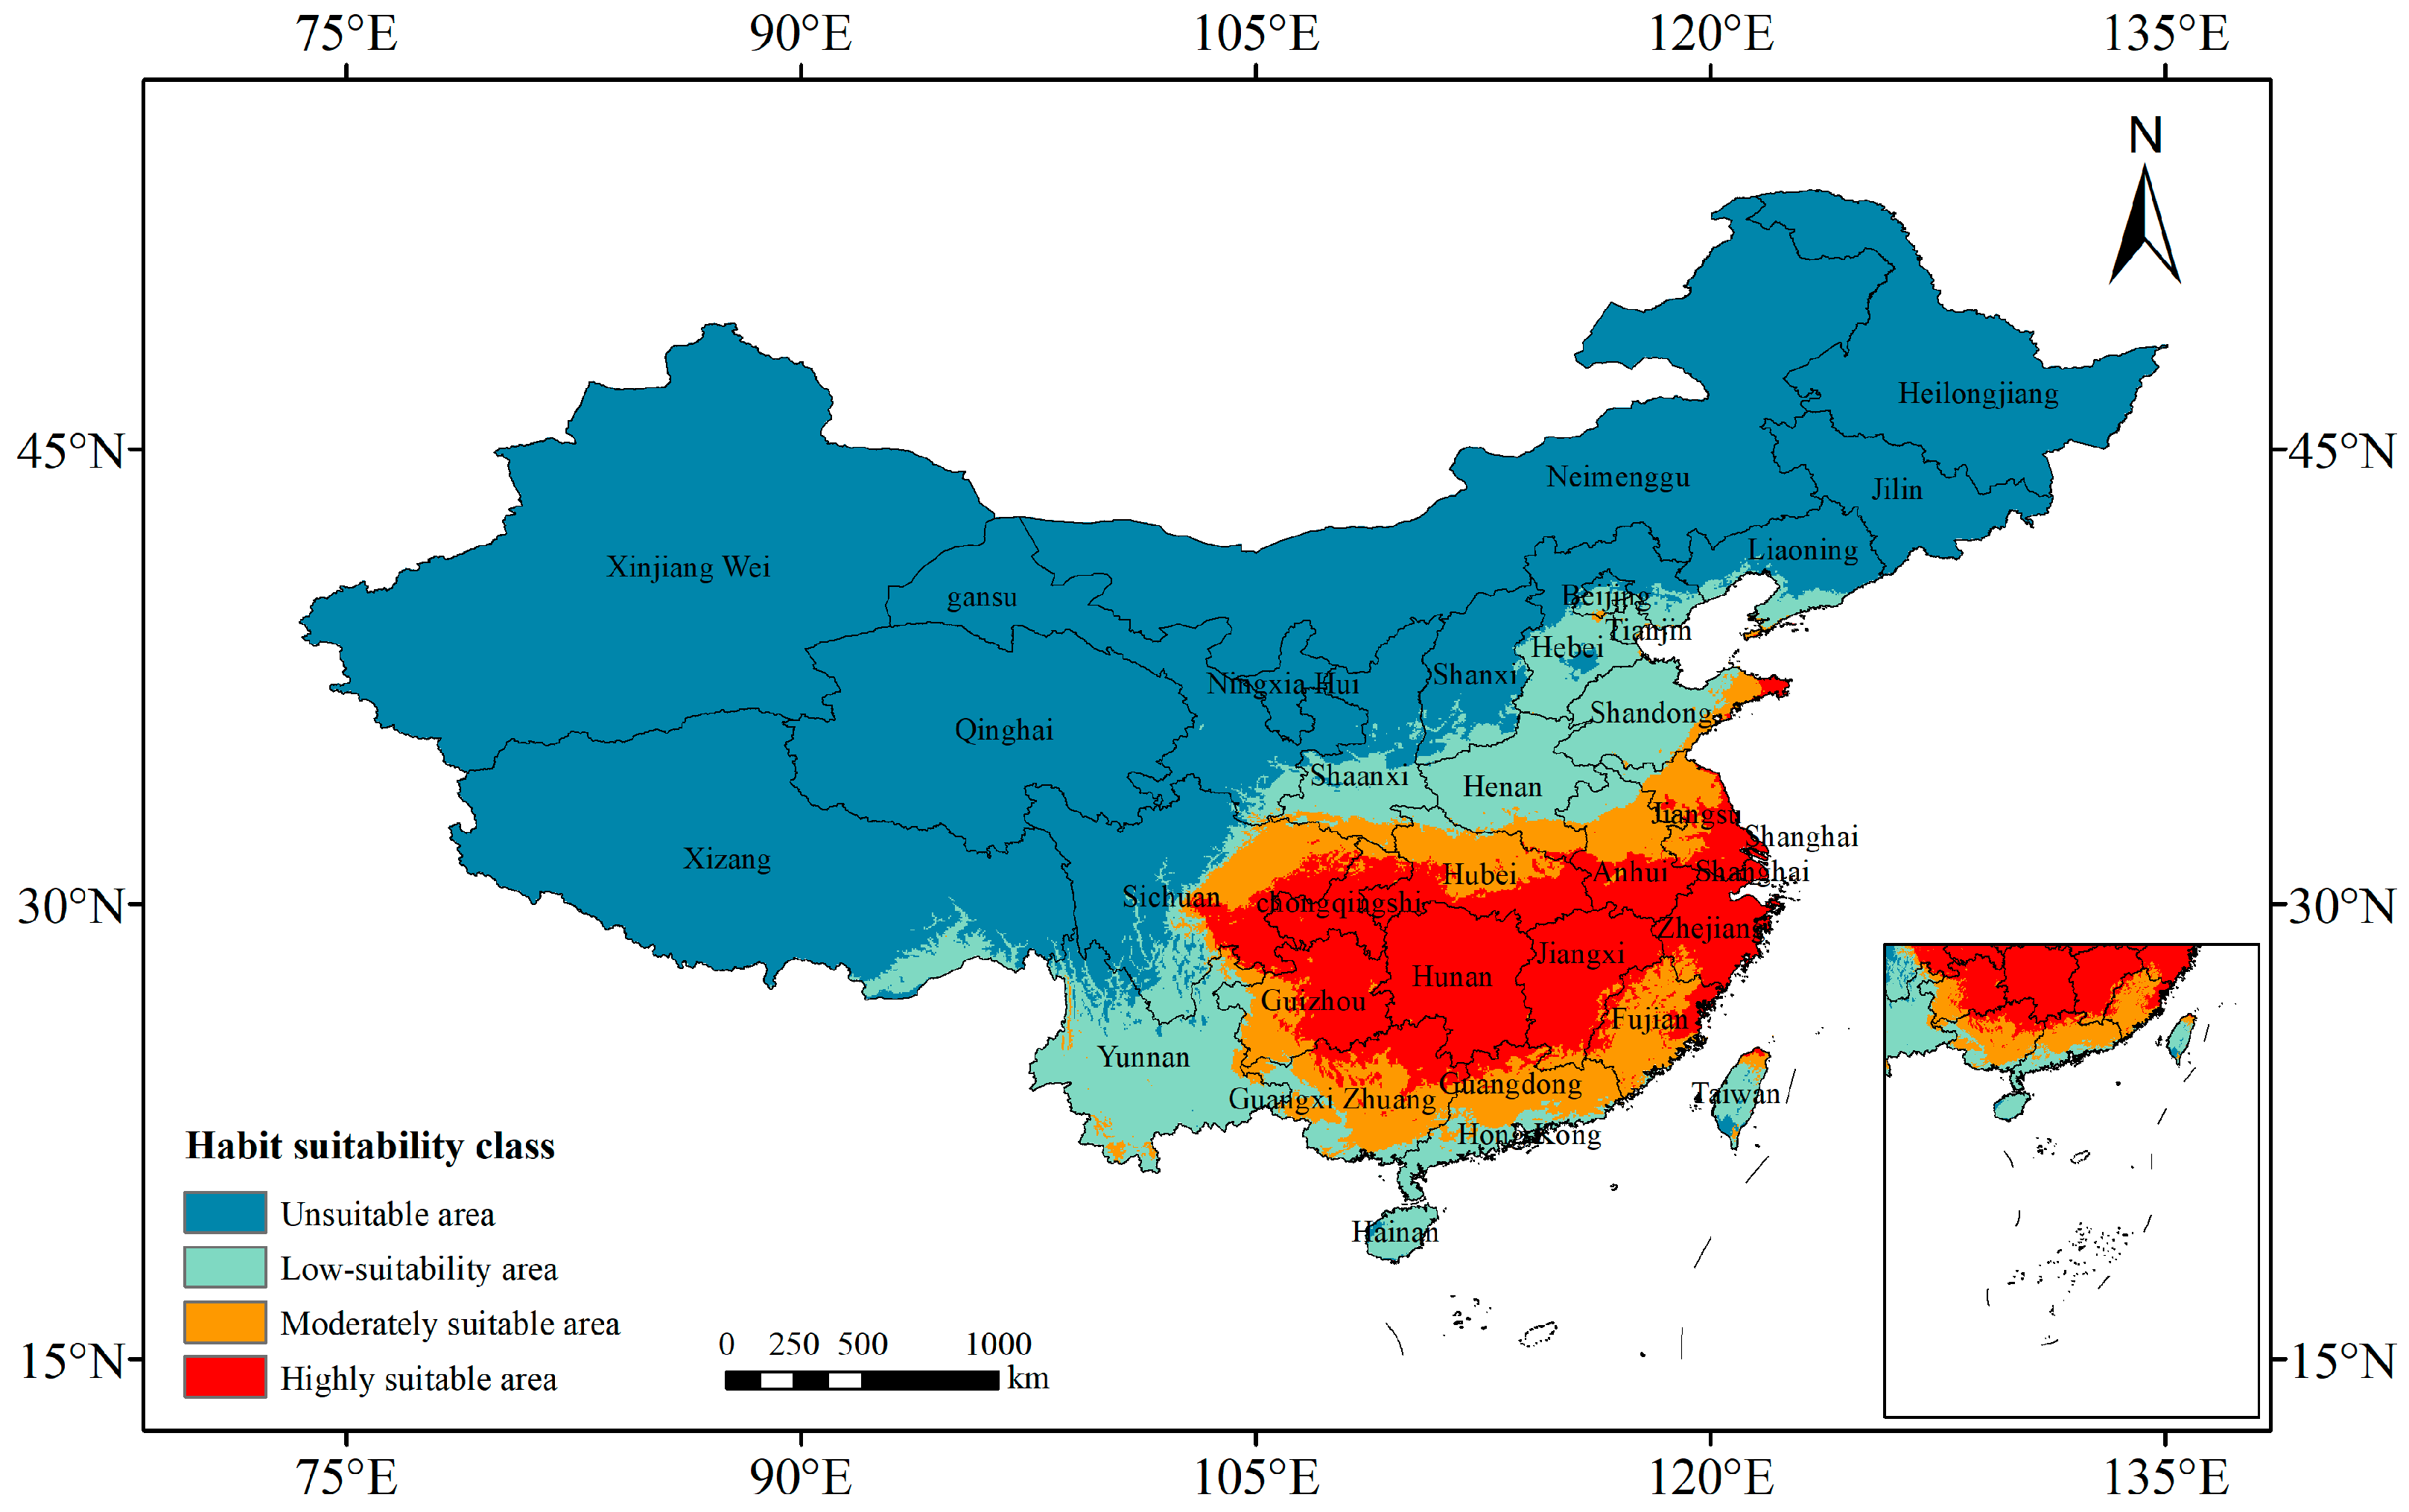
3.2. Current Potentially Suitable Areas of P. americana in China
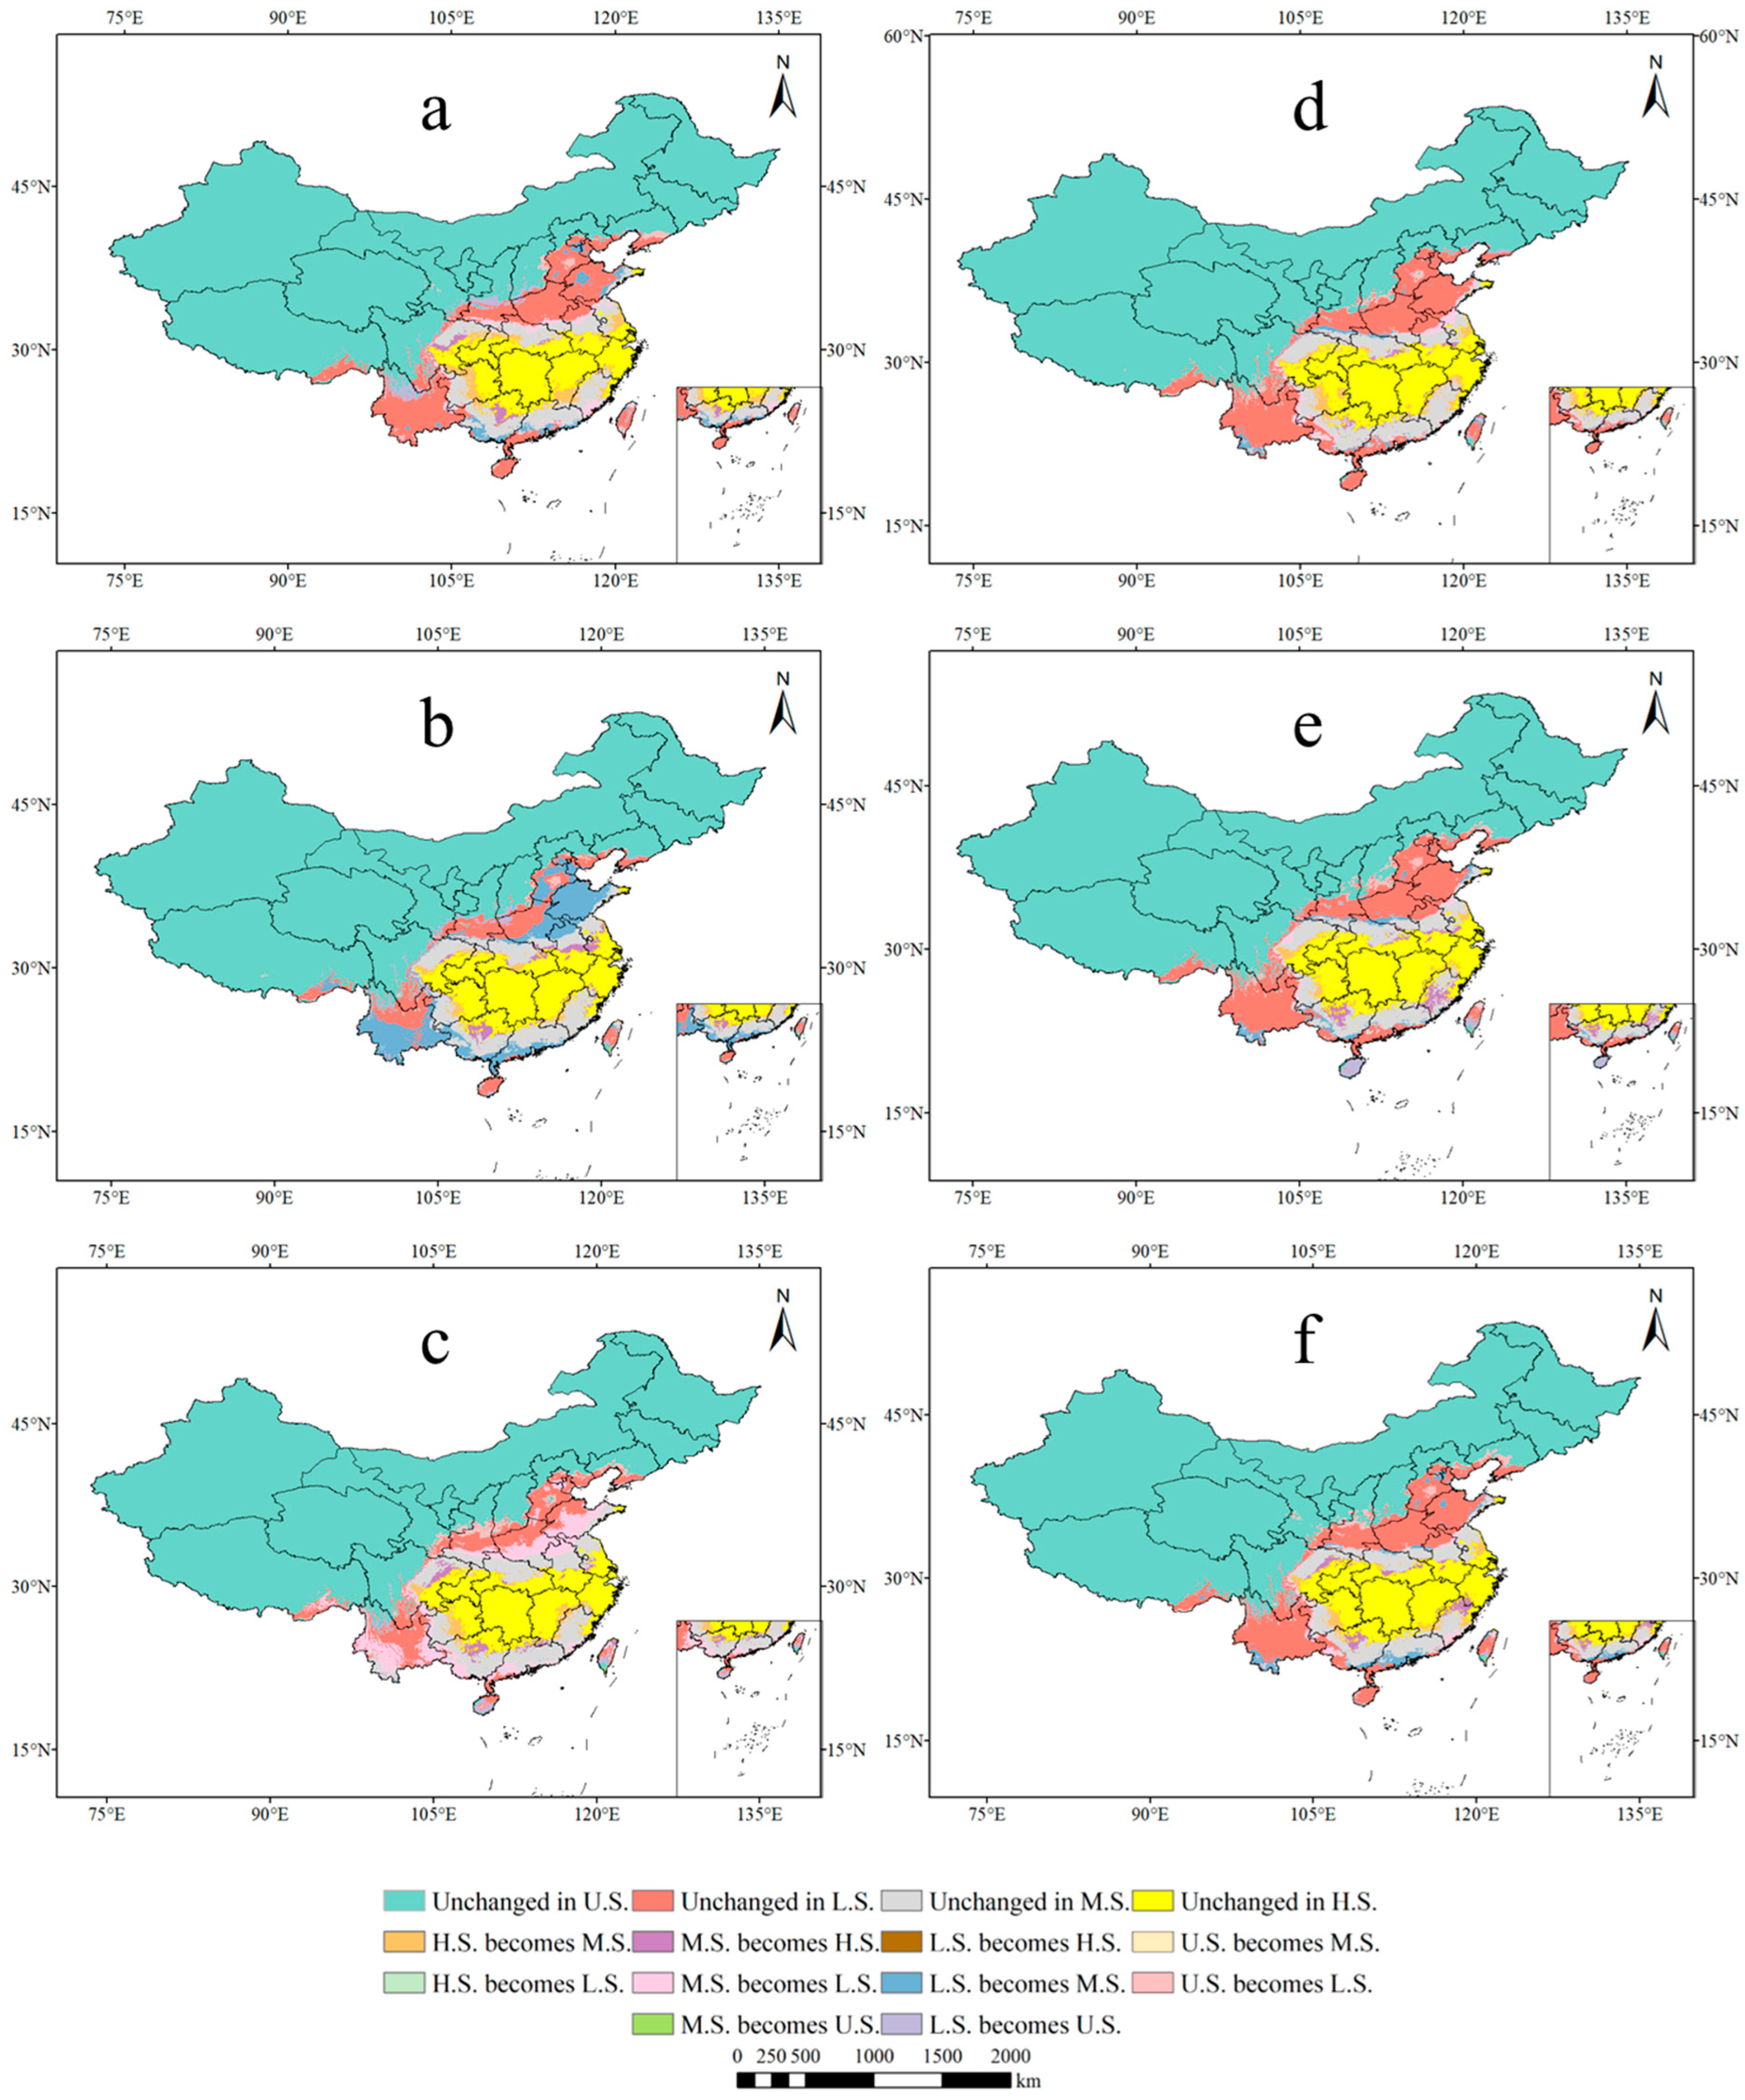
3.3. Future Suitable Areas of P. americana under Different Climate Scenarios
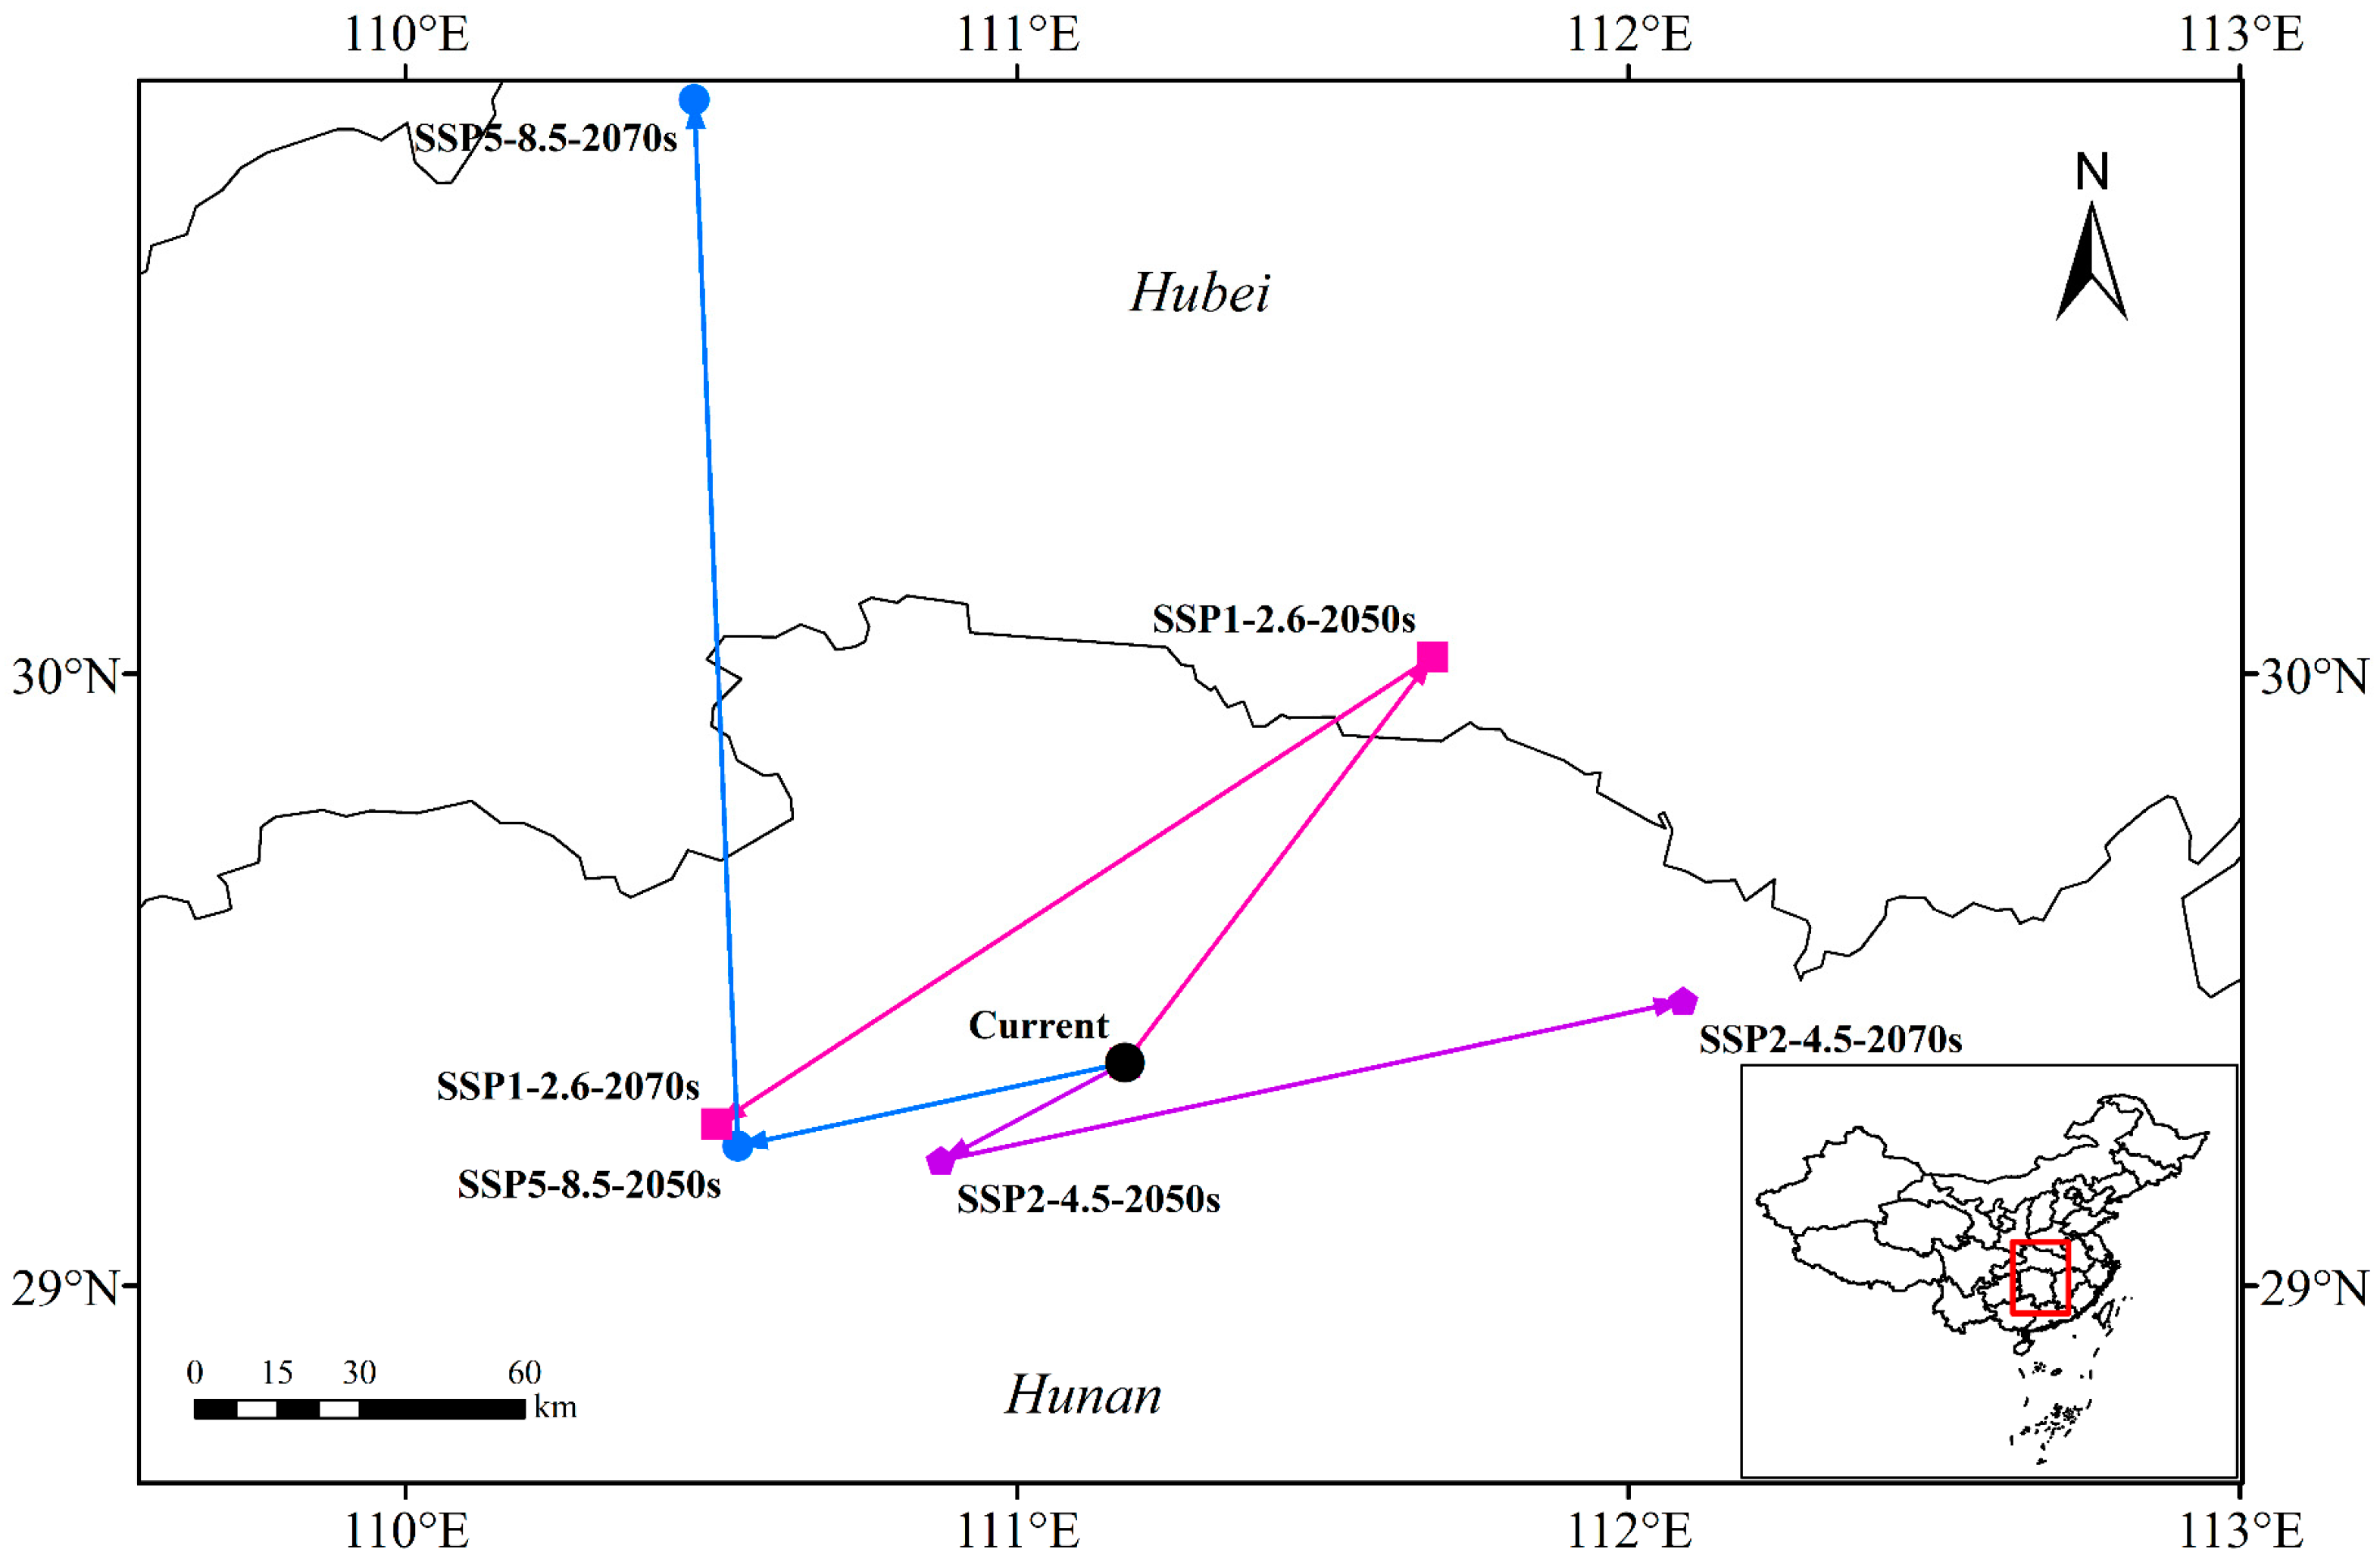
3.4. Centroid Distributional Shifts under Future Climate Conditions
4. Discussion
4.1. Main Environmental Variables Affecting the Occurrence of P. americana
4.2. Future Changes in P. americana Distribution
4.3. Prevention and Control Strategies
4.4. Limitations of the Study
5. Conclusions
Supplementary Materials
Author Contributions
Funding
Data Availability Statement
Conflicts of Interest
References
- Ostad-Ali-Askar, K.; Su, R.; Liu, L. Water resources and climate change. J. Water Clim. Chang. 2018, 9, 239. [Google Scholar] [CrossRef]
- Huang, R.; Yu, T.; Zhao, H.; Zhang, S.; Jing, Y.; Li, Y. Prediction of suitable distribution area of the endangered plant Acer catalpifolium under the background of climate change in China. J. Beijing For. Univ. 2021, 43, 33. [Google Scholar] [CrossRef]
- Gao, H.; Qian, Q.; Deng, X.; Peng, Y.; Xu, D. Predicting the Distributions of Morus notabilis C. K. Schneid under Climate Change in China. Forests 2024, 15, 352. [Google Scholar] [CrossRef]
- Thakur, S.; Rai, I.D.; Singh, B.; Dutt, H.C.; Musarella, C.M. Predicting the suitable habitats of Elwendia persica (Boiss.) in the Indian Himalayan Region (IHR). Plant Biosyst. 2023, 157, 769–778. [Google Scholar] [CrossRef]
- Ali, H.; Jaffar, U.D.; Luciano, B.; Shoaib, H.; Muhammad, K.; Muhammad, Y.; Muhammad, A.N. Expanding or shrinking? range shifts in wild ungulates under climate change in Pamir-Karakoram mountains, Pakistan. PLoS ONE 2022, 16, e0260031. [Google Scholar] [CrossRef] [PubMed]
- Wei, B.; Wang, R.; Hou, K.; Wang, X.; Wu, W. Predicting the current and future cultivation regions of Carthamus tinctorius L. using MaxEnt model under climate change in China. Glob. Ecol. Conserv. 2018, 16, e00477. [Google Scholar] [CrossRef]
- Ye, X.; Zhao, G.; Zhang, M.; Cui, X.; Fan, H.; Liu, B. Distribution Pattern of Endangered Plant Semiliquidambar cathayensis (Hamamelidaceae) in Response to Climate Change after the Last Interglacial Period. Forests 2020, 11, 434. [Google Scholar] [CrossRef]
- Araújo, M.B.; Antoine, G. Five (or so) challenges for species distribution modelling. J. Biogeogr. 2006, 33, 1677–1688. [Google Scholar] [CrossRef]
- Brown, J.L.; Bennett, J.R.; French, C.M. SDMtoolbox 2.0: The next generation Python-based GIS toolkit for landscape genetic, biogeographic and species distribution model analyses. PeerJ 2017, 5, e4095. [Google Scholar] [CrossRef]
- Sun, S.; Zhang, Y.; Huang, D.; Wang, H.; Cao, Q.; Fan, P.; Yang, N.; Zheng, P.; Wang, R. The effect of climate change on the richness distribution pattern of oaks (Quercus L.) in China. Sci. Total Environ. 2020, 744, 140786. [Google Scholar] [CrossRef]
- Ab Lah, N.Z.; Yusop, Z.; Hashim, M.; Mohd Salim, J.; Numata, S. Predicting the Habitat Suitability of Melaleuca cajuputi Based on the MaxEnt Species Distribution Model. Forests 2021, 12, 1449. [Google Scholar] [CrossRef]
- Ancillotto, L.; Mori, E.; Bosso, L.; Agnelli, L.; Russo, D. The Balkan long-eared bat (Plecotus kolombatovici) occurs in Italy—First confirmed record and potential distribution. Mamm. Biol. 2019, 96, 61–67. [Google Scholar] [CrossRef]
- Conolly, J.; Manning, K.; Colledge, S.; Dobney, K.; Shennan, S. Species distribution modelling of ancient cattle from early Neolithic sites in SW Asia and Europe. Holocene 2012, 22, 997–1010. [Google Scholar] [CrossRef]
- Phillips, S.J.; Robert, P.A.; Robert, E.S. Maximum entropy modeling of species geographic distributions. Ecol. Model. 2006, 190, 231–259. [Google Scholar] [CrossRef]
- Ye, X.; Zhang, M.; Lai, W.; Yang, M.; Fan, H.; Zhang, G.; Chen, S.; Liu, B. Prediction of potential suitable distribution of Phoebe bournei based on MaxEnt optimization model. Acta Ecol. Sin. 2021, 41, 8135–8144. [Google Scholar] [CrossRef]
- Hu, W.; Wang, Y.; Dong, P.; Zhang, D.; Yu, W.; Ma, Z.; Chen, G.; Liu, Z.; Du, J.; Chen, B.; et al. Predicting potential mangrove distributions at the global northern distribution margin using an ecological niche model: Determining conservation and reforestation involvement. For. Ecol. Manag. 2020, 478, 118517. [Google Scholar] [CrossRef]
- Moreno, R.; Ricardo, Z.; Molina, J.R.; Vasquez, A.; Herrera, M. Predictive modeling of microhabitats for endemic birds in South Chilean temperate forests using Maximum entropy (Maxent). Ecol. Inform. 2011, 6, 364–370. [Google Scholar] [CrossRef]
- Hamit, S.; Abdushalih, N.; Xu, Z.; Jiesisi, A.; Shao, H.; Yilihar, V. Simulation of potential distribution patterns of the invasive plant species Xanthium spinosum L. (Bathurst burr) in Xinjiang under climate change. Acta Ecol. Sin. 2019, 39, 1551–1559. [Google Scholar] [CrossRef]
- Lemke, D.; Hulme, P.E.; Brown, J.A.; Tadesse, W. Distribution modelling of Japanese honeysuckle (Lonicera japonica) invasion in the Cumberland Plateau and Mountain Region, USA. For. Ecol. Manag. 2011, 262, 139–149. [Google Scholar] [CrossRef]
- Qian, Z.; Mi, Z.; Lu, C.; Zhang, X.; Chen, L.; Wang, S.; Niu, J.; Wang, Z. Predicting potential distribution of Ziziphus spinosa (Bunge) H.H. Hu ex F.H. Chen in China under climate change scenarios. Ecol. Evol. 2022, 12, e8629. [Google Scholar] [CrossRef]
- Chi, Y.; Wang, G.; Zhu, M.; Jin, P.; Hu, Y.; Shu, P.; Wang, Z.; Fan, A.; Qian, P.; Han, Y.; et al. Potentially suitable habitat prediction of Pinus massoniana Lamb. in China under climate change using Maxent model. Front. For. Glob. Chang. 2023, 6, 1144401. [Google Scholar] [CrossRef]
- Shi, X.; Wang, J.; Zhang, L.; Chen, S.; Zhao, A.; Ning, X.; Fan, G.; Wu, N.; Zhang, L.; Wang, Z. Prediction of the potentially suitable areas of Litsea cubeba in China based on future climate change using the optimized MaxEnt model. Ecol. Indic. 2023, 148, 110093. [Google Scholar] [CrossRef]
- Zhou, B.; Yan, X.; Xiao, Y.; Zhang, Z.; Li, X.; Yang, J. Traits of reproductive biology associated with invasiveness in alien invasive plant Phytolacca americana. Ecol. Environ. Sci. 2013, 22, 567–574. [Google Scholar]
- Follak, S.; Schwarz, M.; Essl, F. Notes on the occurrence of Phytolacca americana L. in crop fields and its potential agricultural impact. BioInvasions Rec. 2022, 11, 620–630. [Google Scholar] [CrossRef]
- Woolum, J.A.; Akpunonu, P.; Johnson, M.; Webb, A.N. Human exposures to Phytolacca americana in Kentucky: Characterization of toxicities, treatments, and outcomes. Clin. Toxicol. 2022, 220, 106962. [Google Scholar] [CrossRef]
- Ministry of Ecology and Environment of the People’s Republic of China, Ministry of Environmental Protection. Announcement on the Publication of the List of Alien Invasive Species in Natural Ecosystems of China (Fourth Batch). 2016. Available online: https://www.mee.gov.cn/gkml/hbb/bgg/201612/W020161226561612030090.pdf (accessed on 1 May 2023).
- Strgulc Krajšek, S.; Kladnik, A.; Skočir, S.; Bačič, M. Seed Germination of Invasive Phytolacca americana and Potentially Invasive P. acinosa. Plants 2023, 12, 1052. [Google Scholar] [CrossRef] [PubMed]
- Xu, Y.; Ye, X.; Yang, Q.; Weng, H.; Liu, Y.; Ahmad, S.; Zhang, G.; Huang, Q.; Zhang, T.; Liu, B. Ecological niche shifts affect the potential invasive risk of Phytolacca americana (Phytolaccaceae) in China. Ecol. Process. 2023, 12, 1. [Google Scholar] [CrossRef]
- Marinas, I.; Baicea, C.; Oprea, E.; Geana, I.; Gird, C.E.; Chifiriuc, M. Chemical composition, antimicrobial and antioxidant activity of Phytolacca americana L. fruits and leaves extracts. Farmacia 2021, 69, 883–889. [Google Scholar] [CrossRef]
- Riahi, K.; Vuuren, D.V.; Kriegler, E.; Edmonds, J.; O’Neill, B.C.; Fujimori, S.; Bauer, N.; Calvin, K.V.; Dellink, R.; Fricko, O.; et al. The Shared Socioeconomic Pathways and their energy, land use, and greenhouse gas emissions implications: An overview. Glob. Environ. Chang. 2017, 42, 153–168. [Google Scholar] [CrossRef]
- Zeng, Y.; Low, B.W.; Yeo, D.C. Novel methods to select environmental variables in MaxEnt: A case study using invasive crayfish. Ecol. Model. 2016, 341, 5–13. [Google Scholar] [CrossRef]
- Václavík, T.; Meentemeyer, R.K. Equilibrium or not? Modelling potential distribution of invasive species in different stages of invasion. Divers. Distrib. 2012, 18, 73–83. [Google Scholar] [CrossRef]
- Warren, B.H.; Bakker, F.T.; Bellstedt, D.U.; Bytebier, B.; Claßen-Bockhoff, R.; Dreyer, L.L.; Edwards, D.; Forest, F.; Galley, C.; Hardy, C.R.; et al. Consistent phenological shifts in the making of a biodiversity hotspot: The Cape flora. BMC Evol. Biol. 2011, 11, 39. [Google Scholar] [CrossRef]
- Graham, M.H. Confronting multicollinearity in ecological multiple regression. Ecology 2003, 84, 2809–2815. [Google Scholar] [CrossRef]
- Che, L.; Cao, B.; Bai, C.; Wang, J.; Zhang, L. Predictive distribution and habitat suitability assessment of Notholirion bulbuliferum based on MaxEnt and arcGIS. Chin. J. Ecol. 2014, 33, 1623–1628. [Google Scholar]
- Yang, X.; Kushwaha, S.P.; Saran, S.; Xu, J.; Roy, P.S. Maxent modeling for predicting the potential distribution of medicinal plant, Justicia adhatoda L. in Lesser Himalayan foothills. Ecol. Eng. 2013, 51, 83–87. [Google Scholar] [CrossRef]
- Wisz, M.S.; Pottier, J.; Kissling, W.D.; Pellissier, L.; Lenoir, J.; Damgaard, C.F.; Dormann, C.F.; Forchhammer, M.C.; Grytnes, J.-A.; Guisan, A.; et al. The role of biotic interactions in shaping distributions and realised assemblages of species: Implications for species distribution modelling. Biol. Rev. 2013, 88, 15–30. [Google Scholar] [CrossRef]
- Phillips, S.J.; Anderson, R.P.; Dudík, M.; Schapire, R.E.; Blair, M.E. Opening the black box: An open-source release of Maxent. Ecography 2017, 40, 887–893. [Google Scholar] [CrossRef]
- Phillips, S.J.; Dudík, M. Modeling of species distributions with Maxent: New extensions and a comprehensive evaluation. Ecography 2008, 31, 161–175. [Google Scholar] [CrossRef]
- Merow, C.; Smith, M.J.; Silander, J.A., Jr. A practical guide to MaxEnt for modeling species’ distributions: What it does, and why inputs and settings matter. Ecography 2013, 36, 1058–1069. [Google Scholar] [CrossRef]
- Peterson, A.T.; Papeş, M.; Eaton, M.D. Transferability and model evaluation in ecological niche modeling: A comparison of GARP and Maxent. Ecography 2007, 30, 550–560. [Google Scholar] [CrossRef]
- Flory, A.R.; Kumar, S.; Stohlgren, T.J.; Cryan, P.M. Environmental conditions associated with bat white-nose syndrome mortality in the north-eastern United States. J. Appl. Ecol. 2012, 49, 680–689. [Google Scholar] [CrossRef]
- Wan, G.; Wang, L.; Jin, L.; Chen, J. Evaluation of environmental factors affecting the quality of Codonopsis pilosula based on chromatographic fingerprint and MaxEnt model. Ind. Crops Prod. 2021, 170, 113783. [Google Scholar] [CrossRef]
- Buckman-Sewald, J.; Whorton, C.R.; Root, K.V. Developing macrohabitat models for bats in parks using maxent and testing them with data collected by citizen scientists. Int. J. Biodivers. Conserv. 2014, 6, 171–183. [Google Scholar] [CrossRef]
- Wang, S.; Jia, H.; Zhang, Z.; Hu, L.; Chen, G. Competitive Effects between Invasive Plant Phytolacca americana and three Forage Species. Acta Agrestia Sin. 2021, 29, 95–102. [Google Scholar] [CrossRef]
- Punyasena, S.W.; Eshel, G.; McElwain, J.C. The influence of climate on the spatial patterning of Neotropical plant families. J. Biogeogr. 2007, 35, 117–130. [Google Scholar] [CrossRef]
- Bradie, J.; Leung, B. A quantitative synthesis of the importance of variables used in MaxEnt species distribution models. J. Biogeogr. 2017, 44, 1344–1361. [Google Scholar] [CrossRef]
- Li, H.; Zhang, C.; Wang, S.; Ma, W.; Liu, F.; Chen, Q.; Zhou, Q.; Xia, X.; Niu, B. Response of vegetation dynamics to hydrothermal conditions on the Qinghai-Tibet Plateau in the last 40 years. Acta Ecol. Sin. 2022, 42, 4770–4783. [Google Scholar] [CrossRef]
- Damalas, C.A. Distribution, biology, and agricultural importance of Galinsoga parviflora (Asteraceae). Weed Biol. Manag. 2008, 8, 147–153. [Google Scholar] [CrossRef]
- Lei, M.; Lu, Y.; Zhou, C.; Liu, Z.; Xu, Y.; Xia, J. High slope stability remote real-time monitoring system used in subtropical monsoon climate zone in western Guangdong. Zhongshan Daxue Xuebao/Acta Sci. Natralium Univ. Sunyatseni 2015, 54, 30–36. [Google Scholar] [CrossRef]
- Chen, G.; Qiang, S. Human activities are the principle cause of biotic homogenization. Acta Ecol. Sin. 2011, 31, 4016–4107. [Google Scholar]
- Vibrans, H. Epianthropochory in Mexican weed communities. Am. J. Bot. 1999, 86, 476–481. [Google Scholar] [CrossRef]
- Prevéy, J.S.; Parker, L.E.; Harrington, C.A.; Lamb, C.T.; Proctor, M.F. Climate change shifts in habitat suitability and phenology of huckleberry (Vaccinium membranaceum). Agric. For. Meteorol. 2020, 280, 107803. [Google Scholar] [CrossRef]
- Jueterbock, A.; Smolina, I.; Coyer, J.A.; Hoarau, G. The fate of the Arctic seaweed Fucus distichus under climate change: An ecological niche modeling approach. Ecol. Evol. 2016, 6, 1712–1724. [Google Scholar] [CrossRef]
- Kuang, X.; Han, Y. Response of China Climate to Vegetation Change under Mid-Holocene Background Based on Dynamic Downscaling Simulation. Adv. Earth Sci. 2021, 36, 1301–1312. [Google Scholar] [CrossRef]
- Voosen, P. Global temperatures in 2020 tied record highs. Science 2021, 371, 334–335. [Google Scholar] [CrossRef]


| Environmental Variables | Names |
|---|---|
| 2.5m-bio1 | Annual mean temperature |
| 2.5m-bio2 | Mean diurnal range |
| 2.5m-bio3 | Isothermality (2/7) (×100) |
| 2.5m-bio4 | Temperature seasonality (standard deviation × 100) |
| 2.5m-bio5 | Max temperature of warmest month |
| 2.5m-bio6 | Min temperature of coldest month |
| 2.5m-bio7 | Temperature annual range |
| 2.5m-bio8 | Mean temperature of wettest quarter |
| 2.5m-bio9 | Mean temperature of driest quarter |
| 2.5m-bio10 | Mean temperature of warmest quarter |
| 2.5m-bio11 | Mean temperature of coldest quarter |
| 2.5m-bio12 | Annual precipitation |
| 2.5m-bio13 | Precipitation of wettest month |
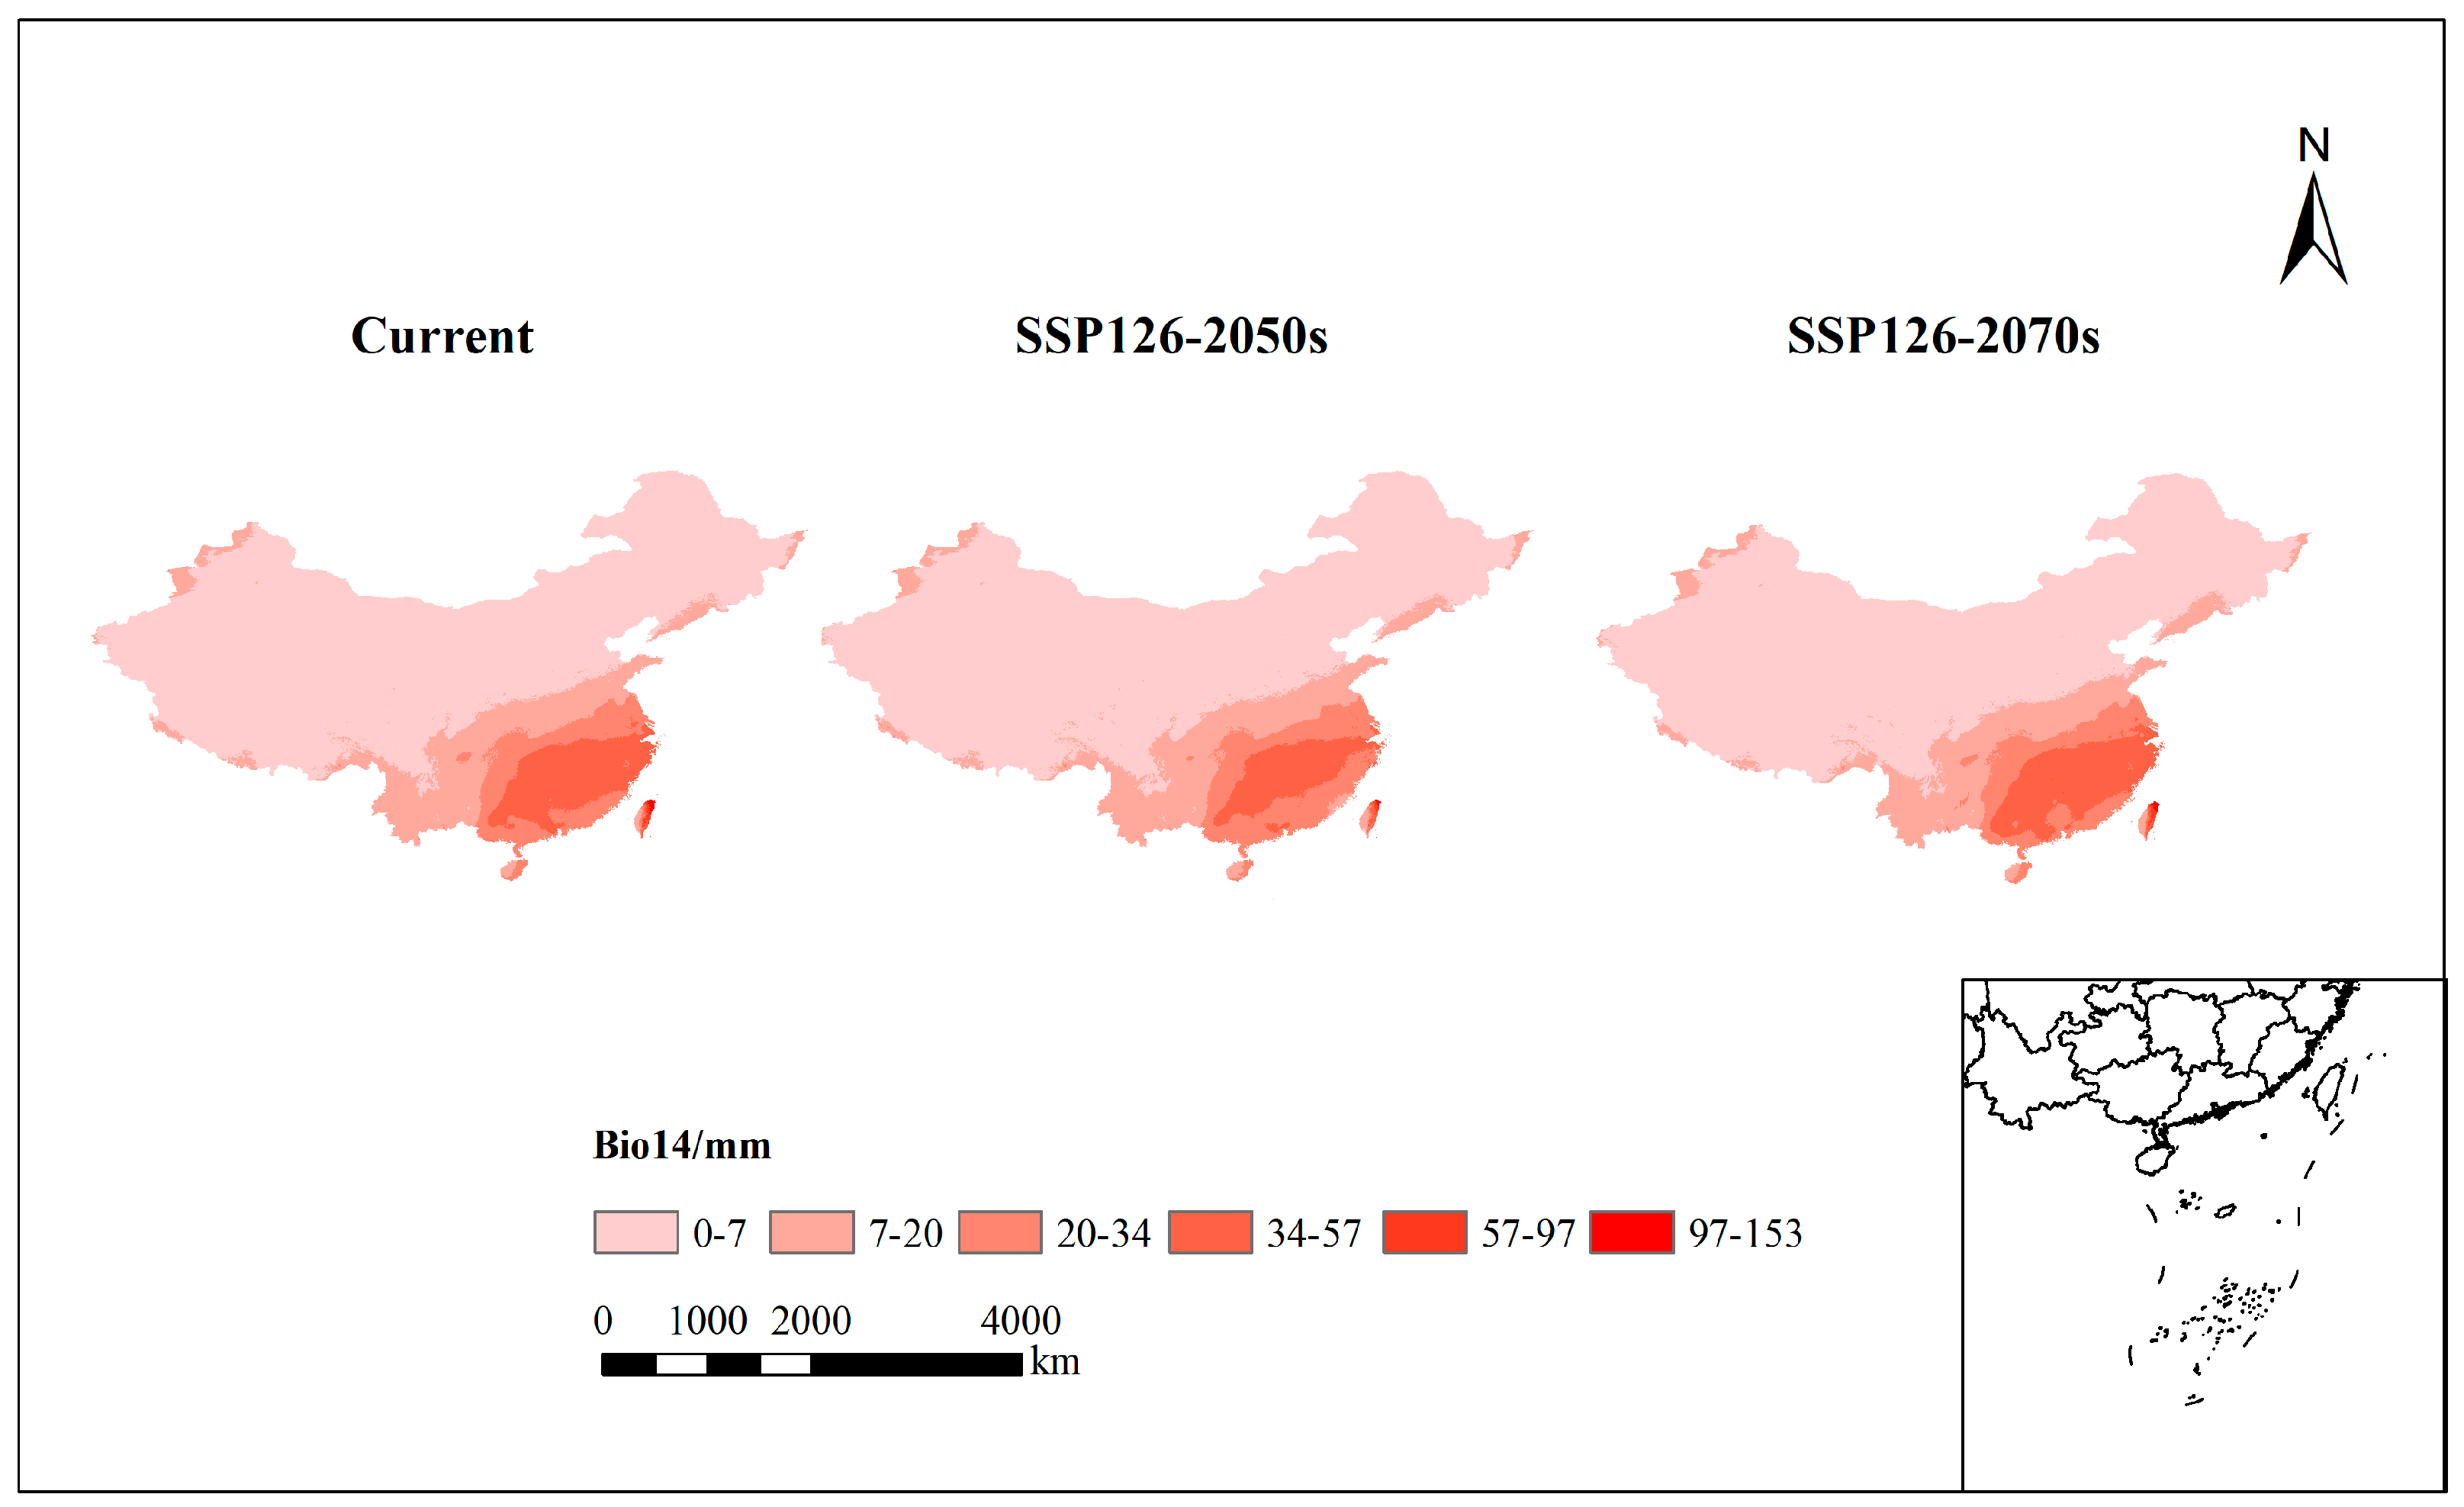
| 2.5m-bio14 | Precipitation of driest month |
| 2.5m-bio15 | Precipitation seasonality (variation coefficient) |
| 2.5m-bio16 | Precipitation of wettest quarter |
| 2.5m-bio17 | Precipitation of driest quarter |
| 2.5m-bio18 | Precipitation of warmest quarter |
| 2.5m-bio19 | Precipitation of coldest quarter |
| Alt | Altitude |
| Variable | Bioclimatic Factors | Percent Contribution |
|---|---|---|
| bio14 | Precipitation of driest month | 68.7 |
| bio6 | Min temperature of coldest month | 13.6 |
| bio13 | Precipitation of wettest month | 6.7 |
| bio3 | Isothermality (2/7) (×100) | 3.4 |
| bio7 | Temperature annual range | 2.3 |
| bio12 | Annual precipitation | 1.7 |
| bio2 | Mean diurnal range | 1.6 |
| bio8 | Mean temperature of wettest quarter | 1.1 |
| bio10 | Mean temperature of warmest quarter | 0.9 |
| Scenario | Period | Highly Suitable Area | Change | Moderately Suitable Area | Change | Low-Suitability Area | Change | Total Area | Total Change |
|---|---|---|---|---|---|---|---|---|---|
| Area (×104 km2) | Area (×104 km2) | Area (×104 km2) | |||||||
| Current | 98.68 | 69.10 | 112.48 | 280.26 | |||||
| SSP126 | 2050s | 83.02 | −15.86% | 82.60 | 19.53% | 104.94 | −6.70% | 270.56 | −3.46% |
| 2070s | 87.51 | −11.32% | 76.09 | 10.10% | 115.99 | 3.12% | 279.59 | −0.24% | |
| SSP245 | 2050s | 101.00 | 2.35% | 70.19 | 1.58% | 102.20 | −9.14% | 273.40 | −2.45% |
| 2070s | 97.46 | −1.24% | 72.50 | 4.91% | 107.49 | −4.43% | 277.45 | −1.00% | |
| SSP585 | 2050s | 94.42 | −4.32% | 79.07 | 14.43% | 111.99 | −0.44% | 285.48 | 1.86% |
| 2070s | 102.50 | 3.88% | 74.93 | 8.42% | 109.01 | −3.08% | 286.44 | 2.20% |
Disclaimer/Publisher’s Note: The statements, opinions and data contained in all publications are solely those of the individual author(s) and contributor(s) and not of MDPI and/or the editor(s). MDPI and/or the editor(s) disclaim responsibility for any injury to people or property resulting from any ideas, methods, instructions or products referred to in the content. |
© 2024 by the authors. Licensee MDPI, Basel, Switzerland. This article is an open access article distributed under the terms and conditions of the Creative Commons Attribution (CC BY) license (https://creativecommons.org/licenses/by/4.0/).
Share and Cite
Nan, Q.; Li, C.; Li, X.; Zheng, D.; Li, Z.; Zhao, L. Modeling the Potential Distribution Patterns of the Invasive Plant Species Phytolacca americana in China in Response to Climate Change. Plants 2024, 13, 1082. https://doi.org/10.3390/plants13081082
Nan Q, Li C, Li X, Zheng D, Li Z, Zhao L. Modeling the Potential Distribution Patterns of the Invasive Plant Species Phytolacca americana in China in Response to Climate Change. Plants. 2024; 13(8):1082. https://doi.org/10.3390/plants13081082
Chicago/Turabian StyleNan, Qianru, Chunhui Li, Xinghao Li, Danni Zheng, Zhaohua Li, and Liya Zhao. 2024. "Modeling the Potential Distribution Patterns of the Invasive Plant Species Phytolacca americana in China in Response to Climate Change" Plants 13, no. 8: 1082. https://doi.org/10.3390/plants13081082