
Stability Analysis and Identification of Superior Hybrids in Pearl Millet [Pennisetum glaucum (L.) R. Br.] Using the Multi Trait Stability Index
Abstract
:1. Introduction
2. Results and Discussion
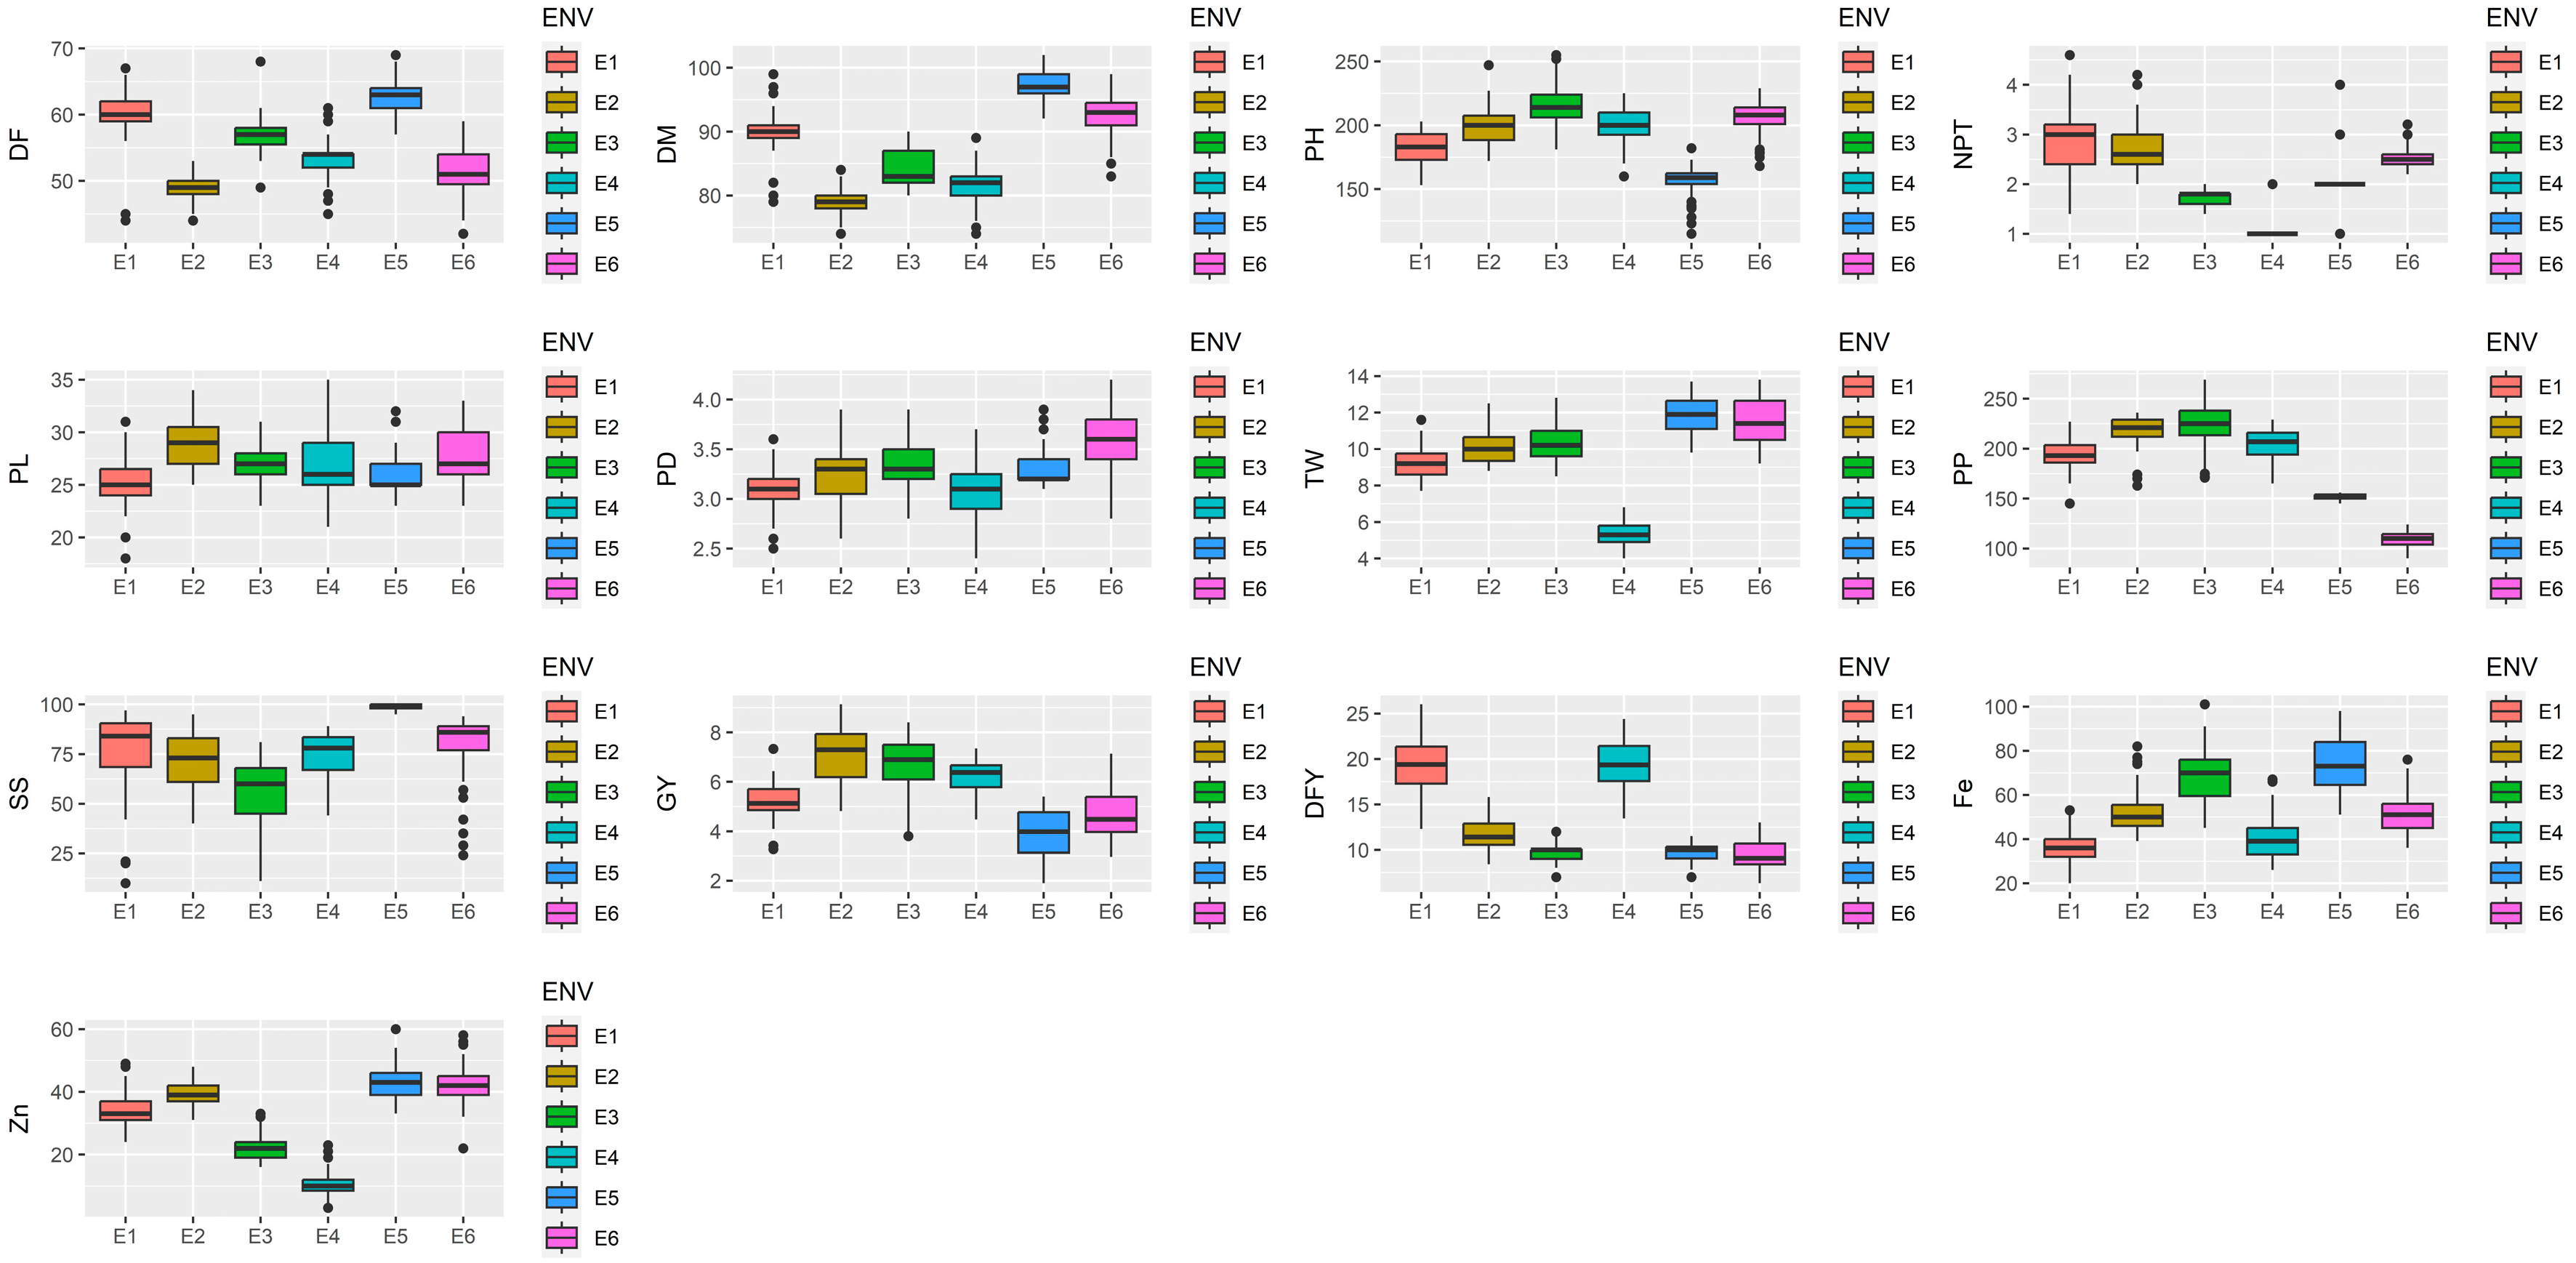
2.1. ANOVA and Mean Performance
2.2. GEI Analysis
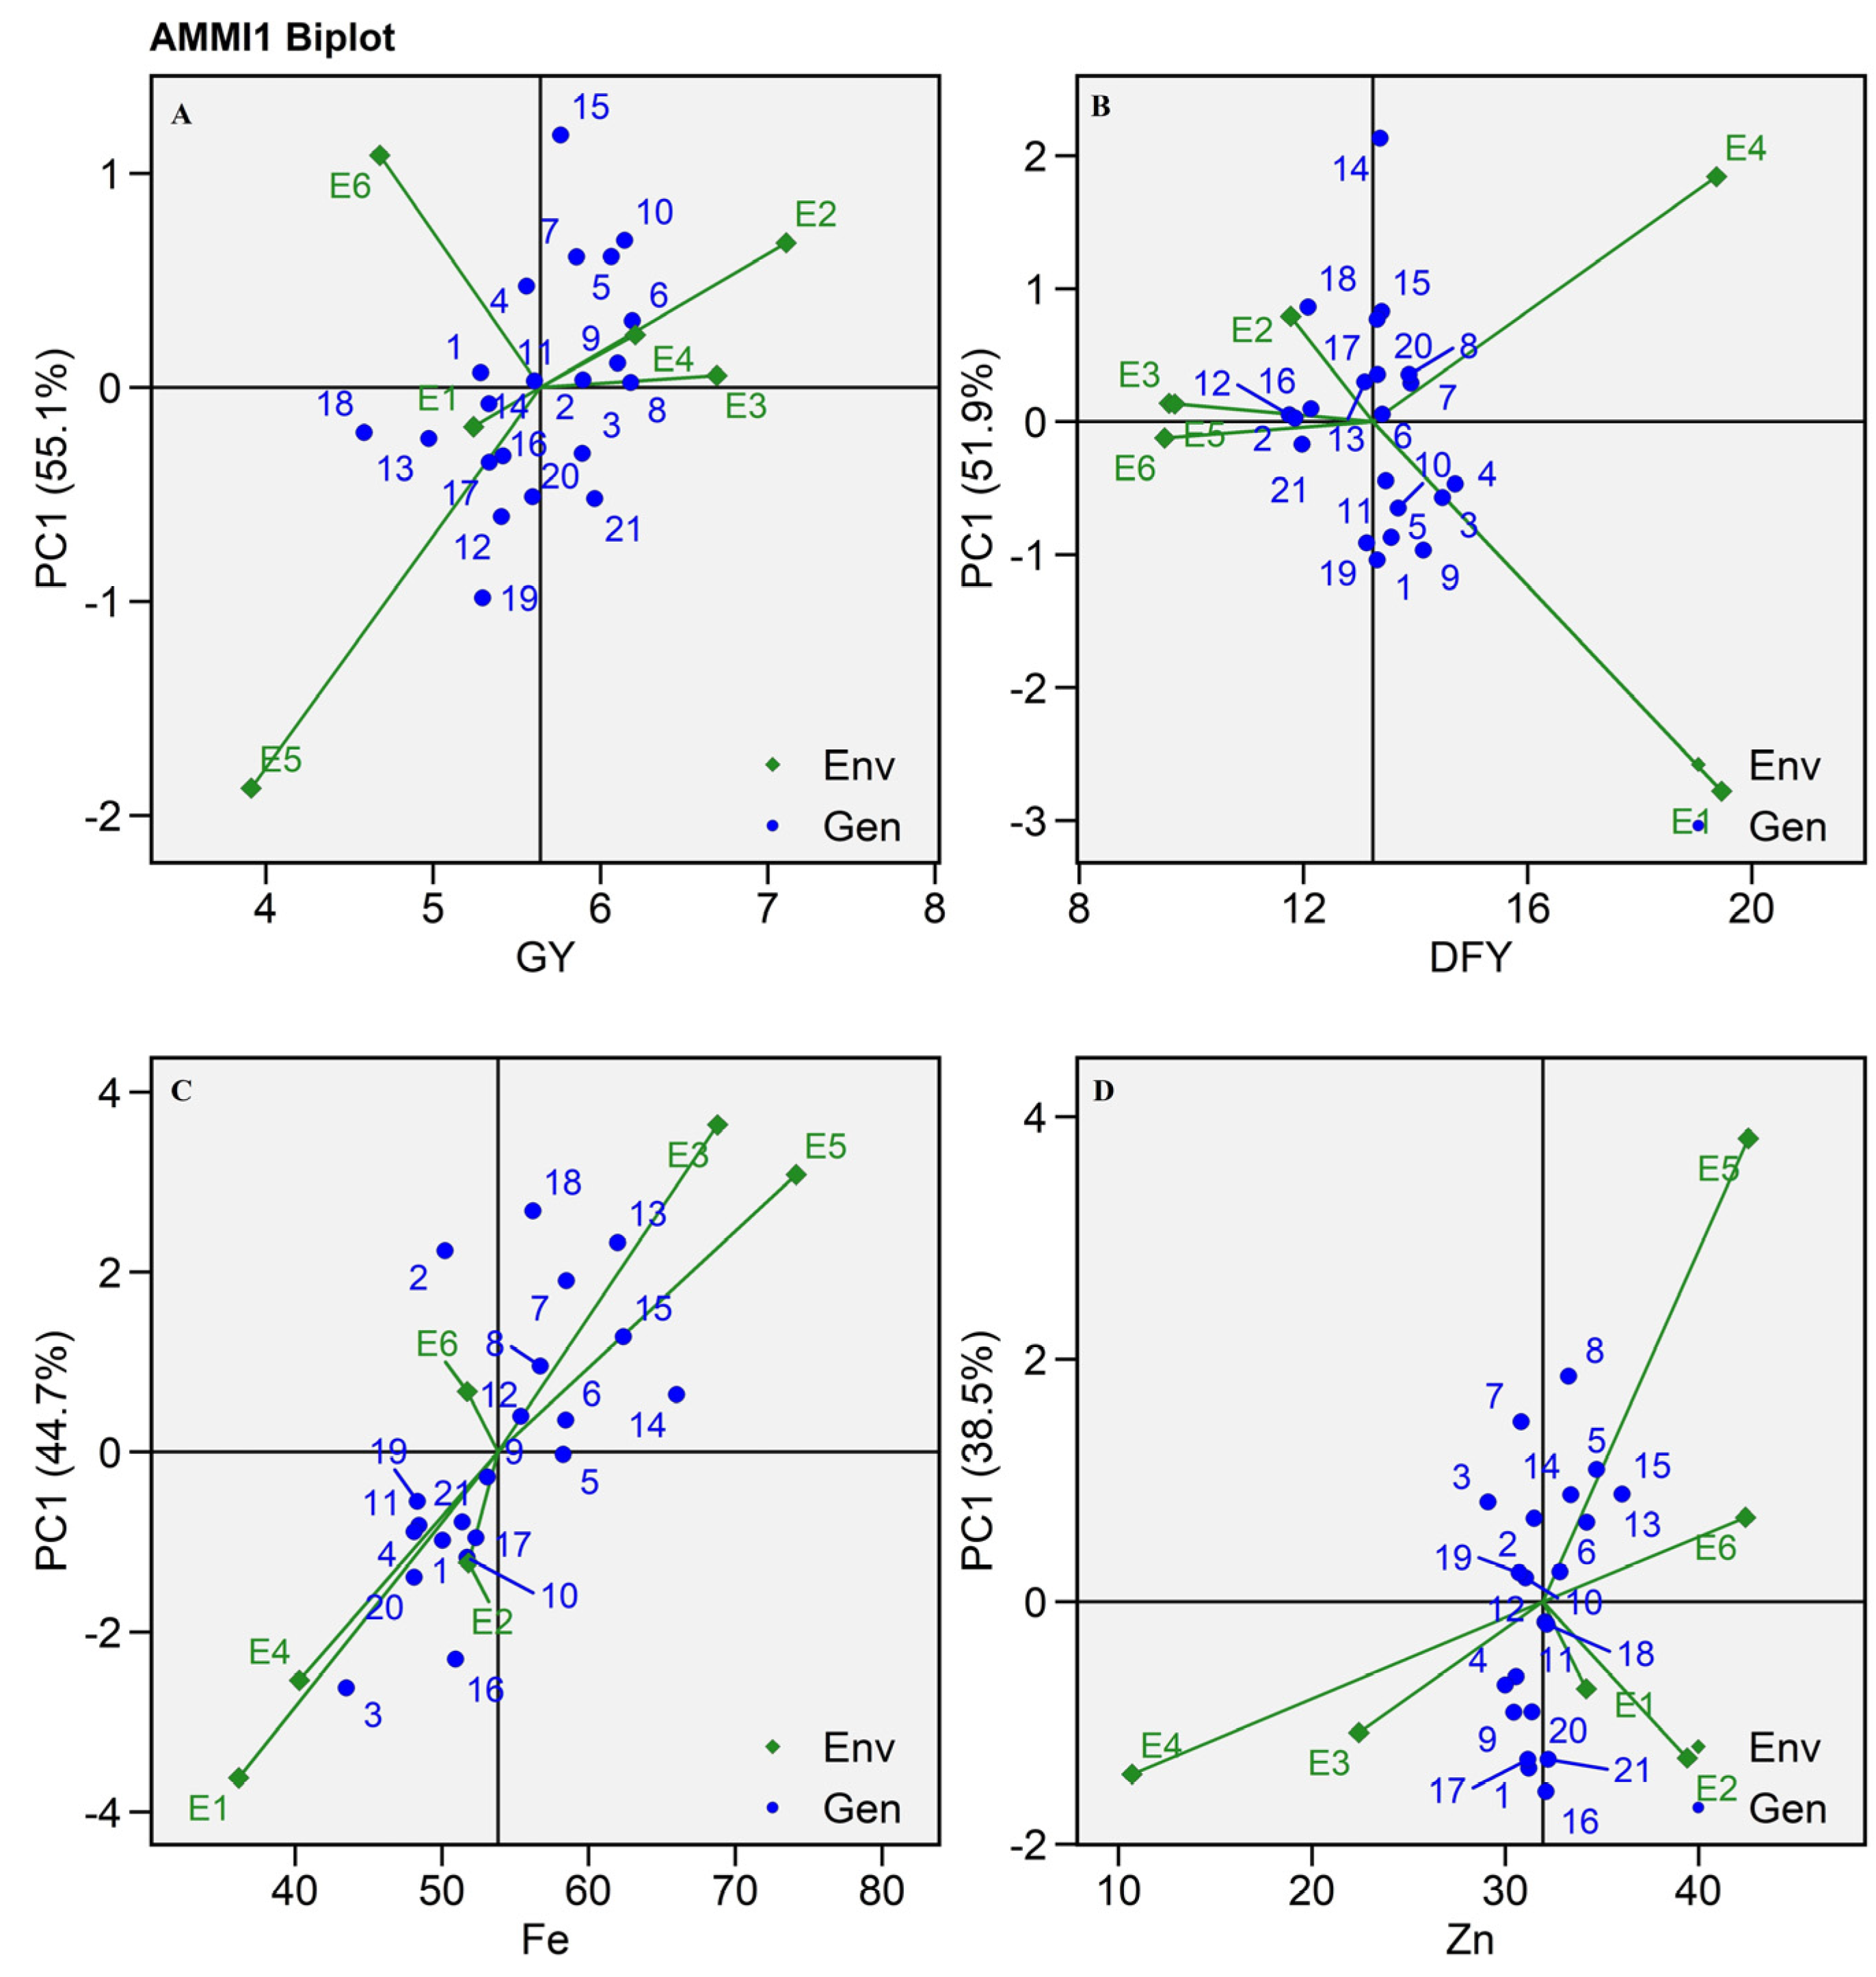
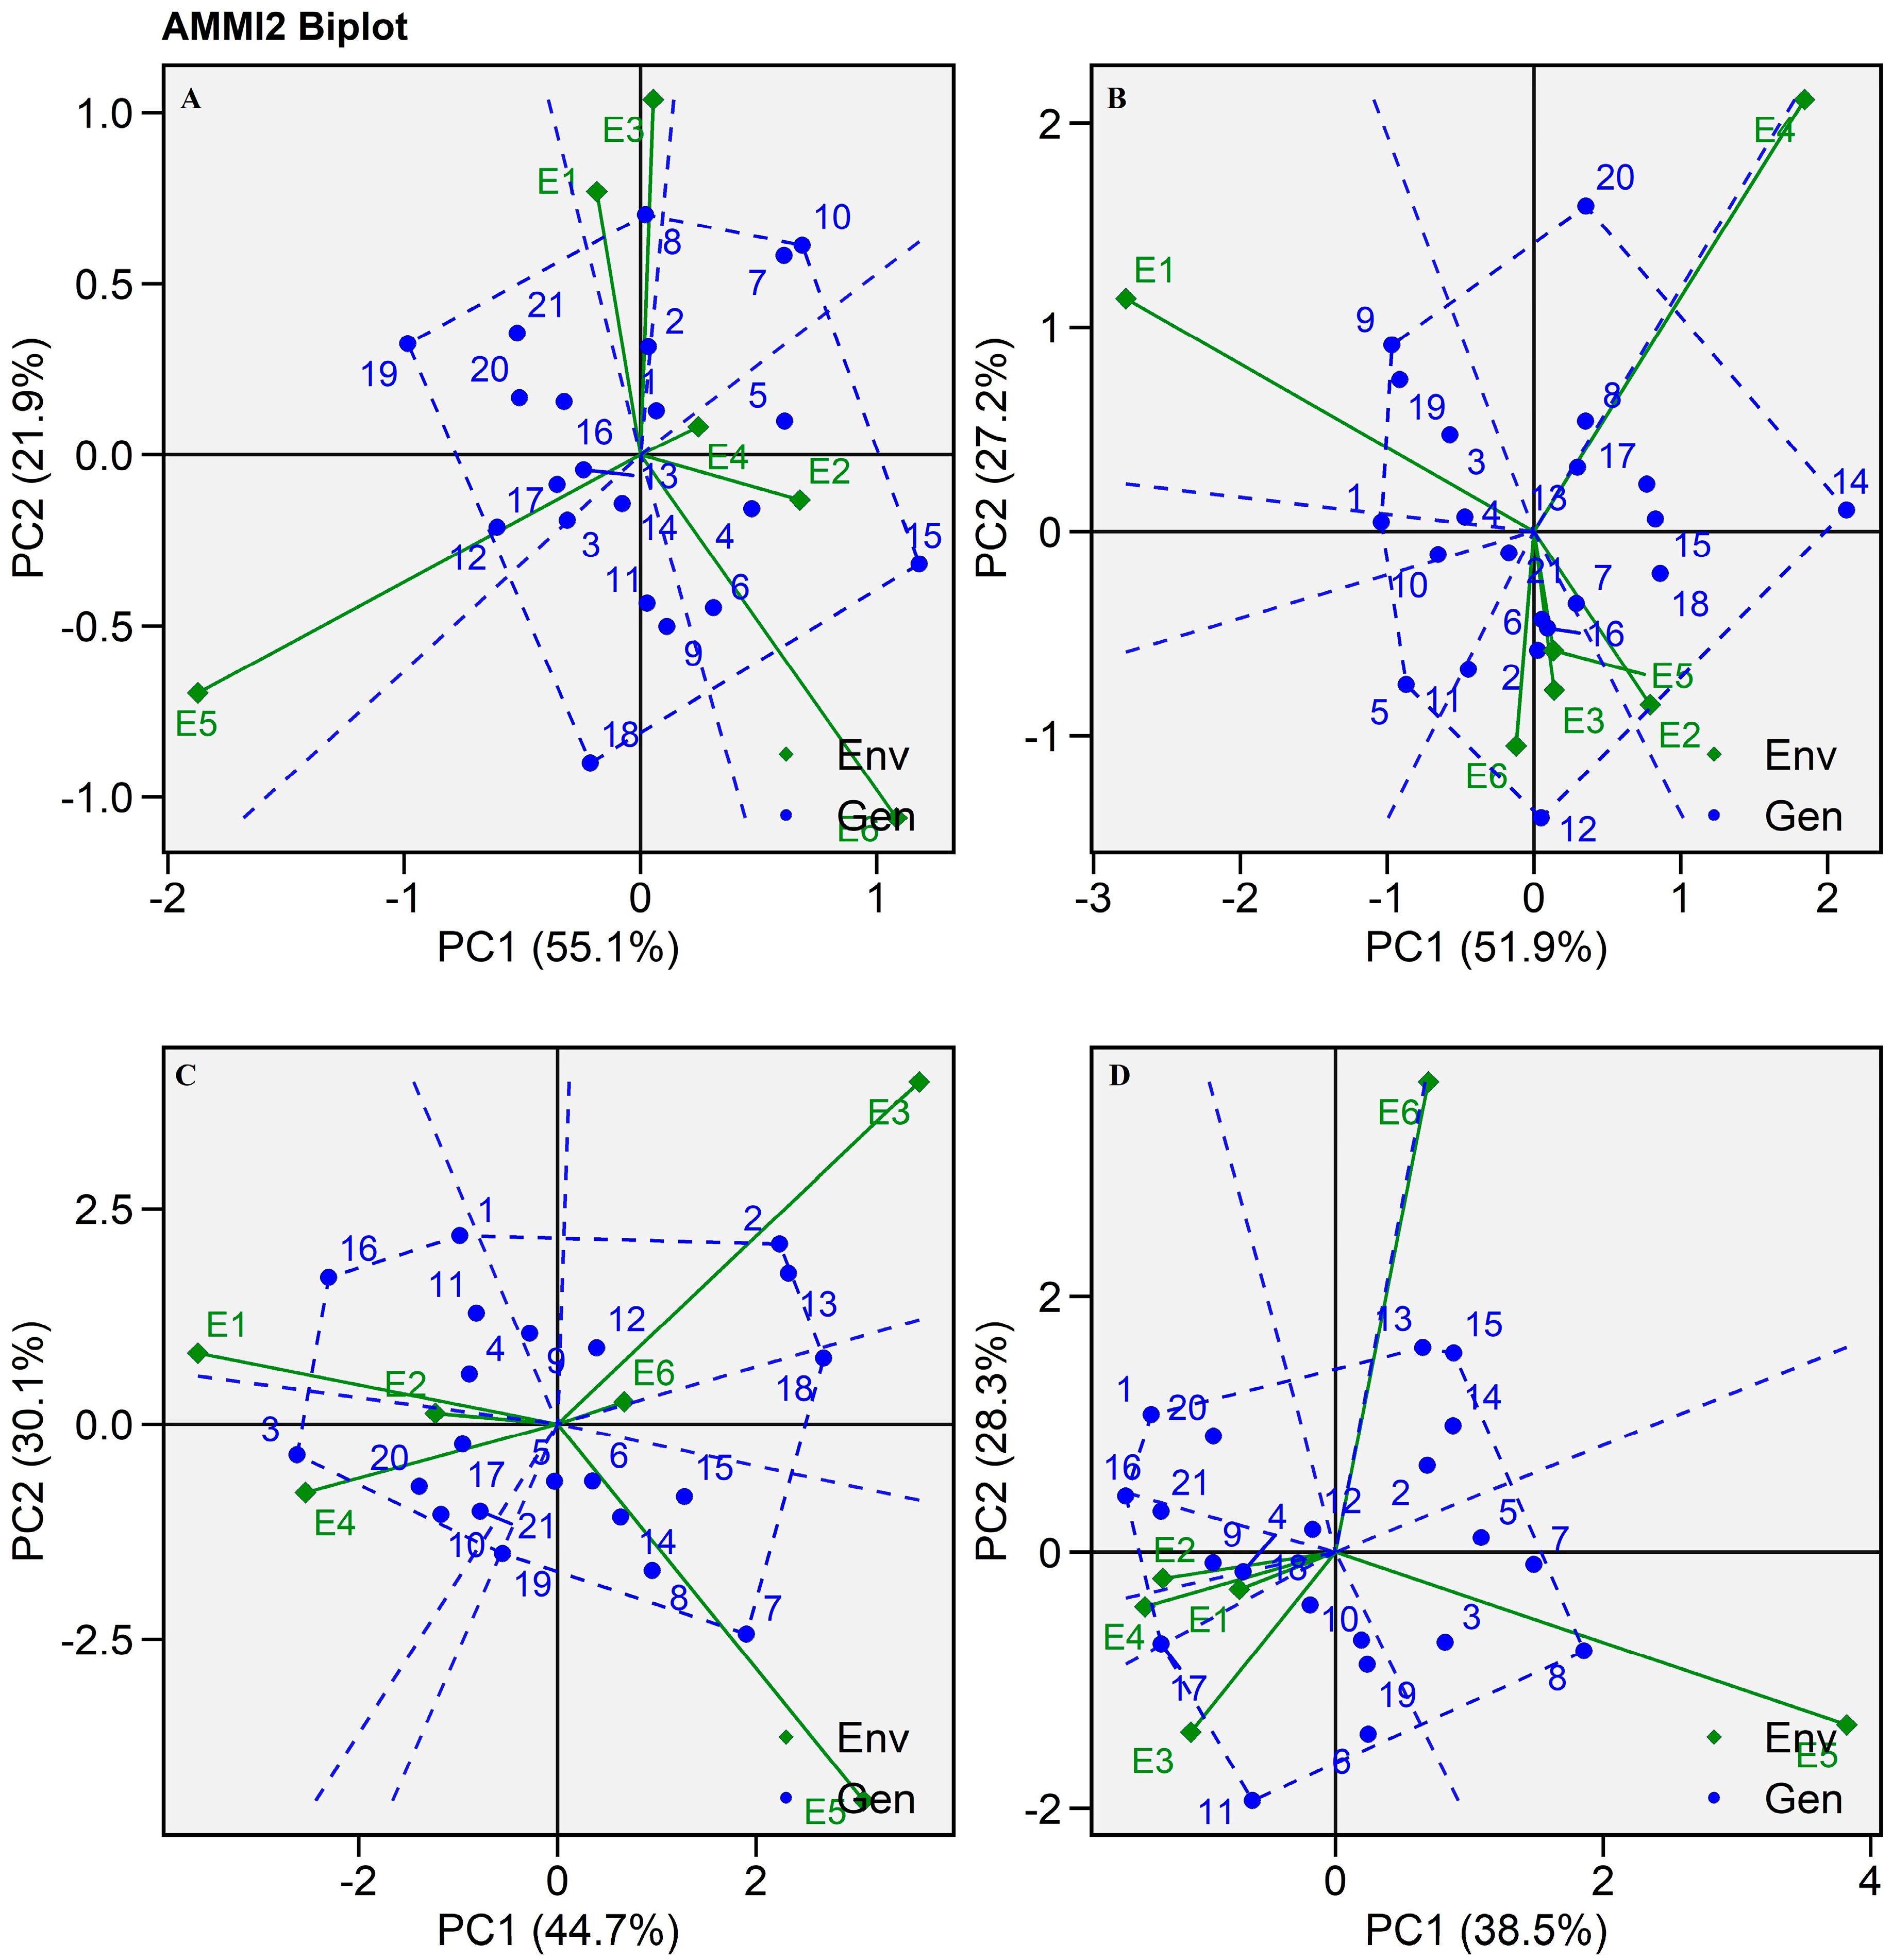
2.3. AMMI Biplot
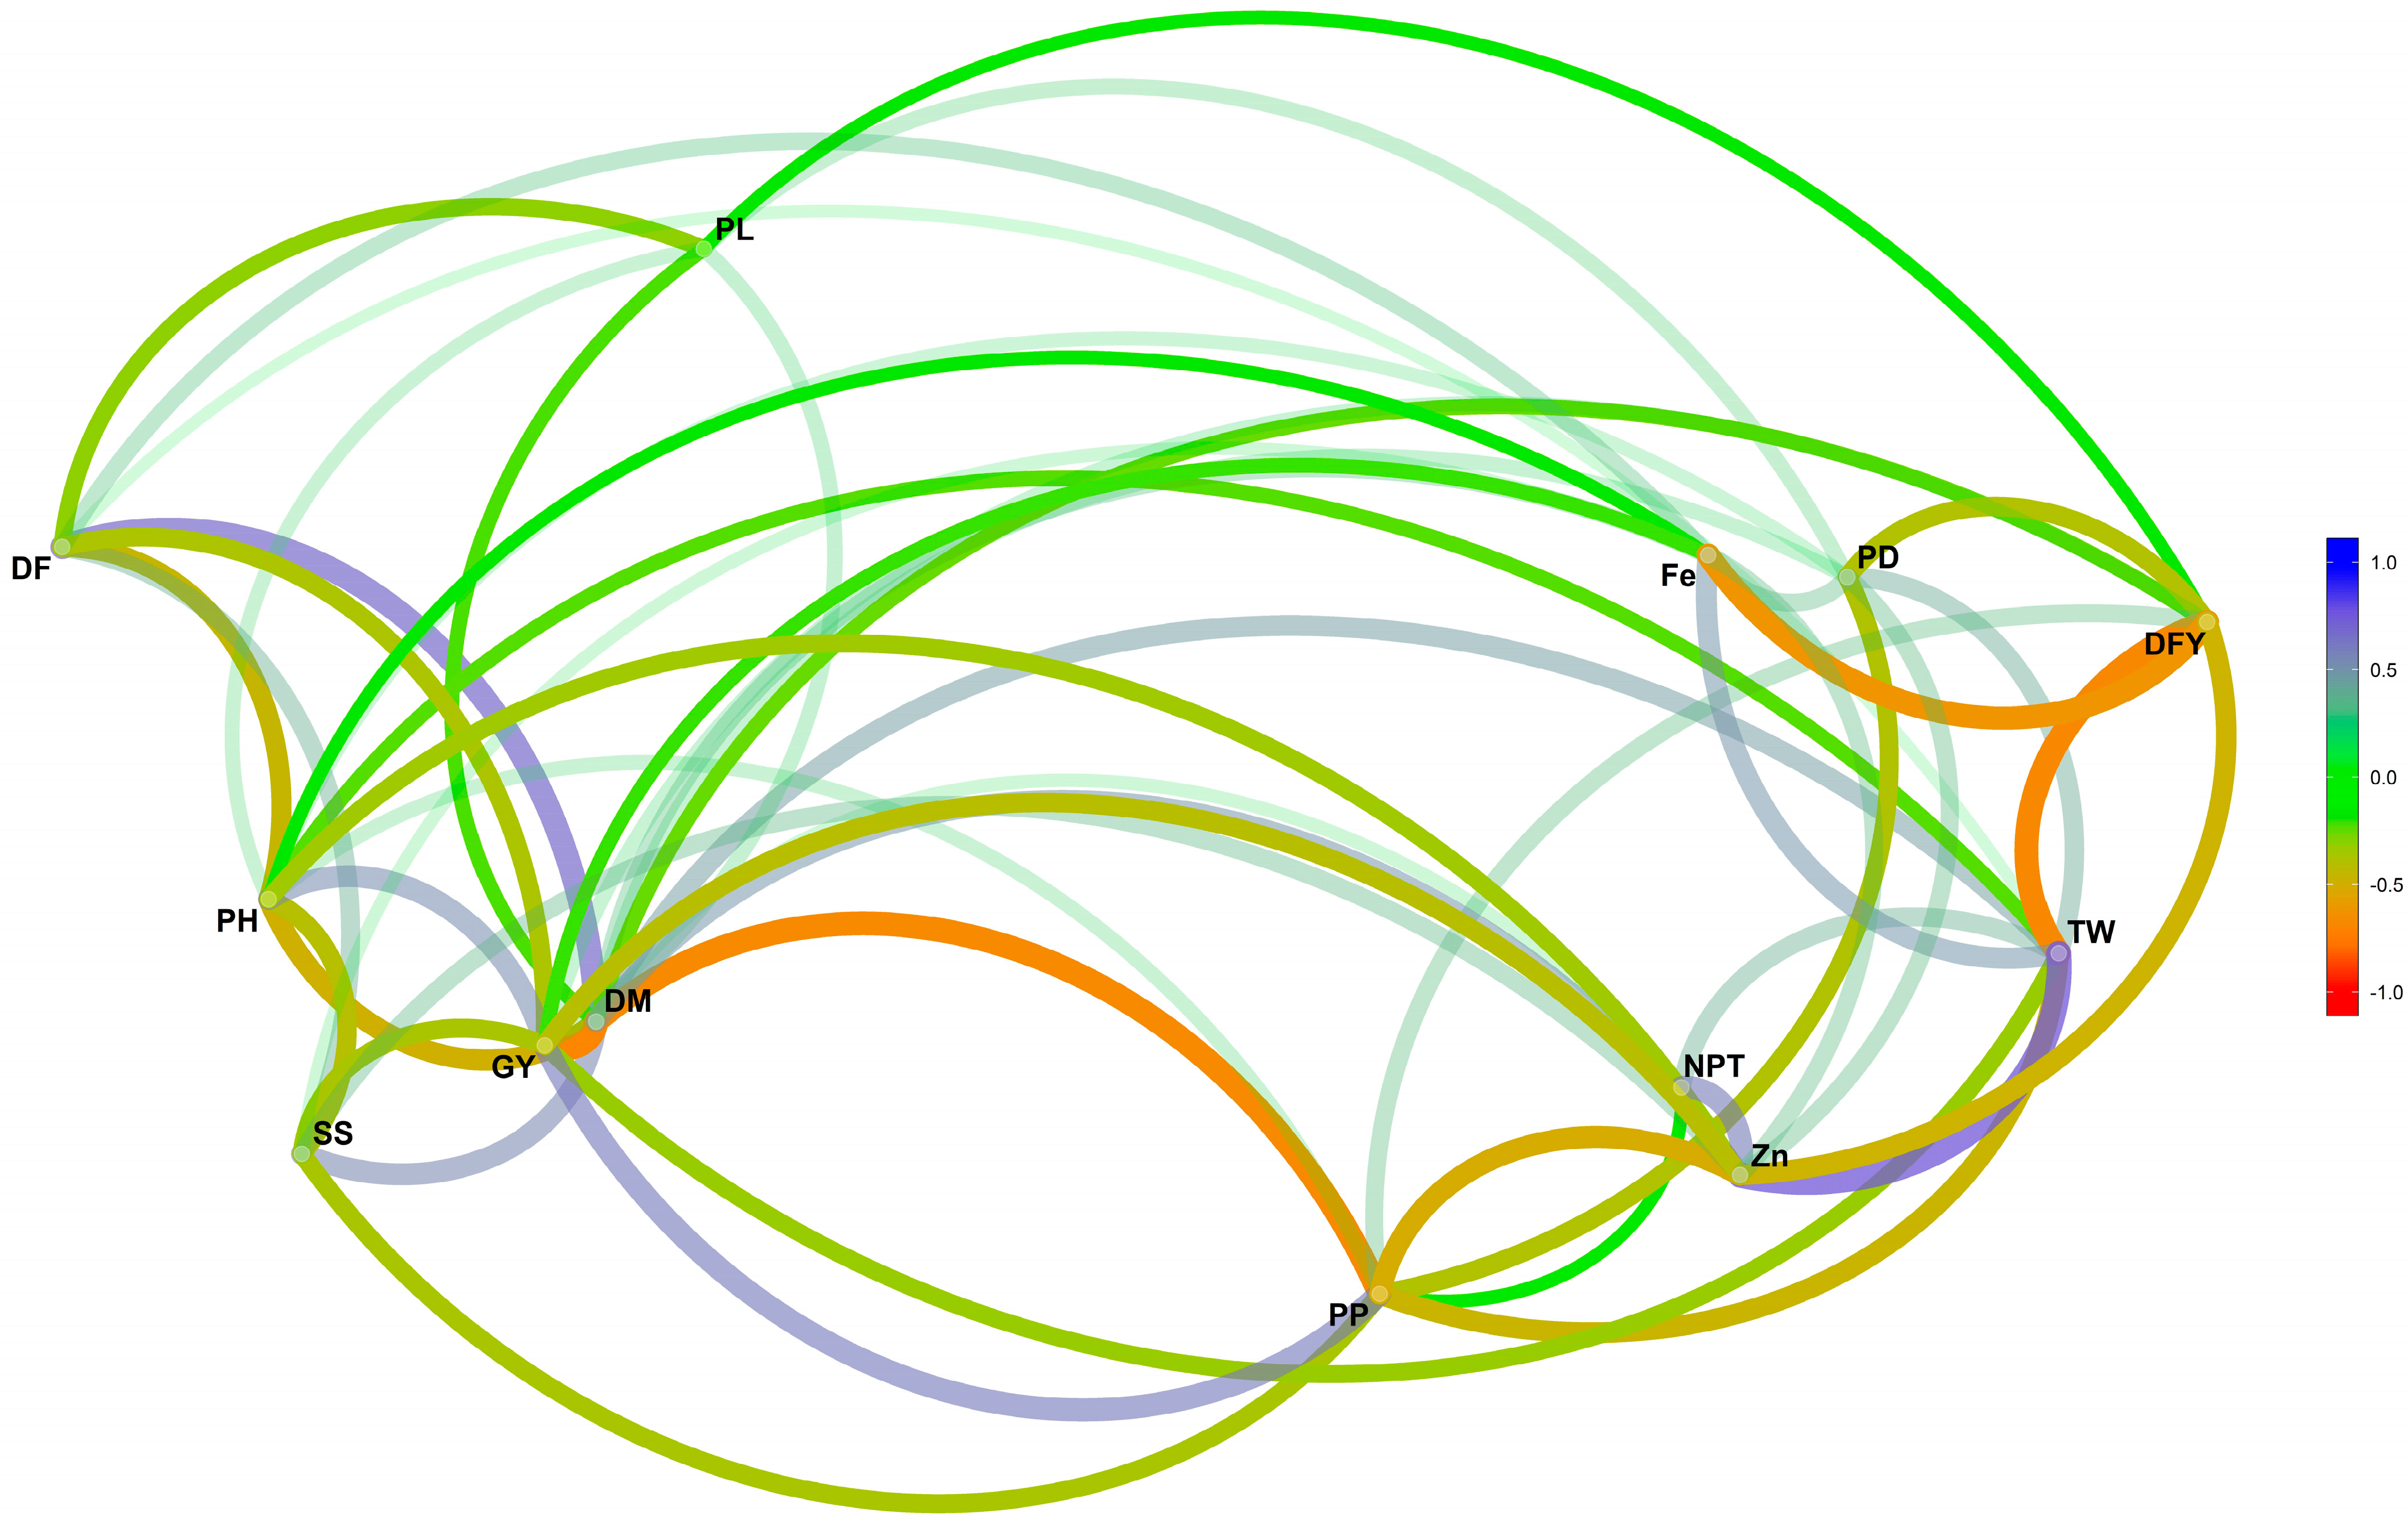
2.4. Correlations among Traits over Environments
2.5. GGE Biplots
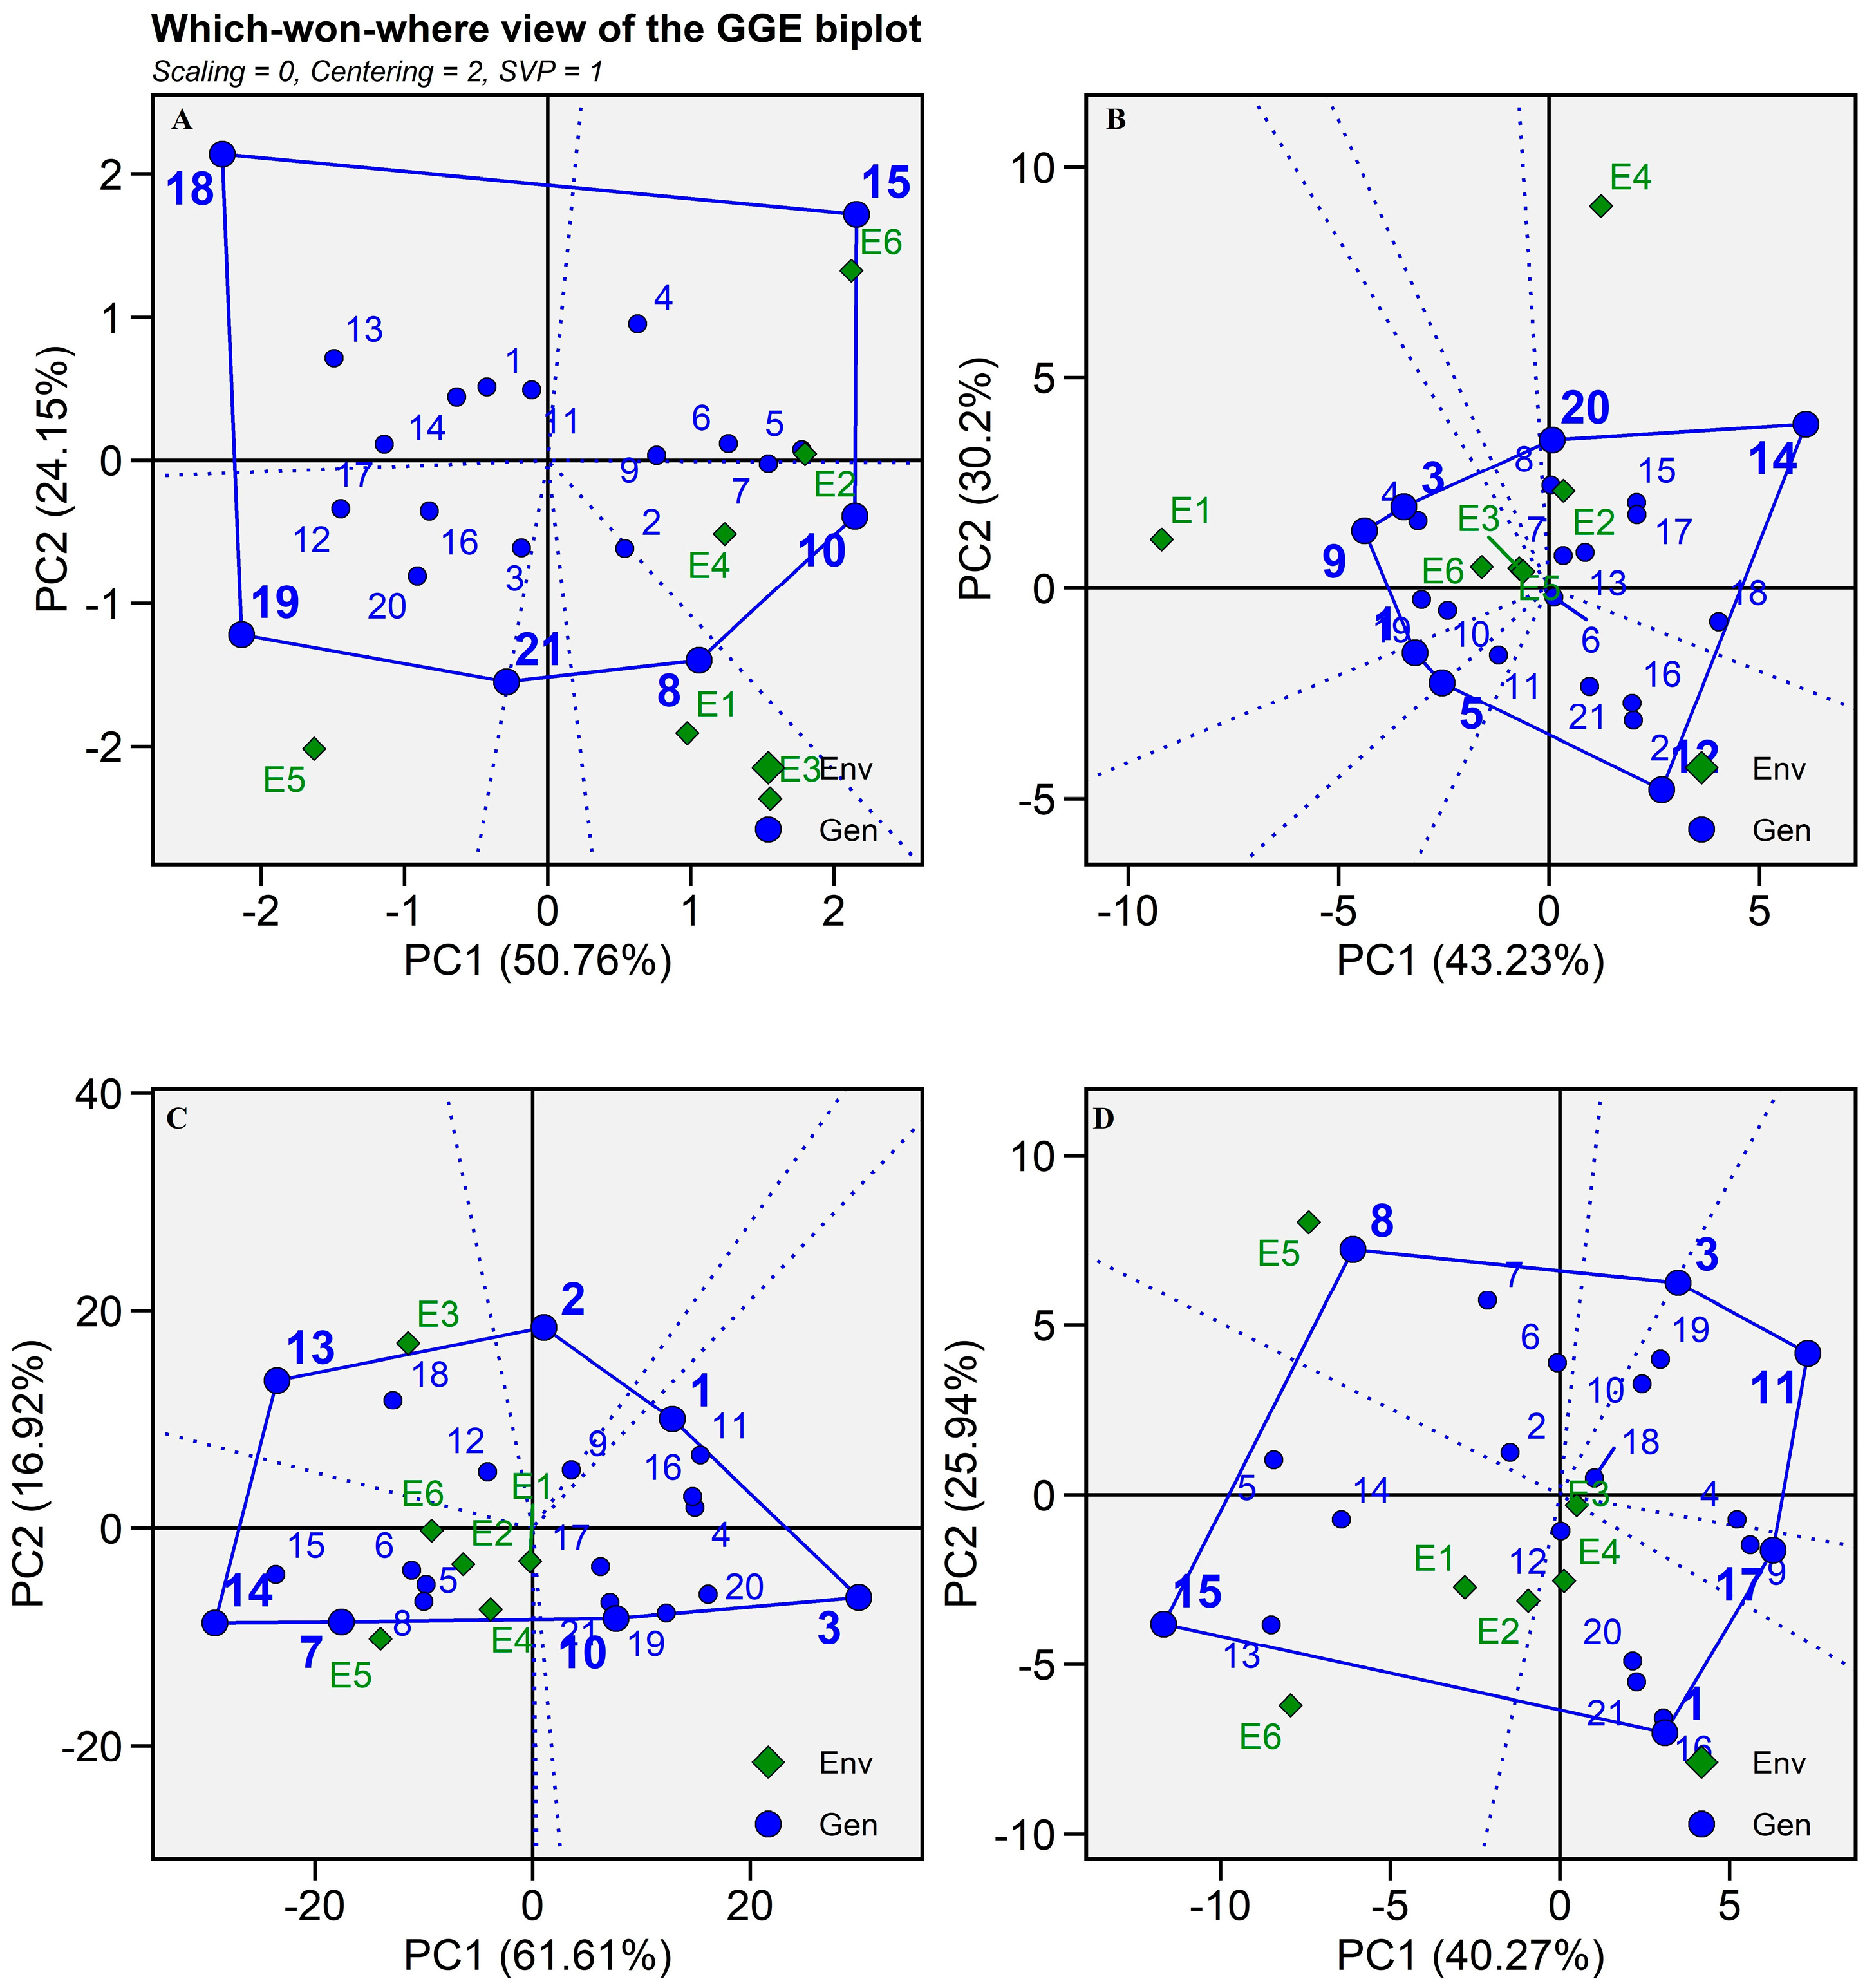
2.5.1. Which-Won-Where and What?
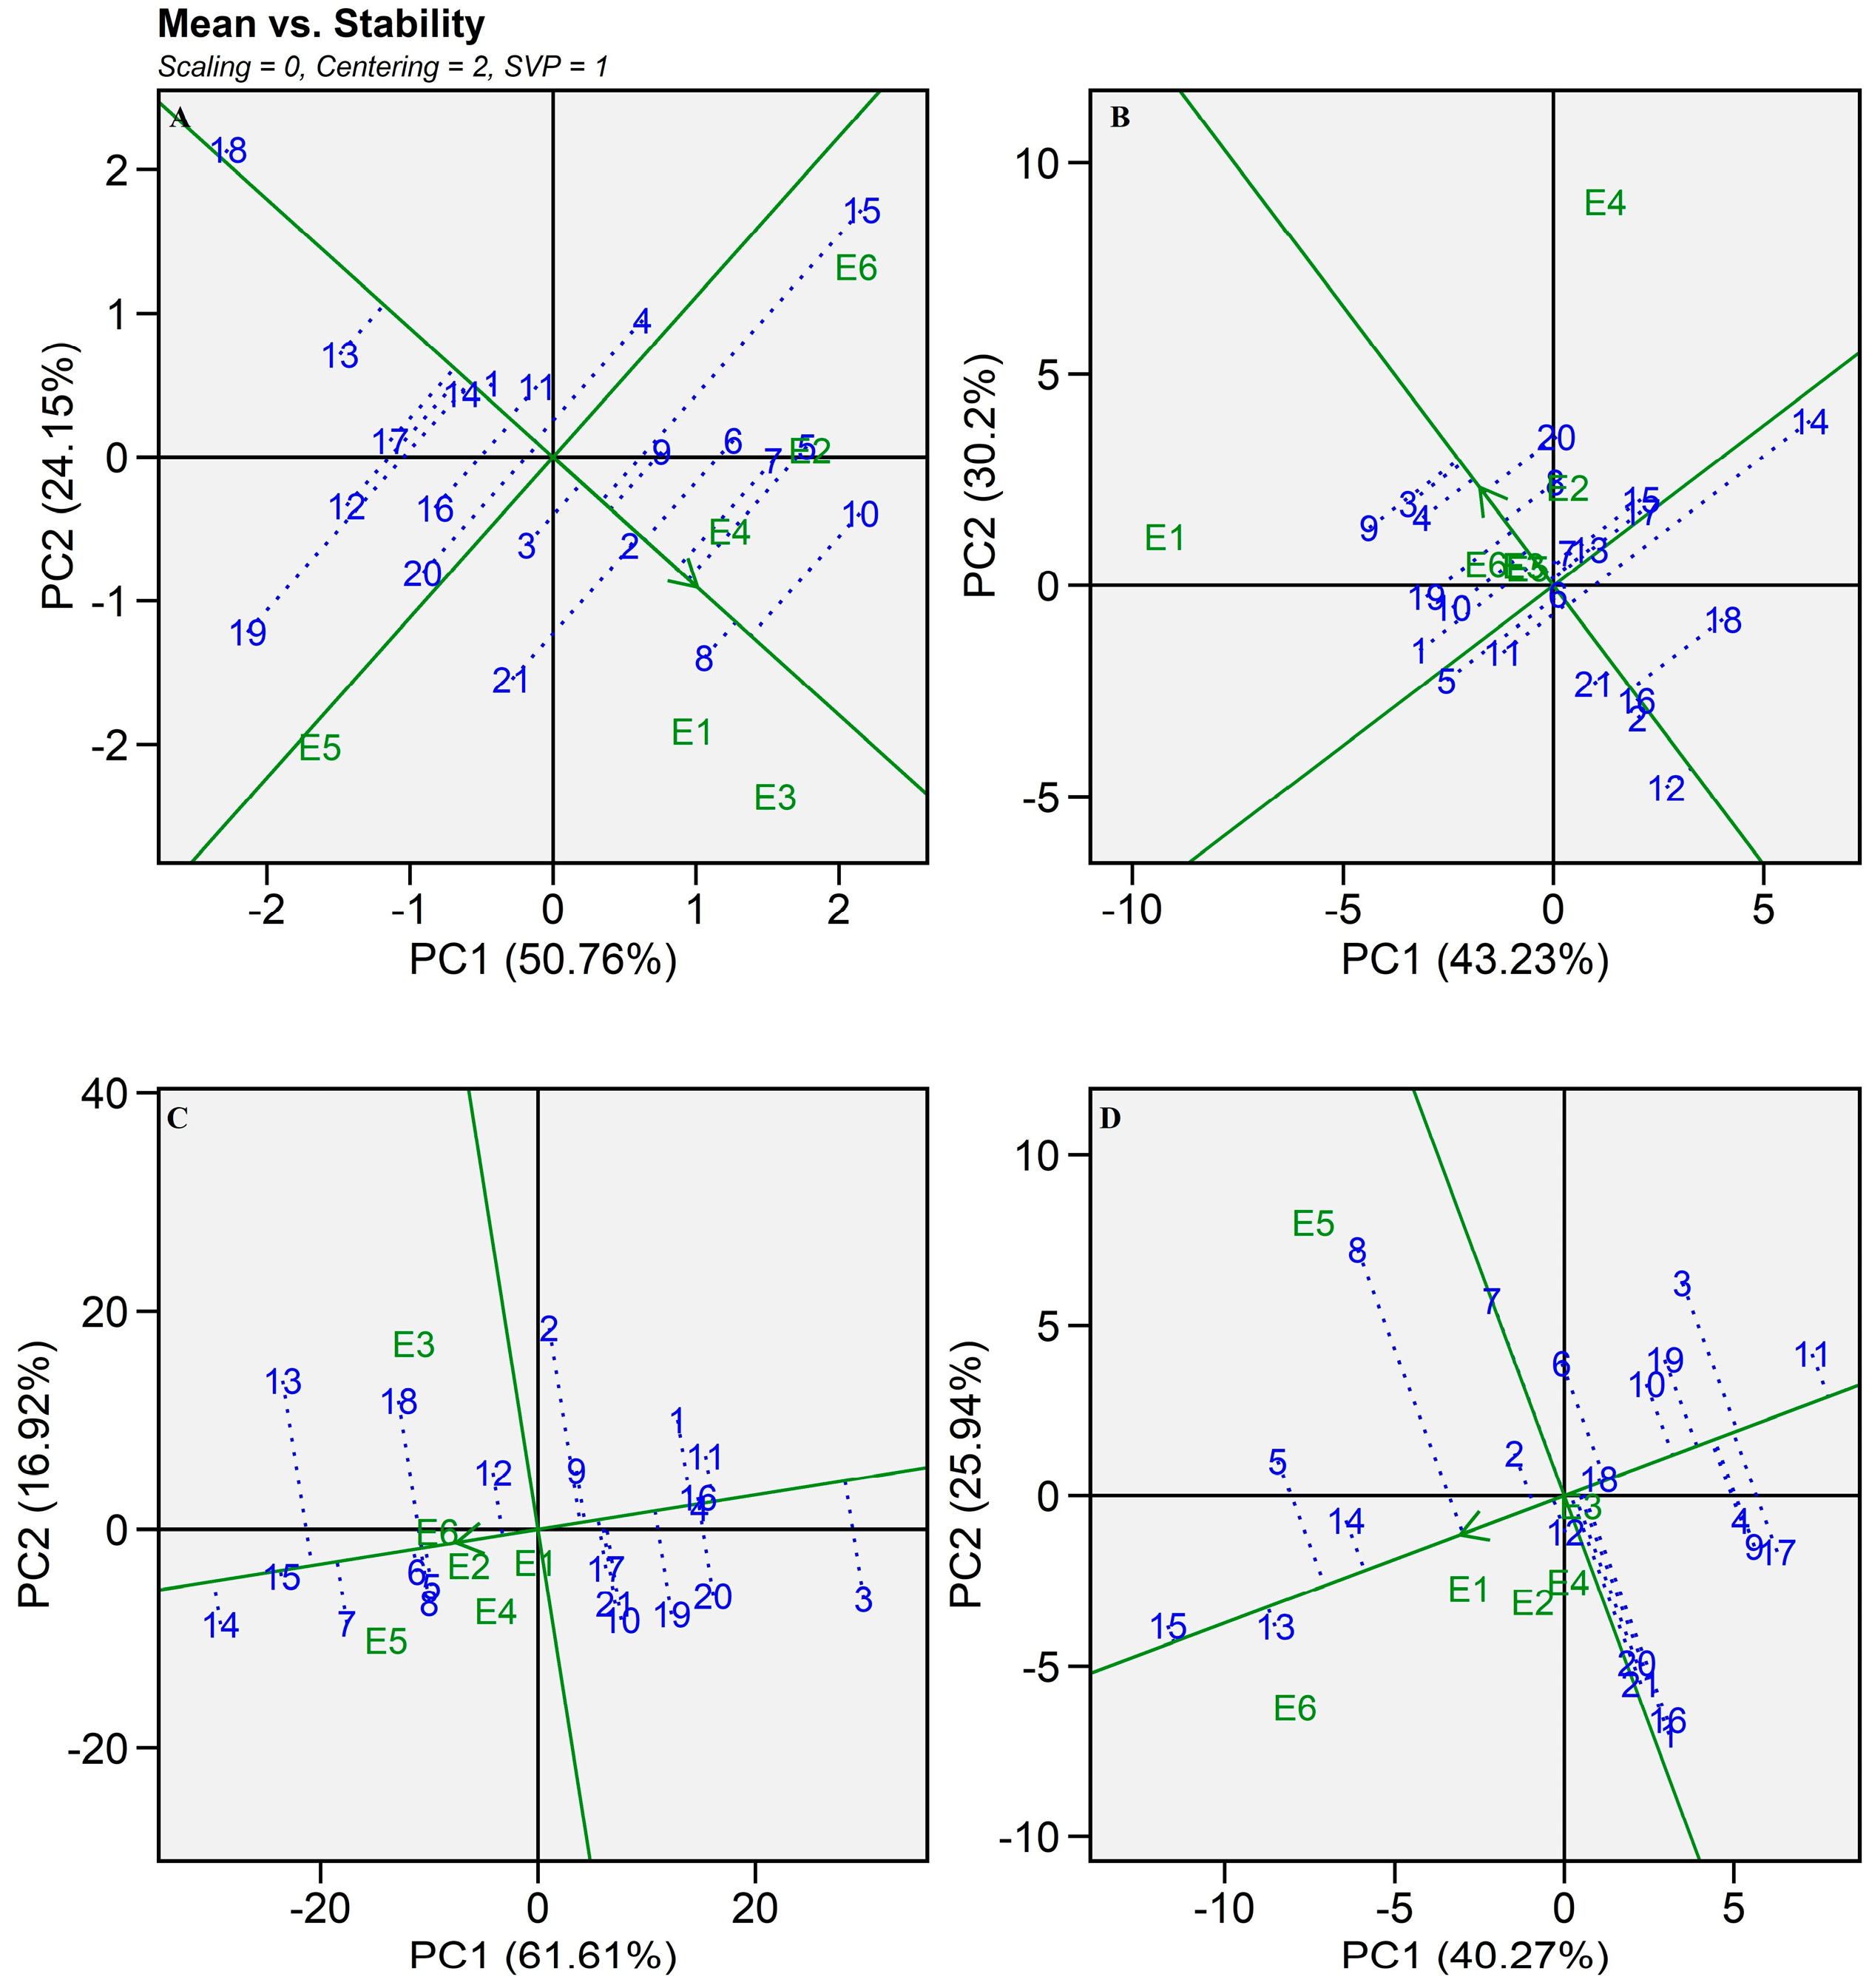
2.5.2. Mean Seed Yield vs. Stability
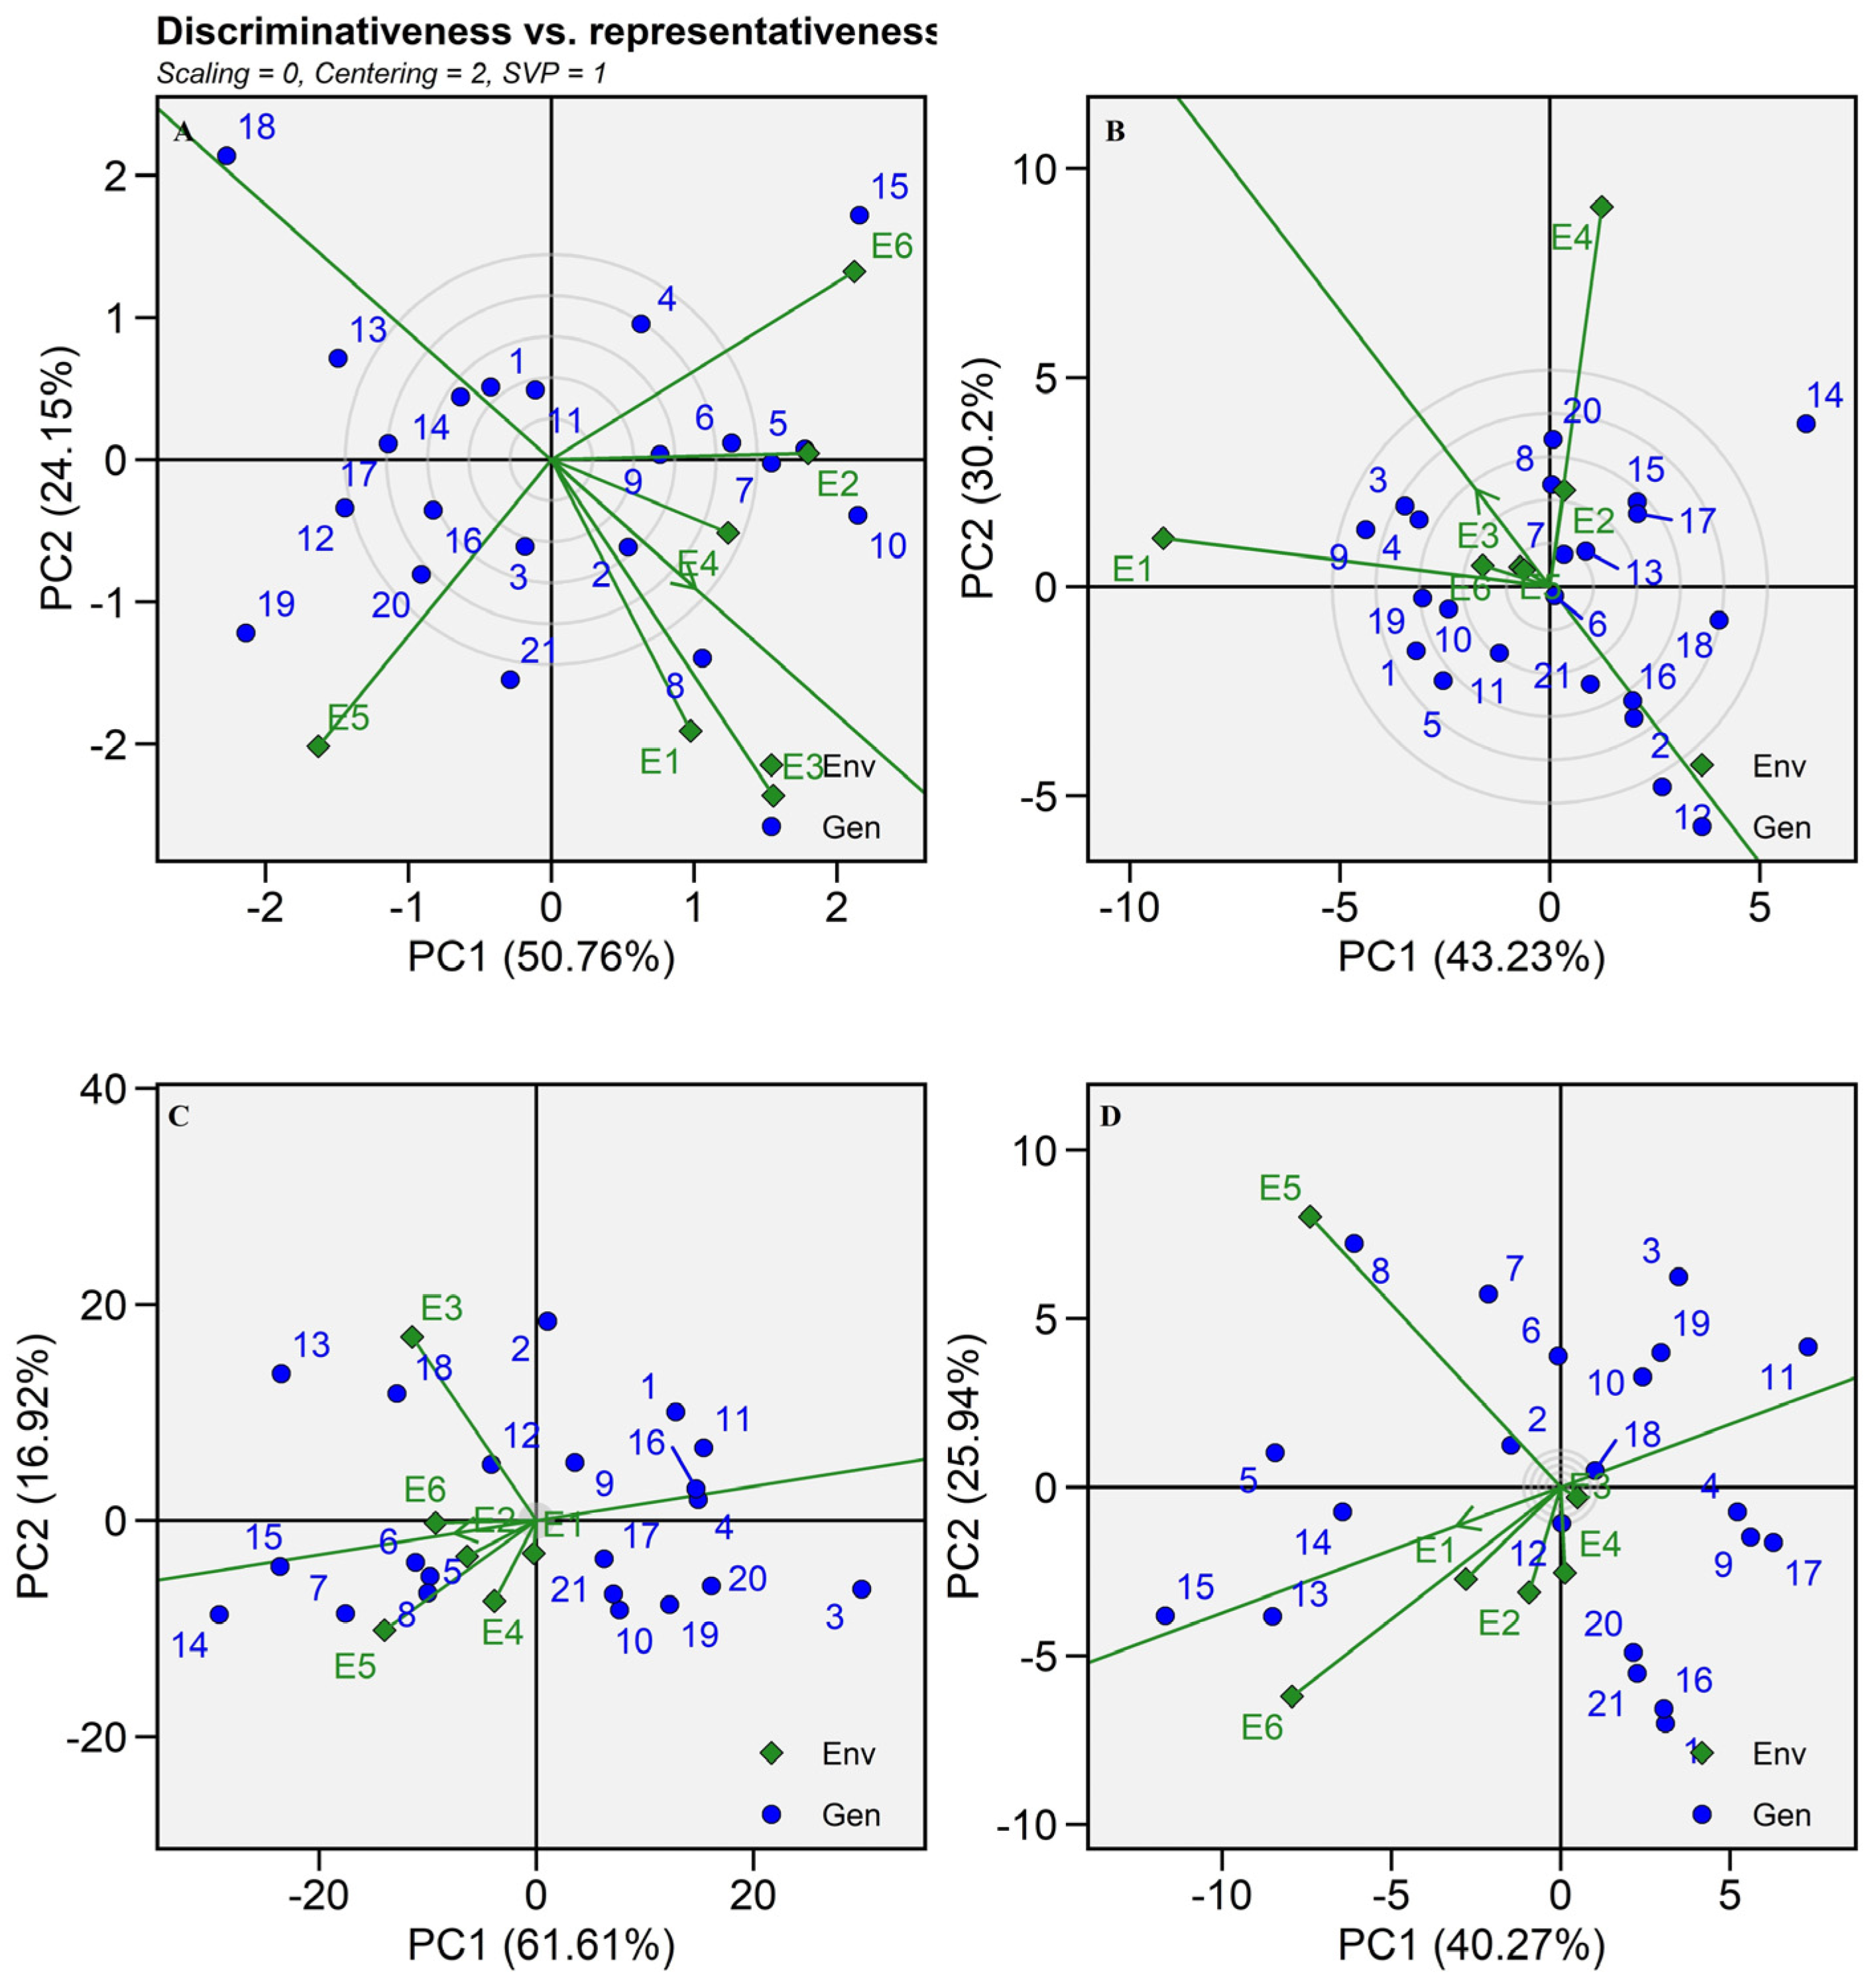
2.5.3. Discriminativeness vs. Representativeness
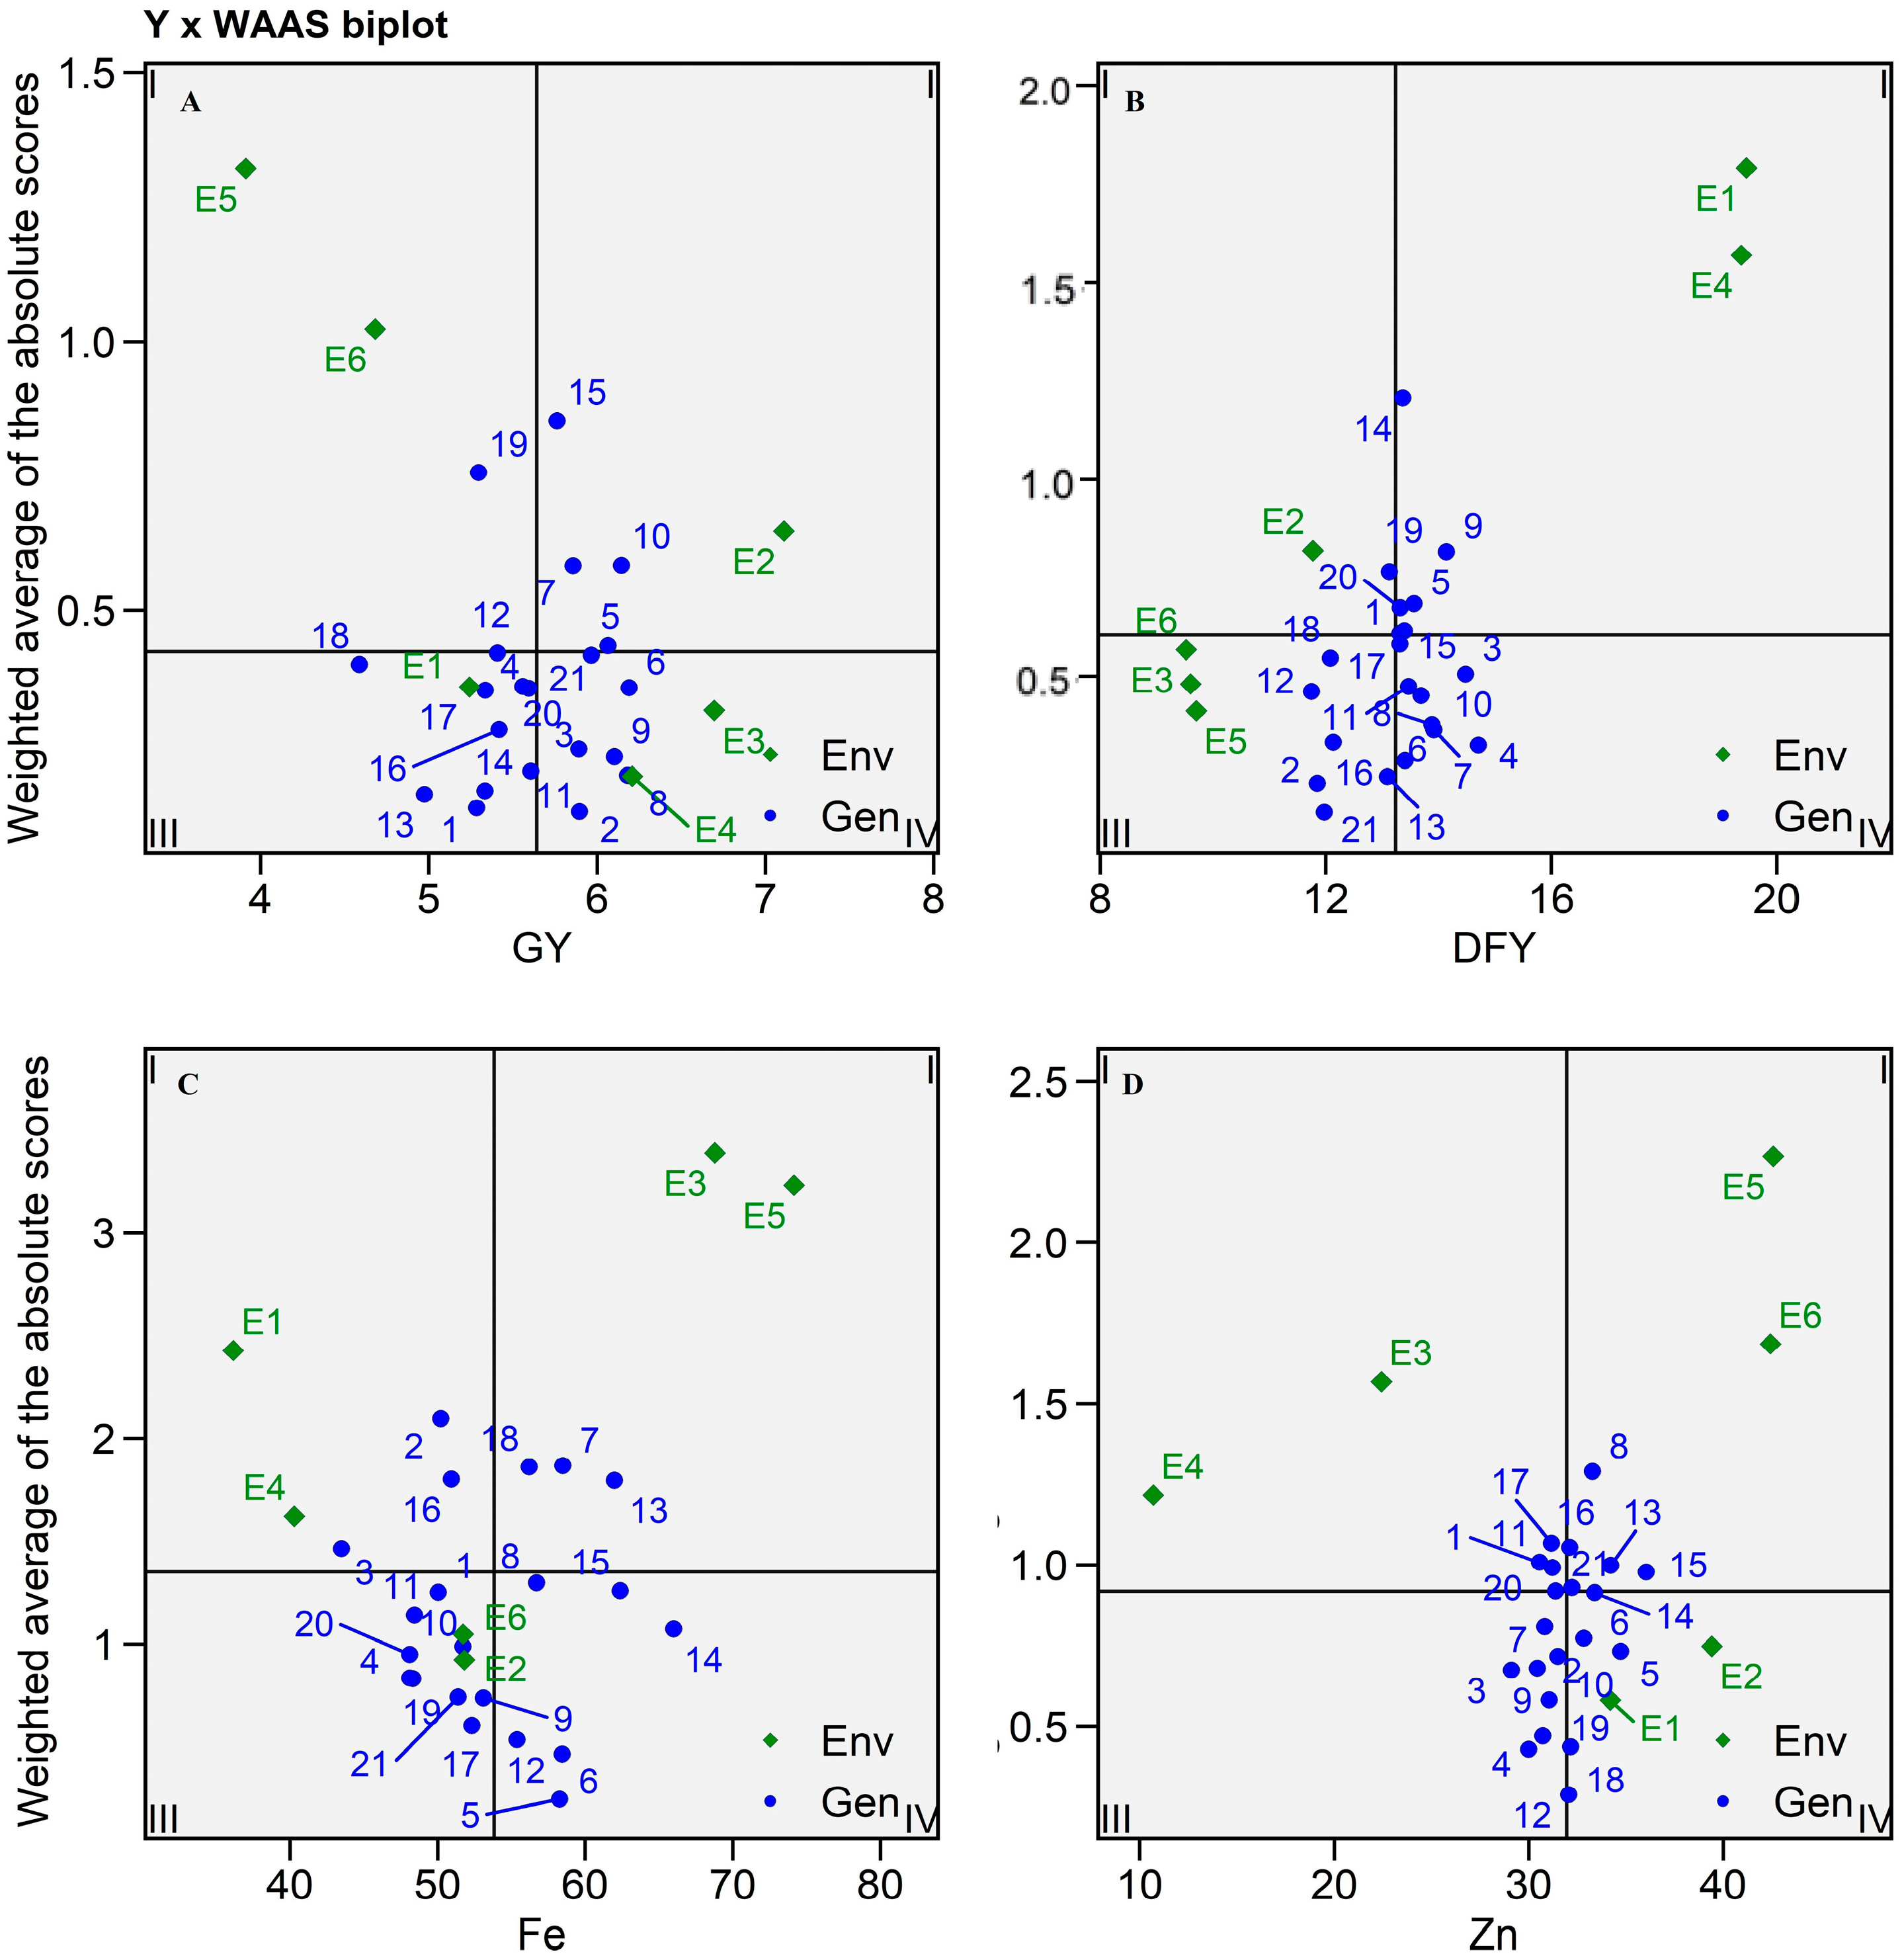
2.5.4. Y × WAAS Biplot
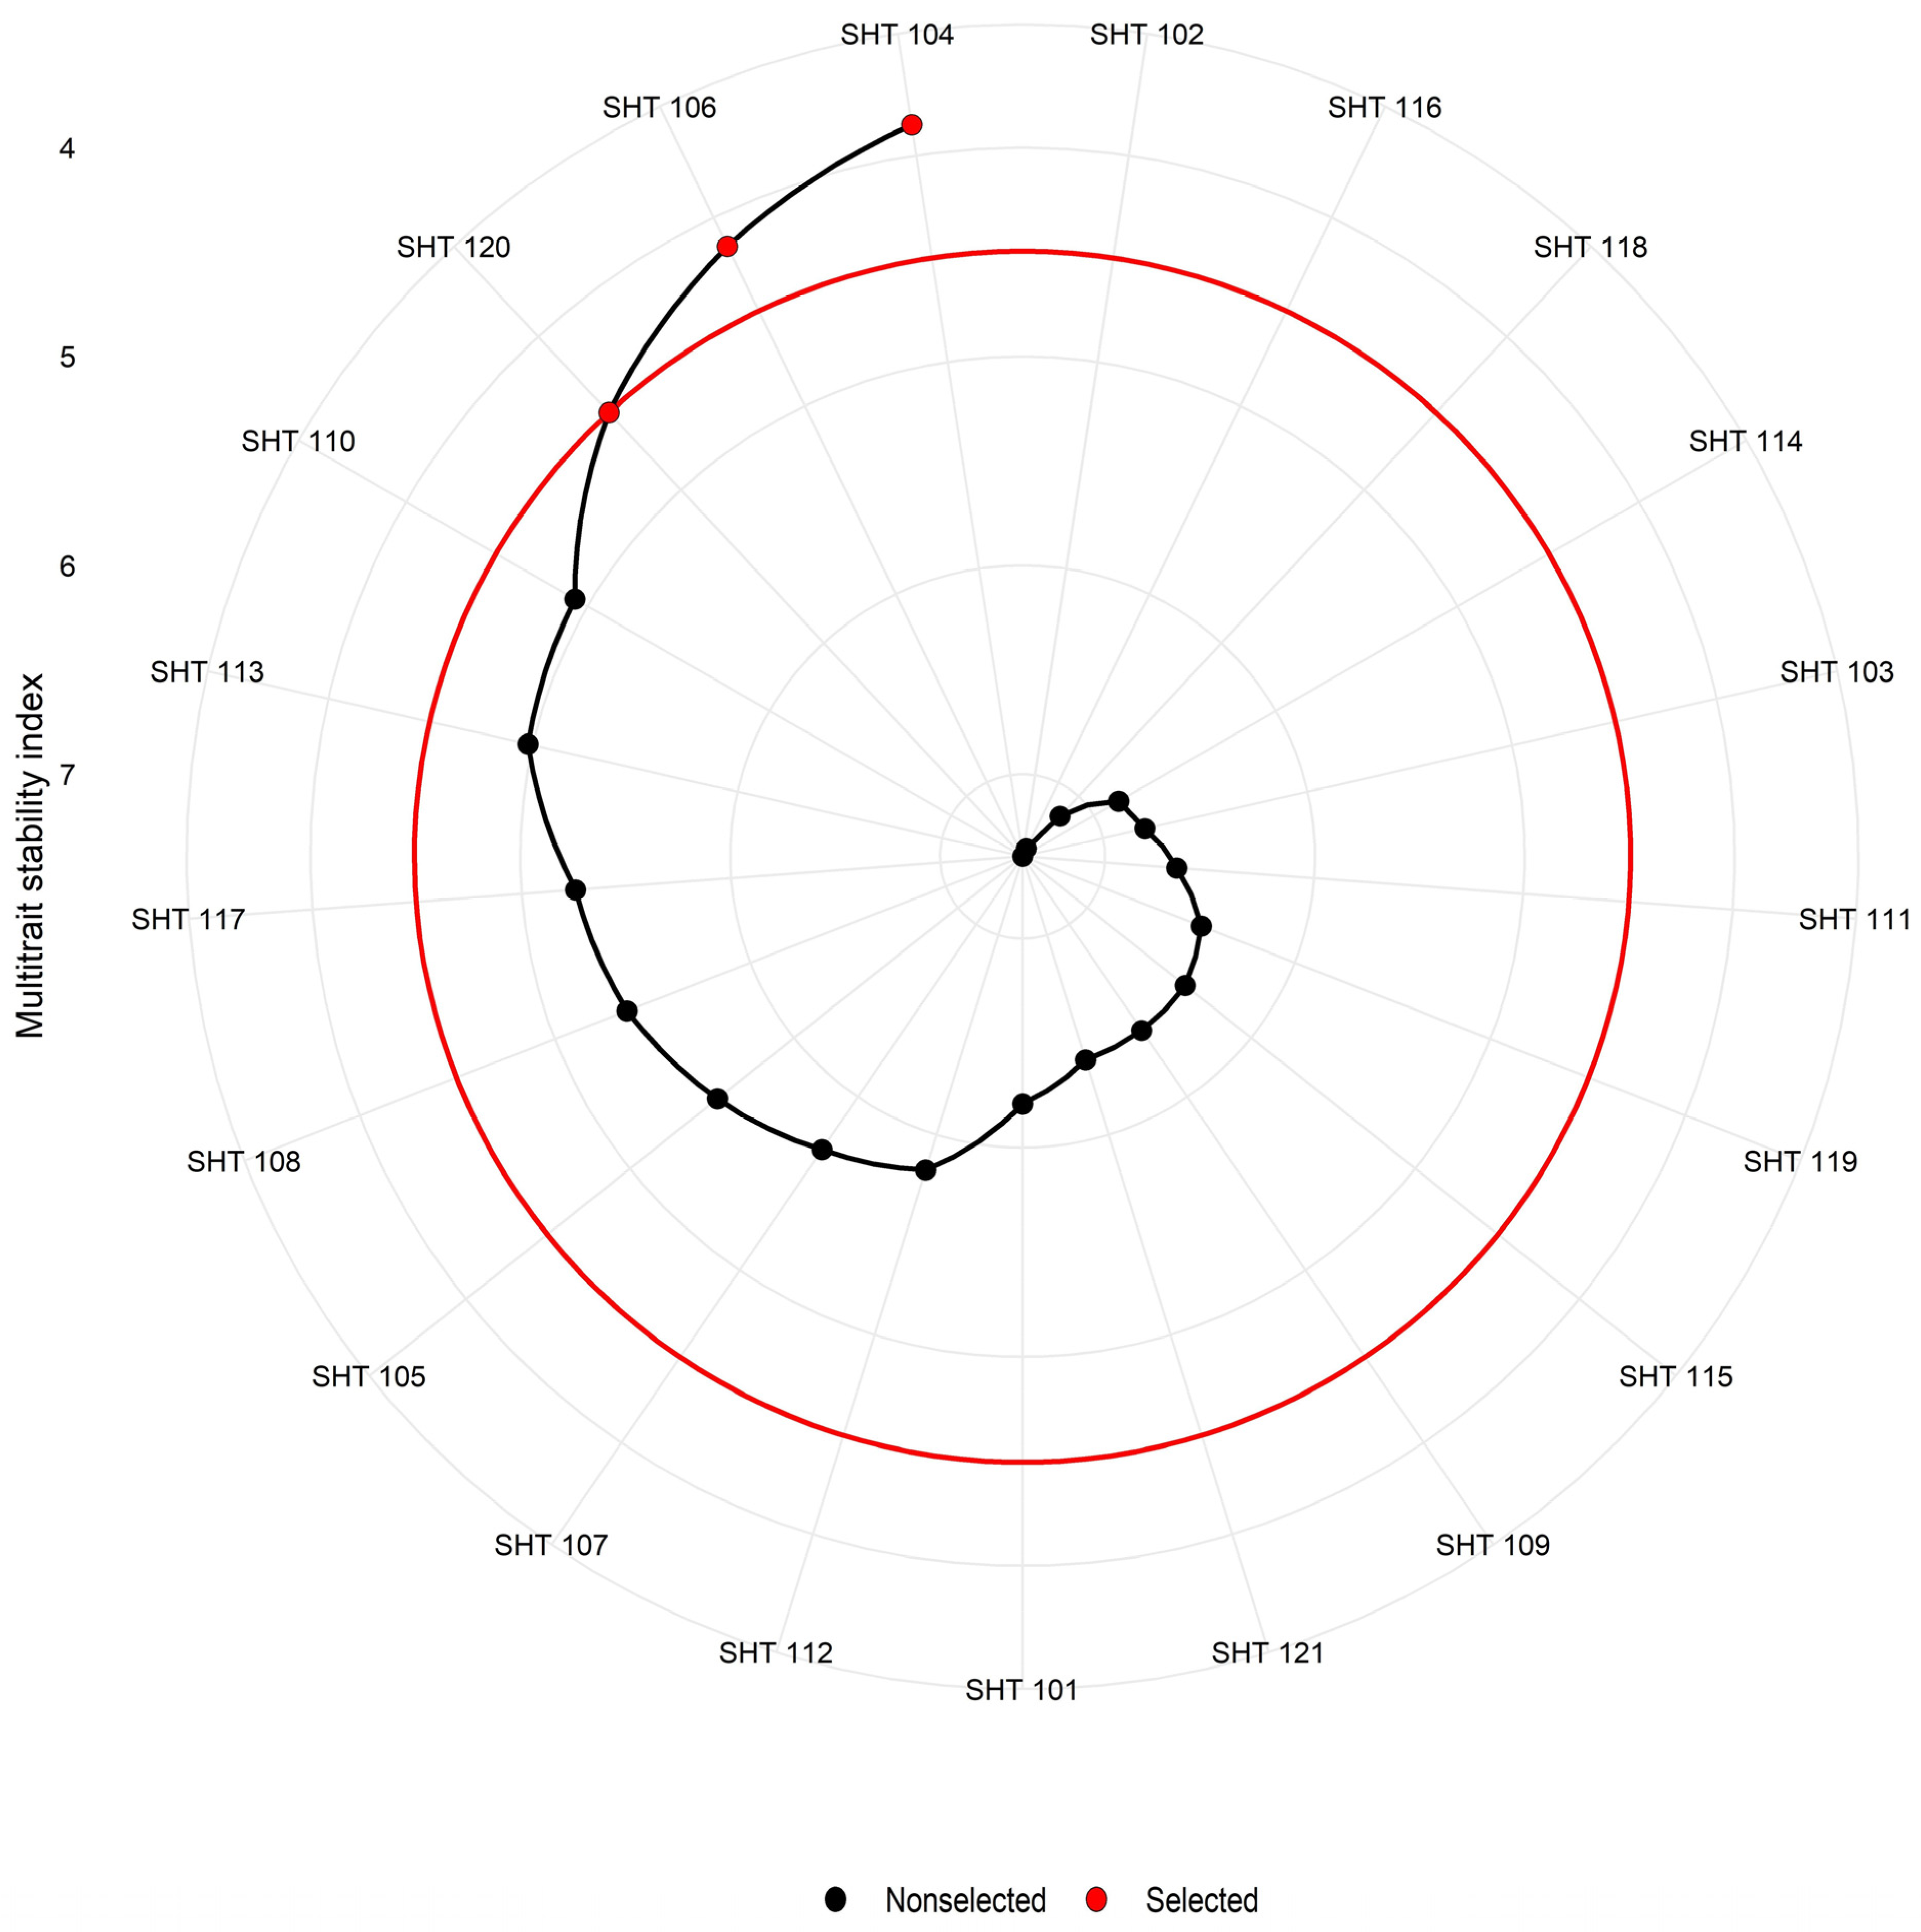
2.6. Multi-Trait Stability Index (MTSI)
3. Materials and Methods
3.1. Field Trials
3.2. Experimental Design and Package of Practices
3.3. Trait Phenotyping
3.4. Analysis of Variance
3.5. GEI Analysis
3.5.1. AMMI Analysis
3.5.2. GGE Biplots
3.6. Multi-Trait Stability Index (MTSI)
3.7. Statistical Packages
4. Conclusions
Supplementary Materials
Author Contributions
Funding
Data Availability Statement
Conflicts of Interest
References
- Kumar, S.; Hash, C.T.; Nepolean, T.; Mahendrakar, M.D.; Satyavathi, C.T.; Singh, G.; Srivastava, R.K. Mapping grain iron and zinc content quantitative trait loci in an iniadi-derived immortal population of pearl millet. Genes 2018, 9, 248. [Google Scholar] [CrossRef] [PubMed]
- Patel, R.; Memon, J.; Kumar, S.; Patel, D.A.; Sakure, A.A.; Patel, M.B.; Roychowdhury, R. Genetic Diversity and Population Structure of Maize (Zea mays L.) Inbred Lines in Association with Phenotypic and Grain Qualitative Traits Using SSR Genotyping. Plants 2024, 13, 823. [Google Scholar] [CrossRef] [PubMed]
- Slafer, G.A.; Otegui, M.E. Physiological Bases for Maize Improvement; CRC Press: Boca Raton, FL, USA, 2000; ISBN 156022889X. [Google Scholar]
- Khatri, A.B.; Patel, P.T.; Patel, R.; Patel, M.S.; Shah, S.K.; Patel, J.S.; Vaghela, P.O. Genetic analysis of grain biochemical parameters and yield in pearl millet [Pennisetum glaucum (L.) R. Br.]. J. Cereal Sci. 2023, 113, 103746. [Google Scholar] [CrossRef]
- Chauhan, M.; Sonawane, S.K.; Arya, S.S. Nutritional and nutraceutical properties of millets: A review. Clin. J. Nutr. Diet. 2018, 1, 1–10. [Google Scholar]
- Directorate of Millets Development. In Proceedings of the 55th Annual Group Meeting ICAR-AICRP on Pearl Millet, Jodhpur, Rajasthan, 29 April 2020.
- Burton, G.W. Factors Affecting Pollen Movement and Natural Crossing in Pearl Millet 1. Crop Sci. 1974, 14, 802–805. [Google Scholar] [CrossRef]
- Singh, S.P.; Satyavathi, C.T.; Sankar, S.M. Hybrid breeding in pearl millet: Past and present status. In New Paradigms in Heterosis Breeding: Conventional and Molecular Approaches; Division of Genetics: New Delhi, India, 2014. [Google Scholar]
- Memon, J.; Patel, R.; Parmar, D.J.; Kumar, S.; Patel, N.A.; Patel, B.N.; Patel, D.A.; Katba, P. Deployment of AMMI, GGE-biplot and MTSI to select elite genotypes of castor (Ricinus communis L.). Heliyon 2023, 9, e13515. [Google Scholar] [CrossRef]
- Yan, W.; Cornelius, P.L.; Crossa, J.; Hunt, L.A. Two types of GGE biplots for analyzing multi-environment trial data. Crop Sci. 2001, 41, 656–663. [Google Scholar] [CrossRef]
- Ding, M.; Tier, B.; Yan, W.K. Application of GGE biplot analysis to evaluate genotype (G), environment (E) and G×E interaction on P. radiata: Case study. In Proceedings of the Australasian Forest Genetics Conference, Hobart, Tasmania, Australia, 11–14 April 2007. [Google Scholar]
- Olivoto, T.; Lúcio, A.D.; da Silva, J.A.; Sari, B.G.; Diel, M.I. Mean performance and stability in multienvironment trials II: Selection based on multiple traits. J. Agron. 2019, 111, 2961–2969. [Google Scholar] [CrossRef]
- Gangashetty, P.I.; Yadav, C.B.; Riyazaddin, M.; Vermula, A.; Asungre, P.A.; Angarawai, I.; Yadav, R.S. Genotype-by-environment interactions for starch, mineral, and agronomic traits in pearl millet hybrids evaluated across five locations in West Africa. Front. Plant Sci. 2023, 14, 1171773. [Google Scholar] [CrossRef]
- Sodhaparmar, M.K.; Patel, M.S.; Gami, R.A.; Solanki, S.D.; Prajapati, N.N.; Visakh, R.L. Stability Analysis in Pearl Millet [Pennisetum glaucum (L.) R. Br.]. Front. Crop Improv. 2023, 11, 21–26. [Google Scholar]
- Sanjana Reddy, P.; Satyavathi, C.T.; Khandelwal, V.; Patil, H.T.; Gupta, P.C.; Sharma, L.D.; Mungra, K.D.; Singh, S.P.; Narasimhulu, R.; Tonapi, V.A.; et al. Performance and stability of pearl millet varieties for grain yield and micronutrients in arid and semi-arid regions of India. Front. Plant Sci. 2021, 12, 670201. [Google Scholar] [CrossRef] [PubMed]
- Asungre, P.A.; Akromah, R.; Kena, A.W.; Gangashetty, P. Genotype by Environment Interaction on Grain Yield Stability and Iron and Zinc Content in OPVs of Pearl Millet in Ghana Using the AMMI Method. Int. J. Agron. 2021, 2021, 9656653. [Google Scholar] [CrossRef]
- Ebdon, J.S.; Gauch, H.G., Jr. Additive main effect and multiplicative interaction analysis of national turfgrass performance trials: I. Interpretation of genotype × environment interaction. Crop Sci. 2002, 42, 489–496. [Google Scholar] [CrossRef]
- Kempton, R.A. The use of biplots in interpreting variety by environment interactions. J. Agric. Sci. 1984, 103, 123–135. [Google Scholar] [CrossRef]
- Shinde, G.C.; Bhingarde, M.T.; Mehetre, S.S. AMMI analysis for stability of grain yield of pearl millet (Pennisetum typhoides L.) hybrids. Int. J. Genet. 2002, 62, 215–217. [Google Scholar]
- Gabriel, K.R. Biplot display of multivariate matrices for inspection of data and diagnosis. In Interpreting Multivariate Data; Barnett, V., Ed.; Wiley: Chichester, UK, 1981; pp. 147–173. [Google Scholar]
- Pawar, Y.; Patil, H.T.; Patil, H.S. AMMI analysis for grain yield stability of pearl millet (Pennisetum glaucum L.) genotypes. Indian J. Genet. 2012, 72, 79–82. [Google Scholar]
- Singamsetti, A.; Zaidi, P.H.; Seetharam, K.; Vinayan, M.T.; Olivoto, T.; Mahato, A.; Shikha, K. Genetic gains in tropical maize hybrids across moisture regimes with multi-trait-based index selection. Front. Plant Sci. 2023, 14, 1147424. [Google Scholar] [CrossRef] [PubMed]
- Gower, J.C. Some distance properties of latent root and vector methods used in multivariate analysis. Biometrika 1966, 53, 325–338. [Google Scholar] [CrossRef]
- Aditi Rani, S.; Khandelwal, V.D.; Vaish, A. Proposed new stability indices using AMMI model and GGE BIPLOT approach to assess G×E interaction. Int. J. Stat. Appl. Math. 2023, 8, 111–117. [Google Scholar]
- Gauch, H.G., Jr.; Zobel, R.W. Identifying mega-environments and targeting genotypes. Crop Sci. 1997, 37, 311–326. [Google Scholar] [CrossRef]
- Patel, R.; Parmar, D.J.; Kumar, S.; Patel, D.A.; Memon, J.; Patel, M.B.; Patel, J.K. Dissection of genotype× environment interaction for green cob yield using AMMI and GGE biplot with MTSI for selection of elite genotype of sweet corn (Zea mays conva. Saccharata var. rugosa). Indian J. Genet. Plant Breed. 2023, 83, 59–68. [Google Scholar]
- Eberhart, S.A.; Russell, W.A. Stability parameters for comparing varieties. Crop Sci. 1966, 6, 36–40. [Google Scholar] [CrossRef]
- Alwala, S.; Kwolek, T.; McPherson, M.; Pellow, J.; Meyer, D. A comprehensive comparison between Eberhart and Russell joint regression and GGE biplot analyses to identify stable and high yielding maize hybrids. Field Crops Res. 2010, 119, 225–230. [Google Scholar] [CrossRef]
- Pratibha, Y.A.; Rahevar, P.; Patil, G.; Patel, K.; Kumar, S. Assessment of G× E interaction and stability parameters for quality, root yield and its associating traits in ashwagandha [Withania somnifera (L.) Dunal] germplasm lines. Ind. Crops Prod. 2024, 208, 117792. [Google Scholar] [CrossRef]
- Singamsetti, A.; Shahi, J.P.; Zaidi, P.H.; Seetharam, K.; Vinayan, M.T.; Kumar, M.; Singla, S.; Shikha, K.; Madankar, K. Genotype× environment interaction and selection of maize (Zea mays L.) hybrids across moisture regimes. Field Crops Res. 2021, 270, 108224. [Google Scholar] [CrossRef]
- Koundinya, A.V.V.; Ajeesh, B.R.; Hegde, V.; Sheela, M.N.; Mohan, C.; Asha, K.I. Genetic parameters, stability and selection of cassava genotypes between rainy and water stress conditions using AMMI, WAAS, BLUP and MTSI. Sci. Hortic. 2021, 281, 109949. [Google Scholar] [CrossRef]
- Yue, H.; Jiang, X.; Wei, J.; Xie, J.; Chen, S.; Peng, H.; Bu, J. A study on genotype× environment interactions for the multiple traits of maize hybrids in China. Agron. J. 2021, 113, 4889–4899. [Google Scholar] [CrossRef]
- Yadav, C.B.; Gangashetty, P.I.; Beckmann, M.; Mur, L.A.; Yadav, R.S. Genotype-by-Environment Interaction Analysis of Metabolites in Pearl Millet Genotypes with High Concentrations of Slowly Digestible and Resistant Starch in Their Grains. Cells 2022, 11, 3109. [Google Scholar] [CrossRef] [PubMed]
- Patanè, C.; Saita, A.; Sortino, O. Comparative effects of salt and water stress on seed germination and early embryo growth in two cultivars of sweet sorghum. J. Agron. Crop Sci. 2013, 199, 30–37. [Google Scholar] [CrossRef]
- Murillo-Amador, B.; López-Aguilar, R.; Kaya, C.; Larrinaga-Mayoral, J.; Flores-Hernández, A. Comparative effects of NaCl and polyethylene glycol on germination, emergence and seedling growth of cowpea. J. Agron. Crop Sci. 2002, 188, 235–247. [Google Scholar] [CrossRef]
- Patro, T.S.S.K.; Anuradha, N.; Singamsetti, A.; Rani, Y.S.; Triveni, U. Simultaneous selection for stable disease resistant and high yielding groundnut genotypes under high rainfall area. Intl. J. Agric. Biol. 2022, 28, 85–92. [Google Scholar]
- Bradu, D.; Gabriel, K.R. The biplot as a diagnostic tool for models of two-way tables. Technometrics 1978, 20, 47–68. [Google Scholar] [CrossRef]
- Farshadfar, E. Incorporation of AMMI stability value and grain yield in a single non-parametric index (GSI) in bread wheat. Pak. J. Biol. Sci. 2008, 11, 1791. [Google Scholar] [CrossRef] [PubMed]
- Atta, B.M.; Shah, T.M.; Abbas, G.; Haq, M.A. Genotype x environment interaction for seed yield in kabuli chickpea (Cicer arietinum L.) genotypes developed through mutation breeding. Pak. J. Bot. 2009, 41, 1883–1890. [Google Scholar]
- Yan, W. Singular-value partitioning in biplot analysis of multi-environment trial data. Agron. J. 2002, 94, 990–996. [Google Scholar] [CrossRef]
- Zobel, R.W.; Wright, M.J.; Gauch, H.G., Jr. Statistical analysis of a yield trial. J. Agron. 1988, 80, 388–393. [Google Scholar] [CrossRef]
- Yan, W.; Kang, M.S. GGE Biplot Analysis: A Graphical Tool for Breeders, Geneticists, and Agronomists; CRC Press: Boca Raton, FL, USA, 2002. [Google Scholar]
- RStudio Team. RStudio: Integrated Development for R; RStudio, PBC: Boston, MA, USA, 2020; Available online: http://www.rstudio.com/ (accessed on 10 February 2024).
- Olivoto, T.; Lúcio, A.D.C. metan: An R package for multi-environment trial analysis. Methods Ecol. Evol. 2020, 11, 783–789. [Google Scholar] [CrossRef]


| Source of Variation | Environment (E) (df: 5) | Genotype (G) (df: 20) | GEI (df: 100) | Residual (df: 240) | CV (%) | Mean over Environments | |||
|---|---|---|---|---|---|---|---|---|---|
| Trait | Mean Squares | % (G + E + GEI) | Mean Squares | % (G + E + GEI) | Mean Squares | % (G + E + GEI) | Mean Squares | ||
| DF | 1719.09 ** | 74.88 | 78.24 ** | 13.63 | 13.18 ** | 11.48 | 1.96 | 2.52 | 55.49 |
| DM | 3062.49 ** | 86.56 | 58.86 ** | 6.66 | 11.99 ** | 6.78 | 1.62 | 1.46 | 87.42 |
| PH | 27,729.09 ** | 69.32 | 1656.50 ** | 16.56 | 282.34 ** | 14.12 | 48.01 | 3.59 | 193.04 |
| PTPP | 27.35 ** | 80.31 | 0.47 ** | 5.6 | 0.24 | 14.09 | 0.21 | 21.48 | 2.17 |
| PL | 87.49 ** | 19.47 | 54.80 ** | 48.79 | 7.12 ** | 31.73 | 1.20 | 4.06 | 26.92 |
| PD | 1.92 ** | 32.65 | 0.57 ** | 38.8 | 0.08 ** | 28.54 | 0.02 | 4.45 | 3.27 |
| TSW | 348.59 ** | 86.64 | 6.93 ** | 6.89 | 1.30 ** | 6.47 | 0.22 | 4.84 | 9.71 |
| PP | 121,726.20 ** | 96.04 | 264.28 | 0.83 | 198.29 | 3.13 | 173.38 | 7.18 | 183.26 |
| SS% | 12,733.15 ** | 49.54 | 1638.85 ** | 25.5 | 320.76 ** | 24.96 | 85.02 | 12.22 | 75.36 |
| GY | 96.51 ** | 69.19 | 3.27 ** | 9.39 | 1.49 ** | 21.42 | 0.34 | 10.40 | 5.64 |
| DFY | 1486.61 ** | 87.51 | 12.79 ** | 3.01 | 8.05 ** | 9.48 | 1.14 | 8.07 | 13.24 |
| Fe | 14,388.46 ** | 74.38 | 582.83 ** | 12.05 | 131.30 ** | 13.57 | 48.87 | 12.99 | 53.80 |
| Zn | 10,402.73 ** | 92.41 | 50.18 ** | 1.78 | 32.67 ** | 5.81 | 15.22 | 12.21 | 31.93 |
| Source of Variation | PC1 (df: 24) | PC2 (df: 22) | PC3 (df: 20) | PC4 (df: 18) | PC5 (df: 16) | |||||
|---|---|---|---|---|---|---|---|---|---|---|
| Trait | Mean Square | Contribution (%) | Mean Square | Contribution (%) | Mean Square | Contribution (%) | Mean Square | Contribution (%) | Mean Square | Contribution (%) |
| DF | 28.49 ** | 51.90 | 15.84 ** | 26.40 | 8.53 ** | 13.00 | 3.92 * | 5.40 | 2.76 | 3.40 |
| DM | 23.25 ** | 46.50 | 14.92 ** | 27.40 | 7.91 ** | 13.20 | 5.33 ** | 8.00 | 3.67 ** | 4.90 |
| PH | 482.53 ** | 41.00 | 314.55 ** | 24.50 | 294.52 ** | 20.90 | 128.43 ** | 8.20 | 95.69 * | 5.40 |
| PL | 9.83 ** | 33.10 | 9.32 ** | 28.80 | 7.40 ** | 20.80 | 4.85 ** | 12.30 | 2.25 * | 5.10 |
| PD | 0.13 ** | 39.00 | 0.10 ** | 28.30 | 0.07 ** | 17.90 | 0.04 ** | 9.60 | 0.02 | 5.20 |
| TSW | 2.43 ** | 45.00 | 1.66 ** | 28.20 | 0.82 ** | 12.70 | 0.68 ** | 9.40 | 0.38 * | 4.70 |
| SS% | 694.38 ** | 52.00 | 316.93 ** | 21.70 | 258.18 ** | 16.10 | 135.73 | 7.60 | 51.99 | 2.60 |
| GY | 3.43 ** | 55.10 | 1.48 ** | 21.90 | 1.01 ** | 13.60 | 0.52 | 6.30 | 0.29 | 3.10 |
| DFY | 17.42 ** | 51.90 | 9.96 ** | 27.20 | 3.50 ** | 8.70 | 3.18 ** | 7.10 | 2.53 ** | 5.00 |
| Fe | 244.57 ** | 44.70 | 179.59 ** | 30.10 | 97.33 ** | 14.80 | 52.27 | 7.20 | 26.34 | 3.20 |
| Zn | 52.37 ** | 38.50 | 42.05 ** | 28.30 | 28.68 * | 17.60 | 24.24 | 13.40 | 4.71 | 2.30 |
| Hybrid | Mean over Environment | PC1 | PC2 | PC3 | PC4 | PC5 | WAAS |
|---|---|---|---|---|---|---|---|
| SHT 101 | 5.285 | 0.068 | 0.128 | −0.394 | −0.496 | −0.562 | 0.132 |
| SHT 102 | 5.897 | 0.034 | 0.315 | 0.187 | −0.028 | 0.084 | 0.125 |
| SHT 103 | 5.893 | −0.309 | −0.192 | 0.049 | 0.336 | −0.352 | 0.242 |
| SHT 104 | 5.559 | 0.472 | −0.158 | −0.217 | −0.339 | −0.089 | 0.358 |
| SHT 105 | 6.065 | 0.611 | 0.099 | −0.259 | 0.404 | 0.153 | 0.434 |
| SHT 106 | 6.192 | 0.310 | −0.447 | 0.393 | 0.144 | −0.071 | 0.356 |
| SHT 107 | 5.859 | 0.609 | 0.582 | 0.483 | −0.072 | −0.039 | 0.583 |
| SHT 108 | 6.182 | 0.022 | 0.702 | 0.068 | −0.290 | 0.267 | 0.193 |
| SHT 109 | 6.103 | 0.113 | −0.501 | −0.251 | −0.263 | 0.258 | 0.228 |
| SHT 110 | 6.146 | 0.685 | 0.611 | 0.128 | 0.101 | 0.016 | 0.584 |
| SHT 111 | 5.606 | 0.029 | −0.433 | −0.522 | 0.060 | 0.006 | 0.201 |
| SHT 112 | 5.408 | −0.605 | −0.211 | −0.009 | 0.377 | 0.069 | 0.421 |
| SHT 113 | 4.974 | −0.239 | −0.045 | −0.005 | −0.491 | −0.164 | 0.157 |
| SHT 114 | 5.335 | −0.077 | −0.143 | 0.551 | 0.407 | 0.118 | 0.164 |
| SHT 115 | 5.764 | 1.178 | −0.320 | −0.388 | 0.130 | 0.191 | 0.852 |
| SHT 116 | 5.419 | −0.322 | 0.155 | −0.298 | 0.419 | −0.229 | 0.278 |
| SHT 117 | 5.337 | −0.352 | −0.087 | 0.771 | −0.300 | 0.127 | 0.351 |
| SHT 118 | 4.589 | −0.211 | −0.901 | 0.353 | −0.236 | 0.075 | 0.399 |
| SHT 119 | 5.296 | −0.984 | 0.324 | −0.527 | −0.115 | 0.600 | 0.756 |
| SHT 120 | 5.595 | −0.512 | 0.166 | −0.021 | 0.058 | −0.231 | 0.355 |
| SHT 121 | 5.966 | −0.520 | 0.355 | −0.092 | 0.191 | −0.230 | 0.416 |
| E1 | 5.242 | −0.185 | 0.769 | −0.393 | −0.625 | 0.677 | 0.357 |
| E2 | 7.110 | 0.675 | −0.132 | 1.365 | 0.003 | 0.175 | 0.647 |
| E3 | 6.695 | 0.055 | 1.038 | −0.195 | 0.895 | −0.221 | 0.313 |
| E4 | 6.208 | 0.245 | 0.082 | −0.150 | −0.695 | −0.819 | 0.192 |
| E5 | 3.912 | −1.874 | −0.696 | 0.090 | 0.153 | −0.006 | 1.321 |
| E6 | 4.681 | 1.084 | −1.061 | −0.717 | 0.269 | 0.193 | 1.023 |
| Traits | FA1 | FA2 | FA3 | FA4 | Communality | Uniqueness |
|---|---|---|---|---|---|---|
| DF | −0.888 | −0.007 | 0.152 | 0.039 | 0.813 | 0.187 |
| DM | −0.952 | 0.164 | −0.001 | 0.007 | 0.933 | 0.067 |
| PH | −0.401 | −0.481 | 0.001 | −0.563 | 0.709 | 0.291 |
| PL | −0.229 | −0.682 | 0.131 | −0.033 | 0.536 | 0.464 |
| PD | 0.099 | −0.011 | −0.098 | −0.840 | 0.725 | 0.275 |
| TSW | −0.154 | −0.043 | −0.903 | −0.130 | 0.857 | 0.143 |
| SS% | 0.161 | −0.749 | 0.155 | −0.331 | 0.721 | 0.279 |
| GY | −0.385 | −0.283 | 0.584 | −0.156 | 0.593 | 0.407 |
| DFY | −0.721 | −0.286 | −0.099 | −0.440 | 0.804 | 0.196 |
| Fe | 0.369 | −0.716 | −0.398 | 0.216 | 0.855 | 0.145 |
| Zn | 0.300 | 0.114 | −0.544 | 0.701 | 0.891 | 0.109 |
| Eigen value | 3.61 | 2.16 | 1.53 | 1.13 | 0.767 a | |
| Variance (%) | 32.81 | 19.63 | 13.92 | 10.32 | ||
| Accumulated (%) | 32.81 | 52.45 | 66.37 | 76.69 |
| Traits | Factor | Mean Performance | WAASBY | ||||
|---|---|---|---|---|---|---|---|
| Overall (Xo) | Selected Genotype (Xs) | SD (%) | Overall (X0) | Selected Genotype (Xs) | SD (%) | ||
| DF | FA 1 | 55.492 | 54.333 | −1.159 | 0.498 | 0.297 | −0.202 |
| DM | FA 1 | 87.423 | 86.444 | −0.979 | 0.532 | 0.295 | −0.237 |
| DFY | FA 1 | 13.239 | 13.812 | 0.573 | 0.495 | 0.436 | −0.059 |
| PL | FA 2 | 26.96 | 27.556 | 0.595 | 0.458 | 0.489 | 0.03 |
| SS% | FA 2 | 75.399 | 76.852 | 1.452 | 1.099 | 1.054 | −0.045 |
| Fe | FA 2 | 53.82 | 51.556 | −2.265 | 0.882 | 0.581 | −0.301 |
| TSW | FA 3 | 9.706 | 10.346 | 0.64 | 0.304 | 0.169 | −0.134 |
| GY | FA 3 | 5.641 | 5.782 | 0.14 | 0.312 | 0.298 | −0.014 |
| PH | FA 4 | 193.042 | 195.648 | 2.606 | 1.073 | 0.461 | −0.612 |
| PD | FA 4 | 3.269 | 3.183 | −0.086 | 0.138 | 0.108 | −0.030 |
| Zn | FA 4 | 31.955 | 31.407 | −0.548 | 0.559 | 0.463 | −0.097 |
Disclaimer/Publisher’s Note: The statements, opinions and data contained in all publications are solely those of the individual author(s) and contributor(s) and not of MDPI and/or the editor(s). MDPI and/or the editor(s) disclaim responsibility for any injury to people or property resulting from any ideas, methods, instructions or products referred to in the content. |
© 2024 by the authors. Licensee MDPI, Basel, Switzerland. This article is an open access article distributed under the terms and conditions of the Creative Commons Attribution (CC BY) license (https://creativecommons.org/licenses/by/4.0/).
Share and Cite
Khandelwal, V.; Patel, R.; Choudhary, K.B.; Pawar, S.B.; Patel, M.S.; Iyanar, K.; Mungra, K.D.; Kumar, S.; Satyavathi, C.T. Stability Analysis and Identification of Superior Hybrids in Pearl Millet [Pennisetum glaucum (L.) R. Br.] Using the Multi Trait Stability Index. Plants 2024, 13, 1101. https://doi.org/10.3390/plants13081101
Khandelwal V, Patel R, Choudhary KB, Pawar SB, Patel MS, Iyanar K, Mungra KD, Kumar S, Satyavathi CT. Stability Analysis and Identification of Superior Hybrids in Pearl Millet [Pennisetum glaucum (L.) R. Br.] Using the Multi Trait Stability Index. Plants. 2024; 13(8):1101. https://doi.org/10.3390/plants13081101
Chicago/Turabian StyleKhandelwal, Vikas, Rumit Patel, Khushwant B. Choudhary, S. B. Pawar, M. S. Patel, K. Iyanar, K. D. Mungra, Sushil Kumar, and C. Tara Satyavathi. 2024. "Stability Analysis and Identification of Superior Hybrids in Pearl Millet [Pennisetum glaucum (L.) R. Br.] Using the Multi Trait Stability Index" Plants 13, no. 8: 1101. https://doi.org/10.3390/plants13081101