
Understanding the Saffron Corm Development—Insights into Histological and Metabolic Aspects

 , , , , , and
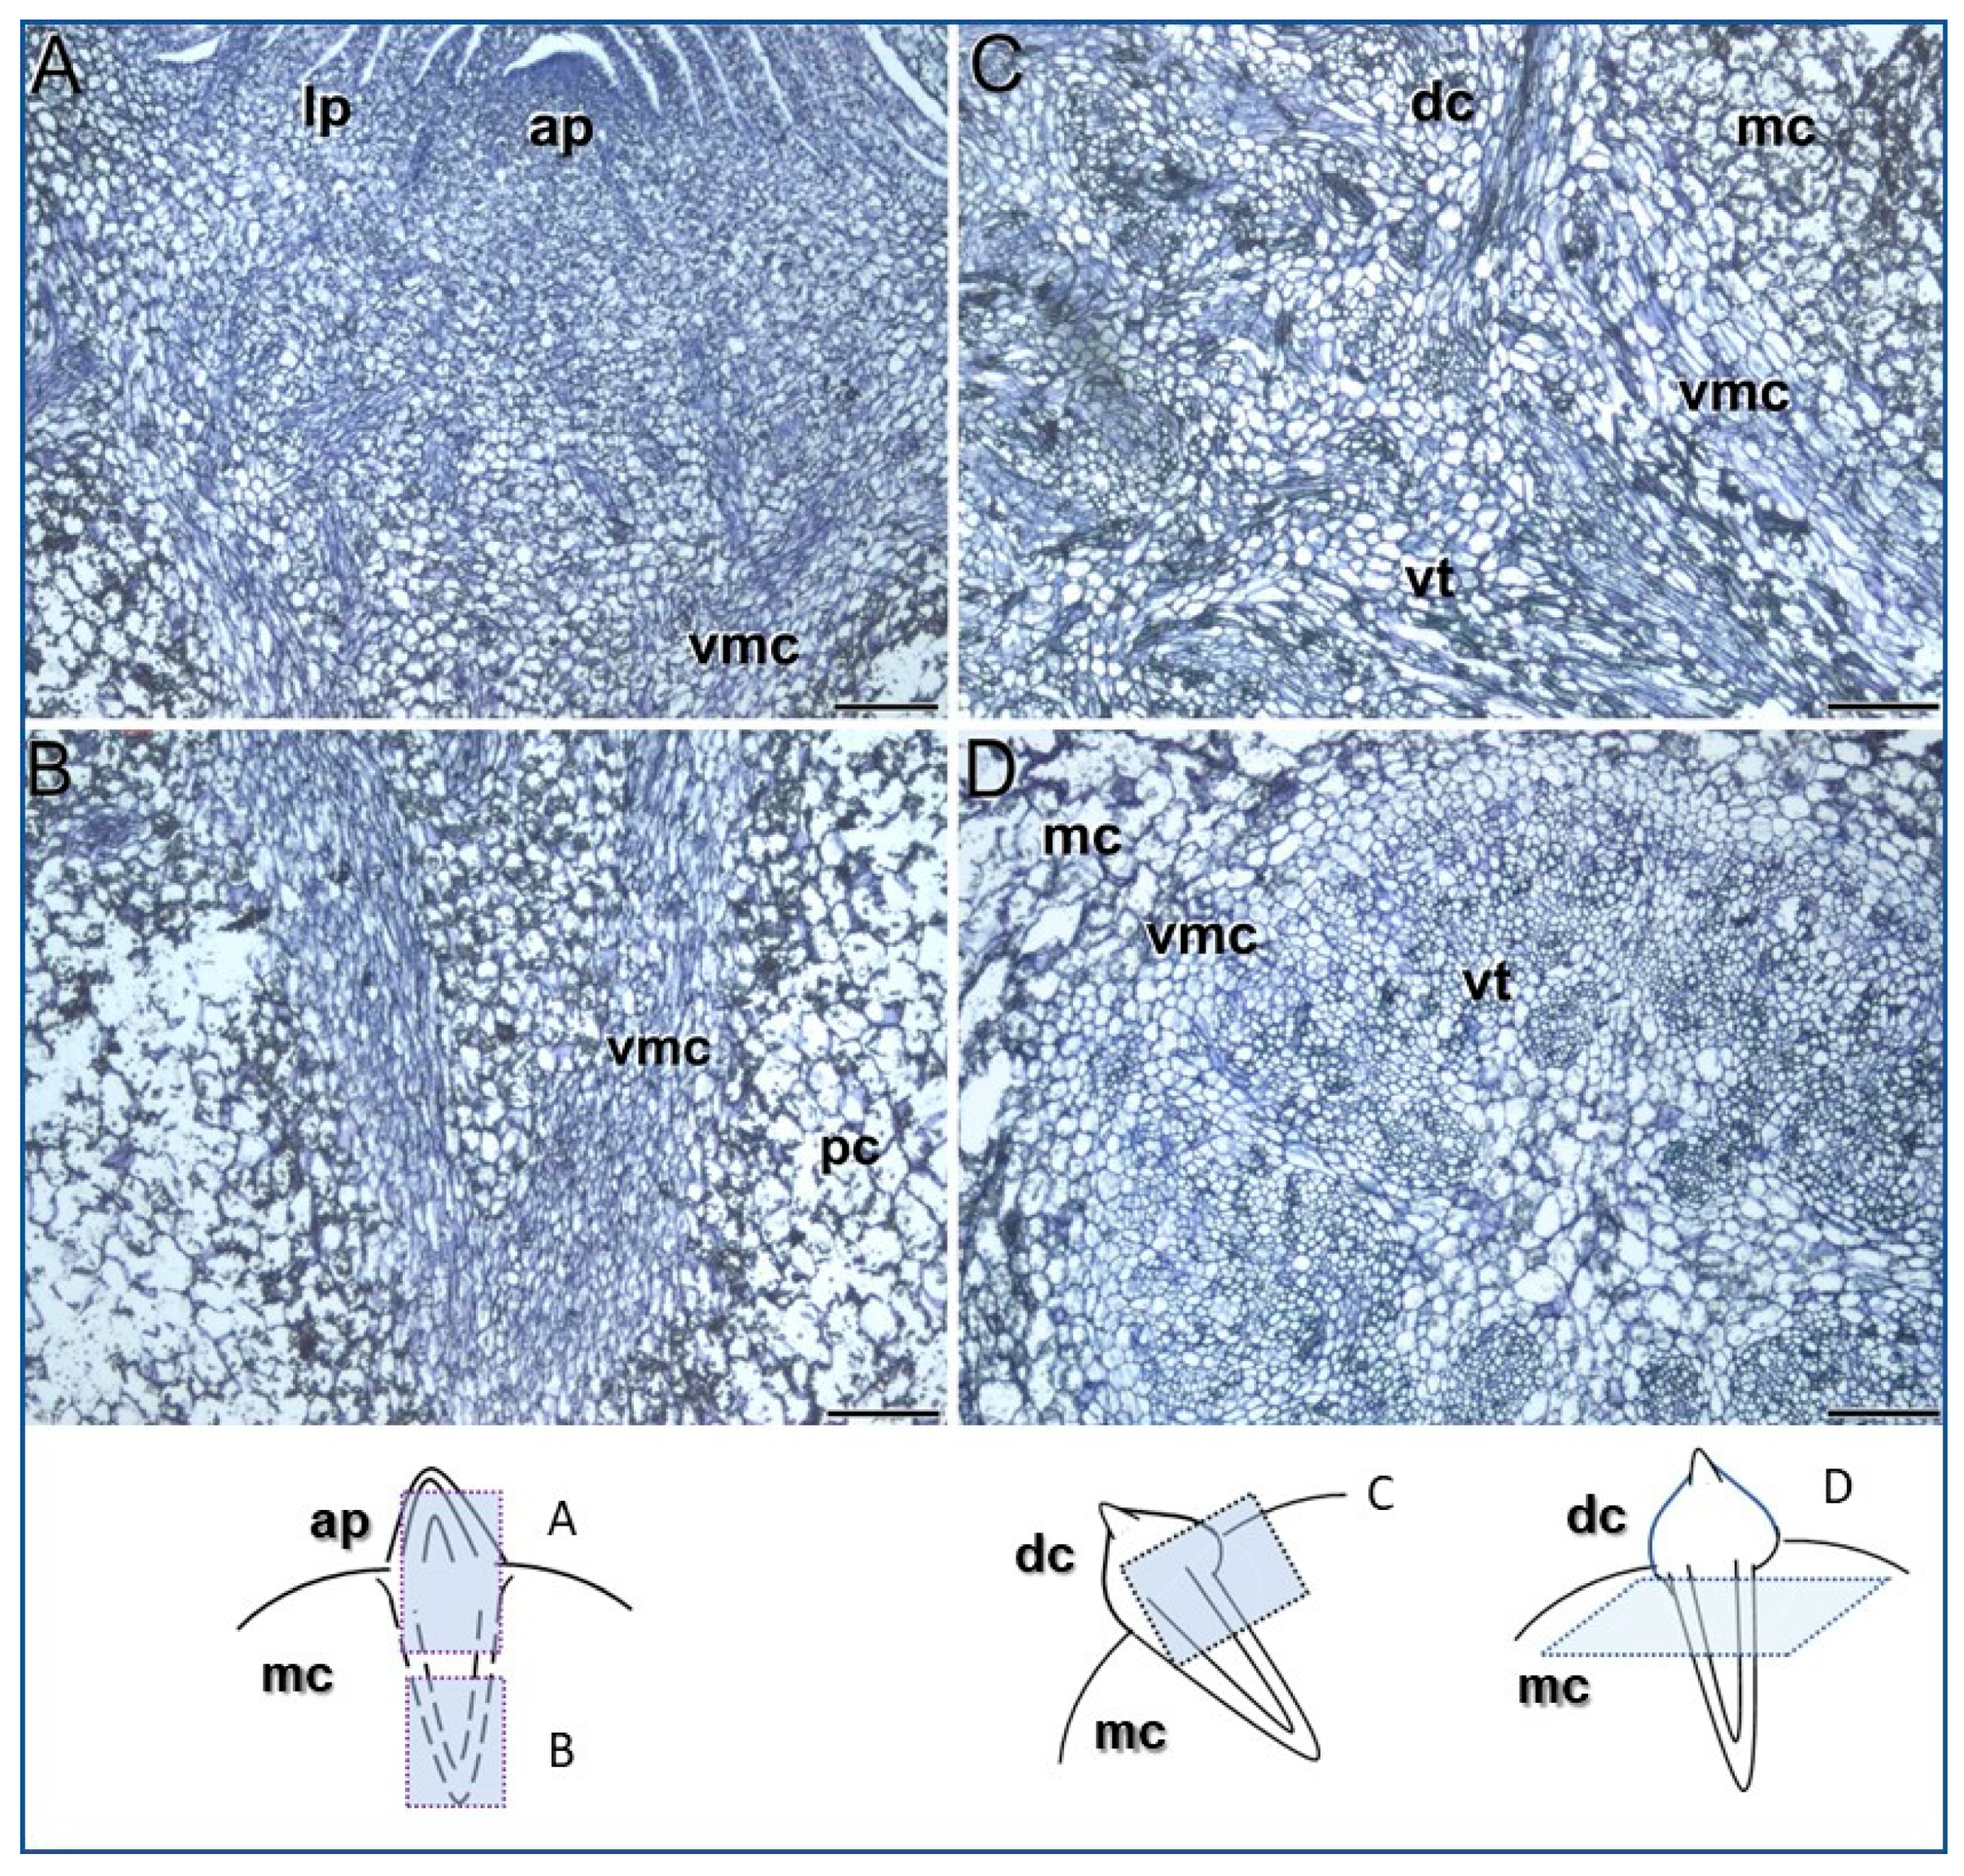
Abstract
:1. Introduction
2. Material and Methods
2.1. Plant Material and Cultivation Conditions
2.2. Sampling and Determination of Biomass Partitioning during the Vegetative Growth Period
2.3. Processing for Light and Transmission Electron Microscopy
2.4. Determination of Carbohydrates
2.5. Enzyme Assays
2.6. Statistical Analysis
3. Results
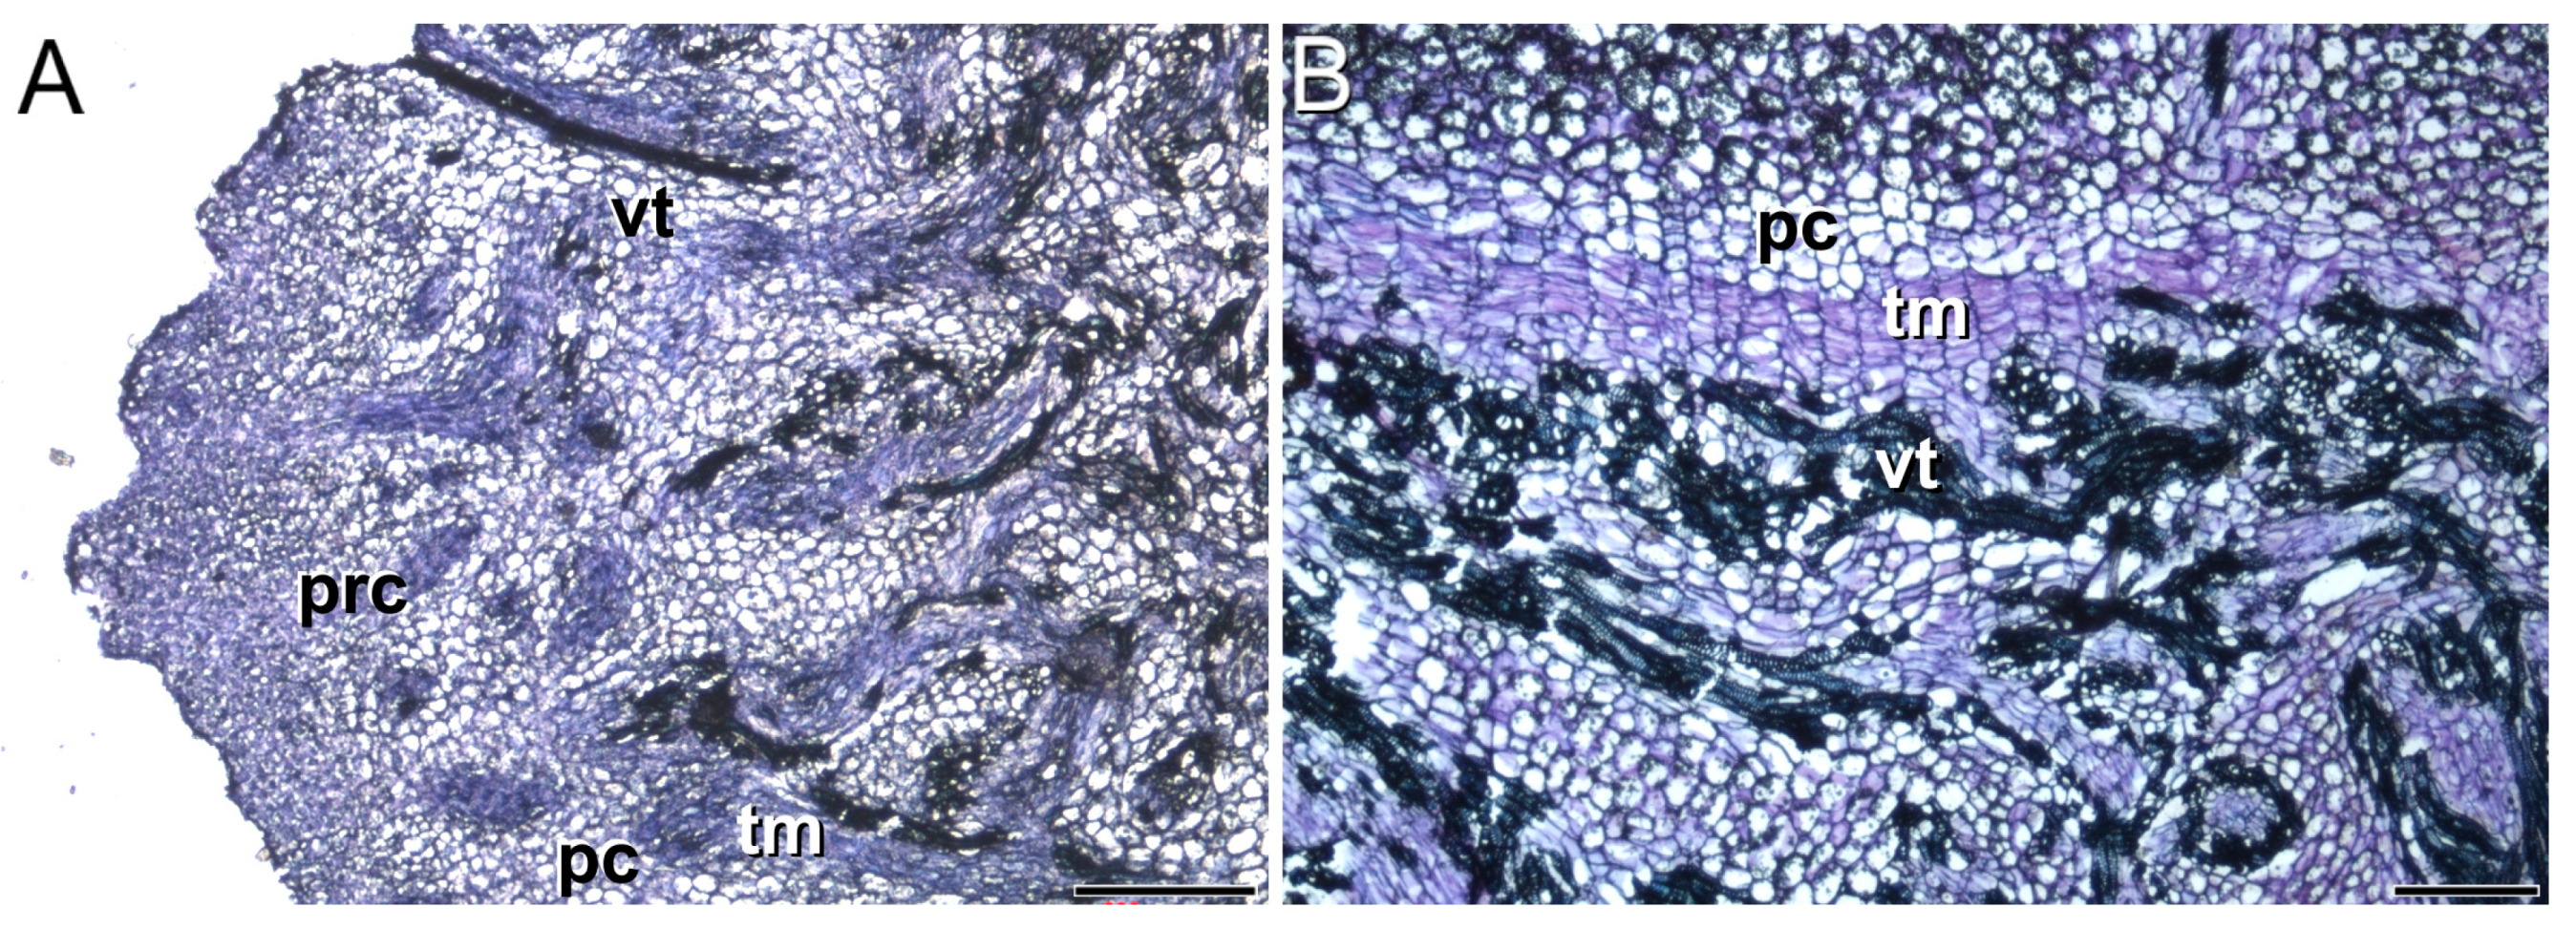
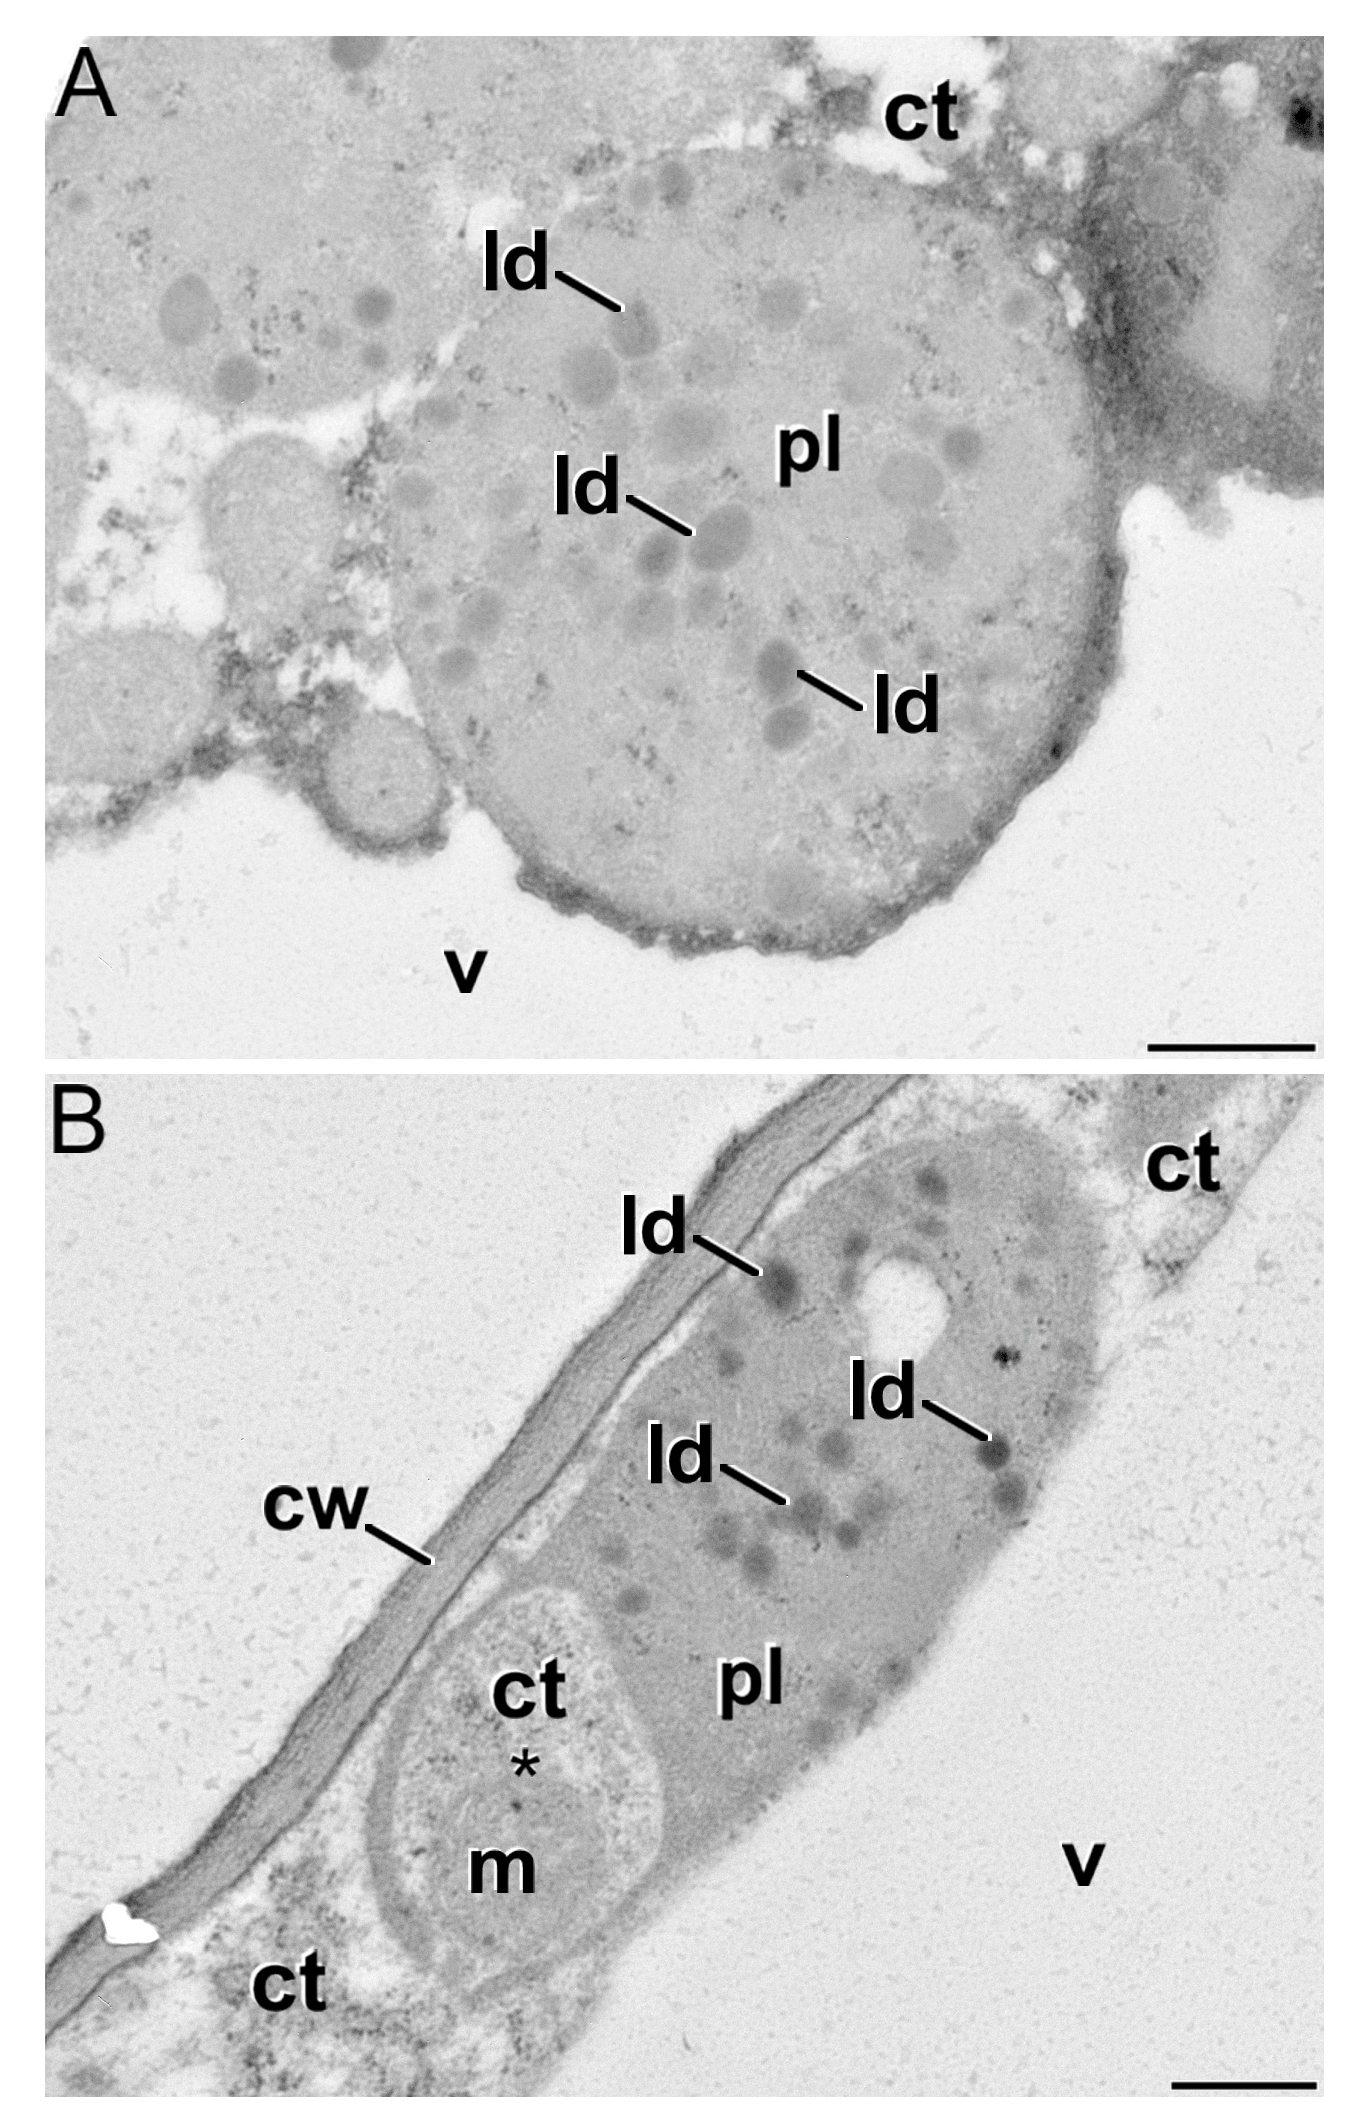
3.1. Meristems Specifically Involved in the Development of the Saffron Corm
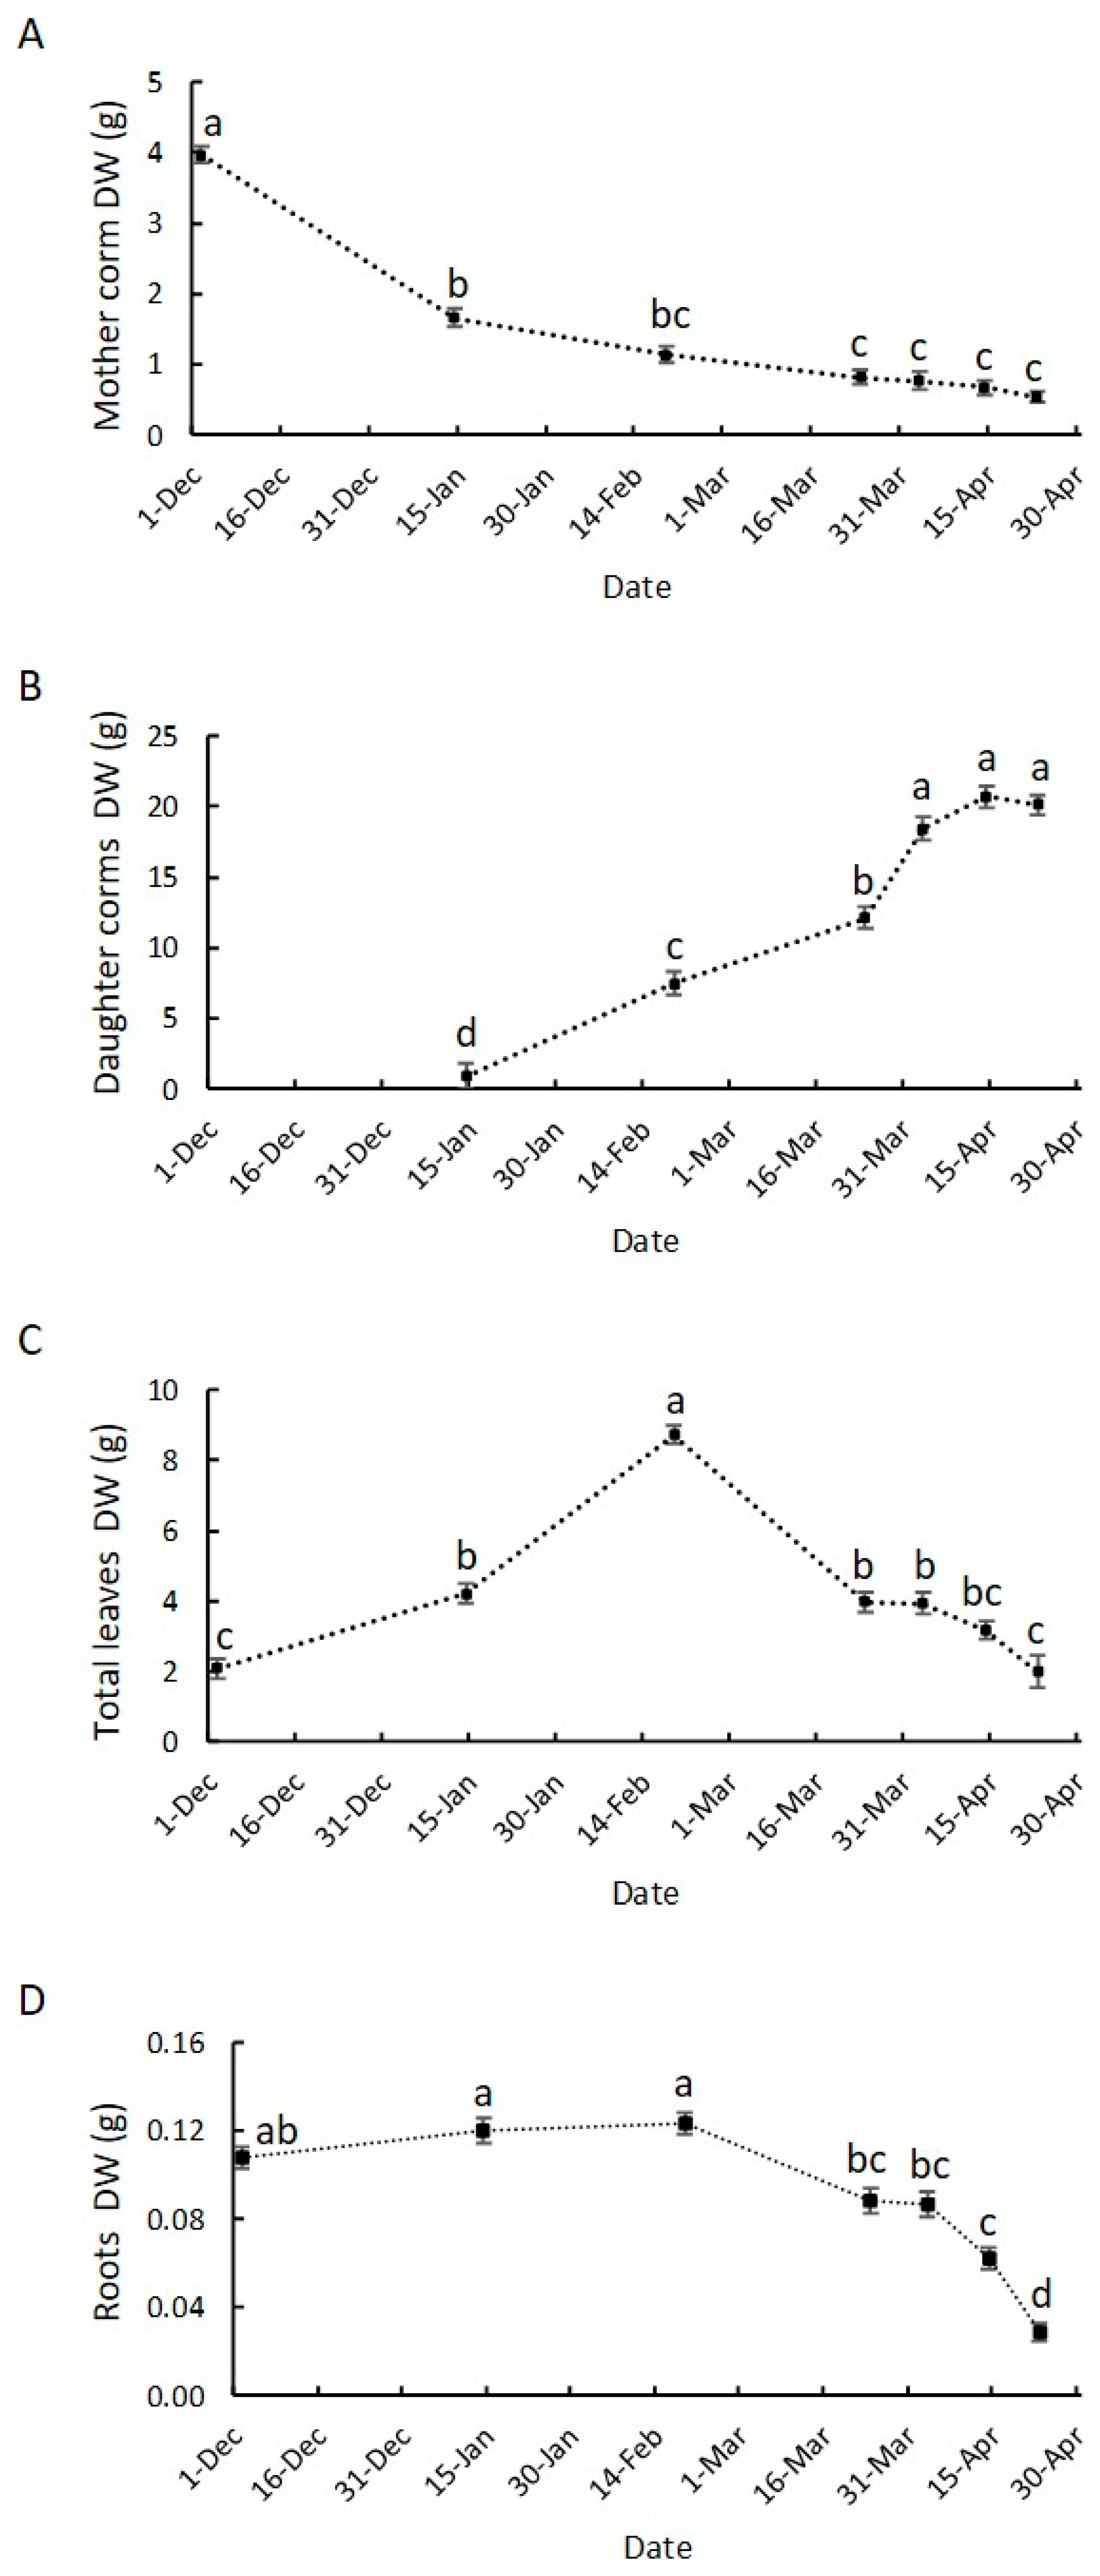
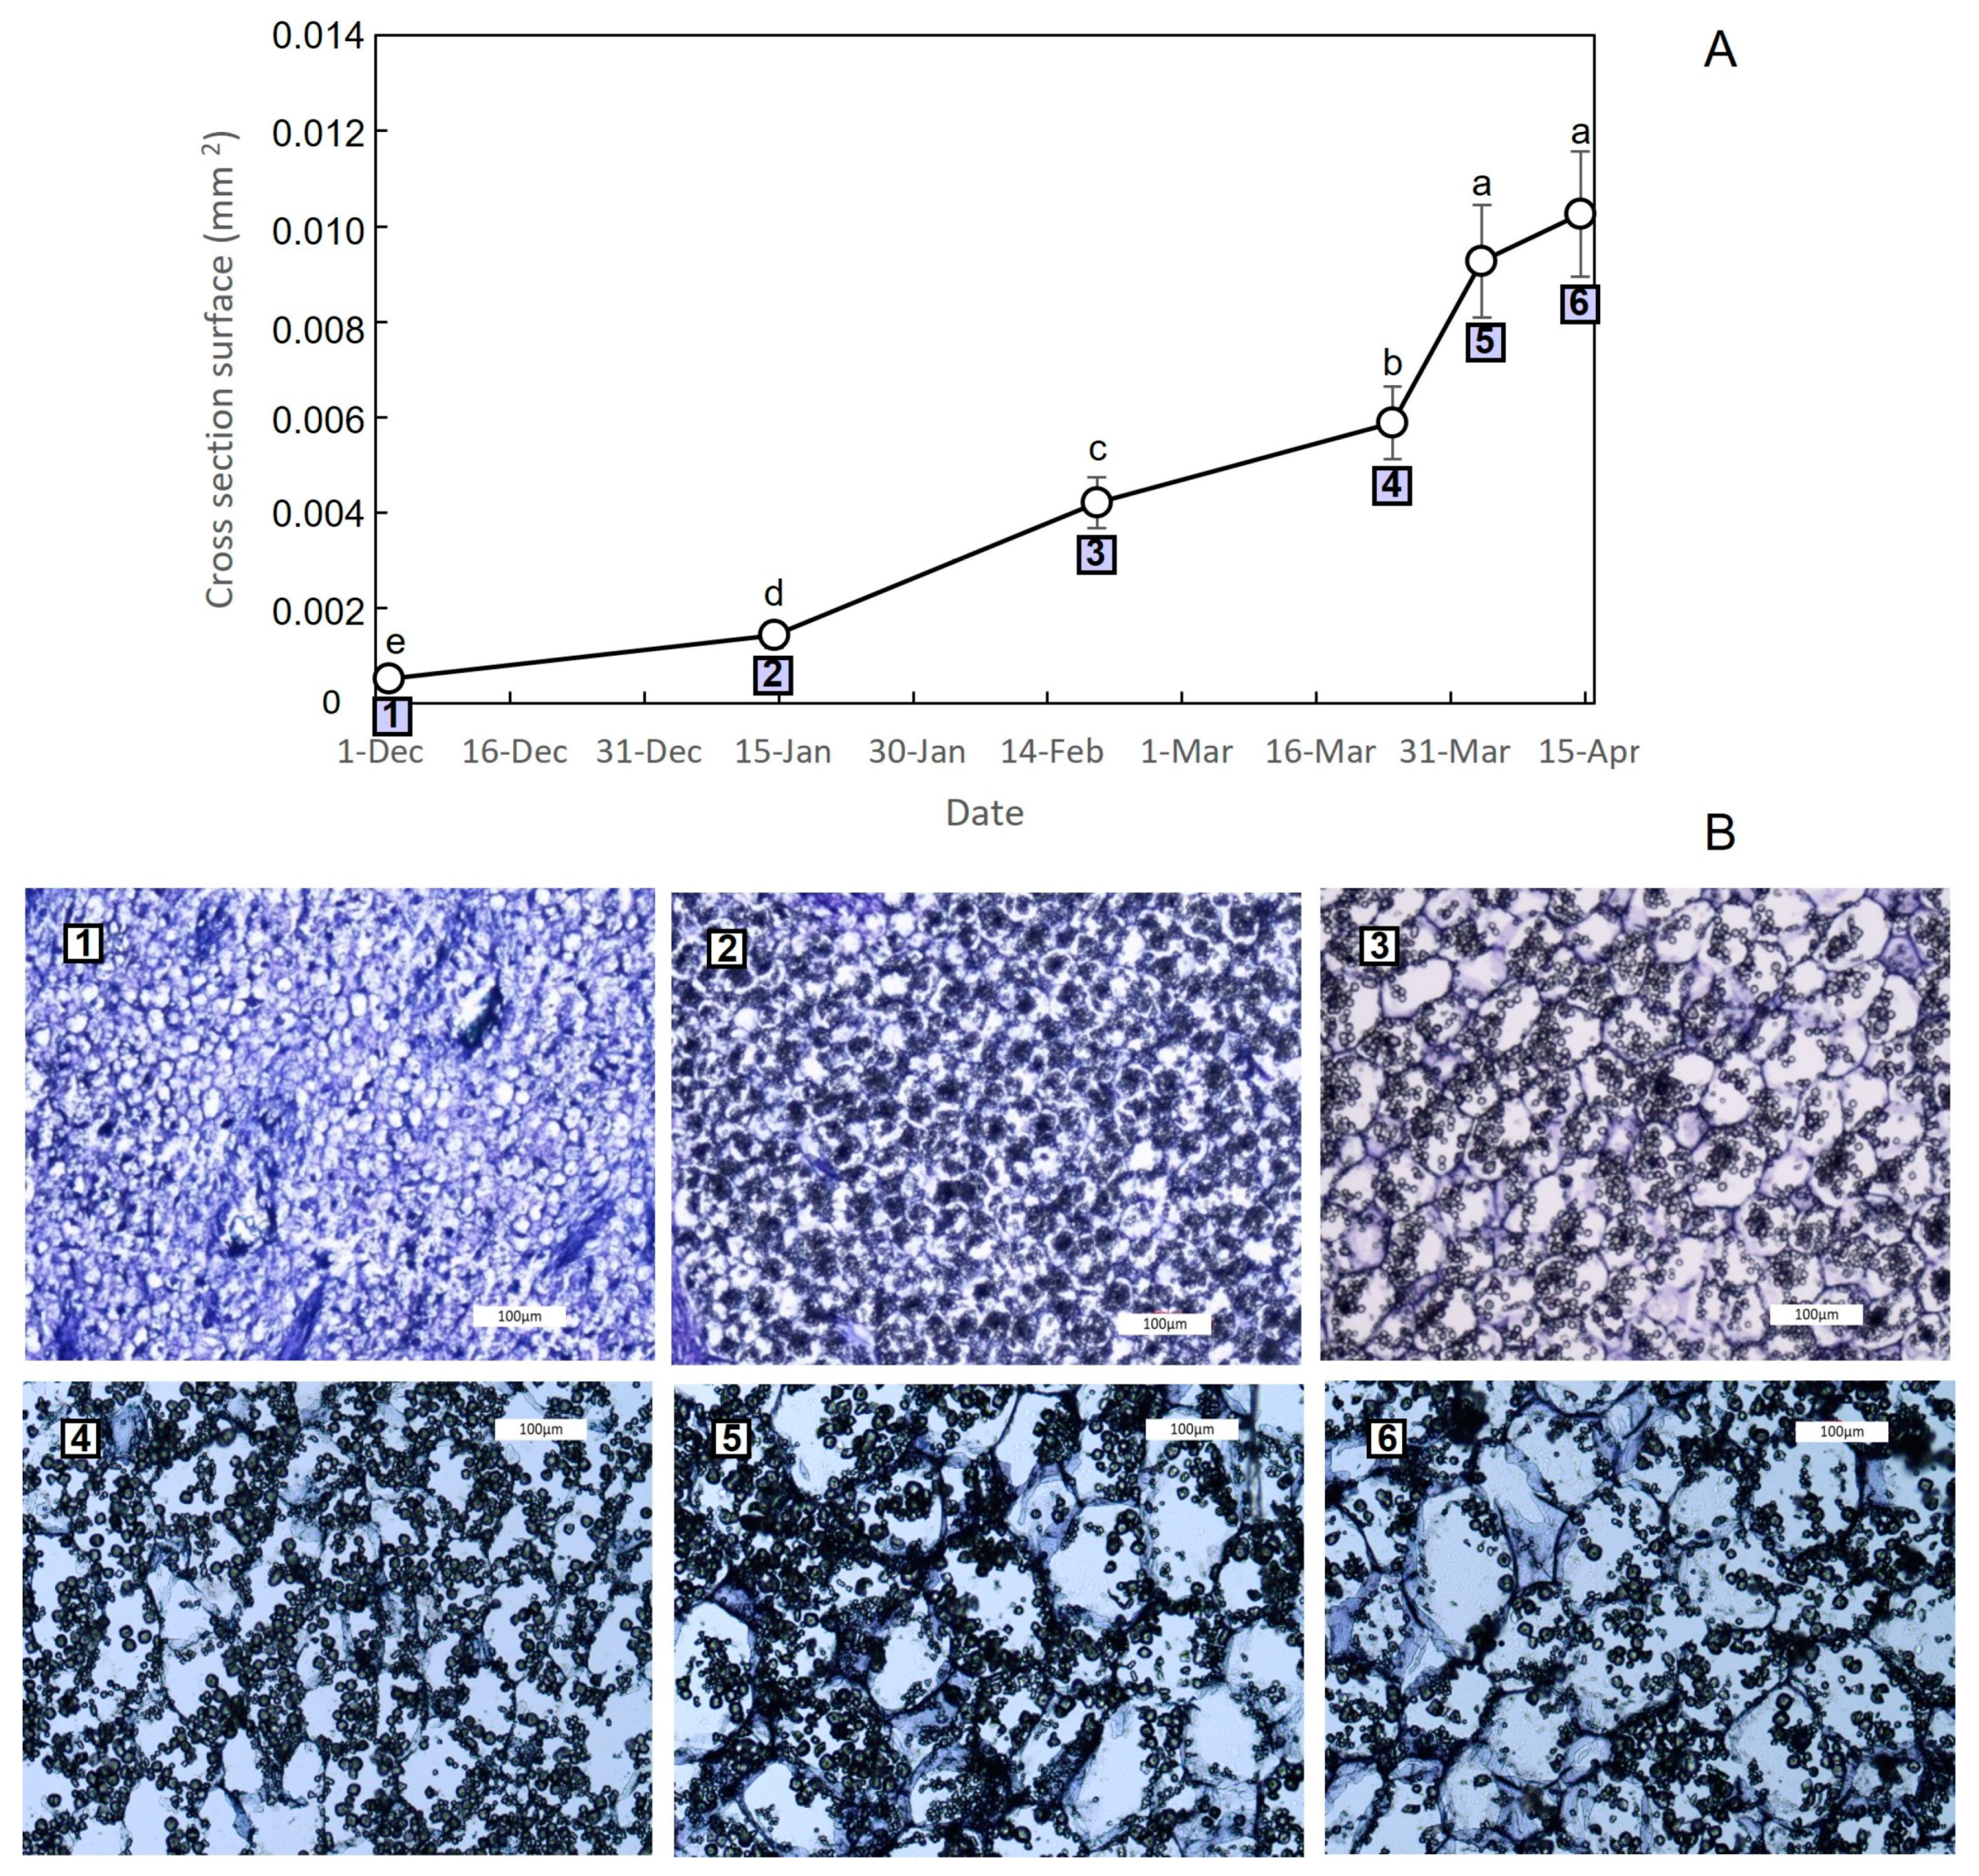
3.2. Growth Dynamics of Saffron Corm at Macroscopic and Cellular Levels, and Its Relationship with Biomass Changes in the Source Organs
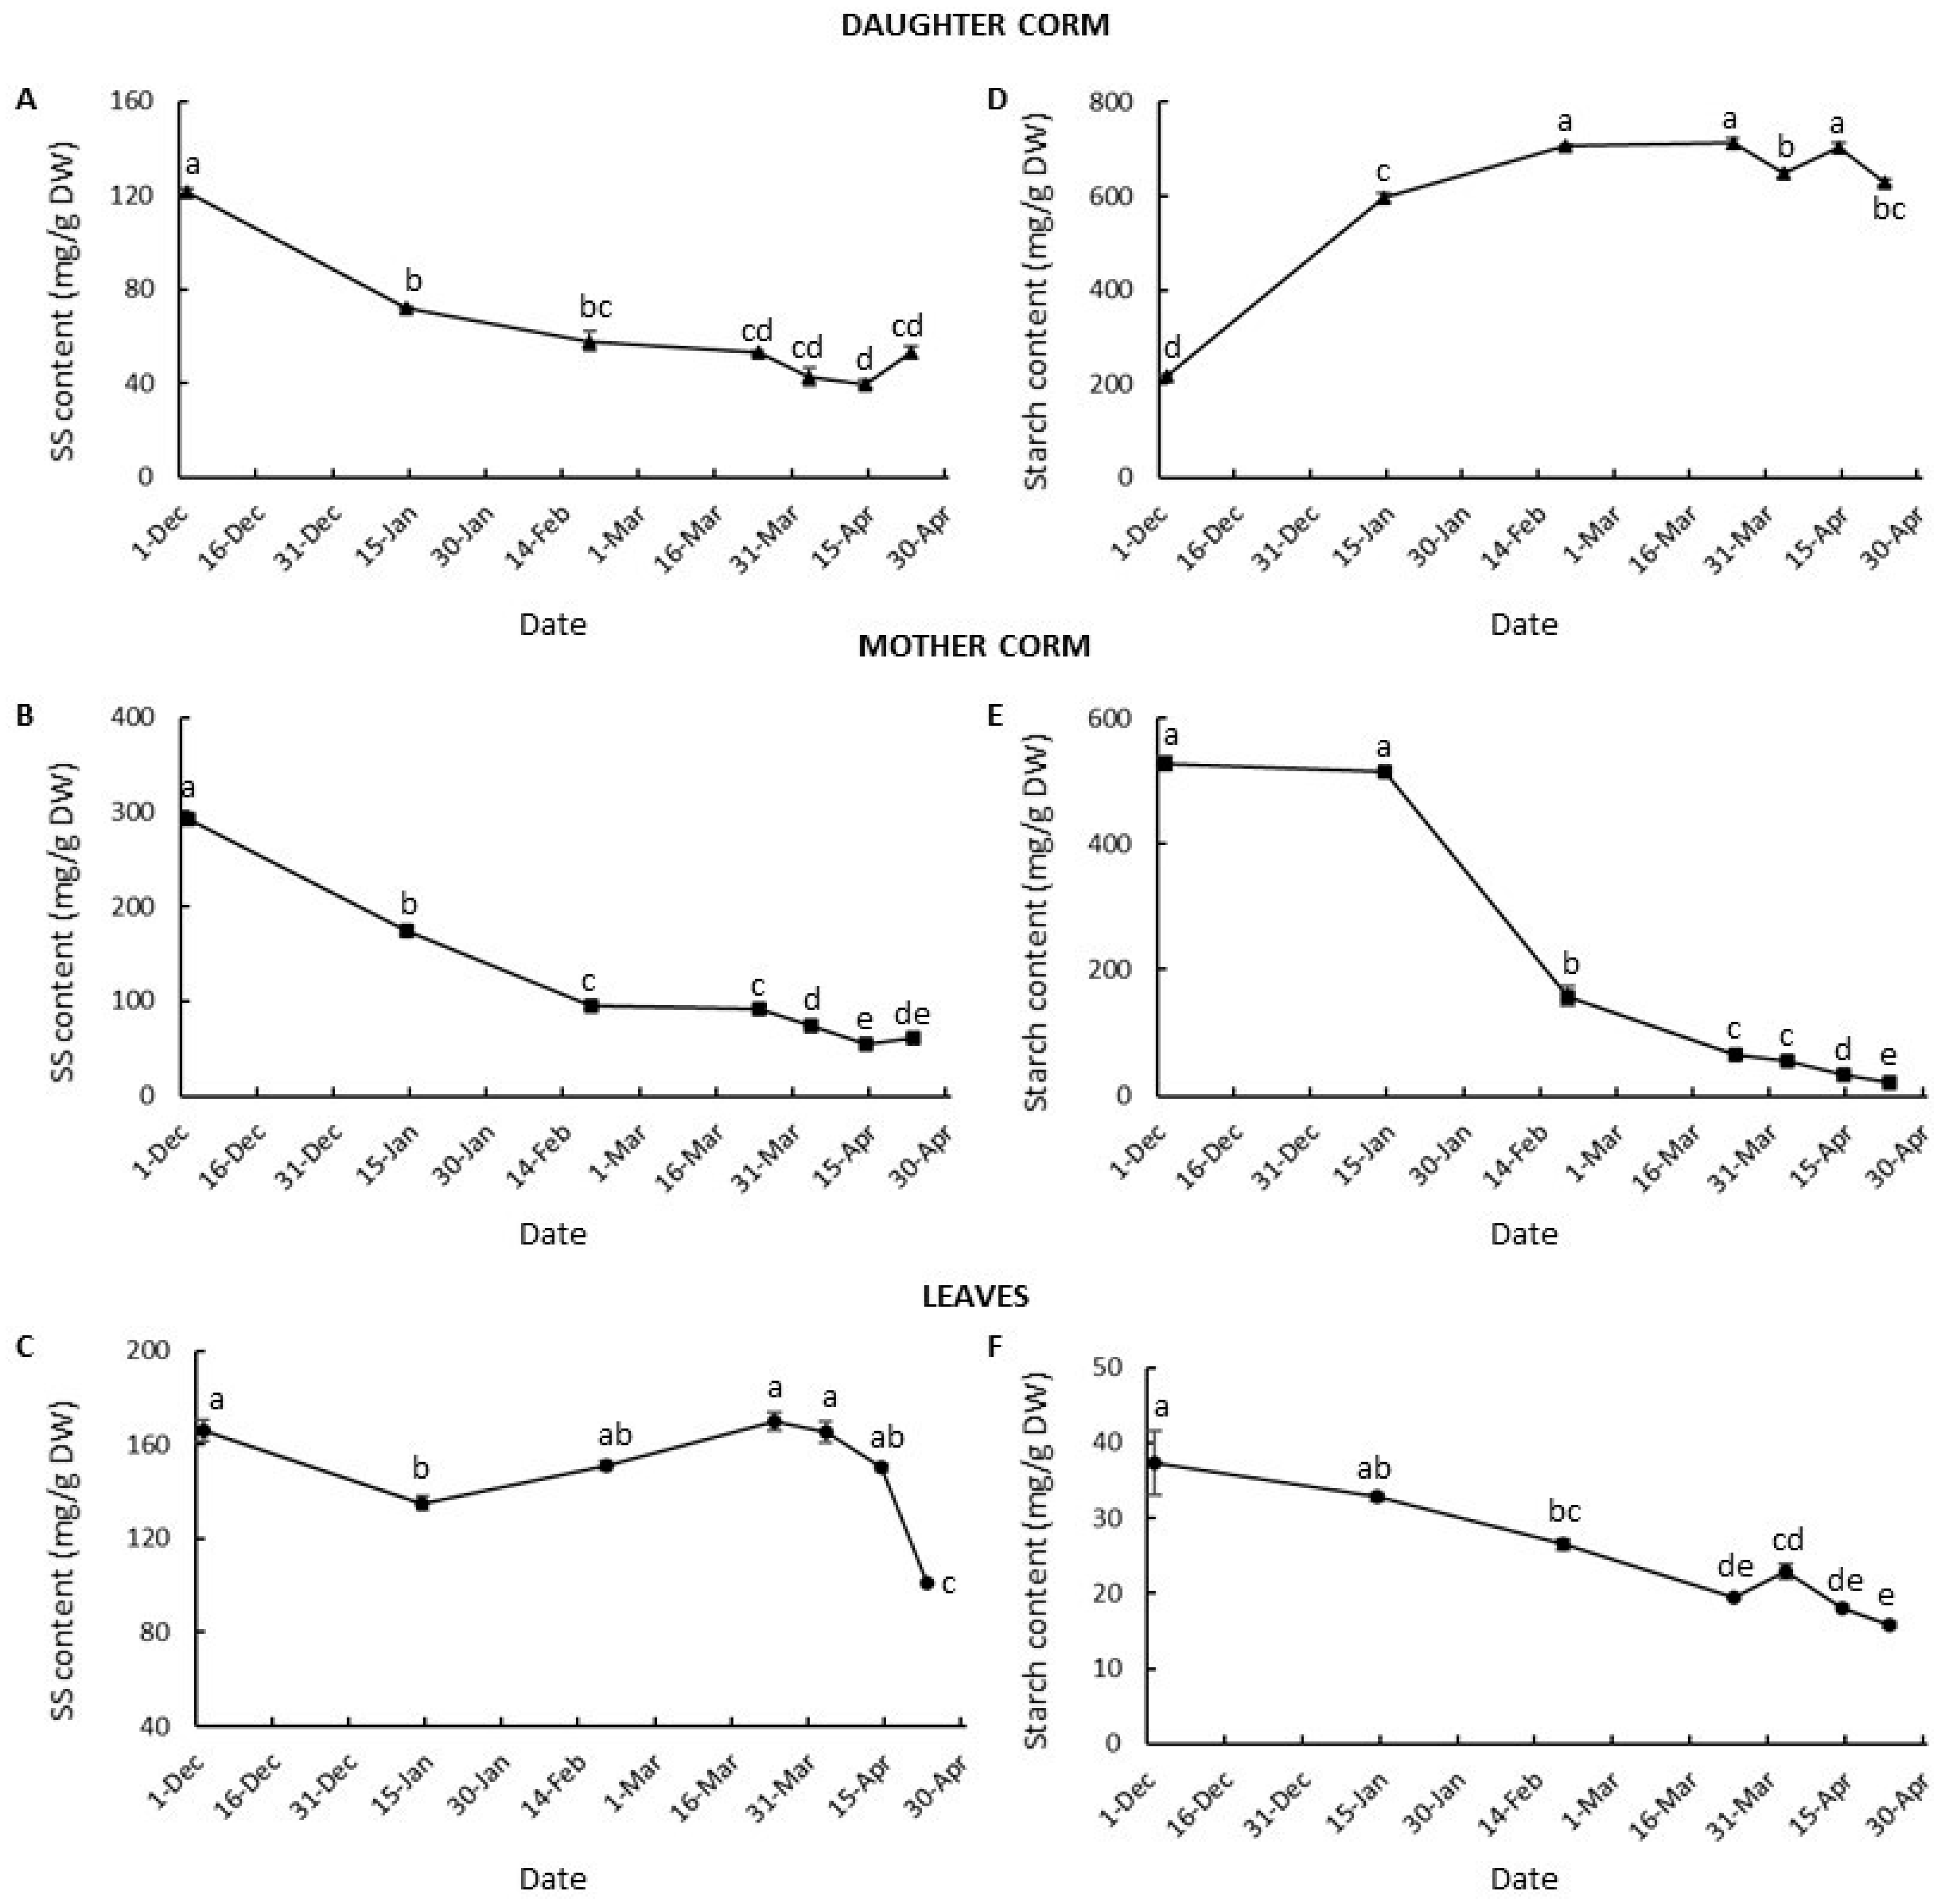
3.3. Changes in Carbohydrate Partition and Allocation during Corm Development
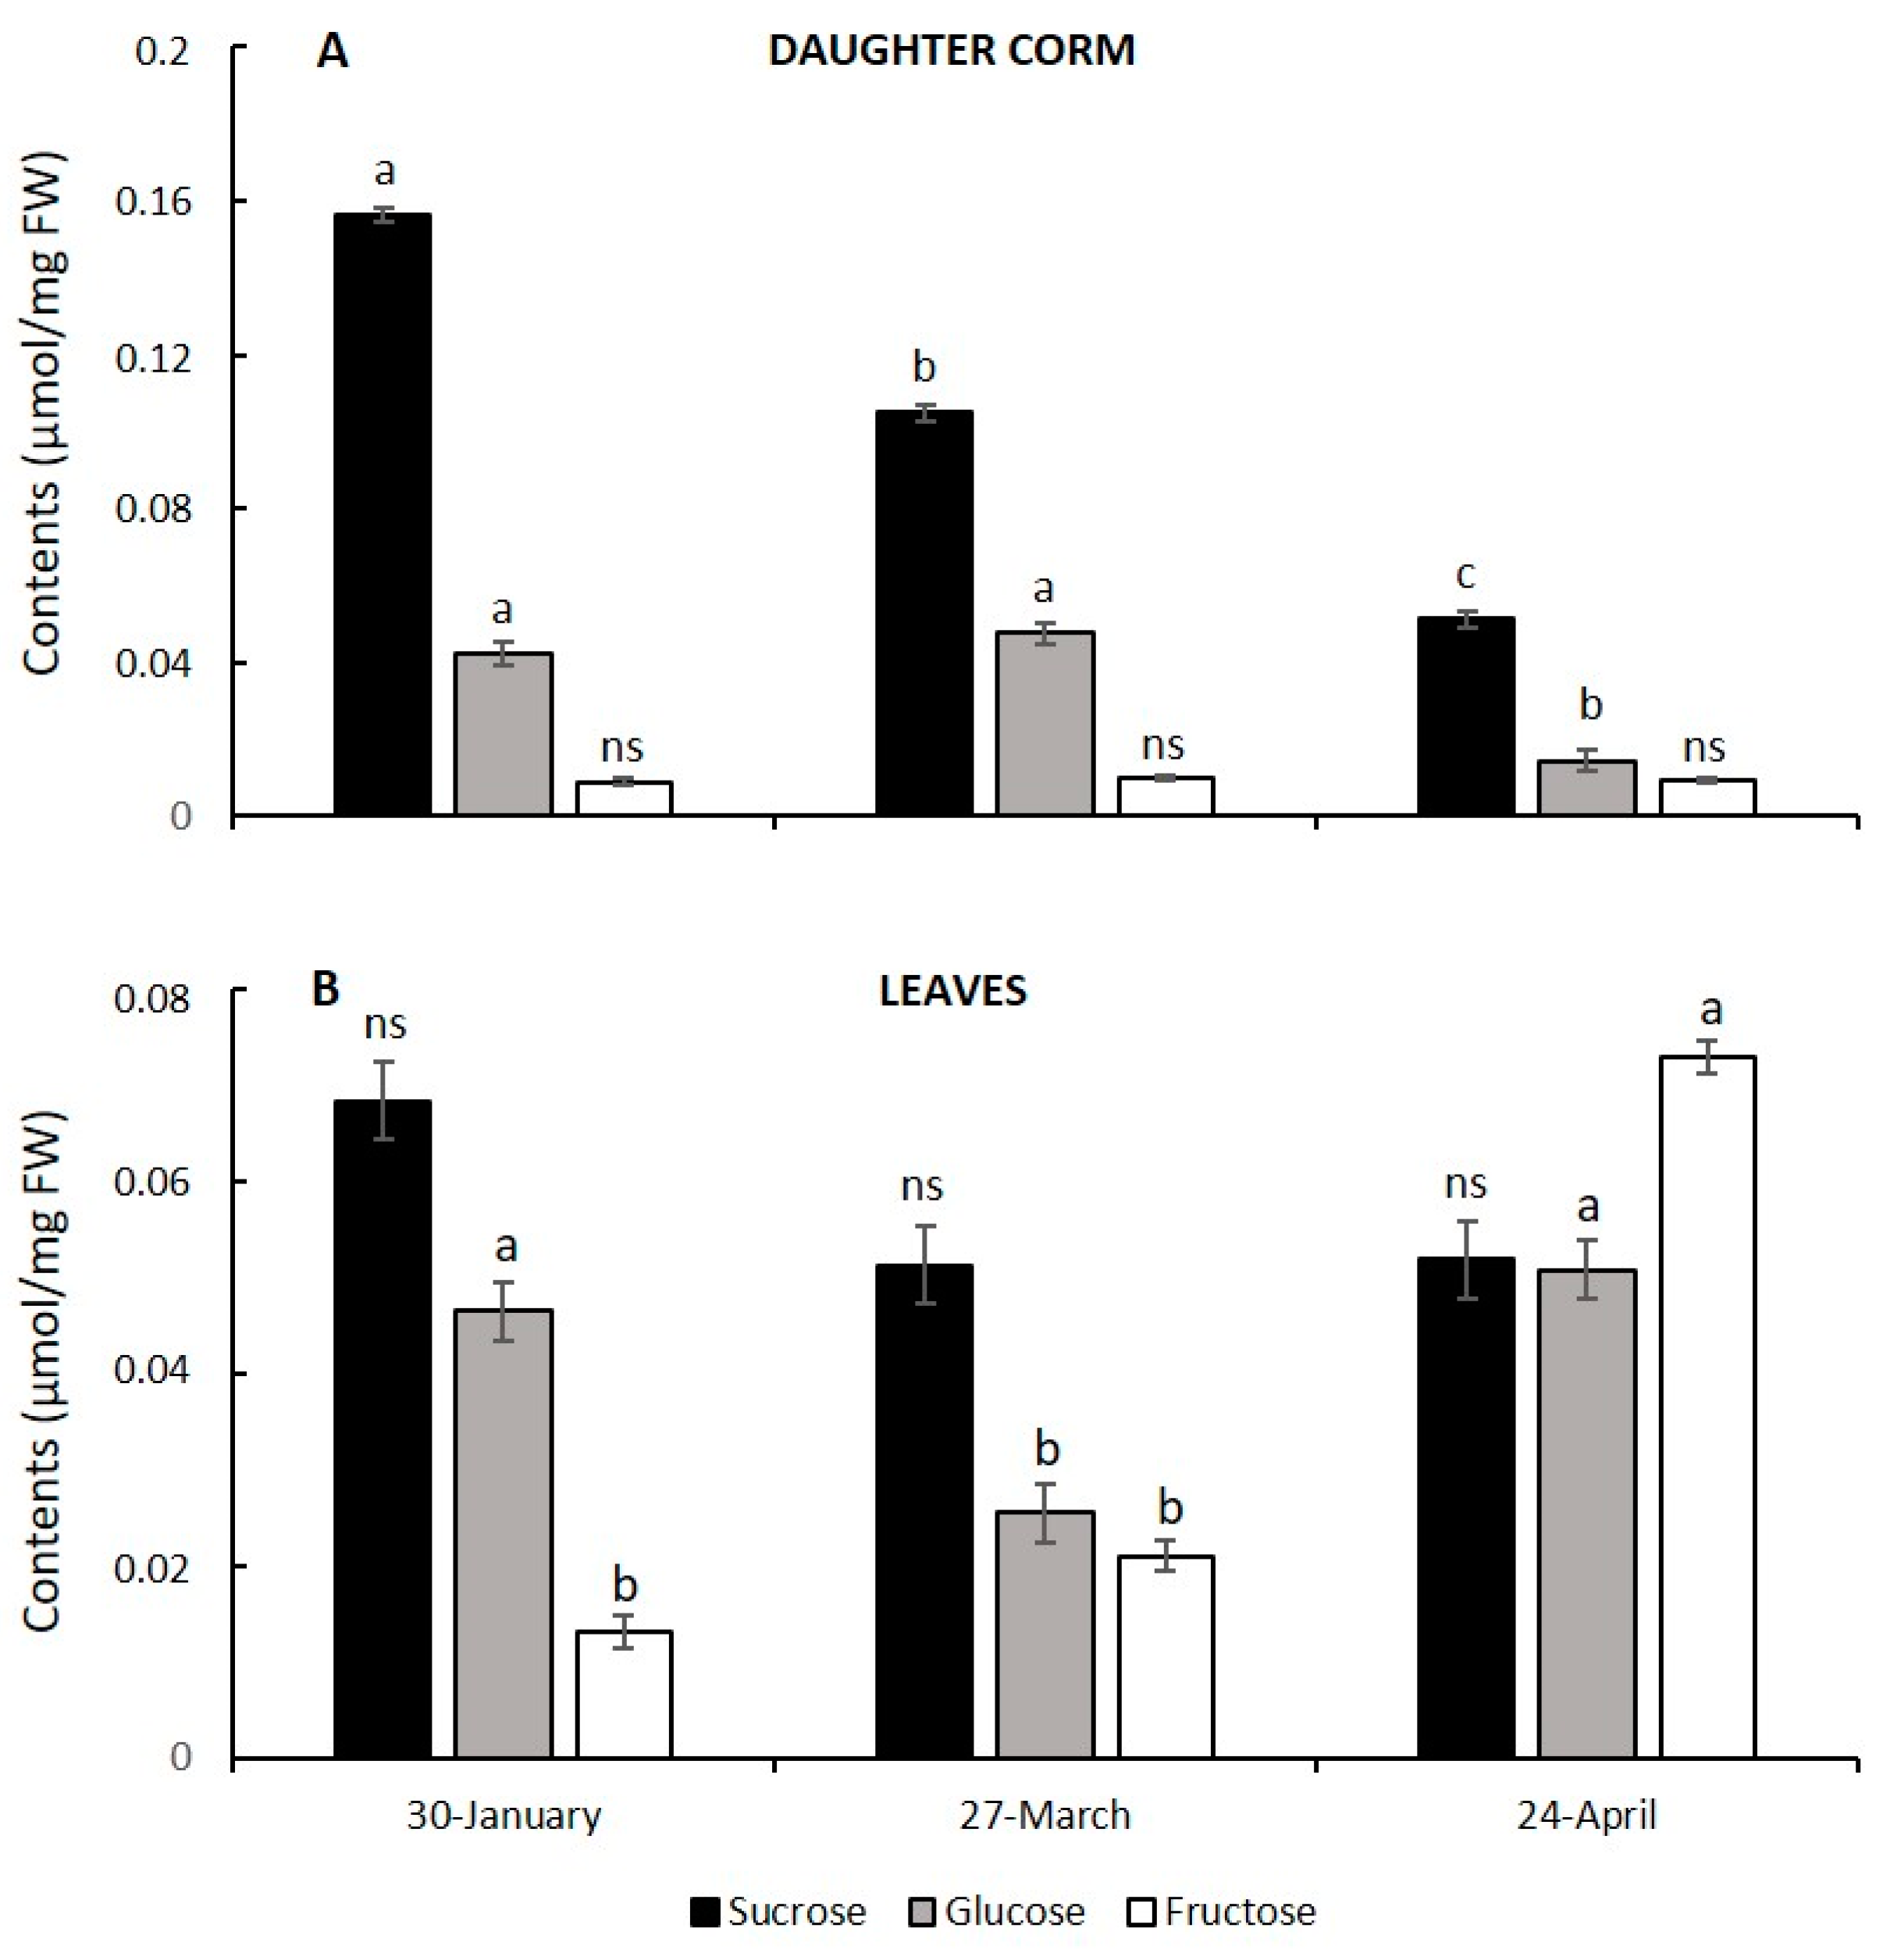
3.4. Corm Growth Arrest and Leaf Senescence in Saffron: Relationship with Hexose to Sucrose Ratios
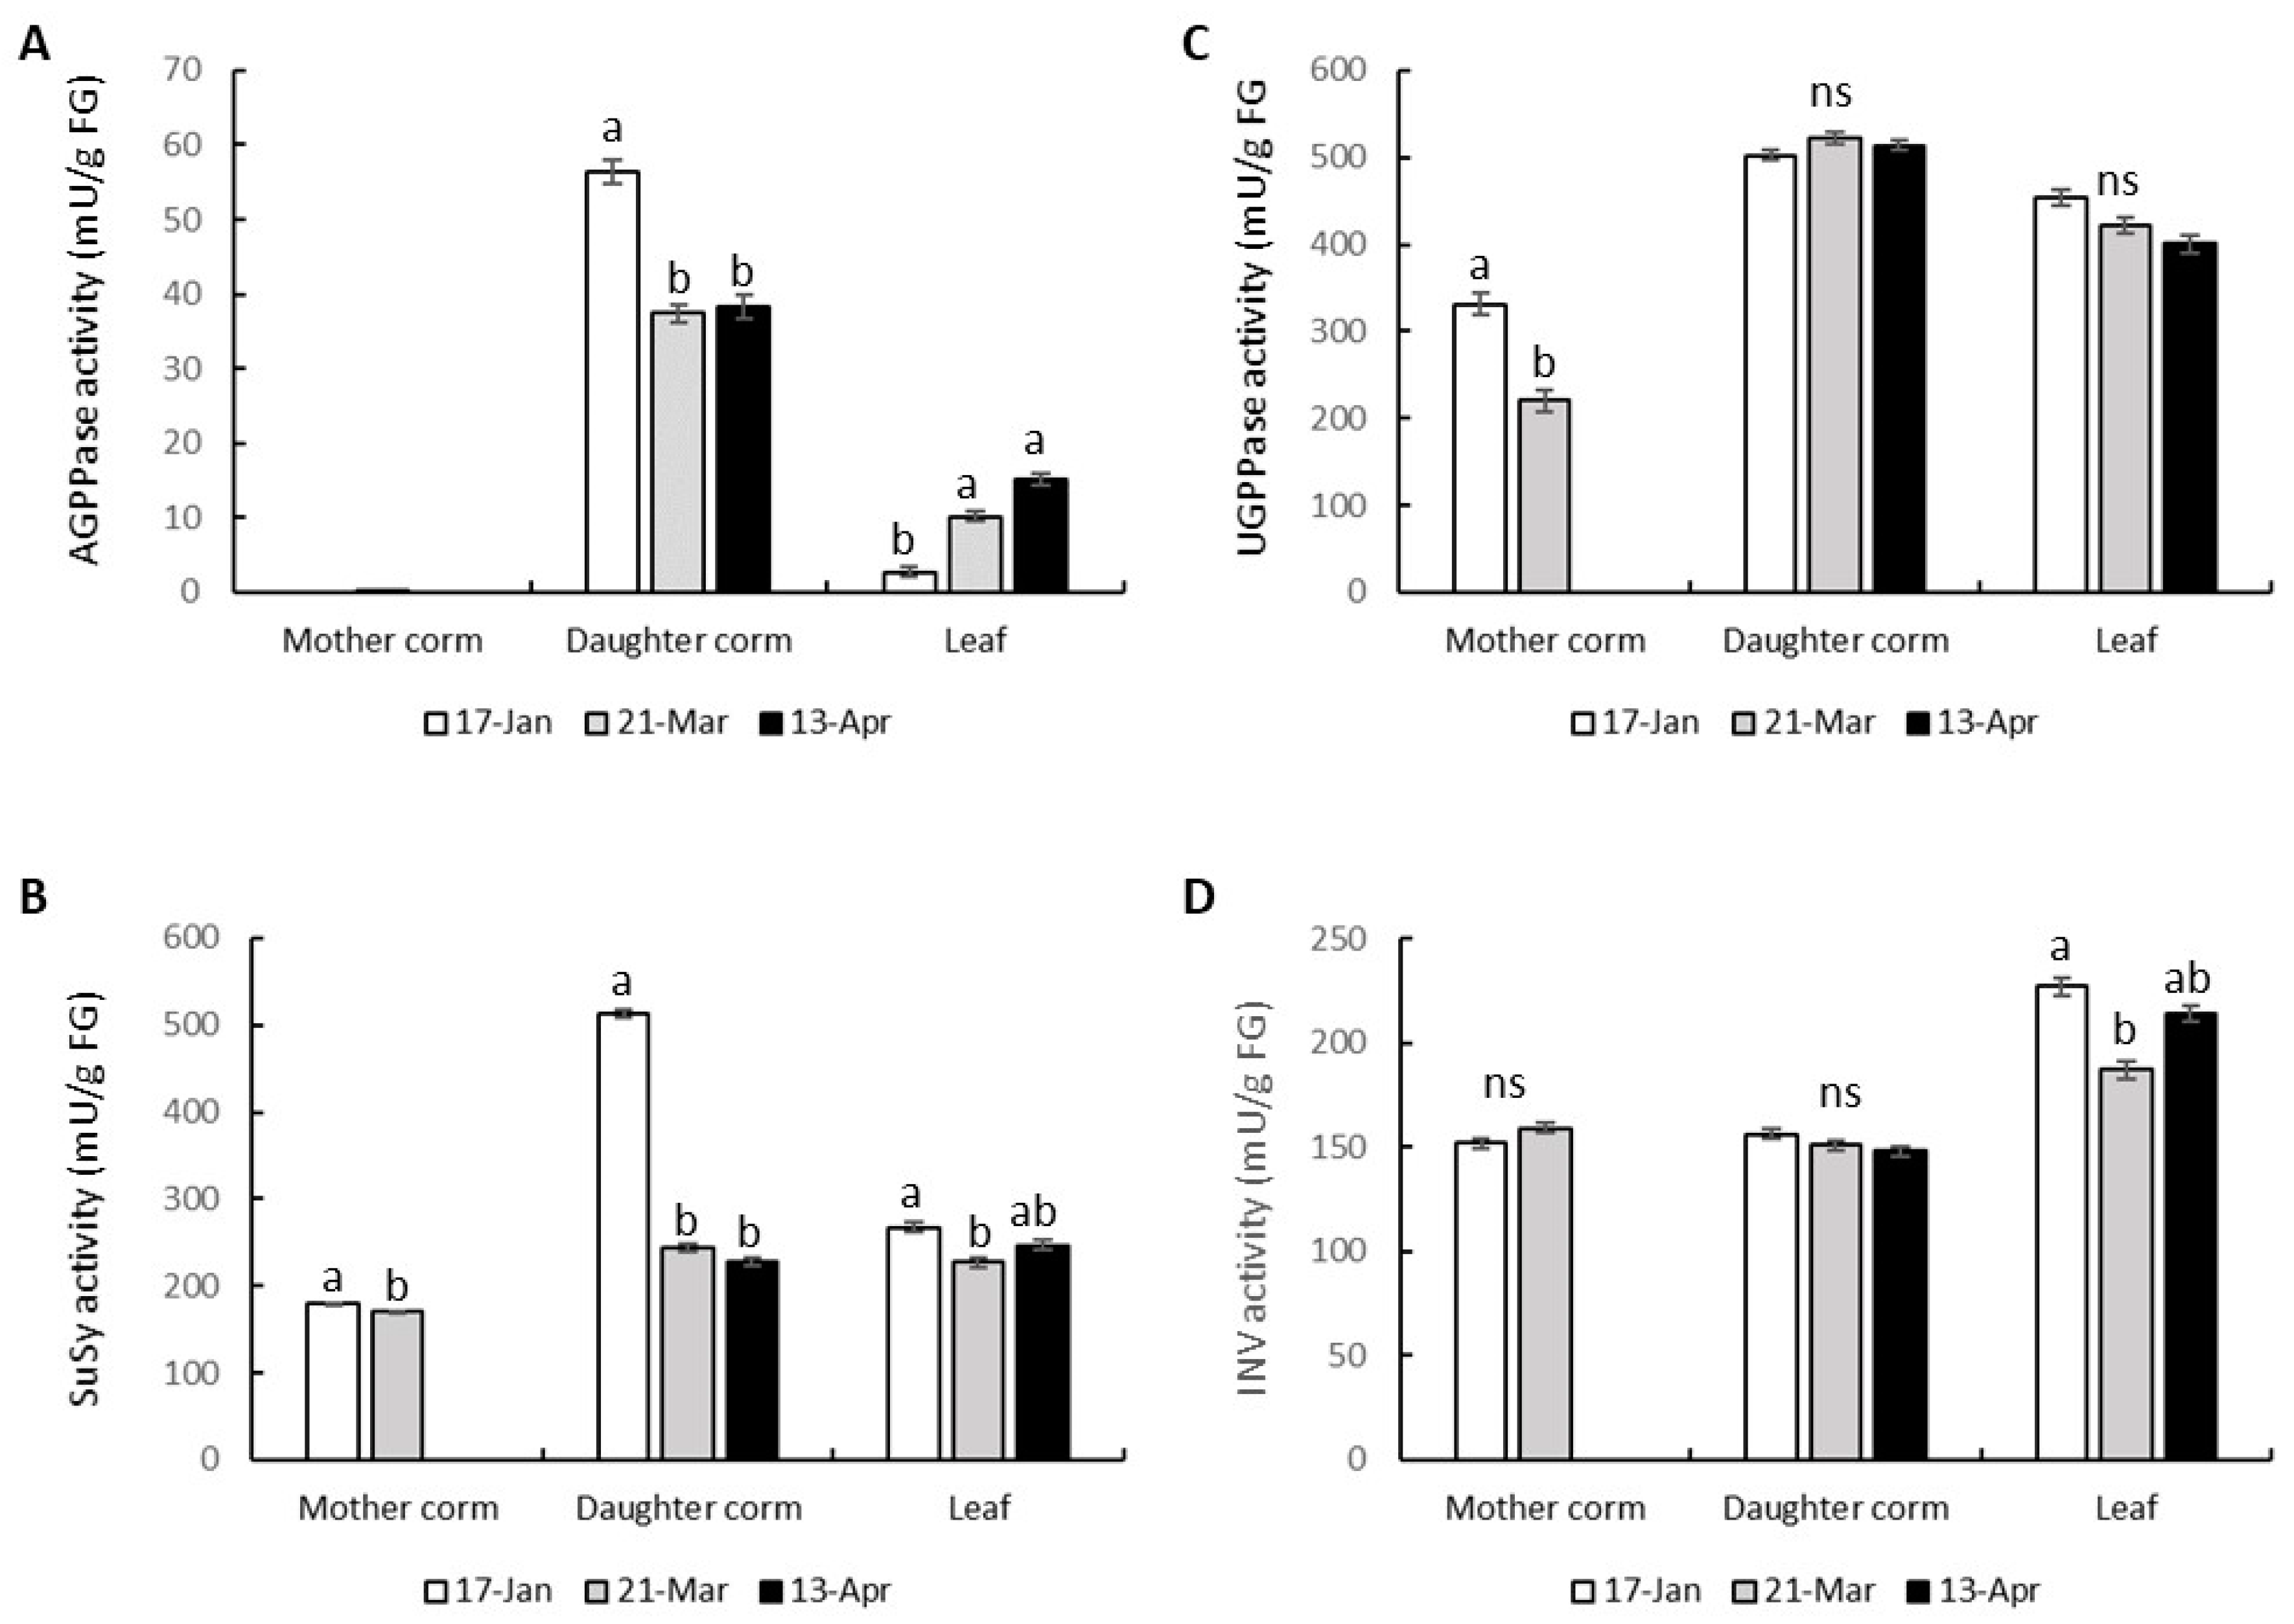
3.5. Activities of Enzymes Involved in the Metabolisms of Sugar and Starch
4. Discussion
4.1. Two Distinct Types of Meristems Play a Pivotal Role in Saffron Corm Growth
4.2. The Growth of the Saffron Corm as a Set of Coordinate Processes including Cell Division, Cell Expansion, as Well as Changes in Carbohydrate Partitioning and Allocation
4.3. Sugars as Signaling Molecules for Corm Initiation, Corm Growth Arrest and Leaf Senescence
4.4. There Is a Predominant Role of Susy as a Sucrolytic Enzyme in the Maintenance of a High Flux of Phosphorylated Glucose Directed at Starch Accumulation in the Daughter Corm
5. Conclusions
Supplementary Materials
Author Contributions
Funding
Data Availability Statement
Acknowledgments
Conflicts of Interest
References
- Khosa, J.; Bellinazzo, F.; Kamenetsky Goldstein, R.; Macknight, R.; Immink, R.G. Phosphatidylethanolamine-binding proteins: The conductors of dual reproduction in plants with vegetative storage organs. J. Exp. Bot. 2021, 72, 2845–2856. [Google Scholar] [CrossRef]
- Cardone, L.; Castronuovo, D.; Perniola, M.; Cicco, N.; Candido, V. Saffron (Crocus sativus L.), the king of spices: An overview. Sci. Hortic. 2020, 272, 109560. [Google Scholar] [CrossRef]
- Mohtashami, L.; Amiri, M.S.; Ramezani, M.; Emami, S.A.; Simal-Gandara, J. The genus Crocus L.: A review of ethnobotanical uses, phytochemistry and pharmacology. Ind. Crops Prod. 2021, 171, 113923. [Google Scholar] [CrossRef]
- Molina, R.V.; Valero, M.; Navarro, Y.; Garcia-Luis, A.; Guardiola, J.L. Low temperature storage of corms extends the flowering season of saffron (Crocus sativus L.). J. Hortic. Sci. Biotechnol. 2005, 80, 319–326. [Google Scholar] [CrossRef]
- Renau-Morata, B.; Nebauer, S.G.; García-Carpintero, V.; Cañizares, J.; Minguet, E.G.; de los Mozos, M.; Molina, R.V. Flower induction and development in saffron: Timing and hormone signalling pathways. Ind. Crops Prod. 2021, 164, 113370. [Google Scholar] [CrossRef]
- Azizbekova, N.S.; Miliaeva, E.L.; Lobova, N.V.; Chailakhian, M.K. Effect of gibberellin and kinetin on the formation of floral organs of saffron. Fiziol. Rast. Mosk. 1978, 25, 603–609. [Google Scholar]
- Milyaeva, E.L.; Azizbekova, N.S. Cytophysiological changes in the course of development of stem apices of saffron crocus. Soviet Plant Physiol. 1978, 25, 227–233. [Google Scholar]
- Farooq, S.; Koul, K.K. Changes in gibberellin-like activity in corms of saffron plant (Crocus sativus L.) during dormancy and sprouting. Biochem. Physiol. Pflanz. 1983, 178, 685–689. [Google Scholar] [CrossRef]
- Jirage, D.B.; Ravishankar, G.A.; Suvarnalatha, G.; Venkataraman, L.V. Profile of polyamines during sprouting and growth of saffron (Crocus sativus L.) corms. J. Plant Growth Regul. 1994, 13, 69–72. [Google Scholar] [CrossRef]
- Molina, R.V.; Valero, M.; Navarro, Y.; Garcıa-Luis, A.; Guardiola, J.L. The effect of time of corm lifting and duration of incubation at inductive temperature on flowering in the saffron plant (Crocus sativus L.). Sci. Hortic. 2004, 103, 79–91. [Google Scholar] [CrossRef]
- Molina, R.V.; Valero, M.; Navarro, Y.; Guardiola, J.L.; García-Luis, A. Temperature effects on flower formation in saffron (Crocus sativus L.). Sci. Hortic. 2005, 103, 361–379. [Google Scholar] [CrossRef]
- Bagri, J.; Yadav, A.; Anwar, K.; Dkhar, J.; Singla-Pareek, S.L.; Pareek, A. Metabolic shift in sugars and amino acids regulates sprouting in Saffron corm. Sci. Rep. 2017, 7, 11904. [Google Scholar] [CrossRef] [PubMed]
- Qian, X.; Sun, Y.; Zhou, G.; Yuan, Y.; Li, J.; Huang, H.; Xu, L.; Li, L. Single-molecule real-time transcript sequencing identified flowering regulatory genes in Crocus sativus. BMC Genom. 2019, 20, 857. [Google Scholar] [CrossRef] [PubMed]
- Hu, J.; Liu, Y.; Tang, X.; Rao, H.; Ren, C.; Chen, J.; Wu, Q.; Jiang, Y.; Geng, F.; Pei, J. Transcriptome profiling of the flowering transition in saffron (Crocus sativus L.). Sci. Rep. 2020, 10, 9680. [Google Scholar] [CrossRef] [PubMed]
- Jose-Santhi, J.; Sheikh, F.R.; Kalia, D.; Singh, R.K. Sugar metabolism mediates temperature-dependent flowering induction in saffron (Crocus sativus L.). Environ. Exp. Bot. 2023, 206, 105150. [Google Scholar] [CrossRef]
- Negbi, M.; Dagan, B.; Dror, A.; Basker, D. Growth, flowering, vegetative reproduction, and dormancy in the saffron crocus (Crocus sativus L.). Isr. J. Plant Sci. 1989, 38, 95–113. [Google Scholar] [CrossRef]
- Plessner, O.; Negbi, M.; Ziv, M.; Basker, D. Effects of temperature on the flowering of the saffron crocus (Crocus sativus L.): Induction of hysteranthy. Isr. J. Plant Sci. 1989, 38, 1–7. [Google Scholar] [CrossRef]
- de Juan, J.A.; Córcoles, H.L.; Muñoz, R.M.; Picornell, M.R. Yield and yield components of saffron under different cropping systems. Ind. Crops Prod. 2009, 30, 212–219. [Google Scholar] [CrossRef]
- Renau-Morata, B.; Nebauer, S.G.; Sánchez, M.; Molina, R.V. Effect of corm size, water stress and cultivation conditions on photosynthesis and biomass partitioning during the vegetative growth of saffron (Crocus sativus L.). Ind. Crops Prod. 2012, 39, 40–46. [Google Scholar] [CrossRef]
- Douglas, M.H.; Smallfield, B.M.; Wallace, A.R.; McGimpsey, J.A. Saffron (Crocus sativus L.): The effect of mother corm size on progeny multiplication, flower and stigma production. Sci. Hortic. 2014, 166, 50–58. [Google Scholar] [CrossRef]
- Behdani, M.A.; Al-Ahmadi, M.J.; Fallahi, H.R. Biomass partitioning during the life cycle of saffron (Crocus sativus L.) using regression models. J. Crop Sci. Biotechnol. 2016, 19, 71–76. [Google Scholar] [CrossRef]
- Darbyshire, B.; Henry, R.J. The distribution of fructans in onions. New Phytol. 1978, 81, 29–34. [Google Scholar] [CrossRef]
- Yaguchi, S.; McCallum, J.; Shaw, M.; Pither-Joyce, M.; Onodera, S.; Shiomi, N.; Yamauchi, N.; Shigyo, M. Biochemical and genetic analysis of carbohydrate accumulation in Allium cepa L. Plant Cell Physiol. 2008, 49, 730–739. [Google Scholar] [CrossRef] [PubMed]
- Zhang, C.; Zhang, H.; Zhan, Z.; Liu, B.; Chen, Z.; Liang, Y. Transcriptome analysis of sucrose metabolism during bulb swelling and development in onion (Allium cepa L.). Front. Plant Sci. 2016, 7, 1425. [Google Scholar] [CrossRef] [PubMed]
- Lundmark, M.; Hurry, V.; Lapointe, L. Low temperature maximizes growth of Crocus vernus (L.) Hill via changes in carbon partitioning and corm development. J. Exp. Bot. 2009, 60, 2203–2213. [Google Scholar] [CrossRef] [PubMed]
- Kock, K. Sucrose metabolism: Regulatory mechanisms and pivotal roles in sugar sensing and plant development. Curr. Opin. Plant Biol. 2004, 7, 235–246. [Google Scholar] [CrossRef] [PubMed]
- Gandin, A.; Gutjahr, S.; Dizengremel, P.; Lapointe, L. Source–sink imbalance increases with growth temperature in the spring geophyte Erythronium americanum. J. Exp. Bot. 2011, 62, 3467–3479. [Google Scholar] [CrossRef] [PubMed]
- ITAP. El Cultivo del Azafrán en Castilla-La Mancha. Boletín 88. 2013. Available online: http://www.itap.es/media/43952/bolet_n_088._azafr_n.pdf (accessed on 4 September 2022).
- Satpute, G.; Long, H.; Seguí-Simarro, J.M.; Risueño, M.C.; Testillano, P.S. Cell architecture during gametophytic and embryogenic microspore development in Brassica napus. Acta Physiol. Plant. 2005, 27, 665–674. [Google Scholar] [CrossRef]
- Ruiz, R.; Guardiola, J.L. Carbohydrate and mineral nutrition of orange fruitlets in relation to growth and abscission. Physiol. Plant. 1994, 90, 27–36. [Google Scholar] [CrossRef]
- McCready, R.M.; Guggolz, J.; Silviera, V.; Owens, H.S. Determination of starch and amylose in vegetables. Anal. Chem. 1950, 22, 1156. [Google Scholar] [CrossRef]
- Minebois, R.; Pérez-Torrado, R.; Querol, A. A time course metabolism comparison among Saccharomyces cerevisiae, S. uvarum and S. kudriavzevii species in wine fermentation. Food Microbiol. 2020, 90, 103484. [Google Scholar] [CrossRef] [PubMed]
- Baroja-Fernández, E.; Muñoz, F.J.; Zandueta-Criado, A.; Morán-Zorzano, M.T.; Viale, A.M.; Alonso-Casajús, N.; Pozueta-Romero, J. Most of ADP-glucose linked to starch biosynthesis occurs outside the chloroplast in source leaves. Proc. Natl. Acad. Sci. USA 2004, 101, 13080–13085. [Google Scholar] [CrossRef] [PubMed]
- Hoagland, D.R.; Arnon, D.I. The water-culture method for growing plants without soil. Calif. Agric. Exp. Stn. 1950, 347, 1–32. [Google Scholar]
- Nebauer, S.G.; Renau-Morata, B.; Lluch, Y.; Baroja-Fernández, E.; Pozueta-Romero, J.; Molina, R.V. Influence of crop load on the expression patterns of starch metabolism genes in alternate-bearing citrus trees. Plant Physiol. Biochem. 2014, 80, 105–113. [Google Scholar] [CrossRef] [PubMed]
- Renau-Morata, B.; Carrillo, L.; Cebolla-Cornejo, J.; Molina, R.V.; Martí, R.; Domínguez-Figueroa, J.; Vicente-Carbajosa, J.; Medina, J.; Nebauer, S.G. The targeted overexpression of SlCDF4 in the fruit enhances tomato size and yield involving gibberellin signalling. Sci. Rep. 2020, 10, 10645. [Google Scholar] [CrossRef] [PubMed]
- Müller-Roeber, B.; Sonnewald, U.; Willmitzer, L. Inhibition of the ADP-glucose pyrophosphorylase in transgenic potatoes leads to sugar-storing tubers and influences tuber formation and expression of tuber storage protein genes. EMBO J. 1992, 11, 1229–1238. [Google Scholar] [CrossRef]
- Parra-Vega, V.; Corral-Martínez, P.; Rivas-Sendra, A.; Seguí-Simarro, J.M. Formation and excretion of autophagic plastids (plastolysomes) in Brassica napus embryogenic microspores. Front. Plant Sci. 2015, 6, 94. [Google Scholar] [CrossRef] [PubMed]
- Klionsky, D.J.; Abdelmohsen, K.; Abe, A.; Abedin, M.J.; Abeliovich, H.; Arozena, A.A.; Adachi, H.; Adams, C.M.; Adams, P.D.; Adeli, K.; et al. Guidelines for the use and interpretation of assays for monitoring autophagy. Autophagy 2016, 12, 1–222. [Google Scholar] [CrossRef]
- de Mason, D.A. Function and Development of the Primary Thickening Meristem in the Monocotyledon, Allium cepa L. Bot. Gaz. 1979, 140, 51–66. [Google Scholar] [CrossRef]
- Rodrigues, A.C.; Estelita, M.E.M. Morphoanatomy of the stem in Cyperaceae. Acta Bot. Bras. 2009, 23, 889–901. [Google Scholar] [CrossRef]
- Tribble, C.M.; Martínez-Gómez, J.; Howard, C.C.; Males, J.; Sosa, V.; Sessa, E.B.; Cellinese, N.; Specht, C.D. Get the shovel: Morphological and evolutionary complexities of belowground organs in geophytes. Am. J. Bot. 2021, 108, 372–387. [Google Scholar] [CrossRef] [PubMed]
- Rudall, P. Stem thickening growth in bulbous Iridaceae. Bot. Gaz. 1989, 150, 132–138. [Google Scholar] [CrossRef]
- Yasui, K.; Miyata, K.; Kunisada, J.; Konishi, K. Histological Studies on Corm Development in Freesia. J. Jpn. Soc. Hortic. Sci. 1974, 43, 150–160. [Google Scholar] [CrossRef]
- Yasui, K.; Miyata, K.; Konishi, K. Histological Studies on Formation and thickening Growth of Gladiolus Corms. J. Jpn. Soc. Hortic. Sci. 1974, 42, 371–379. [Google Scholar] [CrossRef]
- Fernie, A.R.; Willmitzer, L. Molecular and biochemical triggers of potato tuber development. Plant Physiol. 2001, 127, 1459–1465. [Google Scholar] [CrossRef] [PubMed]
- Cheng, L.; Li, S.; Yin, J.; Li, L.; Chen, X. Genome-wide analysis of differentially expressed genes relevant to rhizome formation in lotus root (Nelumbo nucifera Gaertn). PLoS ONE 2013, 8, e67116. [Google Scholar] [CrossRef]
- Miao, Y.; Zhu, Z.; Guo, Q.; Yang, X.; Liu, L.; Sun, Y.; Wang, C. Dynamic changes in carbohydrate metabolism and endogenous hormones during Tulipa edulis stolon development into a new bulb. J. Plant Biol. 2016, 59, 121–132. [Google Scholar] [CrossRef]
- Franck, N.; Vaast, P.; Génard, M.; Dauzat, J. Soluble sugars mediate sink feedback down-regulation of leaf photosynthesis in field-grown Coffea arabica. Tree Physiol. 2006, 26, 517–525. [Google Scholar] [CrossRef] [PubMed]
- Nebauer, S.G.; Renau-Morata, B.; Guardiola, J.L.; Molina, R.V. Photosynthesis down-regulation precedes carbohydrate accumulation under sink limitation in Citrus. Tree Physiol. 2011, 31, 169–177. [Google Scholar] [CrossRef]
- van Doorn, W.G. Is the onset of senescence in leaf cells of intact plants due to low or high sugar levels? J. Exp. Bot. 2008, 59, 1963–1972. [Google Scholar] [CrossRef]
- Jadouali, S.M.; Atifi, H.; Mamouni, R.; Majourhat, K.; Bouzoubaa, Z.; Gharby, S. Composition of Saffron By-products (Crocus sativus) in Relation to Utilization as Animal Feed. Agric. Sci. Digest. 2021, 42, 475–481. [Google Scholar] [CrossRef]
- Ma, L.; Ding, S.; Fu, X.; Yan, Z.; Tang, D. Enzymatic and transcriptomic analysis reveals the essential role of carbohydrate metabolism in freesia (Freesia hybrida) corm formation. PeerJ 2021, 9, e11078. [Google Scholar] [CrossRef] [PubMed]
- Cheng, L.; Li, S.; Xu, X.; Hussain, J.; Yin, J.; Zhang, Y.; Li, L.; Chen, X. Identification of differentially expressed genes relevant to corm formation in Sagittaria trifolia. PLoS ONE 2013, 8, e54573. [Google Scholar] [CrossRef] [PubMed]
- Lastdrager, J.; Hanson, J.; Smeekens, S. Sugar signals and the control of plant growth and development. J. Exp. Bot. 2014, 65, 799–807. [Google Scholar] [CrossRef] [PubMed]
- Stander, O.P.J.; Barry, G.H.; Cronjé, P.J.R. Fruit-load-induced starch accumulation causes leaf chlorosis in “off” ‘Nadorcott’ mandarin trees. Sci. Hortic. 2017, 222, 62–68. [Google Scholar] [CrossRef]
- Seng, S.; Wu, J.; Sui, J.; Wu, C.; Zhong, X.; Liu, C.; Liu, C.; Gong, B.; Zhang, F.; He, J.; et al. ADP-glucose pyrophosphorylase gene plays a key role in the quality of corm and yield of cormels in gladiolus. Biochem. Biophys. Res. Commun. 2016, 474, 206–212. [Google Scholar] [CrossRef] [PubMed]
- Xu, J.; Li, Q.; Li, Y.; Yang, L.; Zhang, Y.; Cai, Y. Effect of exogenous gibberellin, paclobutrazol, abscisic acid, and ethrel application on bulblet development in Lycoris radiata. Front. Plant Sci. 2021, 11, 2287. [Google Scholar] [CrossRef]
- Appeldoorn, N.J.; de Bruijn, S.M.; Koot-Gronsveld, E.A.; Visser, R.G.; Vreugdenhil, D.; van der Plas, L.H. Developmental changes of enzymes involved in conversion of sucrose to hexose-phosphate during early tuberisation of potato. Planta 1997, 202, 220–226. [Google Scholar] [CrossRef]
- Morrell, S.; Rees, T. Sugar metabolism in developing tubers of Solanum tuberosum. Phytochemistry 1986, 25, 1579–1585. [Google Scholar] [CrossRef]
- Verma, A.K.; Agarwal, A.K.; Dubey, R.S.; Solomon, S.; Singh, S.B. Sugar partitioning in sprouting lateral bud and shoot development of sugarcane. Plant Physiol. Biochem. 2013, 62, 111–115. [Google Scholar] [CrossRef]
- Sung, S.J.S.; Xu, D.P.; Black, C.C. Identification of actively filling sucrose sinks. Plant Physiol. 1989, 89, 1117–1121. [Google Scholar] [CrossRef] [PubMed]
- Baroja-Fernández, E.; Muñoz, F.J.; Montero, M.; Etxeberria, E.; Sesma, M.T.; Ovecka, M.; Bahaji, A.; Ezquer, I.; Li, J.; Prat, S.; et al. Enhancing sucrose synthase activity in transgenic potato (Solanum tuberosum L.) tubers results in increased levels of starch, ADPglucose and UDPglucose and total yield. Plant Cell Physiol. 2009, 50, 1651–1662. [Google Scholar] [CrossRef] [PubMed]
- Li, J.; Seng, S.; Li, D.; Zhang, F.; Liu, Y.; Yao, T.; Liang, J.; Yi, M.; Wu, J. Antagonism between abscisic acid and gibberellin regulates starch synthesis and corm development in Gladiolus hybridus. Hortic. Res. 2021, 8, 155. [Google Scholar] [CrossRef] [PubMed]


Disclaimer/Publisher’s Note: The statements, opinions and data contained in all publications are solely those of the individual author(s) and contributor(s) and not of MDPI and/or the editor(s). MDPI and/or the editor(s) disclaim responsibility for any injury to people or property resulting from any ideas, methods, instructions or products referred to in the content. |
© 2024 by the authors. Licensee MDPI, Basel, Switzerland. This article is an open access article distributed under the terms and conditions of the Creative Commons Attribution (CC BY) license (https://creativecommons.org/licenses/by/4.0/).
Share and Cite
Pallotti, C.; Renau-Morata, B.; Cardone, L.; Nebauer, S.G.; Albiñana Palacios, M.; Rivas-Sendra, A.; Seguí-Simarro, J.M.; Molina, R.V. Understanding the Saffron Corm Development—Insights into Histological and Metabolic Aspects. Plants 2024, 13, 1125. https://doi.org/10.3390/plants13081125
Pallotti C, Renau-Morata B, Cardone L, Nebauer SG, Albiñana Palacios M, Rivas-Sendra A, Seguí-Simarro JM, Molina RV. Understanding the Saffron Corm Development—Insights into Histological and Metabolic Aspects. Plants. 2024; 13(8):1125. https://doi.org/10.3390/plants13081125
Chicago/Turabian StylePallotti, Claudia, Begoña Renau-Morata, Loriana Cardone, Sergio G. Nebauer, Mireia Albiñana Palacios, Alba Rivas-Sendra, José M. Seguí-Simarro, and Rosa V. Molina. 2024. "Understanding the Saffron Corm Development—Insights into Histological and Metabolic Aspects" Plants 13, no. 8: 1125. https://doi.org/10.3390/plants13081125
APA StylePallotti, C., Renau-Morata, B., Cardone, L., Nebauer, S. G., Albiñana Palacios, M., Rivas-Sendra, A., Seguí-Simarro, J. M., & Molina, R. V. (2024). Understanding the Saffron Corm Development—Insights into Histological and Metabolic Aspects. Plants, 13(8), 1125. https://doi.org/10.3390/plants13081125