Article

Mapping of a Quantitative Trait Locus for Stay-Green Trait in Common Wheat

Shanxi Key Laboratory of Crop Genetics and Molecular Improvement, College of Agronomy, Shanxi Agricultural University, Taiyuan 030031, China
*
Authors to whom correspondence should be addressed.
These authors contributed equally to this work.
Plants 2025, 14(5), 727; https://doi.org/10.3390/plants14050727
Submission received: 11 February 2025 / Revised: 23 February 2025 / Accepted: 25 February 2025 / Published: 27 February 2025
(This article belongs to the Special Issue QTL Mapping of Seed Quality Traits in Crops, 2nd Edition)

Abstract

:
The stay-green (SG) trait enhances photosynthetic activity during the late grain-filling period, benefiting grain yield under drought and heat stresses. CH7034 is a wheat breeding line with SG. To clarify the SG loci carried by CH7034 and obtain linked molecular markers, in this study, a recombinant inbred line (RIL) population derived from the cross between CH7034 and non-SG SY95-71 was genotyped using the Wheat17K single-nucleotide polymorphism (SNP) array, and a high-density genetic map covering 21 chromosomes and consisting of 2159 SNP markers was constructed. Then, the chlorophyll content of flag leaf from each RIL was estimated for mapping, and one QTL for SG on chromosome 7D was identified, temporarily named QSg.sxau-7D, with the maximum phenotypic variance explained of 8.81~11.46%. A PCR-based diagnostic marker 7D-16 for QSg.sxau-7D was developed, and the CH7034 allele of 7D-16 corresponded to the higher flag leaf chlorophyll content, while the 7D-16 SY95-71 allele corresponded to the lower value, which confirmed the genetic effect on SG of QSg.sxau-7D. QSg.sxau-7D located in the 526.4~556.2 Mbp interval is different from all the known SG loci on chromosome 7D, and 69 high-confidence annotated genes within the interval expressed throughout the entire period of flag leaf senescence. Moreover, results of an association analysis based on the diagnostic marker showed that there is a positive correlation between QSg.sxau-7D and thousand-grain weight. Our results revealed a novel QTL QSg.sxau-7D whose CH7034 allele had a strong effect on SG, which can be applied in further wheat molecular breeding.

1. Introduction

The world population will reach approximately 10 billion by 2050. At the appointed time, the food demand is estimated to be 35~56% higher than that in 2010, and this number may increase to over 60%, considering the impact of extreme weather such as drought and high temperature due to global warming, which is needed for the significant improvement of grain production [1,2]. As one of the most widely grown crops in the world, wheat (Triticum aestivum L., 2n = 6x = 42) contributes about 20% of the total calories for the human diet and plays a key role in global food security [3]. Enhancements of the resistance to drought and heat of wheat varieties to cope with climate change and thereby increasing yield is an important goal for breeders worldwide, which requires a better understanding of the complex genetic architecture of grain yield and its constituent traits [3,4,5].
Stay-green (SG) trait, characterized by a longer green state of crop leaves in the late period of grain-filling, can provide more photosynthetic products, thereby increasing grain yield [6]. SG phenotype was initially described in Vicia faba breeding [7], and later on, it was established as an excellent feature for many grain crops such as sorghum [8], maize [9], rice [10], and barley [11]. In wheat, SG is associated with desirable morphological traits, including a higher number of tillers and grains per spike, enhanced resistance to stem lodging, and increased fertility of spikes [12,13,14]. Moreover, the beneficial roles of SG in wheat yield improvement under drought and heat stresses have been widely reported [15,16,17,18].
Physiologically speaking, SG is a manifestation of impaired or delayed chlorophyll catabolism in leaves. Research on chlorophyll synthesis and degradation pathways deepened our understanding of SG [19,20]. In plant leaves, chlorophyll a and chlorophyll b are synthesized through the magnesium (Mg) branch of tetrapyrrole biosynthesis and participate in photosynthesis. In this pathway, Mg2+ is inserted into the chlorophyll precursor, protoporphyrin IX, under the catalysis of magnesium chelating enzyme (MgCh), initiating the first step of biosynthesis. MgCh is composed of subunits CHLOROPHYLL I (CHLI), CHLD, and CHLH [21]. In wheat, the mutation of TaCHLI gene caused yellow-green leaves due to a decrease in chlorophyll content [22,23]. When the leaves age normally, the reactive oxygen species (ROS) increase and chlorophyll degrades in mesophyll cells, leading to leaf chlorosis. Furthermore, the chlorophyll degradation pathway involves chlorophyllase (CHLase)-catalyzed dephytylation of chlorophyll molecules into specific chlorophyllide followed by removal of the Mg2+ by Mg-dechelatase [24]. The expression level of wheat TaCHLase gene in the leaves of SG varieties was significantly lower than that of non-SG varieties [25]. Therefore, gene mutations in the above metabolic pathways, which cause a decrease in chlorophyll degradation or a sustained biosynthesis of chlorophyll in excess of the activity of the catabolic pathway, will result in the SG phenotype. The broad definition of SG includes five types [6]. Type-A and type-B belong to functional SG, while the other three types are considered cosmetic SG that are not interrelated with plant yield. Only type-A delays the onset of leaf senescence and prolongs the time of photosynthesis. For type-B, senescence occurs on schedule but proceeds relatively slowly. For the cosmetic SG, the senescence is initiated in the normal period; however, leaf greenness is maintained on the surface due to the failure of the chlorophyll degradation with weakened photosynthesis (type-C), or chlorophyll remaining because of freezing or drying (type-D), or the intensely green germplasm containing the high content of chlorophyll (type-E). Among the above-mentioned types, type-A can significantly increase photosynthetic products. In addition, due to the delayed senescence of type-A germplasm, the function of ROS scavenging in plant cells still exists. Therefore, compared with other SG types or non-SG germplasms, type-A germplasm shows better tolerance to abiotic stress such as high temperature and drought, which is the most important for agricultural production [26,27].
In the past decades, wheat breeders used forward genetics methods to screen SG with heritability and its linked molecular markers, in order to apply them to breeding. Multitudinous loci regulating SG were detected on all 21 chromosomes of wheat [28,29]. However, in some research, due to the adoption of relatively simple indicators such as grading scores for leaf color and duration of green leaves to record the SG phenotype [30,31], or the use of simple sequence repeats (SSR) markers for mapping [32,33,34], most SG loci showed low phenotypic variance explained (PVE) values or with distant linkage markers, which limits their breeding applications. With the development of biotechnology, chlorophyll meters have gradually been used in recent years to accurately measure the SG phenotypes of populations, and single nucleotide polymorphism (SNP) chips have also been used to perform genetic mapping. Currently, flag leaf chlorophyll content is used as an important phenotype data for quantitative trait locus (QTL) mapping for SG based on a high-density genetic map. In a recombinant inbred line (RIL) population containing 309 lines derived from the cross of spring wheat cultivars Worrakatta and Berkut, one QTL for chlorophyll content, QCC.xjau-1DS, was identified on chromosome 1D with the phenotypic variation explained (PVE) ranging from 5.3% to 5.8% [35]. In another RIL population consisting of 165 lines derived from winter wheat cross DH118 × Jinmai 919, four QTLs for chlorophyll content, including Qchl.saw-3B.2, Qchl.saw-5A.2, Qchl.saw-5A.3, and Qchl.saw-3B.2, were detected, and the PVE ranged from 5.91% to 7.24% [36]. Moreover, in a doubled haploid (DH) population with 201 lines constructed by the winter wheat crossing Jinmai 47 × Jinmai 84, six major QTLs Qchl.saw-2B.1, Qchl.saw-3B.1, Qchl.saw-4D.1, Qchl.saw-4D.2, Qchl.saw-5A.9, and Qchl.saw-6A.4 were detected under multiple phosphorus conditions, with the PVE ranging from 3.07% to 31.66% [37]. In winter wheat Hanxuan10 × Lumai14 DH population containing 150 lines, 28 QTLs for chlorophyll content with the PVE ranging from 5.8% to 21.4% were identified on 11 chromosomes [38].
Here, we reported an SG wheat breeding line CH7034. A RIL population was created via the cross of CH7034 and a non-SG breeding line, and QTL for chlorophyll content of flag leaf was detected based on a high-density genetic map, in order to provide germplasm resources tolerant to stress and related molecular markers for wheat breeding.

2. Material and Methods

2.1. Plant Materials and Experimental Conditions

The SG wheat breeding line CH7034 (CH) was bred by the College of Agronomy of Shanxi Agricultural University, and the non-SG breeding line SY95-71 (SY) was bred by the Triticeae Research Institute of Sichuan Agricultural University. CH and SY were crossed to generate an RIL population by single seed descent from the F2 individual plants [39], and a set of 184 RILs was planted in the greenhouse at Shanxi Agricultural University (Jinzhong, China) in 2019, 2023, and 2024. In early November of the three years mentioned above, fifteen seeds from each RIL and the parents were planted in a row of 1.5 m in length, with a plant spacing of approximately 10 cm.

2.2. Phenotyping of SG

The chlorophyll content of the flag leaf was measured to evaluate SG capability. In brief, ten plants were randomly selected from each RIL and the parents at the grain-filling stage, and the relative chlorophyll content, represented as the soil and plant analyzer development (SPAD) value, was measured in the middle of the flag leaves by using chlorophyll meter SPAD-502 Plus (Konica Minolta Sensing Inc., Tokyo, Japan). An average of SPAD value on 10 plants was numerated and recorded for each RIL and the parents, and the best linear unbiased estimation (BLUE) values of SPAD data in three years were finally calculated by Genstat (version 22) software.

2.3. Genotyping and QTL Mapping

Genomic DNA was extracted from leaves of RILs and their parents at seedling stage and then genotyped by a Wheat17K SNP chip containing 17,526 markers (Diversity Arrays Technology Pty Ltd., Canberra, Australia). For the genotypic data, the parent-polymorphic SNP markers with less than 20% missing values and precise positioning information on the Chinese Spring genome (version 1.0, International Wheat Genome Consortium, Eau Claire, WI, USA) were screened to construct linkage groups by running the MAP program of IciMapping (version 4.0) software. Then, integrating with SPAD–BLUE values of RILs, QTL analysis was performed using the Kosambi function under the BIP program of ICIMapping software, setting the threshold value of the logarithm of the odds as 2.5.

2.4. Diagnostic Marker Developing

A PCR-based diagnostic marker for SG was developed as described previously [40]. First, SSR loci within the target genome segment were searched by SSRHunter (version 1.3) software, and specific primers were designed for these loci (Table 1). Afterward, primer pairs were used for amplifying the genomic DNA of CH and SY, and then the markers with parental polymorphism were screened for genotyping in the RIL population. The amplification condition was as follows: 94 °C for 30 s, 36 cycles of 94 °C for 30 s, 58 °C for 30 s, and then 72 °C for 30 s, with a final extension of 72 °C for 3 min. Polyacrylamide gel electrophoresis was used for differentiating the PCR products. Finally, these SSR markers were integrated into the QTL map, and the marker under the peak was used as the diagnostic marker.

2.5. Expression Pattern of Annotated Genes Within QTL

A set of publicly available transcriptome data [41] involving wheat flag leaves at different days after anthesis (DAA) was used for analyzing the expression patterns of high-confidence annotated genes within target QTL, as described previously [42]. In brief, the transcriptome data were downloaded from the National Center for Biotechnology Information (NCBI) database (www.ncbi.nlm.nih.gov, accessed on 31 December 2024) using accession number PRJNA497810. Filtered reads were mapped to the Chinese Spring genome (version 1.0), and the number of transcripts aligned to each gene was calculated and normalized to transcripts per kilobase million (TPM) values. Then, the TPM values of annotated genes were selected to generate a heatmap on the SRplot platform (www.bioinformatics.com.cn/SRplot, accessed on 10 January 2025).

2.6. Association Analysis Between SG-QTL and Agronomic Traits

A diagnostic marker of SG-QTL was used to conduct differential analysis for agronomic phenotypes corresponding to the two SG-QTL alleles, as described previously [43]. Phenotypic data were obtained from the CH × SY RIL population in 2024, which was planted in the greenhouse at Shanxi Agricultural University as described in Section 2.1. For spike traits, the spike number per plant, spike length, and spikelet number per spike were investigated. For grain traits, the thousand-grain weight, grain length, grain width, and grain area were evaluated using the TPKZ-3 intelligent seed test and analysis system (Top Cloud-Agri Technology Co., Ltd., Hangzhou, China).

2.7. Statistical Analysis

The Origin (version 3.1) software was used to perform the statistical analysis by one-way analysis of variance (ANOVA), and p < 0.05 was considered a significant difference, while p < 0.01 was considered an extremely significant difference.

3. Results

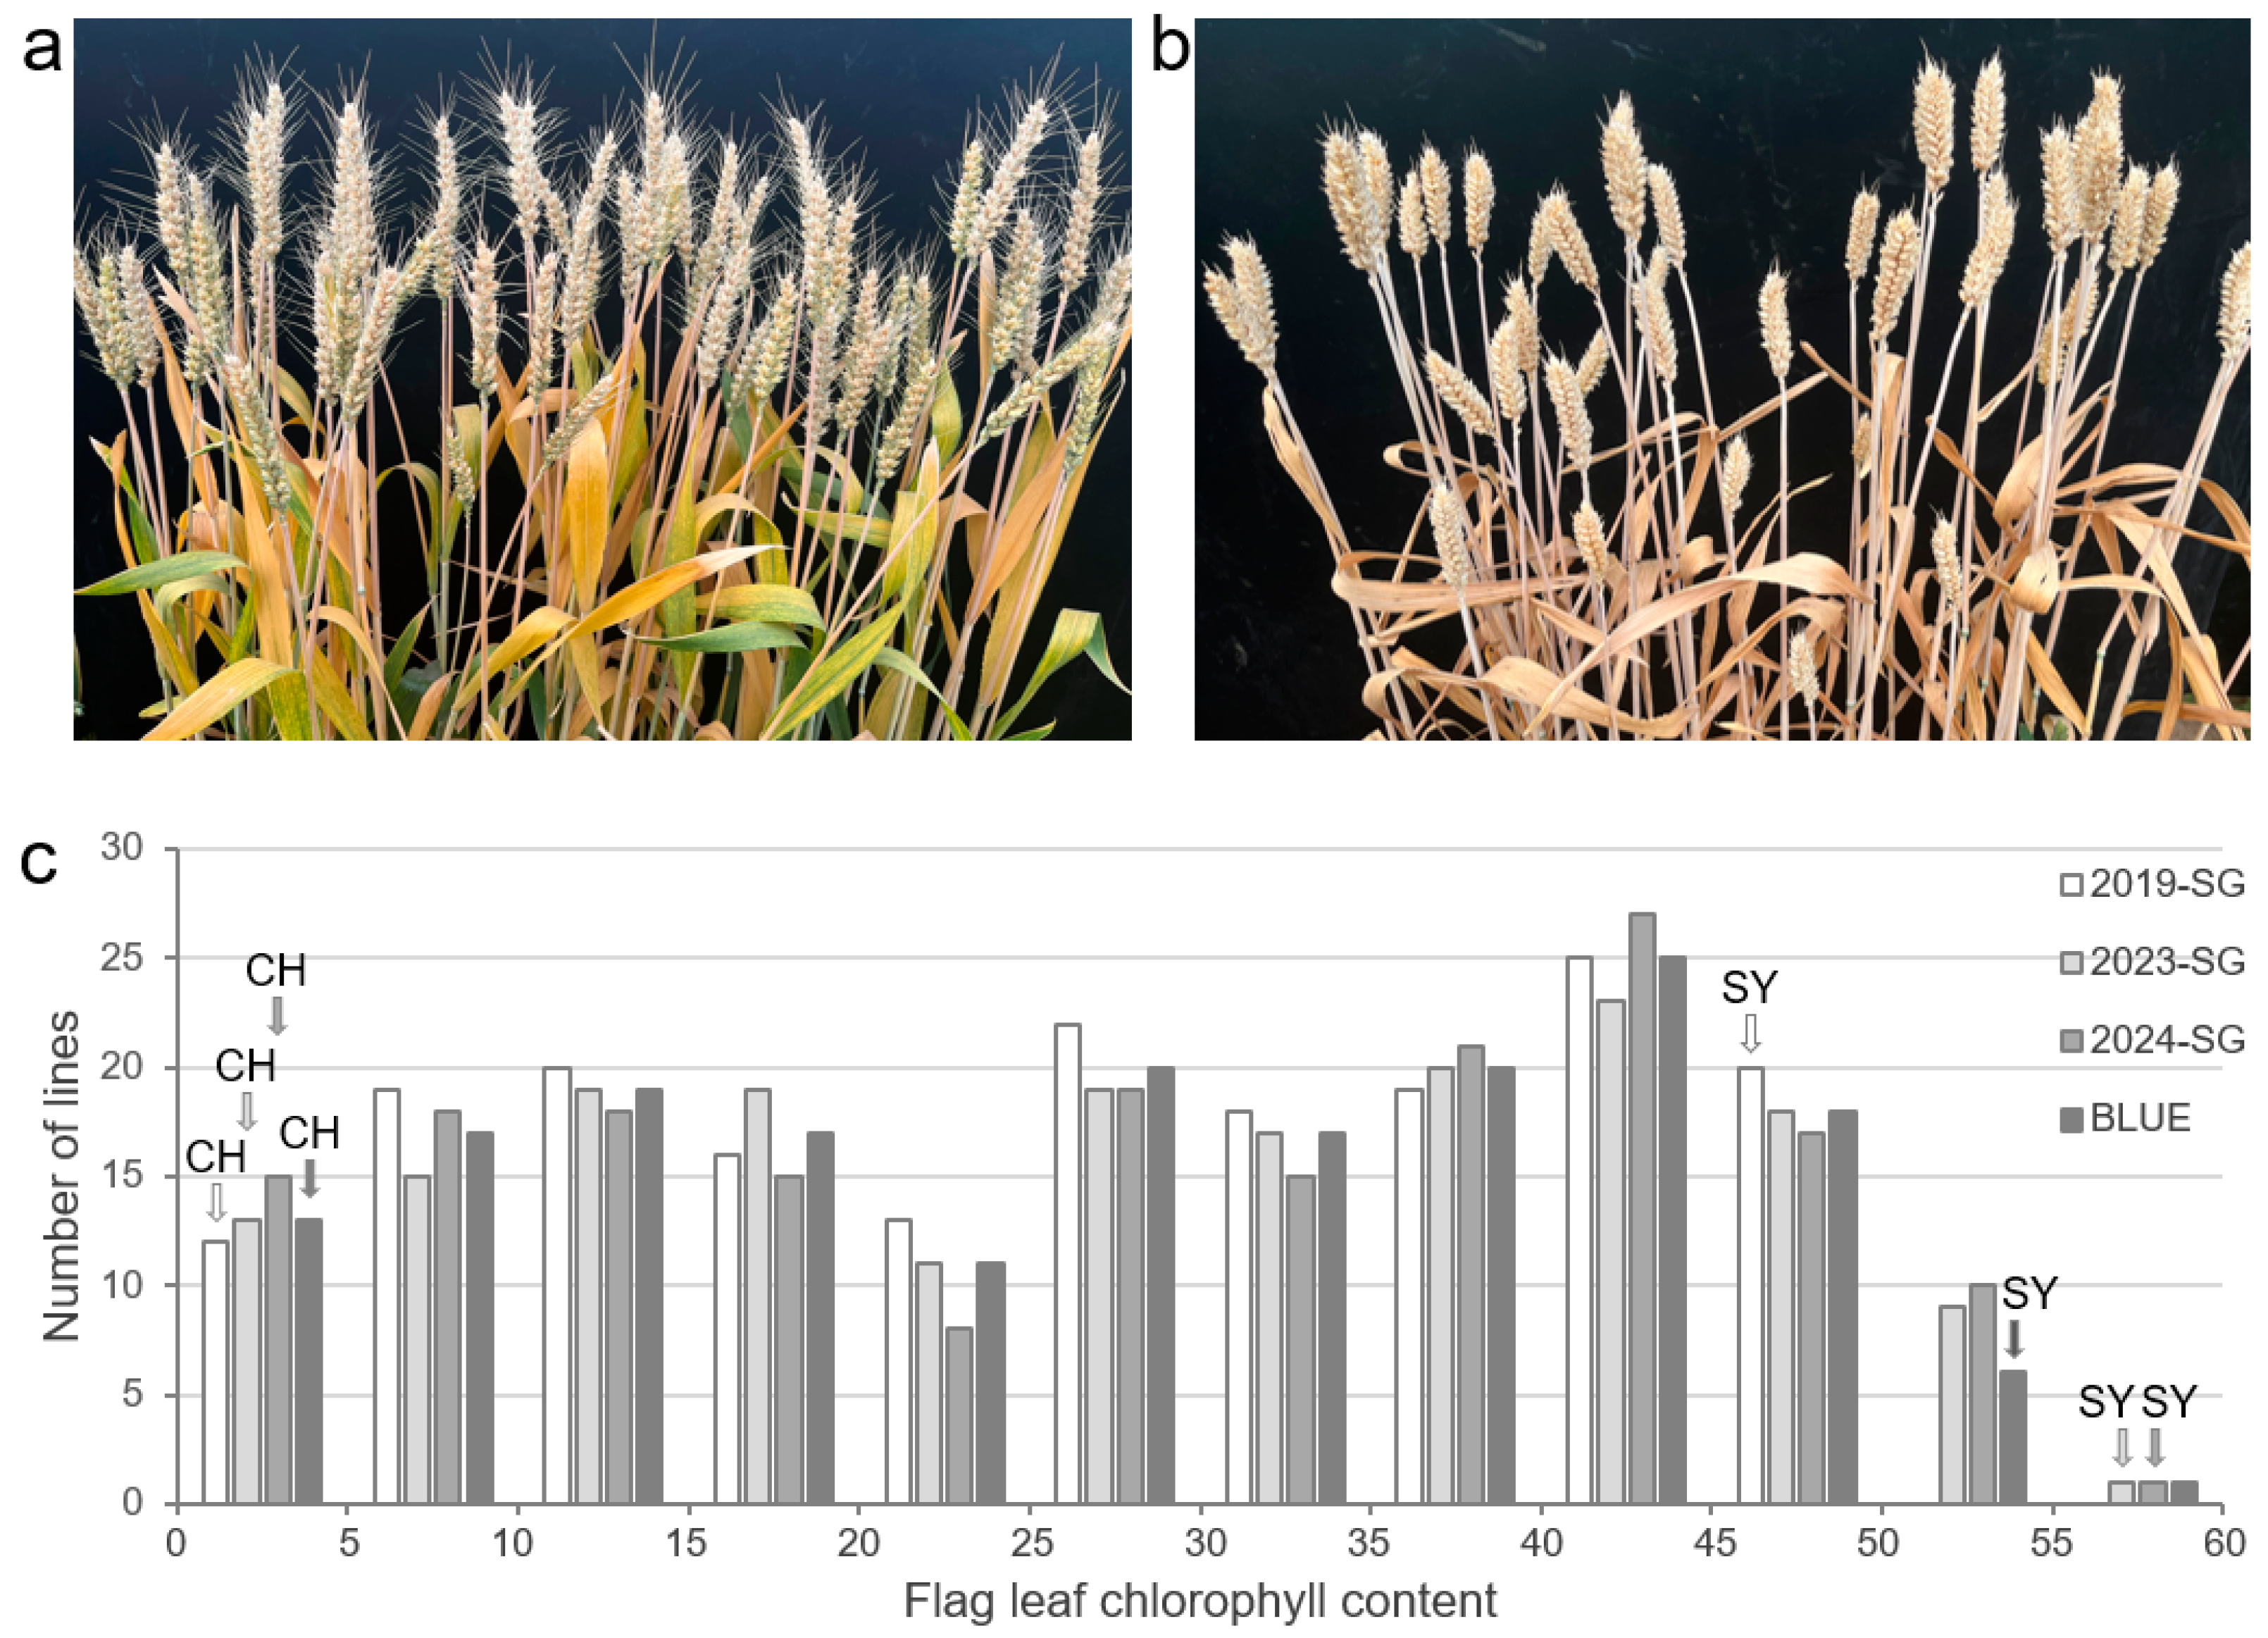
3.1. Assessment of SG for CH and SY

The two breeding lines CH and SY have large differences in leaf color at the grain-filling stage. CH showed the SG phenotype and the chlorophyll content of its flag leaves ranged from 3.43 to 4.12, whereas SY showed aging and yellow flag leaves with a chlorophyll content of 42.27~50.39. The BLUE value of chlorophyll content in CH was significantly higher than those in SY (p < 0.0001) (Table 2).

3.2. Phenotypic Variance of SG in the CH × SY RILs

SG showed segregation in the RIL population derived from the cross of CH and SY, which ranged from 1.66 to 57.28, with the coefficient of variation values of 0.32~0.56 (Figure 1, Table 2). According to the phenotypic data of three years and the derived BLUE dataset, flag leaf chlorophyll content in the RILs exhibited continuous distribution (not normal distribution) and transgressive segregation, indicating that SG was a complex trait controlled by multi-genes (Figure 1).

3.3. Genetic Mapping of SG

A total of 2359 SNPs with parental polymorphism from the 17K SNP chip were screened after removing the redundant or excessive missing data (Figure 2). These SNP markers were assembled into 21 chromosomes to form a genetic map for the RILs with a marker density of 1.94 cM per marker. Based on the linkage map and the phenotypic data, two genomic regions on chromosomes 5A and 7D were found to have significant effects on the SG trait in 2019, with a PVE of 5.77% and 11.46%, respectively; two genomic regions on chromosomes 2B and 7D involving SG were identified in 2023, with a PVE of 5.24% and 10.62%, respectively; and one genomic region on chromosome 7D with a PVE of 8.81% was found to have significant effects on the SG trait in 2024 (Table 3). Among them, the QTL on chromosome 7D, temporarily named QSg.sxau-7D, was detected in the three years and with the PVE of 10.33% based on the BLUE value (Table 3).

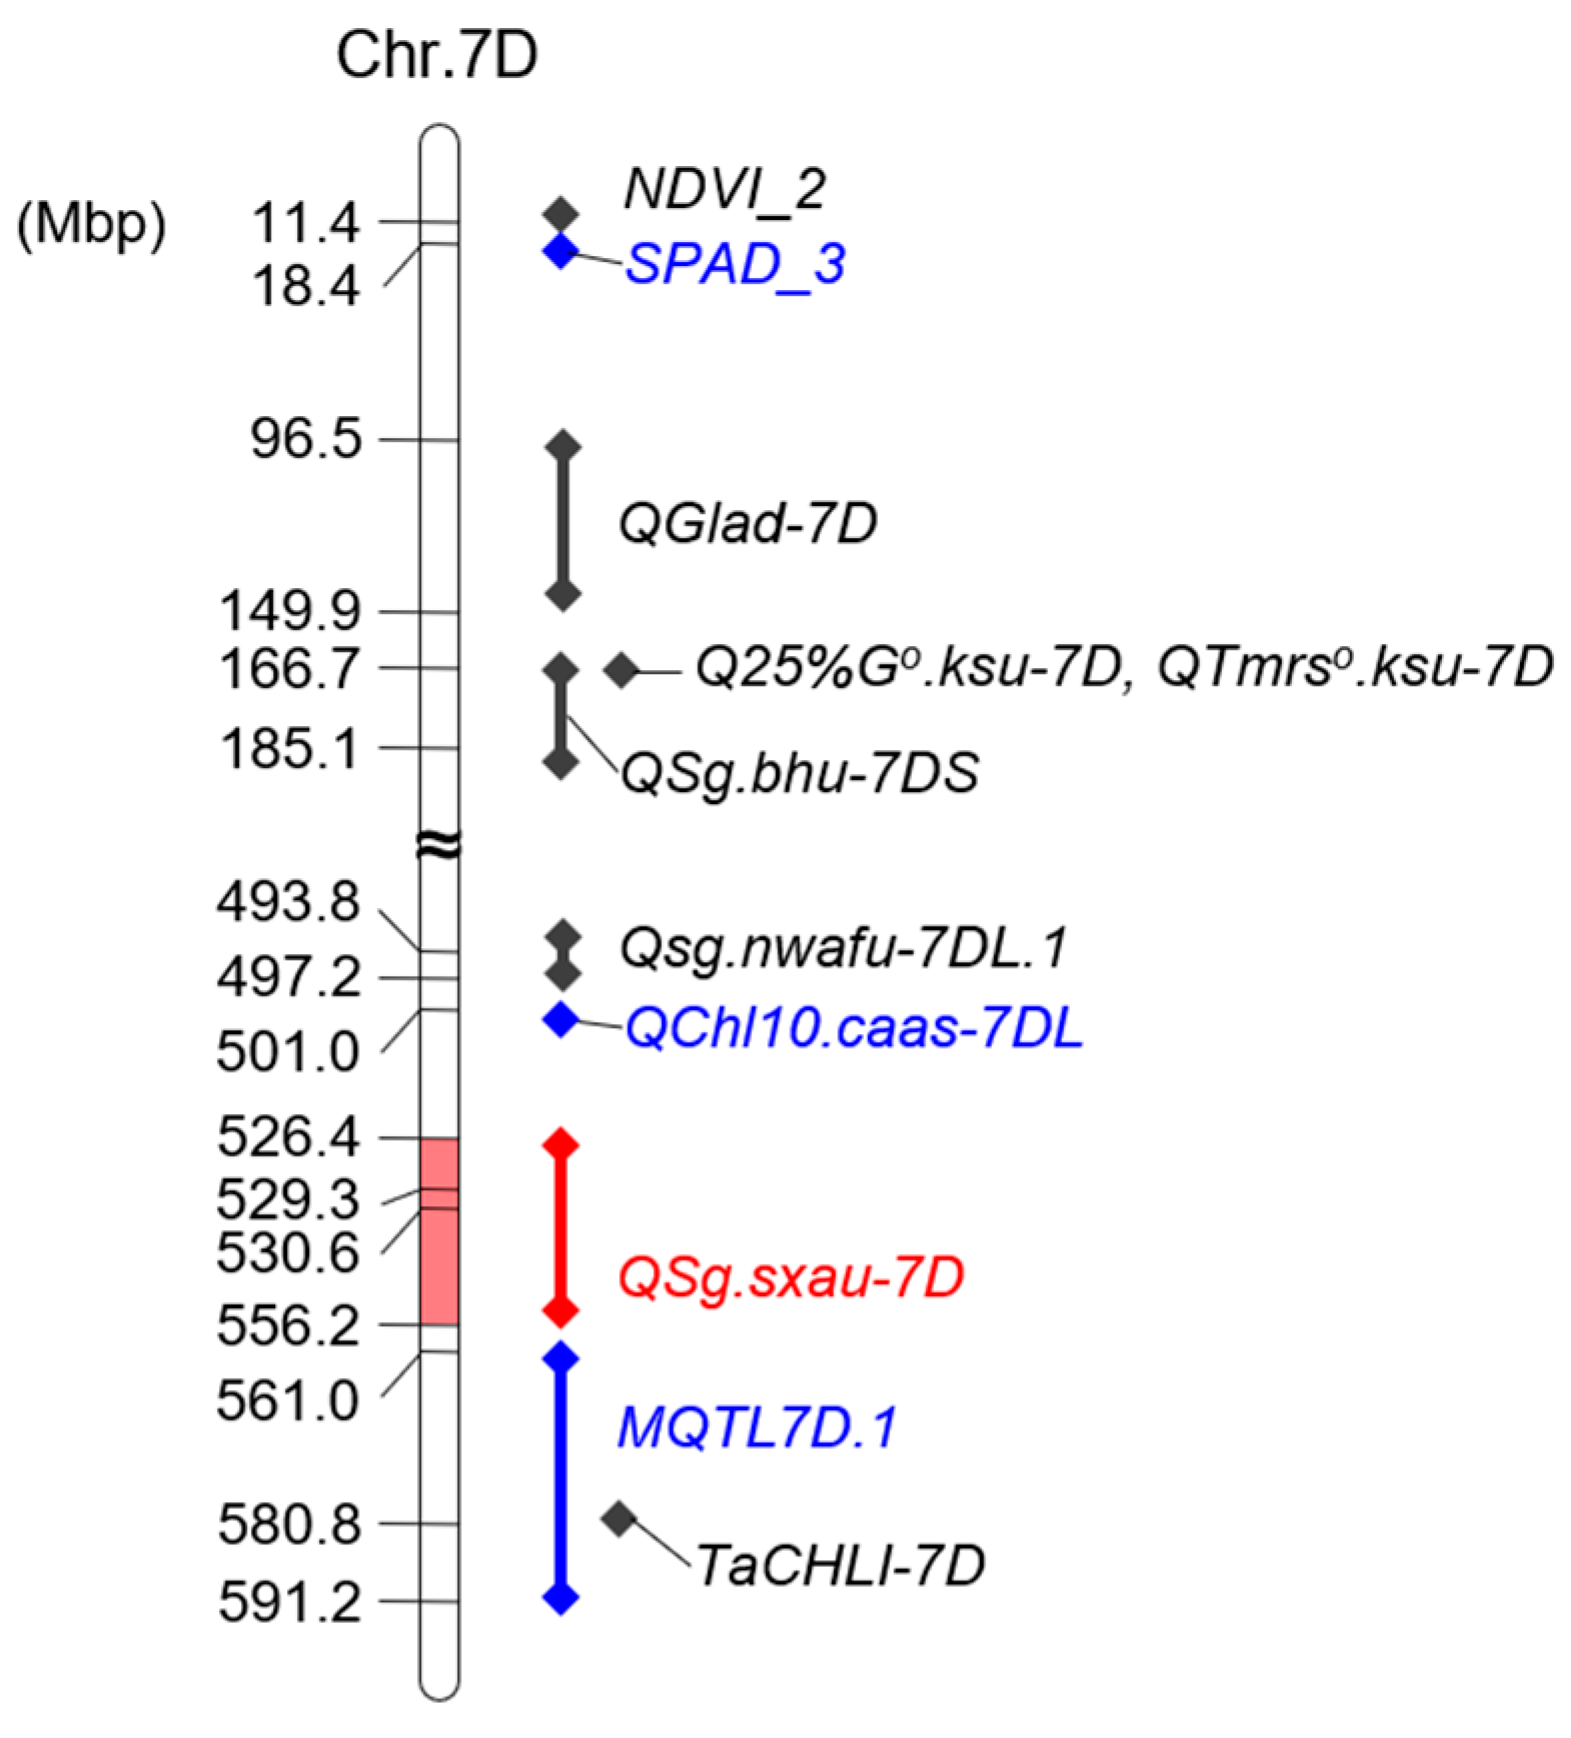
3.4. Verification of QSg.sxau-7D

To verify the mapping results, PCR-based markers for QSg.sxau-7D were developed. QSg.sxau-7D was mapped to a 11.6 cM interval flanked by markers 1004225 (chr.7D: 526,446,716) and 2242097 (chr.7D: 556,246,143), corresponding to a physical range of 29.8 Mbp (Figure 3a,b). We randomly designed SSR primer pairs within the genome segment that ranged from 10 Mbp upstream of 1004225 to 10 Mbp downstream of 2242097, and six pairs of primers, including 7D-1, 7D-31, 7D-32, 7D-36, 7D-16, and 7D-19, were showed polymorphisms between CH and SY. These parent-polymorphic markers were used for amplifying the CH × SY RIL population and finally integrating into QSg.sxau-7D map. The SSR marker 7D-16 under the peak of QSg.sxau-7D was used as the diagnostic marker (Figure 3c).

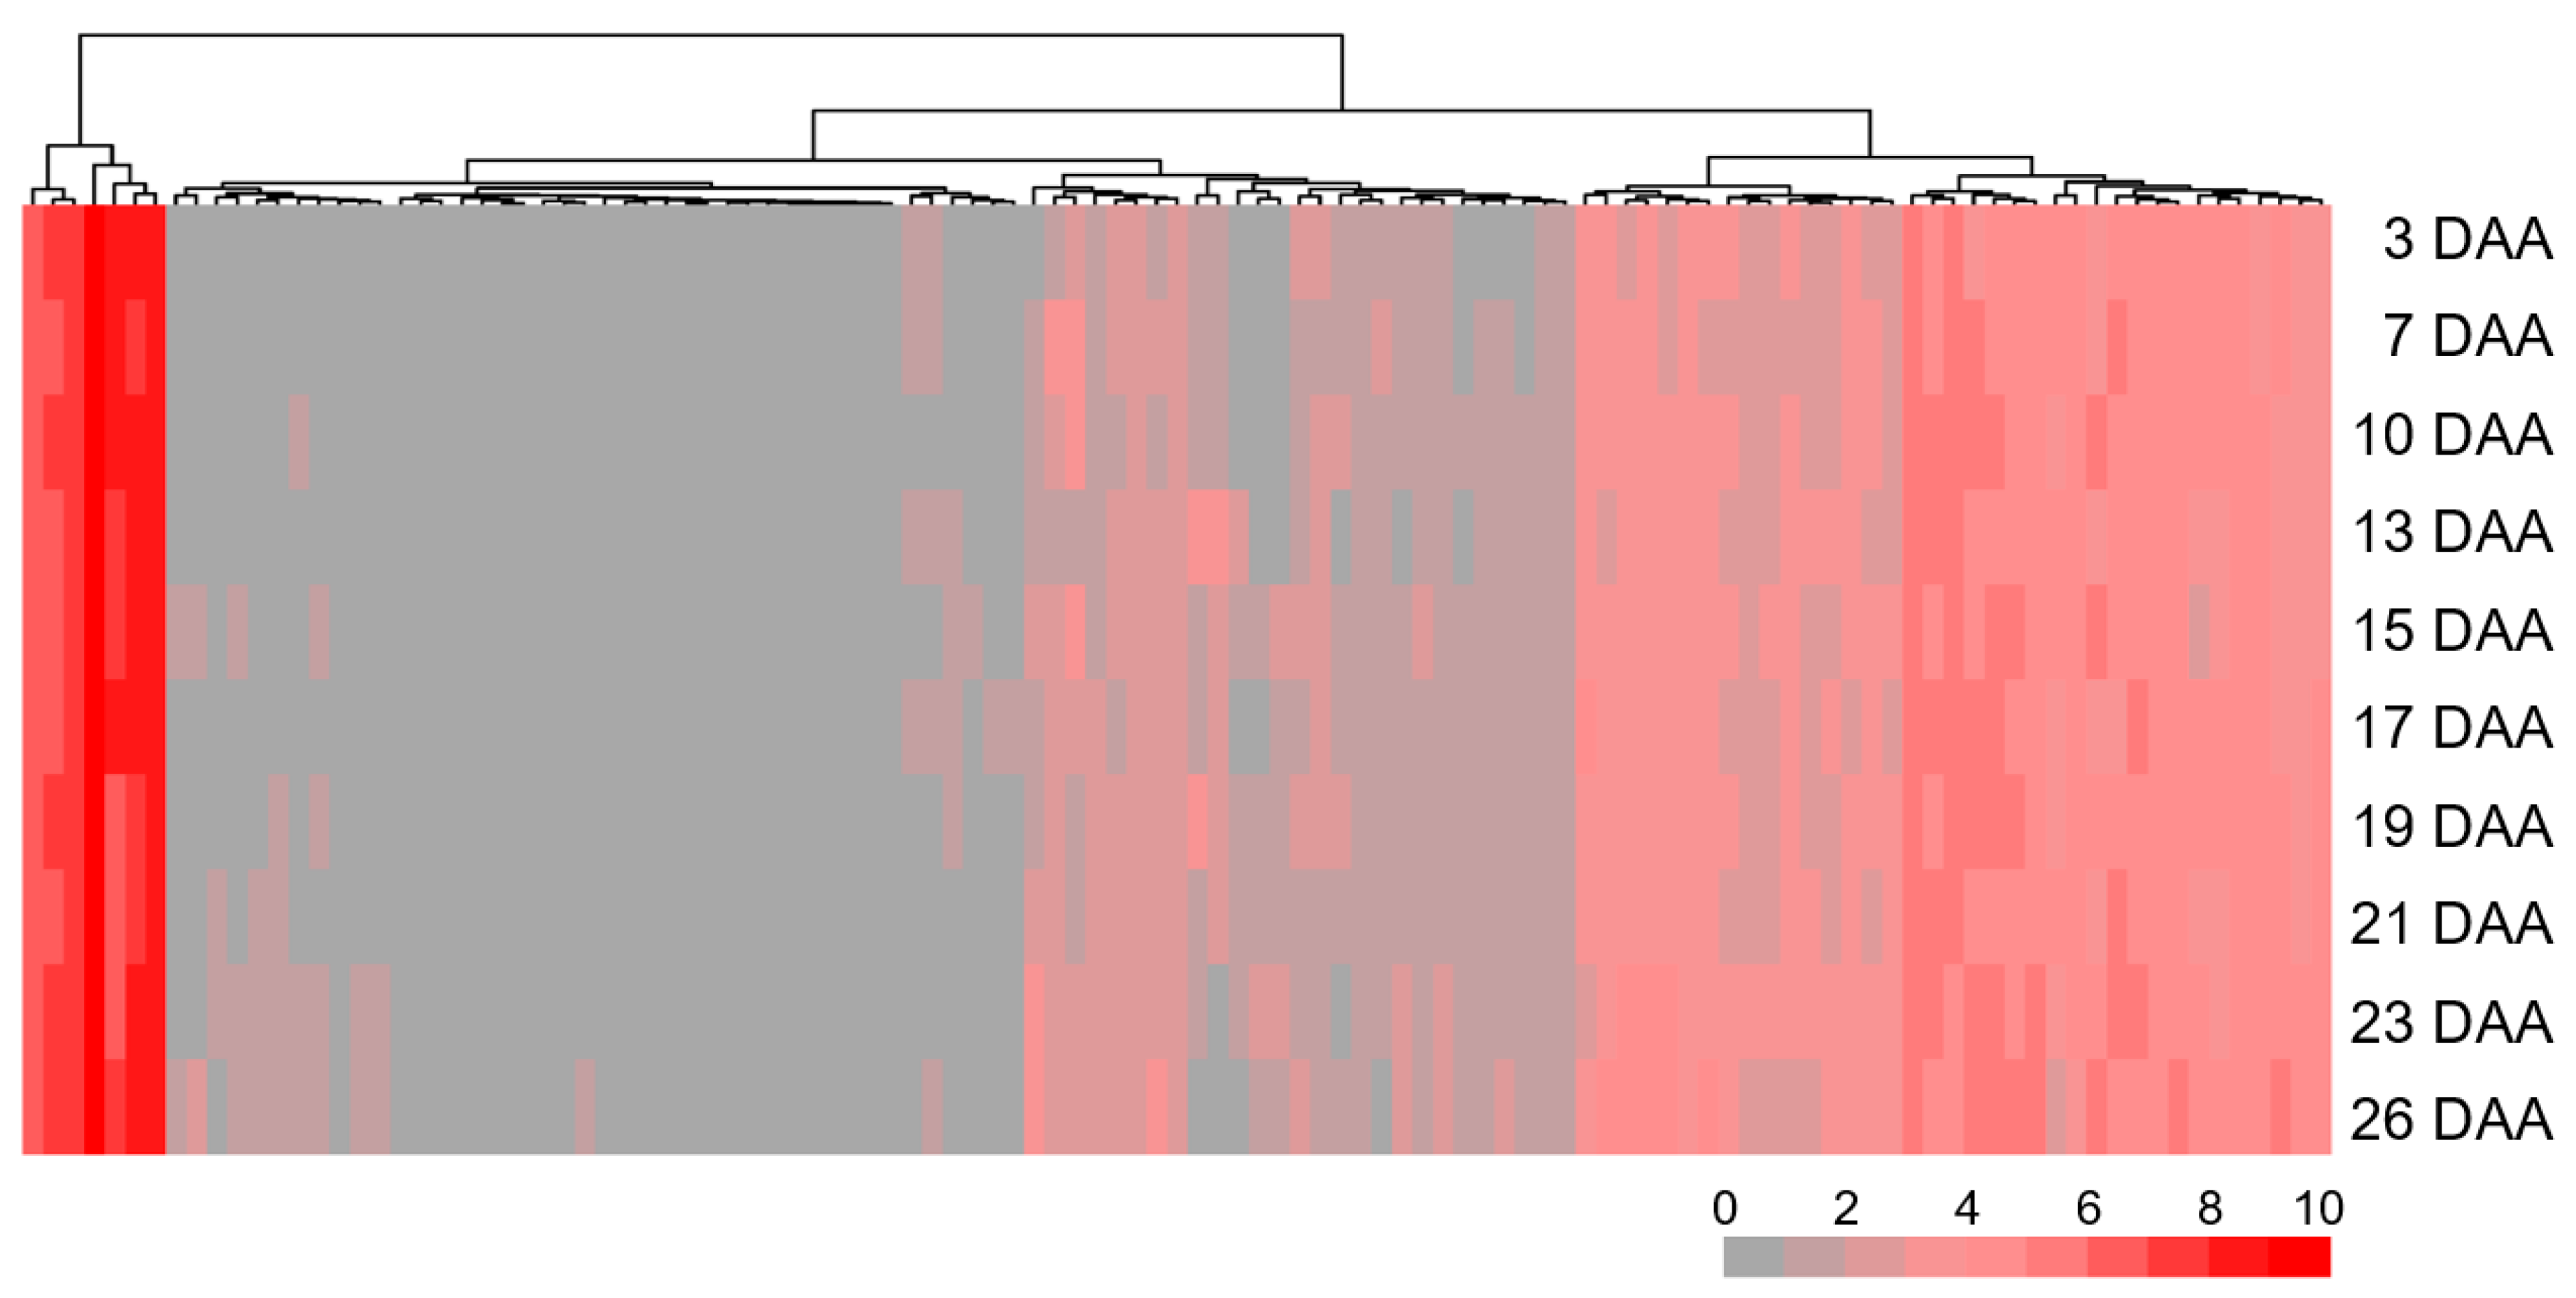
3.5. Annotated Genes Within QSg.sxau-7D

There are 280 high-confidence genes in the QSg.sxau-7D interval (chr.7D: 526,446,716–556,246,143) according to the annotation of coding sequences (RefSeq v1.1) in the Chinese Spring genome database (Table S1). Based on published data [41], 167 annotated genes were not expressed in wheat flag leaf from the main tiller after anthesis. The remaining 113 expressed genes mainly involved DNA binding or protein binding in the category of molecular function based on their gene ontology annotation (Table S1), and 69 of which were expressed throughout the entire period of flag leaf senescence, including TraesCS7D01G409100 encoded Myb transcription factor (MYB), TraesCS7D01G415100 encoded zinc finger CCHC-type protein (ZCCHC), and TraesCS7D01G409700 and TraesCS7D01G436800 encoded auxin response factor (ARF) (Figure 4, Table S2).

3.6. The Correlation Between QSg.sxau-7D and Agronomic Traits

Based on the phenotypic data of the CH × SY RIL population in 2024, the CH allele of the diagnostic marker 7D-16 corresponded to the higher flag leaf chlorophyll content, while the 7D-16 SY allele corresponded to the lower value (p = 2.09 × 10⁻⁵), which confirmed the effect on SG of QSg.sxau-7D (Figure 5). Furthermore, 7D-16 was also used for testing the effects of QSg.sxau-7D on agronomic traits. For spike traits, RILs carrying QSg.sxau-7D CH allele showed a lower spikelet number per spike than that carrying the SY allele (p = 0.00013). There are no significant correlations between QSg.sxau-7D and spike number per plant (p = 0.09) or spike length (p = 0.22). For grain traits, RILs carrying the QSg.sxau-7D CH allele showed a higher thousand-grain weight than that carrying the SY allele (p = 0.03). No significant correlation was shown between QSg.sxau-7D and grain length (p = 0.97), grain width (p = 0.24), as well as grain area (p = 0.54).

4. Discussion

4.1. QSg.sxau-7D Is a Novel SG Locus

QSg.sxau-7D was located in the chr.7D:526.4~556.2 Mbp physical position on the long arm of chromosome 7D. Currently, a total of nine loci related to SG, which were evaluated by SPAD value, normalized difference vegetation index (NDVI), green leaf area duration (GLAD), or leaf area under greenness (LAUG), have been reported on chromosome 7D (Figure 6). Among them, NDVI_2, SPAD_3 [44], Qglad-7D [45], Q25%Go.ksu-7D, Qtmrso.ksu-7D [46], and QSg.bhu-7DS [47] were mapped on the short arm of chromosome 7D. Moreover, on the chromosome long arm, Qsg.nwafu-7DL.1 was located in the chr.7D:493.8~497.2 Mbp interval [48], QChl10.caas-7DL was located in the chr.7D:501.0 Mbp position [49], while MQTL7D.1 was mapped to the physical locations of the chr.6B:561.0~591.2 Mbp [29] that contained a chlorophyll synthesis gene TaCHLI-7D [23]. In summary, the locations of all reported SG-QTLs mentioned above are different from those of QSg.sxau-7D, so QSg.sxau-7D should be a novel SG-locus. In addition, a QTL for drought survival rate (DSR) [50] was located in the QSg.sxau-7D region. It was reported that SG enhances the drought tolerance of wheat [15,16,18], so, we will further investigate whether QSg.sxau-7D is associated with drought resistance.

4.2. Prediction of Candidate Genes for QSg.sxau-7D

There are 280 high-confidence genes in the QSg.sxau-7D interval according to the annotation of coding sequences in the Chinese Spring genome, 69 of which were expressed in wheat flag leaf throughout the entire period of senescence, including several genes encoding transcription factors such as TaARFs (TraesCS7D01G409700 and TraesCS7D01G436800), TaZCCHC (TraesCS7D01G415100), and TaMYB (TraesCS7D01G409100).
It has been established that ARF plays an important role in the regulation of SG in wheat [51,52]. An ARF member TaARF15-A1 delays leaf senescence by positively modulating senescence-delaying genes such as the NAC gene TaNAM-1. TaARF15-A1-overexpression plants showed the SG phenotype [52]. According to the wheat ARF family number [53], the two ARF genes in this study were named as TaARF20-D and TaARF21-D, and we will conduct in-depth research on them. Similarly, a CCCH-type Zinc finger gene, Strong Staygreen (SSG), was characterized as the suppressor of leaf senescence as overexpression or suppression of the gene led to delayed or accelerated leaf senescence, respectively, in switchgrass (Panicum virgatum L.) [54]. In addition, MYB proteins have been reported to be involved in promoting chlorophyll catabolism. The MYB-related transcription factor RADIALIS-LIKE3 (OsRL3) functions in ABA-induced leaf senescence in rice, and the osrl3 null mutants exhibited a stay-green phenotype in the dark, with increased chlorophyll retention and photosynthetic capacity [55]. Proteasomal degradation of MaMYB60 caused high temperature-induced repression of chlorophyll catabolism and stay-green peels in bananas [56].

4.3. CH7034 Can Be Used for Wheat Breeding

SG trait of wheat can provide more photosynthetic products in the late period of grain-filling. In this study, we reported an SG wheat breeding line CH7034 and detected QSg.sxau-7D for flag leaf chlorophyll content with the BLUE-PVE of 10.33%. Association analysis results showed that the SG-type QSg.sxau-7D CH allele corresponded to the increased thousand-grain weight, comparing the non-SG-type SY allele, displaying a good application prospect in wheat high-yield breeding. However, RILs carrying the QSg.sxau-7D CH allele showed decreased spikelet number per spike than that carrying the SY allele. This is because a QTL for spike number per spike, QSns.sxau7D [57], is near QSg.sxau-7D. QSns.sxau-7D explained up to 17.92% of the total phenotypic variation in five experimental locations/years, and the spikelet number per spike of the QSns.sxau-7D CH allele was lower than that of the SY allele [57]. In addition, CH7034 is an excellent germplasm resistant to abiotic stress such as drought and salt [58]. A QTL DSR involving drought tolerance [50] was located in the QSg.sxau-7D region, suggesting the possible effects on the abiotic stress response. By marker development, the PCR-based 7D-16 under the peak of QSg.sxau-7D was used as the diagnostic marker, which can be applied in wheat molecular breeding.

5. Conclusions

This study clarified the SG loci carried by CH7034 and obtained close-linked molecular markers. One QTL for flag leaf chlorophyll content, QSg.sxau-7D, was detected in the genomic interval 526.4~556.2 Mbp on chromosome 7D, with the maximum PVE of 11.46%. There were 280 high-confidence genes in the interval. QSg.sxau-7D was positively correlated with thousand-grain weight. One PCR-based diagnostic marker 7D-16 for QSg.sxau-7D was developed for application in wheat molecular breeding.

Supplementary Materials

The supporting information can be downloaded at: https://www.mdpi.com/article/10.3390/plants14050727/s1, Table S1: 280 high-confidence annotated genes within QSg.sxau-7D region; Table S2: Expression patterns of 280 annotated genes in wheat flag leaf harvested at 3, 7, 10, 13, 15, 17, 19, 21, 23, and 26 days after anthesis (DAA).

Author Contributions

Conceptualization, W.G. and T.C.; formal analysis, X.L. (Xin Li) and X.B.; investigation, L.W., C.W., X.L. (Xinghui Liu) and Q.L.; resources, X.Z., F.C. and C.L.; writing—original draft preparation, X.L. (Xin Li); writing—review and editing, W.G.; project administration, W.G. and X.L. (Xin Li). All authors have read and agreed to the published version of the manuscript.

Funding

This research was funded by the Grand Science and Technology Special Project in Shanxi Province (202201140601025-2), the National Key R&D Program Project (2023YFD1201002), the Shanxi Province Key R&D Program Project (202302140601002-1), and the S&T Development Foundation of Central Guides Local Government Project (YDZJSX2022C009).

Data Availability Statement

Data are contained within this article and Supplementary Materials.

Conflicts of Interest

The authors declare no conflicts of interest.

References

  1. van Dijk, M.; Morley, T.; Rau, M.L.; Saghai, Y. A meta-analysis of projected global food demand and population at risk of hunger for the period 2010–2050. Nat. Food 2021, 2, 494. [Google Scholar] [CrossRef] [PubMed]
  2. Guarin, J.R.; Martre, P.; Ewert, F.; Webber, H.; Dueri, S.; Calderini, D.; Asseng, S. Evidence for increasing global wheat yield potential. Environ. Res. Lett. 2022, 17, 124045. [Google Scholar] [CrossRef]
  3. Shiferaw, B.; Smale, M.; Braun, H.-J.; Duveiller, E.; Reynolds, M.; Muricho, G. Crops that feed the world 10. past successes and future challenges to the role played by wheat in global food security. Food Secur. 2013, 5, 291–317. [Google Scholar] [CrossRef]
  4. Kumar, S.; Singh, R.; Grover, M.; Singh, A.K. Terminal heat-an emerging problem for wheat production. Biotech. Today 2012, 2, 7–9. [Google Scholar]
  5. Saini, D.K.; Chopra, Y.; Singh, J.; Sandhu, K.S.; Kumar, A.; Bazzer, S.; Srivastava, P. Comprehensive evaluation of mapping complex traits in wheat using genome-wide association studies. Mol. Breed. 2022, 42, 1–52. [Google Scholar] [CrossRef] [PubMed]
  6. Thomas, H.; Ougham, H. The stay-green trait. J. Exp. Bot. 2014, 65, 3889–3900. [Google Scholar] [CrossRef]
  7. Sjödin, J. Induced morphological variation in Vicia faba L. Hereditas 1971, 67, 155–179. [Google Scholar] [CrossRef]
  8. Djanaguiraman, M.; Gowsiga, S.; Govindaraj, M.; Habyarimana, E.; Senthil, A.; Thavaprakaash, N.; Jeyakumar, P.; Kokilavani, J.; Chellammal, C. Impact of root architecture and transpiration rate on drought tolerance in stay-green sorghum. Crop Sci. 2024, 64, 2612–2629. [Google Scholar] [CrossRef]
  9. Chibane, N.; Caicedo, M.; Martinez, S.; Marcet, P.; Revilla, P.; Ordás, B. Relationship between delayed leaf senescence (stay-green) and agronomic and physiological characters in maize (Zea mays L.). Agronomy 2021, 11, 276. [Google Scholar] [CrossRef]
  10. Lee, S.; Masclaux-Daubresse, C. Current understanding of leaf senescence in rice. Int. J. Mol. Sci. 2021, 22, 4515. [Google Scholar] [CrossRef] [PubMed]
  11. Williams, J.L.; Sherman, J.D.; Lamb, P.; Cook, J.; Lachowiec, J.A.; Bourgault, M. Relationships between roots, the stay-green phenotype, and agronomic performance in barley and wheat grown in semi-arid conditions. Plant Phenome J. 2022, 5, e220050. [Google Scholar] [CrossRef]
  12. Chen, J.; Liang, Y.; Hu, X.; Wang, X.; Tan, F.; Zhang, H.; Ren, Z.; Luo, P. Physiological characterization of ‘stay green’wheat cultivars during the grain filling stage under field growing conditions. Acta Physiol. Plantarum 2010, 32, 875–882. [Google Scholar] [CrossRef]
  13. Luche, H.D.S.; Silva, J.A.G.D.; Nornberg, R.; Hawerroth, M.C.; Silveira, S.F.D.S.; Caetano, V.D.R.; Santos, R.L.; Figueiredo, R.G.; Maia, L.C.D.; Oliveira, A.C.D. Stay-green character and its contribution in Brazilian wheats. Ciência Rural 2017, 47, e20160583. [Google Scholar] [CrossRef]
  14. Jocković, B.; Mirosavljević, M.; Momčilović, V.; Dražić, T.; Mikić, S.; Aćin, V.; Ilin, S.; Živančev, D. The contribution of stay green traits to the breeding progress of the pannonian wheat. Field Crops Res. 2022, 287, 108649. [Google Scholar] [CrossRef]
  15. Christopher, J.T.; Christopher, M.J.; Borrell, A.K.; Fletcher, S.; Chenu, K. Stay-green traits to improve wheat adaptation in well-watered and water-limited environments. J. Exp. Bot. 2016, 67, 5159–5172. [Google Scholar] [CrossRef] [PubMed]
  16. Anderegg, J.; Aasen, H.; Perich, G.; Roth, L.; Walter, A.; Hund, A. Temporal trends in canopy temperature and greenness are potential indicators of late-season drought avoidance and functional stay-green in wheat. Field Crops Res. 2021, 274, 108311. [Google Scholar] [CrossRef]
  17. Fu, J.; Krishna Jagadish, S.V.; Bowden, R.L. Effects of post-flowering heat stress on chlorophyll content and yield components of a spring wheat diversity panel. Crop Sci. 2022, 62, 1926–1936. [Google Scholar] [CrossRef]
  18. Ali, A.; Ullah, Z.; Sher, H.; Abbas, Z.; Rasheed, A. Water stress effects on stay green and chlorophyll fluorescence with focus on yield characteristics of diverse bread wheats. Planta 2023, 257, 104. [Google Scholar] [CrossRef]
  19. Guo, Y.; Ren, G.; Zhang, K.; Li, Z.; Miao, Y.; Guo, H. Leaf senescence: Progression, regulation, and application. Mol. Hortic. 2021, 1, 5. [Google Scholar] [CrossRef] [PubMed]
  20. Li, Y.; Cao, T.; Guo, Y.; Grimm, B.; Li, X.; Duanmu, D.; Lin, R. Regulatory and retrograde signaling networks in the chlorophyll biosynthetic pathway. J. Integr. Plant Biol. 2025, in press. [Google Scholar] [CrossRef]
  21. Tanaka, R.; Tanaka, A. Tetrapyrrole biosynthesis in higher plants. Annu. Rev. Plant Biol. 2007, 58, 321–346. [Google Scholar] [CrossRef]
  22. Wang, C.; Zhang, L.; Li, Y.; Ali Buttar, Z.; Wang, N.; Xie, Y. Single nucleotide mutagenesis of the TaCHLI gene suppressed chlorophyll and fatty acid biosynthesis in common wheat seedlings. Front. Plant Sci. 2020, 11, 97. [Google Scholar] [CrossRef] [PubMed]
  23. Wang, Z.; Xu, H.; Wang, F.; Sun, L.; Meng, X.; Li, Z.; Xie, C.; Jiang, H.; Ding, G.; Hu, X.; et al. EMS-induced missense mutation in TaCHLI-7D affects leaf color and yield-related traits in wheat. Theor. Appl. Genet. 2024, 137, 223. [Google Scholar] [CrossRef] [PubMed]
  24. Lin, Y.P.; Charng, Y.Y. Chlorophyll dephytylation in chlorophyll metabolism: A simple reaction catalyzed by various enzymes. Plant Sci. 2021, 302, 110682. [Google Scholar] [CrossRef]
  25. Gedam, P.A.; Krishna, G.K.; Ramakrishnan, R.S.; Sharma, R.; Chaturvedi, A.K.; Singh, V.P. Ethylene induced stay-green gene expression regulates drought stress in wheat. Indian J. Exp. Biol. 2021, 59, 761–769. [Google Scholar]
  26. Kamal, N.M.; Gorafi, Y.S.A.; Abdelrahman, M.; Abdellatef, E.; Tsujimoto, H. Stay-green trait: A prospective approach for yield potential, and drought and heat stress adaptation in globally important cereals. Int. J. Mol. Sci. 2019, 20, 5837. [Google Scholar] [CrossRef] [PubMed]
  27. Hairat, S.; Agisho, H.A.; Zaki, M. Challenges and management of wheat under global climate change. Plant Cell Biotech. Mol. Biol. 2021, 22, 136–151. [Google Scholar]
  28. Sharma, D.; Kumari, A.; Sharma, P.; Singh, A.; Sharma, A.; Mir, Z.A.; Kumar, U.; Jan, S.; Parthiban, M.; Mir, R.R.; et al. Meta-QTL analysis in wheat: Progress, challenges and opportunities. Theor. Appl. Genet. 2023, 136, 247. [Google Scholar] [CrossRef]
  29. Guo, K.; Chen, T.; Zhang, P.; Liu, Y.; Che, Z.; Shahinnia, F.; Yang, D. Meta-QTL analysis and in-silico transcriptome assessment for controlling chlorophyll traits in common wheat. Plant Genome 2023, 16, e20294. [Google Scholar] [CrossRef]
  30. Christopher, M.; Chenu, K.; Jennings, R.; Fletcher, S.; Butler, D.; Borrell, A.; Christopher, J. QTL for stay-green traits in wheat in well-watered and water-limited environments. Field Crops Res. 2018, 217, 32–44. [Google Scholar] [CrossRef]
  31. Cook, J.P.; Acharya, R.K.; Martin, J.M.; Blake, N.K.; Khan, I.J.; Heo, H.Y.; Kephart, K.D.; Eckhoff, J.; Talbert, L.E.; Sherman, J.D. Genetic analysis of stay-green, yield, and agronomic traits in spring wheat. Crop Sci. 2021, 61, 383–395. [Google Scholar] [CrossRef]
  32. An, Q.; Li, C.; Li, H.; Zheng, Q.; Li, B.; Li, Z. An analysis of the genetic relation between photosynthesis and yield-related traits in wheat. Agriculture 2022, 12, 560. [Google Scholar] [CrossRef]
  33. Kumar, P.K.C.; Bellundagi, A.; Krishna, H.; Mallikarjuna, M.G.; Thimmappa, R.K.; Rai, N.; Shashikumara, P.; Sinha, N.; Jain, N.; Singh, P.K.; et al. Development of bread wheat (Triticum aestivum L.) variety HD3411 following marker-assisted backcross breeding for drought tolerance. Front. Genet. 2023, 14, 1046624. [Google Scholar] [CrossRef] [PubMed]
  34. Sahranavard, N.; Jorjani, E.; Sabouri, H.; Alegh, S.M.; Katouzi, M. Detecting QTLs controlling chlorophyll fluorescence parameters in Iranian wheat recombinant inbred lines. Plant Gene 2024, 37, 100437. [Google Scholar] [CrossRef]
  35. Wang, W.; Gao, X.; Cheng, Y.; Ren, Y.; Zhang, Z.; Wang, R.; Cao, J.; Geng, H. QTL mapping of leaf area index and chlorophyll content based on UAV remote sensing in wheat. Agriculture 2022, 12, 595. [Google Scholar] [CrossRef]
  36. Yang, B.; Wen, X.; Wen, H.; Feng, Y.; Zhao, J.; Wu, B.; Zheng, X.; Yang, C.; Yang, S.; Qiao, L.; et al. Identification of genetic loci affecting flag leaf chlorophyll in wheat grown under different water regimes. Front. Genet. 2022, 13, 832898. [Google Scholar] [CrossRef]
  37. Yang, B.; Chen, N.; Dang, Y.; Wang, Y.; Wen, H.; Zheng, J.; Zheng, X.; Zhao, J.; Lu, J.; Qiao, L. Identification and validation of quantitative trait loci for chlorophyll content of flag leaf in wheat under different phosphorus treatments. Front. Plant Sci. 2022, 13, 1019012. [Google Scholar] [CrossRef]
  38. Shi, S.; Azam, F.I.; Li, H.; Chang, X.; Li, B.; Jing, R. Mapping QTL for stay-green and agronomic traits in wheat under diverse water regimes. Euphytica 2017, 213, 246. [Google Scholar] [CrossRef]
  39. Qiao, L.; Zhang, X.; Li, X.; Yang, Z.; Li, R.; Jia, J.; Yan, L.; Chang, Z. Genetic incorporation of genes for the optimal plant architecture in common wheat. Mol. Breed. 2022, 42, 66. [Google Scholar] [CrossRef]
  40. Qiao, L.; Zhang, X.; Li, X.; Zhang, L.; Zheng, J.; Chang, Z. Development of NBS-related microsatellite (NRM) markers in hexaploid wheat. Euphytica 2017, 213, 256. [Google Scholar] [CrossRef]
  41. Borrill, P.; Harrington, S.A.; Simmonds, J.; Uauy, C. Identification of transcription factors regulating senescence in wheat through gene regulatory network modelling. Plant Physiol. 2019, 180, 1740–1755. [Google Scholar] [CrossRef]
  42. Chen, J.; Zhang, L.; Liu, Y.; Shen, X.; Guo, Y.; Ma, X.; Zhang, X.; Li, X.; Cheng, T.; Wen, H.; et al. RNA-Seq-based WGCNA and association analysis reveal the key regulatory module and genes responding to salt stress in wheat roots. Plants 2024, 13, 274. [Google Scholar] [CrossRef]
  43. Qiao, L.; Chang, L.; Kai, M.; Zhang, X.; Kang, T.; Wu, L.; Zhang, X.; Li, X.; Zhao, J.; Zhao, Z.; et al. Exploring drought resistance genes from the roots of the wheat cultivar Yunhan1818. Int. J. Mol. Sci. 2024, 25, 13458. [Google Scholar] [CrossRef] [PubMed]
  44. Malakondaiah, A.C.; Arora, A.; Krishna, H.; Taria, S.; Kumar, S.; Devate, N.B.; Padaria, J.C.; Kousalya, S.; Patil, S.P.; Singh, P.K. Genome-wide association mapping for stay-green and stem reserve mobilization traits in wheat (Triticum aestivum L.) under combined heat and drought stress. Protoplasma 2025, in press. [Google Scholar] [CrossRef]
  45. Shi, Y.G.; Lian, Y.; Shi, H.W.; Wang, S.G.; Fan, H.; Sun, D.Z.; Jing, R.L. Dynamic analysis of QTLs for green leaf area duration and green leaf number of main stem in wheat. Cereal Res. Commun. 2019, 47, 250–263. [Google Scholar] [CrossRef]
  46. Vijayalakshmi, K.; Fritz, A.K.; Paulsen, G.M.; Bai, G.; Pandravada, S.; Gill, B.S. Modeling and mapping QTL for senescence-related traits in winter wheat under high temperature. Mol. Breed. 2010, 26, 163–175. [Google Scholar] [CrossRef]
  47. Kumar, U.; Joshi, A.K.; Kumari, M.; Paliwal, R.; Kumar, S.; Röder, M.S. Identification of QTLs for stay green trait in wheat (Triticum aestivum L.) in the ‘Chirya 3’ × ‘Sonalika’ population. Euphytica 2010, 174, 437–445. [Google Scholar] [CrossRef]
  48. Yu, R.; Cao, X.; Liu, J.; Nie, R.; Zhang, C.; Yuan, M.; Huang, Y.; Liu, X.; Zheng, W.; Wang, C.; et al. Using UAV-based temporal spectral indices to dissect changes in the stay-green trait in wheat. Plant Phenomics 2024, 6, a0171. [Google Scholar] [CrossRef] [PubMed]
  49. Li, F.; Wen, W.; Liu, J.; Zhai, S.; Cao, X.; Liu, C.; Cheng, D.G.; Guo, J.; Zi, Y.; Han, R.; et al. Genome-wide linkage mapping for canopy activity related traits using three RIL populations in bread wheat. Euphytica 2021, 217, 67. [Google Scholar] [CrossRef]
  50. Sallam, A.; Eltaher, S.; Alqudah, A.M.; Belamkar, V.; Baenziger, P.S. Combined GWAS and QTL mapping revealed candidate genes and SNP network controlling recovery and tolerance traits associated with drought tolerance in seedling winter wheat. Genomics 2022, 114, 110358. [Google Scholar] [CrossRef] [PubMed]
  51. Qiao, L.; Li, H.; Zheng, J.; Zhang, X. Towards a better understanding of auxin response factors for improving cereal crops. J. Integr. Agric. 2024, in press. [Google Scholar] [CrossRef]
  52. Li, H.; Liu, H.; Hao, C.; Li, T.; Liu, Y.; Wang, X.; Yang, Y.; Zheng, J.; Zhang, X. The auxin response factor TaARF15-A1 negatively regulates senescence in common wheat (Triticum aestivum L.). Plant Physiol. 2023, 191, 1254–1271. [Google Scholar] [CrossRef] [PubMed]
  53. Qiao, L.Y.; Zhang, W.P.; Li, X.Y.; Zhang, L.; Zhang, X.J.; Li, X.; Guo, H.J.; Ren, Y.; Zheng, J.; Chang, Z.J. Characterization and expression patterns of auxin response factors in wheat. Front. Plant Sci. 2018, 9, 1395. [Google Scholar] [CrossRef] [PubMed]
  54. Xie, Z.; Yu, G.; Lei, S.; Wang, H.; Xu, B. STRONG STAYGREEN inhibits DNA binding of PvNAP transcription factors during leaf senescence in switchgrass. Plant Physiol. 2022, 190, 2045–2058. [Google Scholar] [CrossRef] [PubMed]
  55. Park, D.Y.; Shim, Y.; Gi, E.; Lee, B.D.; An, G.; Kang, K.; Paek, N.C. The MYB-related transcription factor RADIALIS-LIKE3 (OsRL3) functions in ABA-induced leaf senescence and salt sensitivity in rice. Environ. Exp. Bot. 2018, 156, 86–95. [Google Scholar] [CrossRef]
  56. Wei, W.; Yang, Y.Y.; Lakshmanan, P.; Kuang, J.F.; Lu, W.J.; Pang, X.Q.; Chen, J.Y.; Shan, W. Proteasomal degradation of MaMYB60 mediated by the E3 ligase MaBAH1 causes high temperature-induced repression of chlorophyll catabolism and green ripening in banana. Plant Cell 2023, 35, 1408–1428. [Google Scholar] [CrossRef] [PubMed]
  57. Zhang, X.; Qiao, L.; Li, X.; Yang, Z.; Liu, C.; Guo, H.; Zheng, J.; Zhang, S.; Chang, L.; Chen, F.; et al. Genetic incorporation of the favorable alleles for three genes associated with spikelet development in wheat. Front. Plant Sci. 2022, 13, 892642. [Google Scholar] [CrossRef]
  58. Qiao, L.; Li, Y.; Wang, L.; Gu, C.; Luo, S.; Li, X.; Yan, J.; Lu, C.; Chang, Z.; Gao, W.; et al. Identification of salt-stress-responding genes by weighted gene correlation network analysis and association analysis in wheat leaves. Plants 2024, 13, 2642. [Google Scholar] [CrossRef]
Figure 1. Variation in stay green in CH × SY RIL population. (a) Stay-green line. (b) Non-stay-green line. (c) Flag leaf chlorophyll content of RILs. CH: CH7034; SY: SY95-71; SG: stay green; BLUE: best linear unbiased estimation.
Plants 14 00727 g001
Figure 2. SNPs from the 17K SNP chip screened to form a genetic map for the RILs. (a) Distribution of SNPs on wheat chromosomes. (b) The number of SNPs on each chromosome.
Plants 14 00727 g002
Figure 3. Map position and linked markers of QSg.sxau-7D. (a) Genetic map. (b) Genomic map. (c) Re-mapping result of QSg.sxau-7D integrated with six developed SSR markers. Red boxes represent QSg.sxau-7D region; the linked SNP markers are marked in red, while the developed SSR markers are marked in blue.
Plants 14 00727 g003
Figure 4. Expression patterns of 280 annotated genes within QSg.sxau-7D region in wheat flag leaf from the main tiller that harvested at 3, 7, 10, 13, 15, 17, 19, 21, 23, and 26 days after anthesis (DAA). Unexpressed genes are represented by gray squares. From gray to red, the TPM value goes from low to high.
Plants 14 00727 g004
Figure 5. Significant differences analysis in genotypes of the diagnostic marker 7D-16 of QSg.sxau-7D in CH × SY RIL population. * indicates p < 0.05, *** indicates p < 0.001, and **** indicates p < 0.0001, by the t-test.
Plants 14 00727 g005
Figure 6. The physical positions of QSg.sxau-7D and the previously reported SG-associated loci on chromosome 7D. The line with rhombic dots indicates QTL interval flanked by markers, and the single rhombic dot indicates the solitary linked marker of QTL. QTLs for flag leaf chlorophyll content that were measured by SPAD value are marked in blue, and the QSg.sxau-7D in this study is marked in red.
Plants 14 00727 g006
Table 1. Developed SSR markers linked to QTL in this study.
MarkerPositionForward Primer Sequence (5′–3′)Reverse Primer Sequence (5′–3′)
7D-17D:520269556ATAGATTTGACTTTGGGGTAGTAGTCTCAGAGAGCAACTTGGG
7D-317D:522918576TAGCTCCCTCCAGTGAAACCCTGCTCCAAACCCAATCT
7D-327D:523485210ATGCTTCCACGCCGGTGTAGACATCAACCTTTCCCAGATC
7D-367D:524917078ACTGCTCTCTCTATTATAGCAGGCTTTGACATGGTCTAAATCTG
7D-167D:535195126GGACTCGGACGCCAAAGTCCAGTTTCGAGTCTCGTTTTTTA
7D-197D:536464127CAAAACATGGGCTAGATCCCCTAGATCTACAGGCCAACAC
Table 2. Assessment of stay green for CH × SY RIL population and the parents.
TraitParentsRIL Population
CHSYMinMaxMeanCV
2019-SG44.174.12 ****2.3349.4329.110.32
2023-SG50.393.84 ****2.6955.7430.040.47
2024-SG42.273.43 ****1.6657.2828.010.56
BLUE45.613.80 ****3.0552.8631.370.44
SG: stay green; CV: coefficient of variation; BLUE: best linear unbiased estimation; ****: p < 0.0001 by the t-test.
Table 3. QTL mapping for stay green in CH × SY RIL population.
TraitChromosomePosition
(cM)
Left MarkerRight MarkerLODPVE
(%)
ADD
2019-SG5A198.5226069812341162.845.775.39
7D213.9100422510903725.2711.4612.54
2023-SG2B170.2541112618631812.635.242.47
7D211.2100422522420975.0610.6212.24
2024-SG7D213.9100422510903723.50 8.814.81
BLUE7D213.9100422510903725.5710.339.26
SG: stay green; LOD: logarithm of the odds; PVE: phenotypic variance explained; ADD: additive effect.
Disclaimer/Publisher’s Note: The statements, opinions and data contained in all publications are solely those of the individual author(s) and contributor(s) and not of MDPI and/or the editor(s). MDPI and/or the editor(s) disclaim responsibility for any injury to people or property resulting from any ideas, methods, instructions or products referred to in the content.

