
A Nonlinear Fitting Method Provides Strong Support for Geometric Series of Stomatal Area in 12 Magnoliaceae Species


Abstract
1. Introduction
2. Materials and Methods
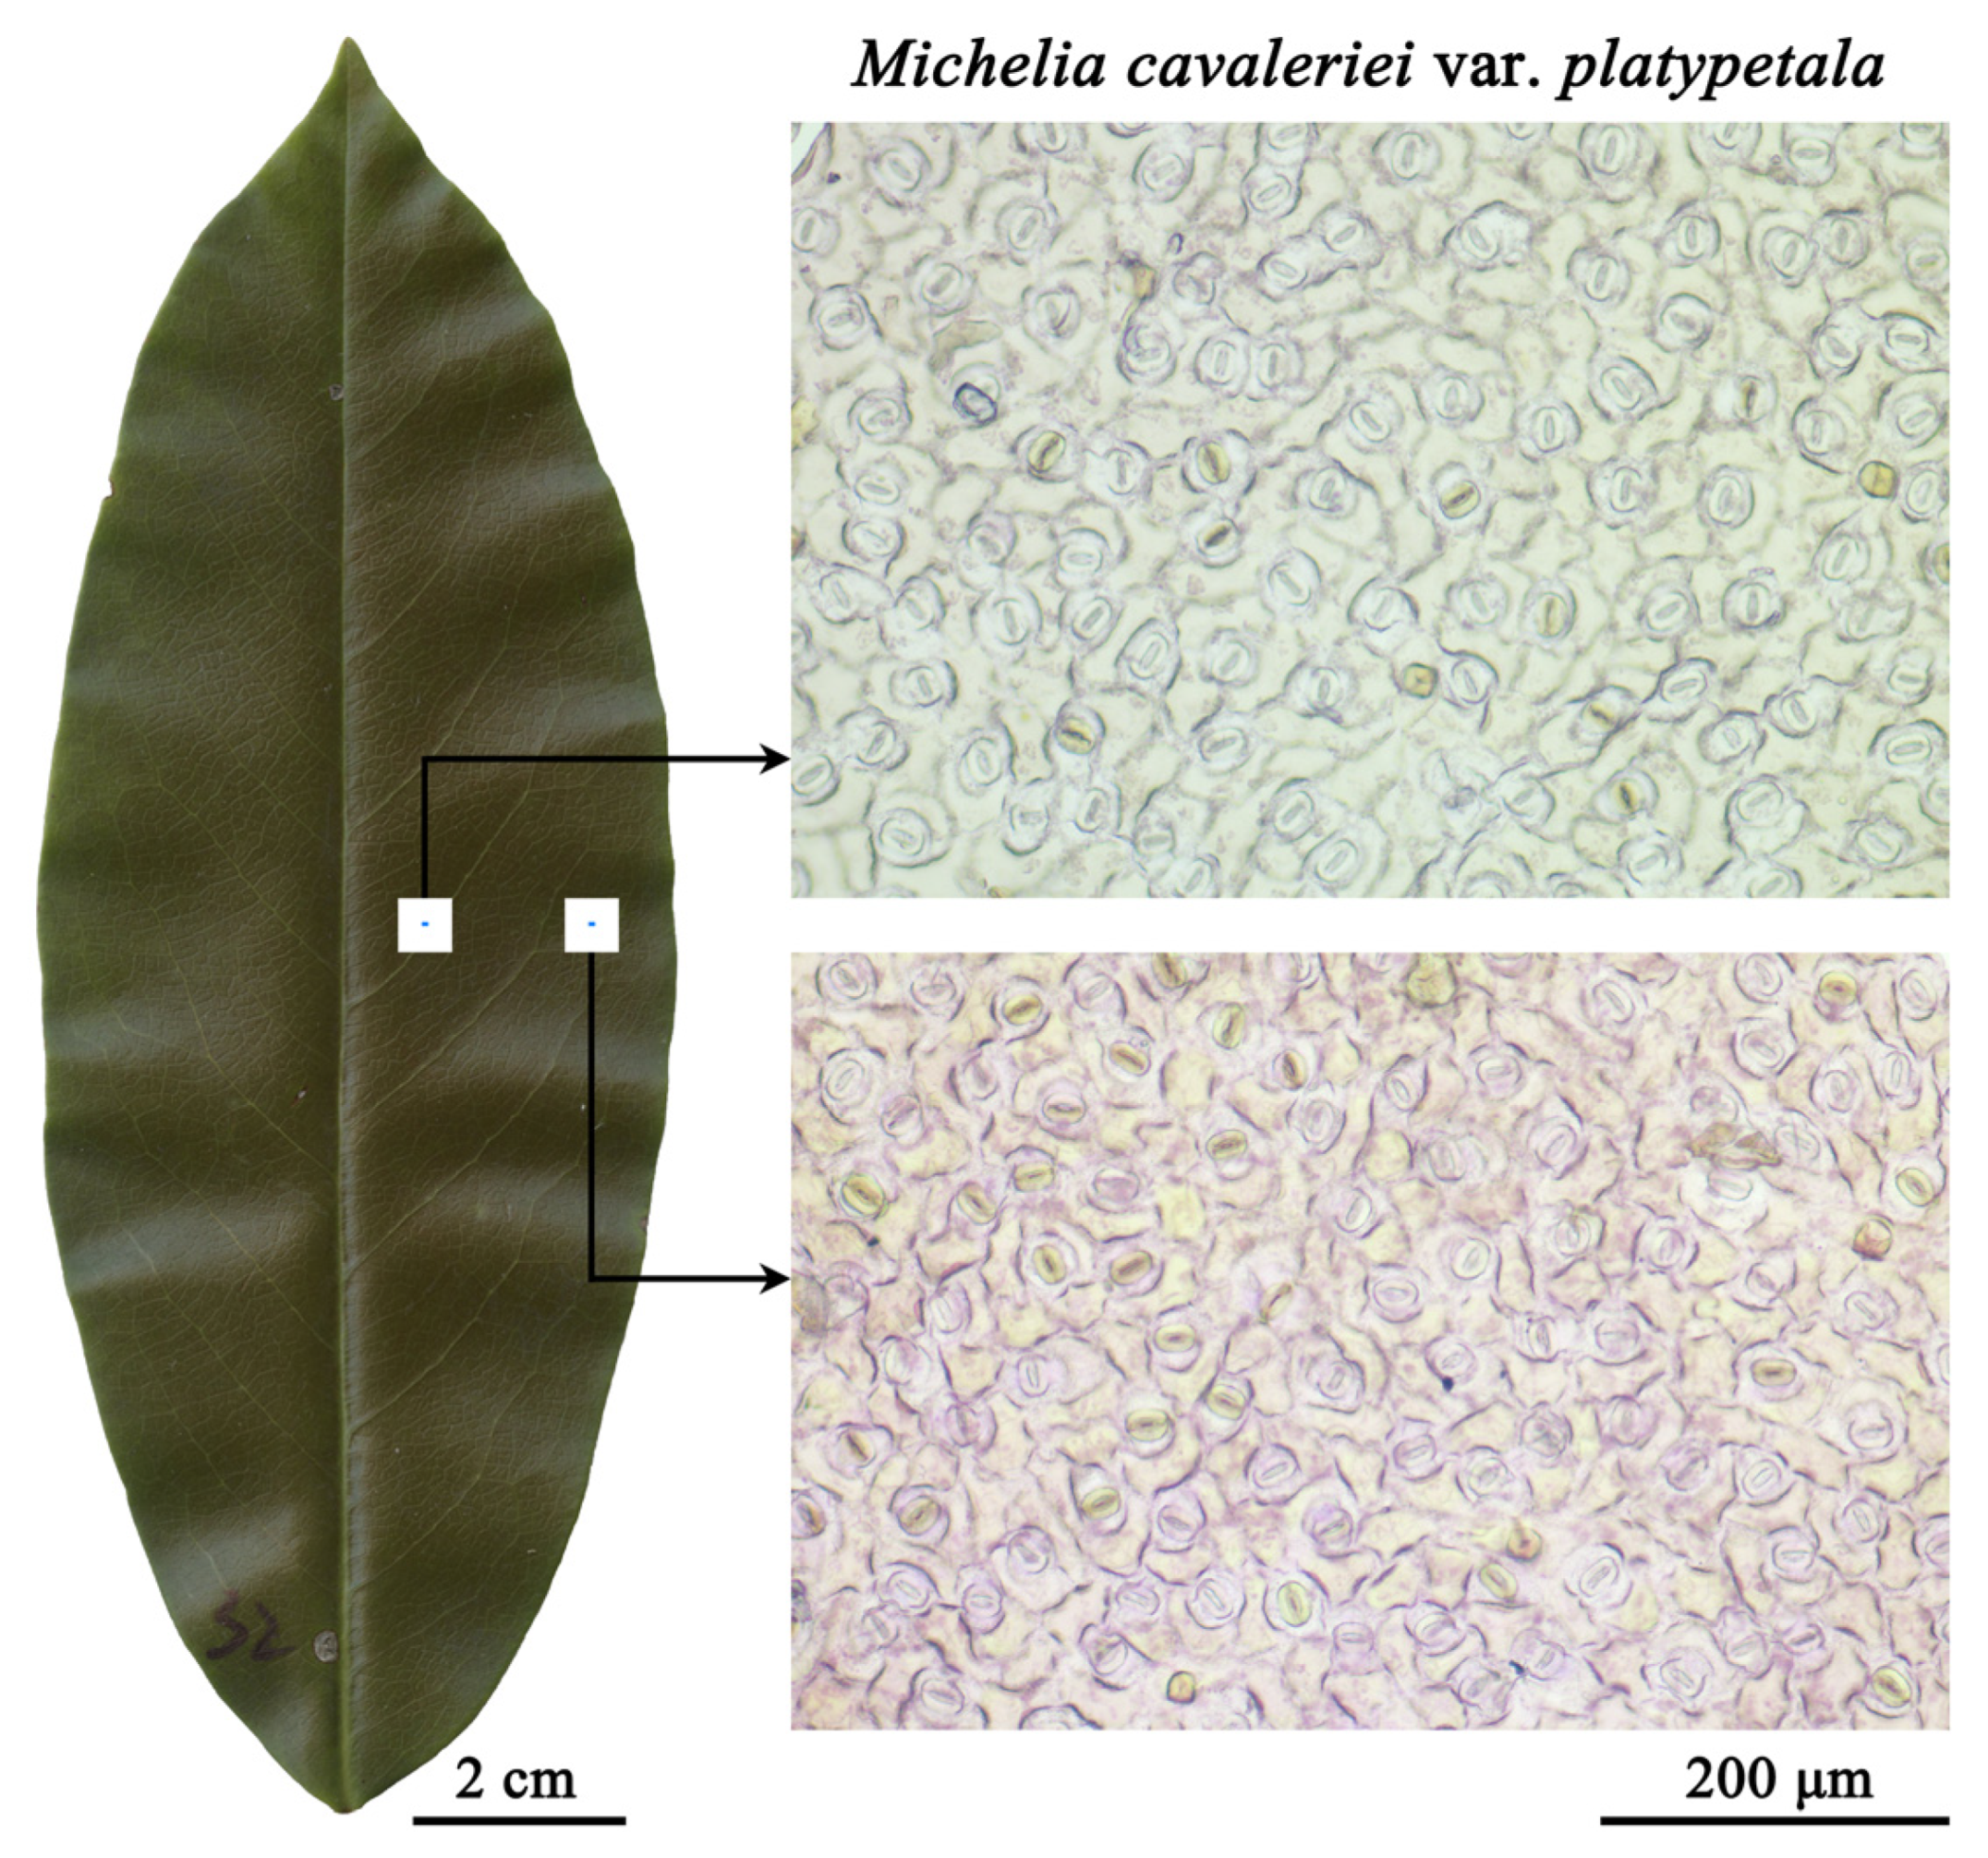
2.1. Plant Sampling and Data Acquisition of Stomatal Area
2.2. Methods
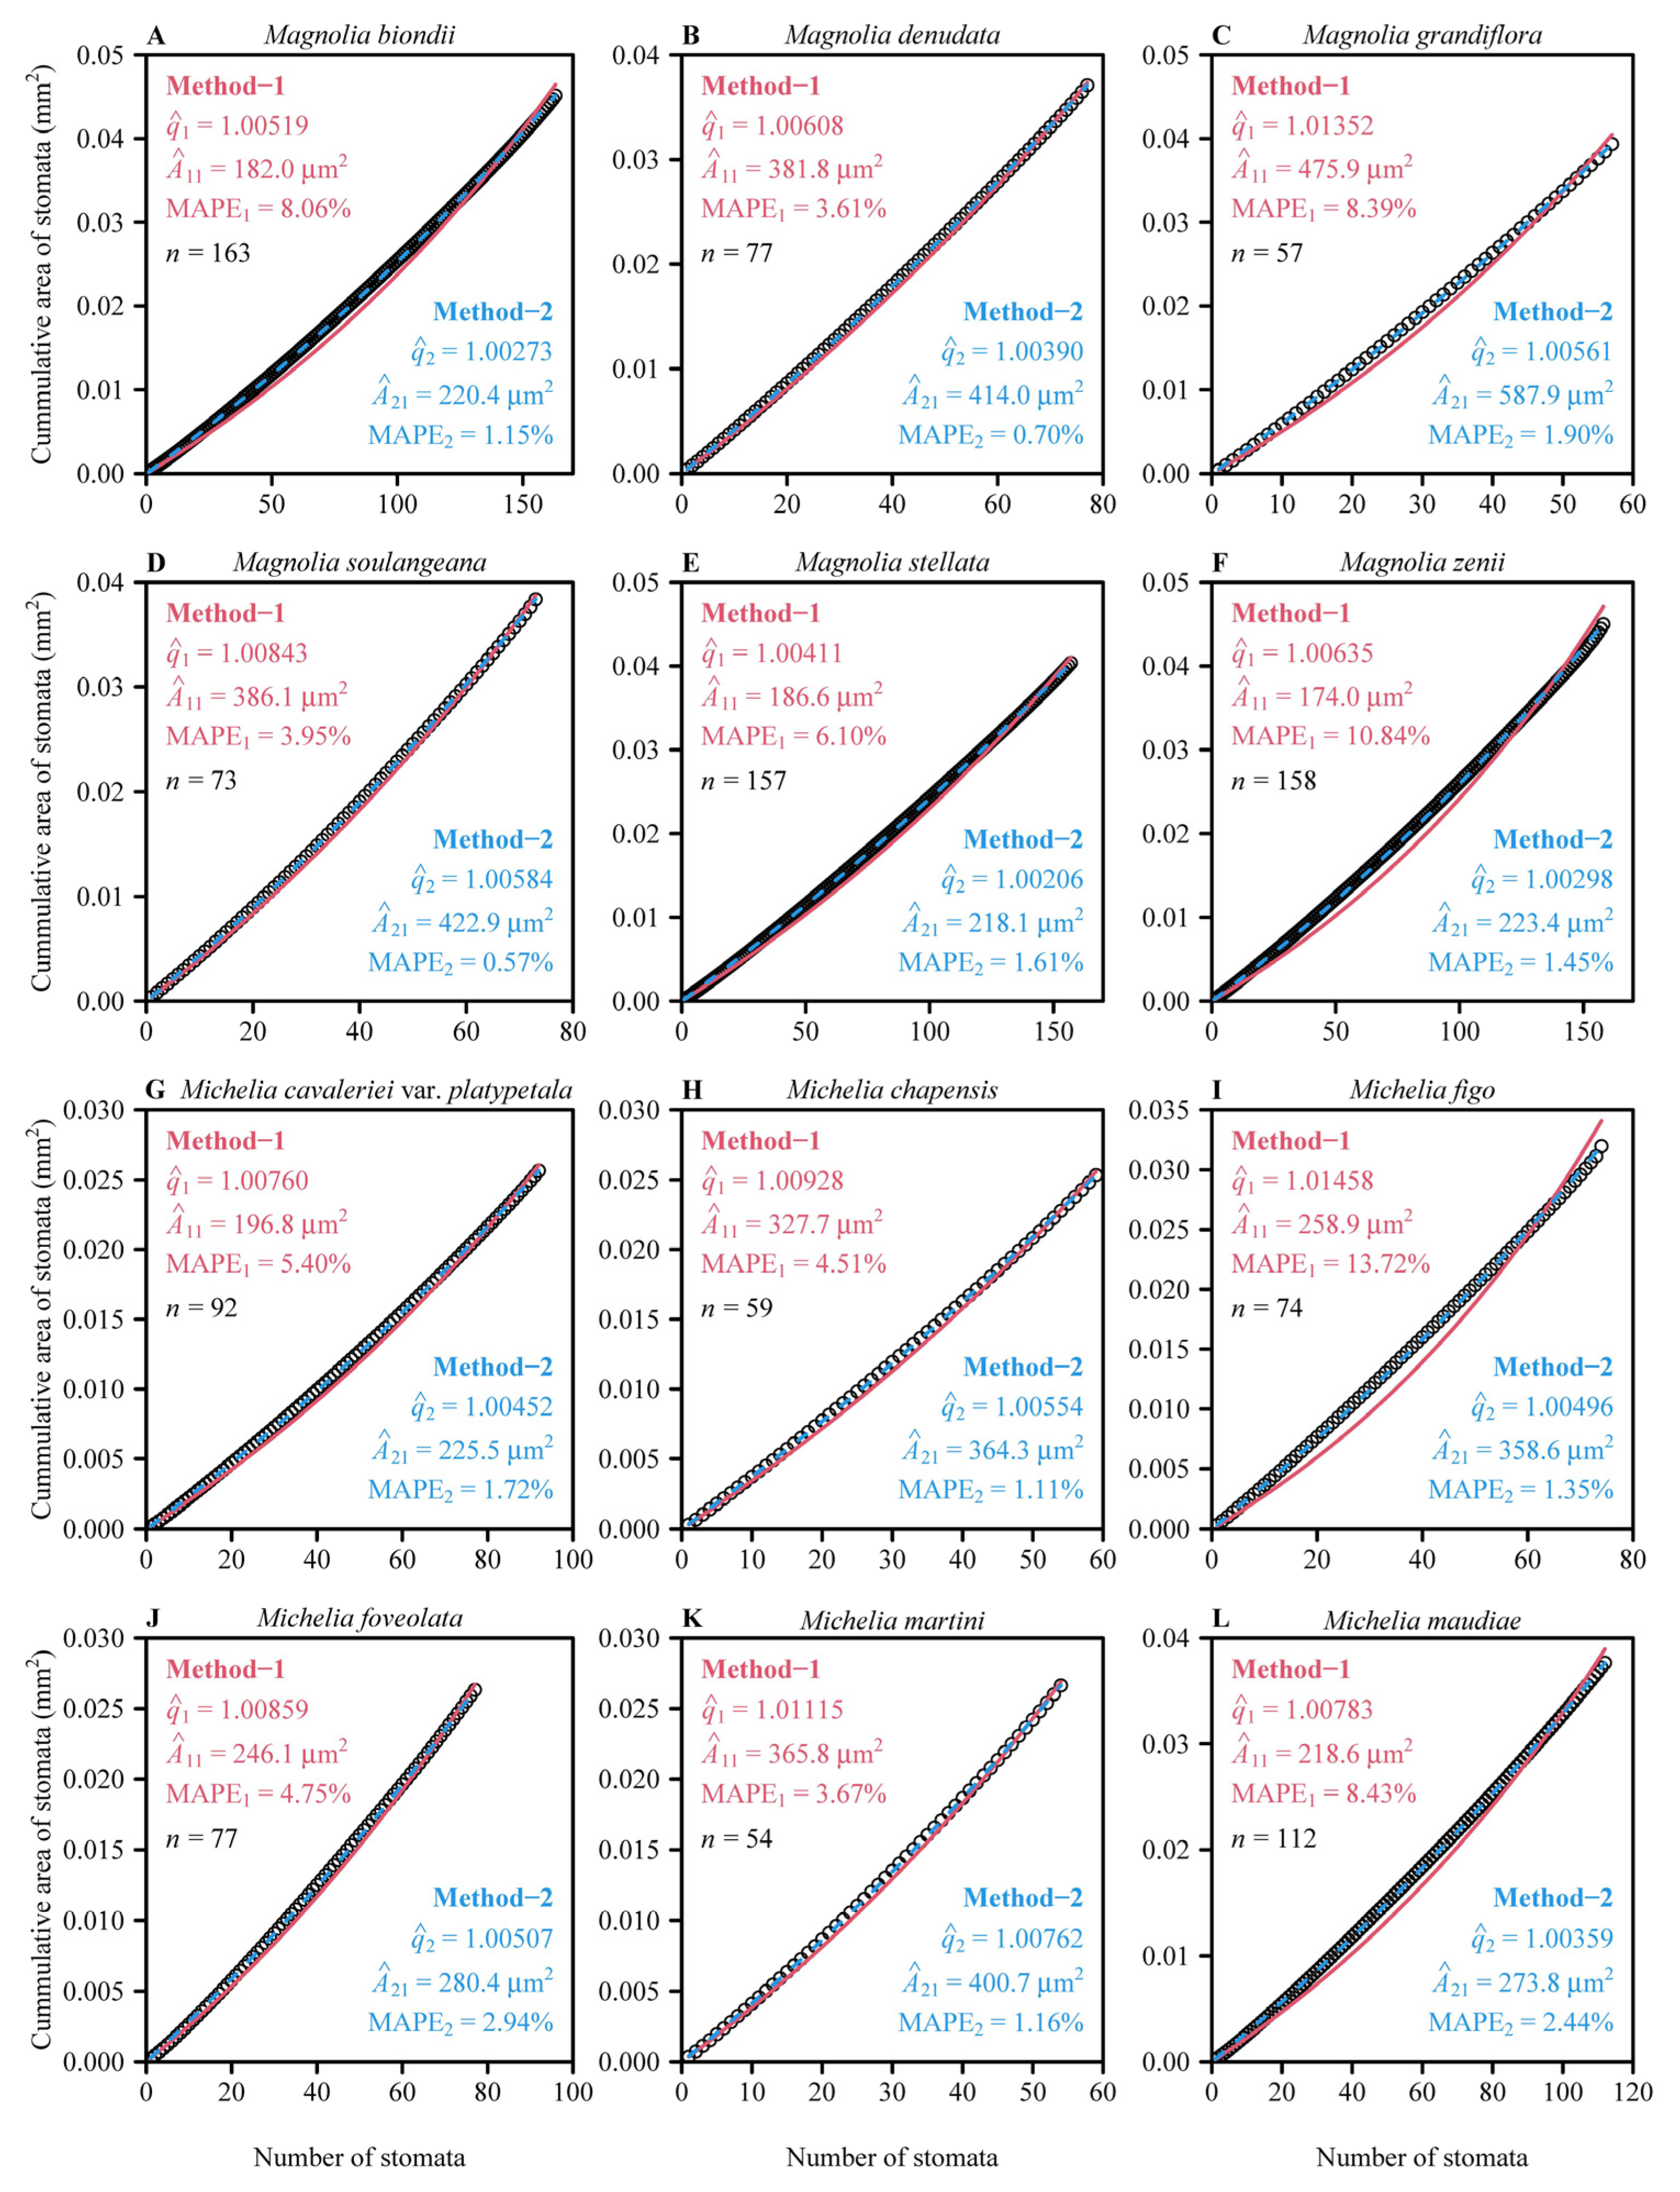
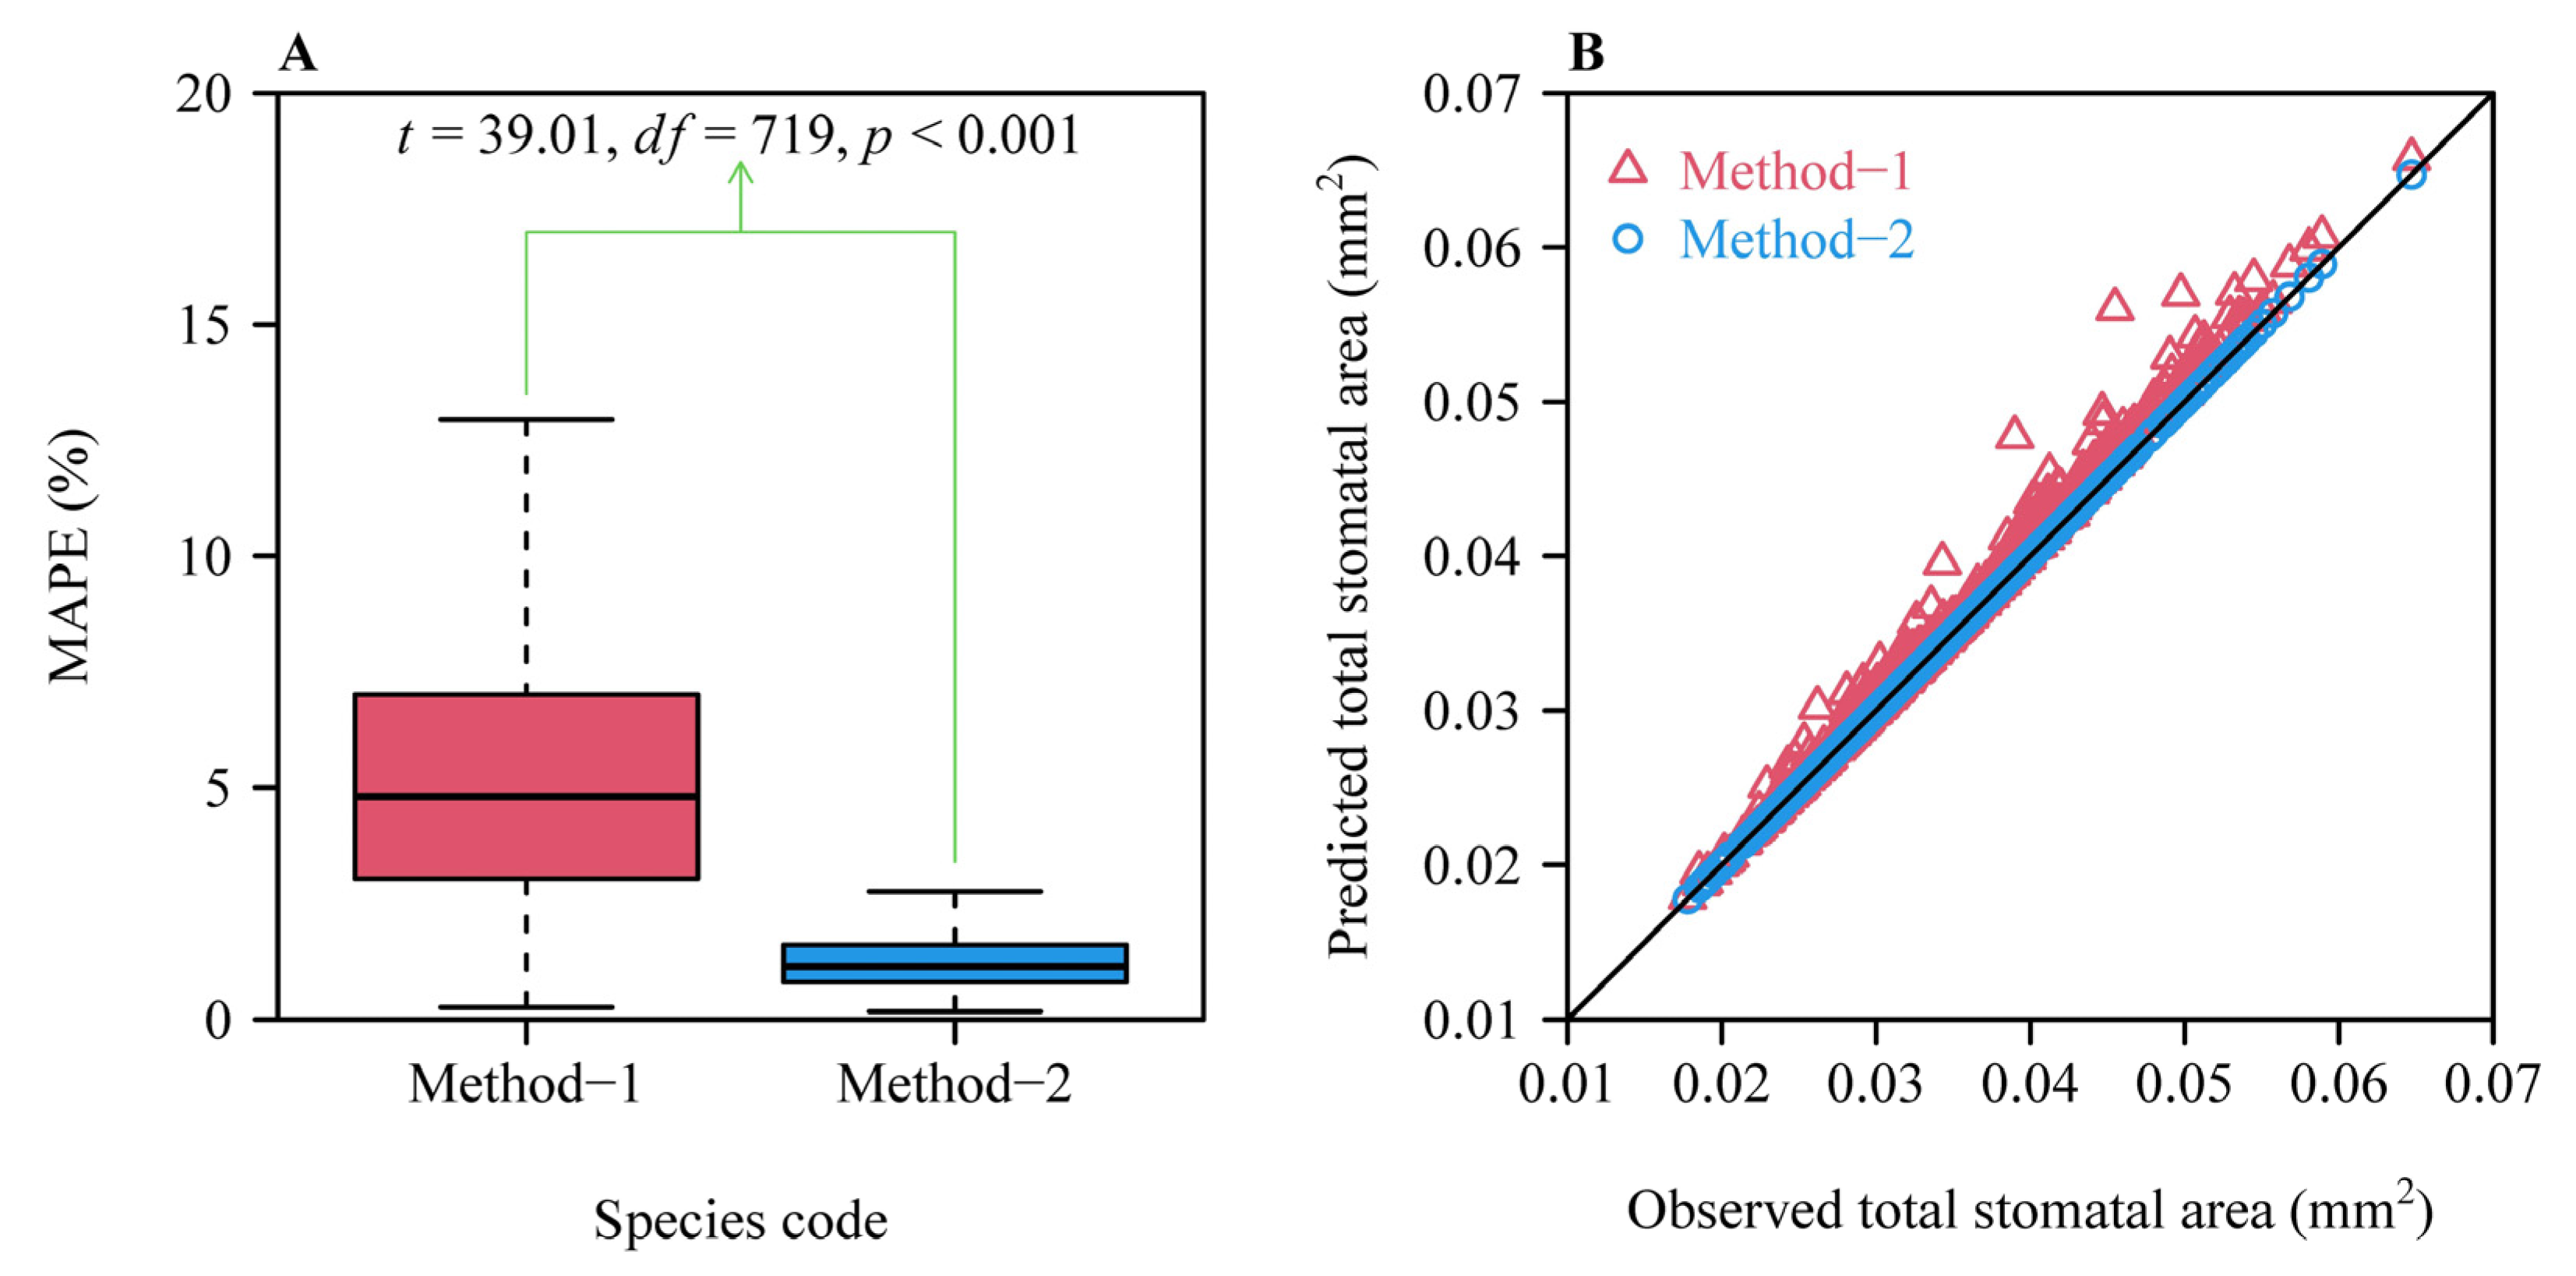
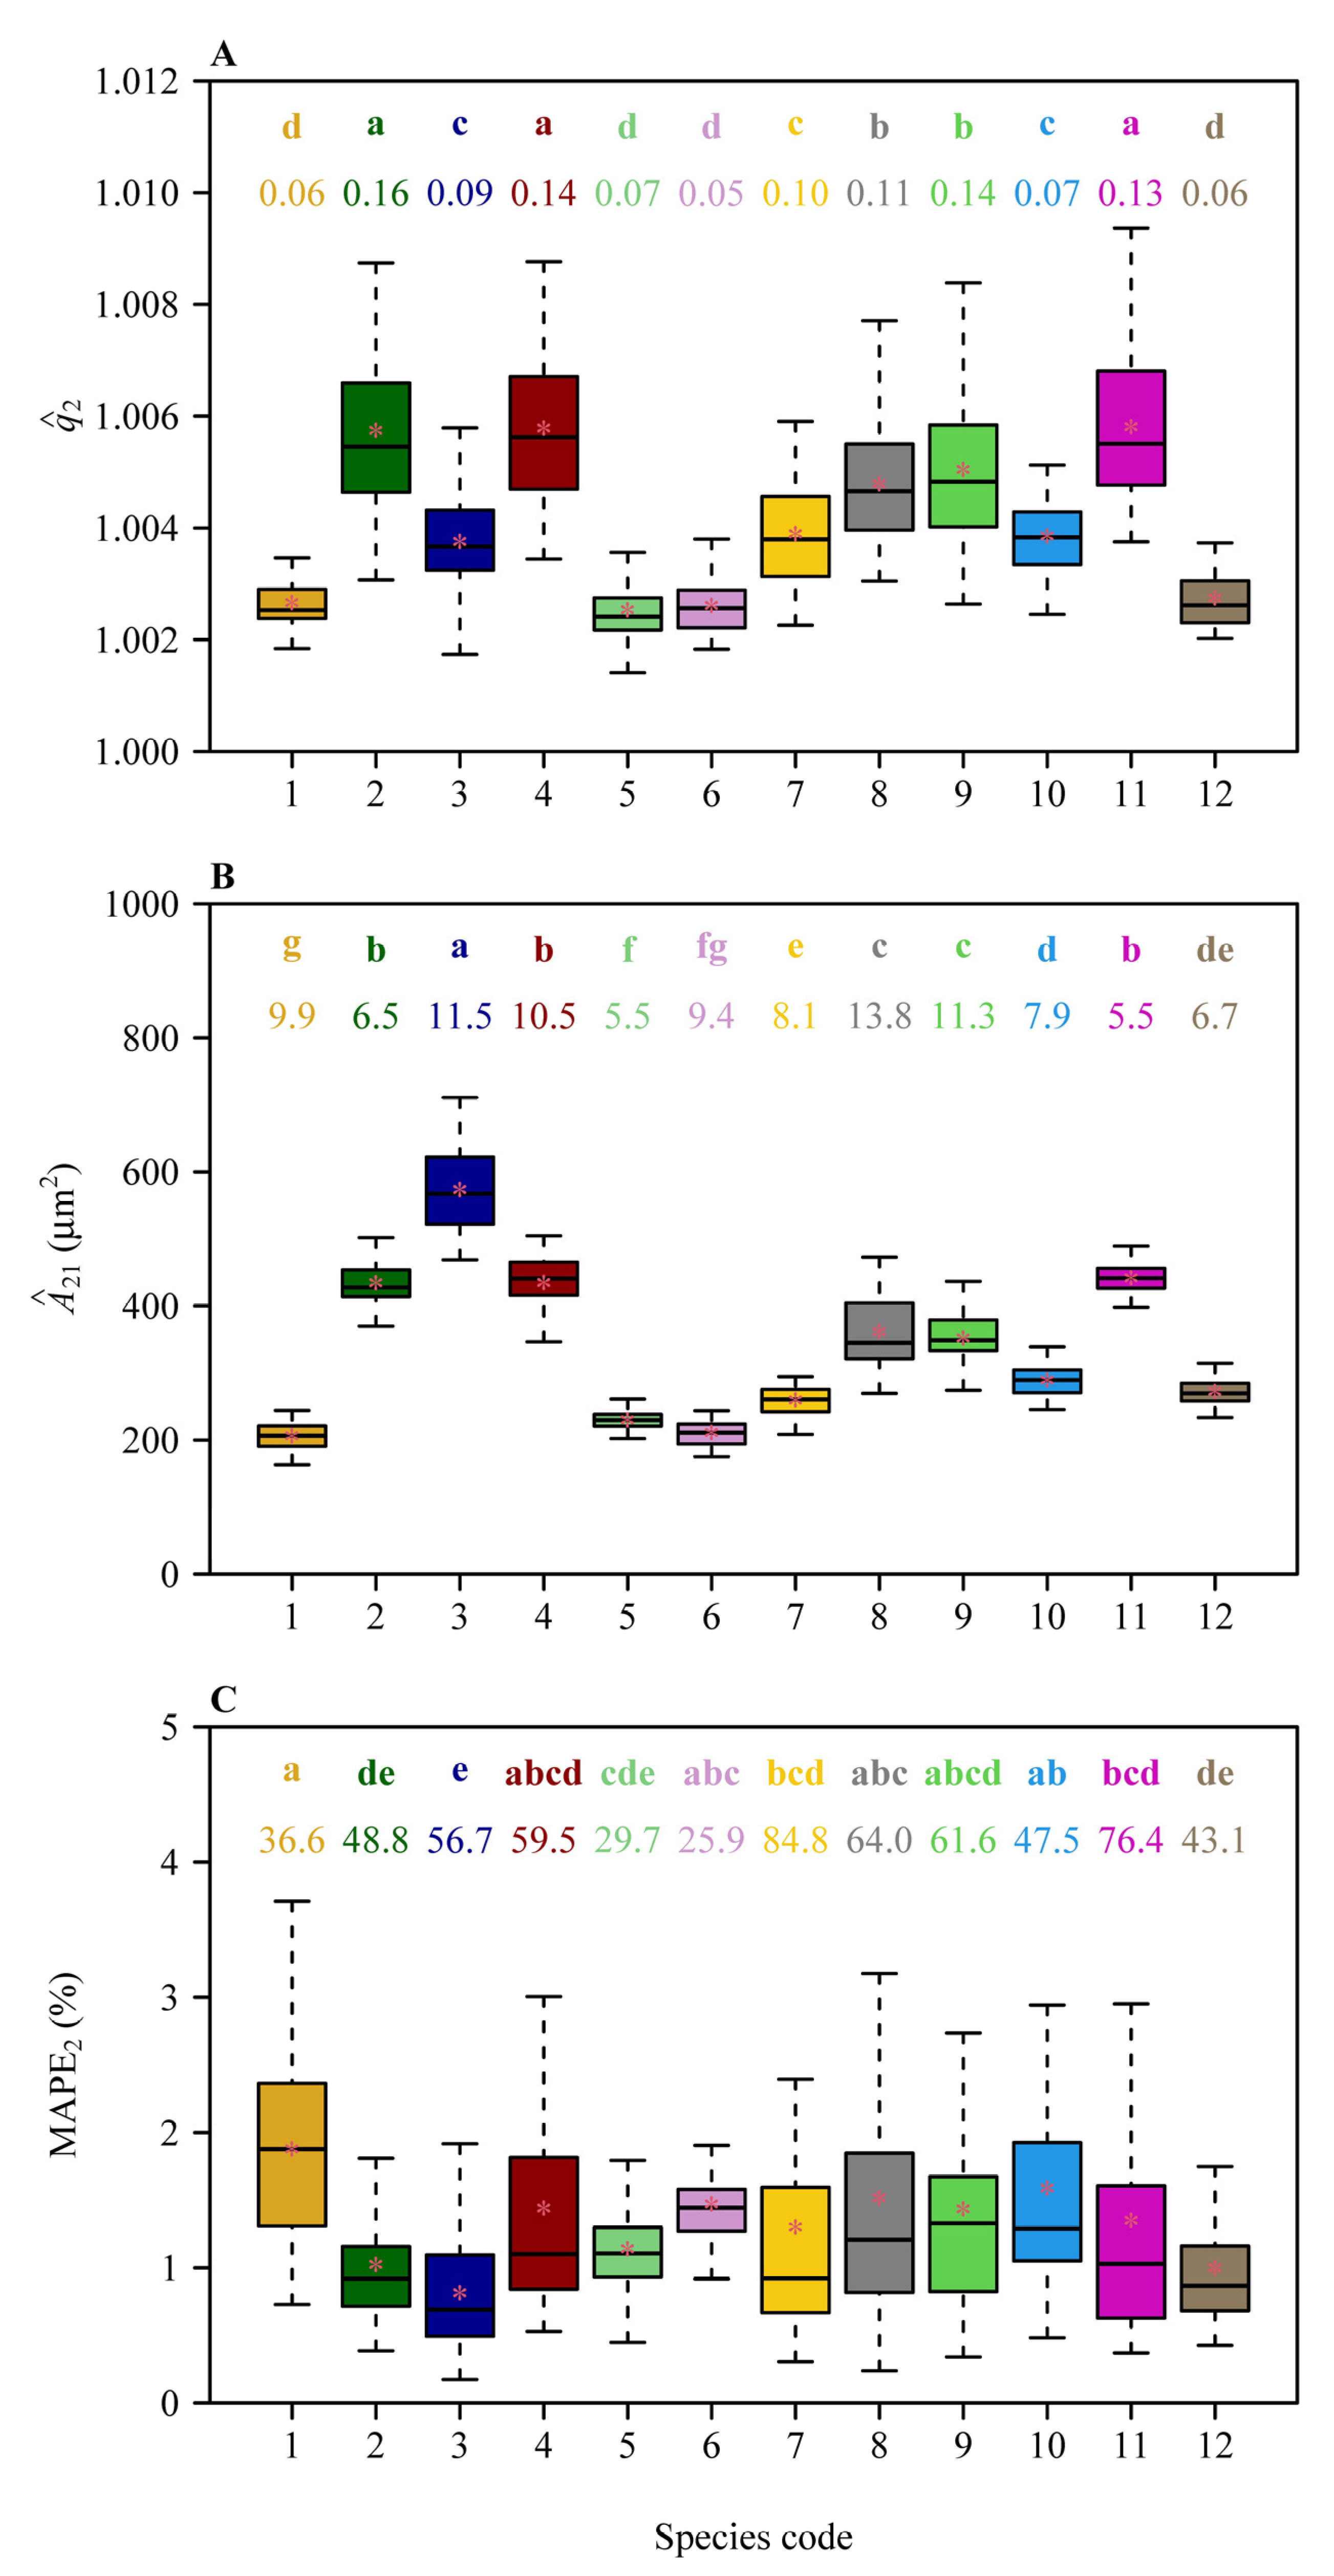
3. Results
4. Discussion
4.1. The Superiority and Limitation of Method-2
4.2. Biological Significance of the Geometric Series of Stomatal Areas
5. Conclusions
Supplementary Materials
Author Contributions
Funding
Data Availability Statement
Acknowledgments
Conflicts of Interest
References
- Peat, H.J.; Fitter, A.H. A comparative study of the distribution and density of stomata in the British flora. Biol. J. Linn. Soc. 1994, 52, 377–393. [Google Scholar] [CrossRef]
- Lawson, T.; Blatt, M.R. Stomatal size, speed, and responsiveness impact on photosynthesis and water use efficiency. Plant Physiol. 2014, 164, 1556–1570. [Google Scholar] [CrossRef]
- Harrison, E.L.; Cubas, L.A.; Gray, J.E.; Hepworth, C. The influence of stomatal morphology and distribution on photosynthetic gas exchange. Plant J. 2020, 101, 768–779. [Google Scholar] [CrossRef] [PubMed]
- Liu, C.; Sack, L.; Li, Y.; Zhang, J.; Yu, K.; Zhang, Q.; He, N.; Yu, G. Relationships of stomatal morphology to the environment across plant communities. Nat. Commun. 2023, 14, 6629. [Google Scholar] [CrossRef]
- Franks, P.J.; Farquhar, G.D. The mechanical diversity of stomata and its significance in gas-exchange control. Plant Physiol. 2007, 143, 78–87. [Google Scholar] [CrossRef] [PubMed]
- Pan, S.; Wang, X.; Yan, Z.; Wu, J.; Guo, L.; Peng, Z.; Wu, Y.; Li, J.; Wang, B.; Su, Y.; et al. Leaf stomatal configuration and photosynthetic traits jointly affect leaf water use efficiency in forests along climate gradients. New Phytol. 2024, 244, 1250–1262. [Google Scholar] [CrossRef] [PubMed]
- Fanourakis, D.; Heuvelink, E.; Carvalho, S.M.P. Spatial heterogeneity in stomatal features during leaf elongation: An analysis using Rosa hybrida. Funct. Plant Biol. 2015, 42, 737–745. [Google Scholar] [CrossRef]
- Fanourakis, D.; Aliniaeifard, S.; Sellin, A.; Giday, H.; Körner, O.; Rezaei Nejad, A.; Delis, C.; Bouranis, D.; Koubouris, G.; Kambourakis, E.; et al. Stomatal behavior following mid- or long-term exposure to high relative air humidity: A review. Plant Physiol. Biochem. 2020, 153, 92–105. [Google Scholar] [CrossRef]
- Wong, S.C.; Gowan, I.R.; Farquhar, G.D. Stomatal conductance correlates with photosynthetic capacity. Nature 1979, 282, 424–426. [Google Scholar] [CrossRef]
- Sõber, A. Hydraulic conductance, stomatal conductance, and maximal photosynthetic rate in bean leaves. Photosynthetica 1998, 34, 599–603. [Google Scholar] [CrossRef]
- Franks, P.J.; Beerling, D.J. Maximum leaf conductance driven by CO2 effects on stomatal size and density over geologic time. Proc. Natl. Acad. Sci. USA 2009, 106, 10343–10347. [Google Scholar] [CrossRef] [PubMed]
- Fanourakis, D.; Giday, H.; Milla, R.; Pieruschka, R.; Kjaer, K.H.; Bolger, M.; Vasilevski, A.; Nunes-Nesi, A.; Fiorani, F.; Ottosen, C.O. Pore size regulates operating stomatal conductance, while stomatal densities drive the partitioning of conductance between leaf sides. Ann. Bot. 2015, 115, 555–565. [Google Scholar] [CrossRef] [PubMed]
- de Boer, H.J.; Price, C.A.; Wagner-Cremer, F.; Dekker, S.C.; Franks, P.J.; Veneklaas, E.J. Optimal allocation of leaf epidermal area for gas exchange. New Phytol. 2016, 210, 1219–1228. [Google Scholar] [CrossRef] [PubMed]
- Shi, P.; Jiao, Y.; Diggle, P.J.; Turner, R.; Wang, R.; Niinemets, Ü. Spatial distribution characteristics of stomata at the areole level in Michelia cavaleriei var. platypetala (Magnoliaceae). Ann. Bot. 2021, 128, 875–885. [Google Scholar] [CrossRef]
- Rudall, P.J. Phylogenetic, developmental and functional aspects of stomatal patterning: Lessons from magnoliids. Bot. Rev. 2023, 89, 1–18. [Google Scholar] [CrossRef]
- Li, Q.; Niklas, K.J.; Niinemets, Ü.; Zhang, L.; Yu, K.; Gielis, J.; Gao, J.; Shi, P. Stomatal shape described by a superellipse in four Magnoliaceae species. Bot. Lett. 2024, 171, 93–101. [Google Scholar] [CrossRef]
- Zhang, L.; Niklas, K.J.; Niinemets, Ü.; Li, Q.; Yu, K.; Li, J.; Chen, L.; Shi, P. Stomatal area estimation based on stomatal length and width of four Magnoliaceae species: Even “kidney”-shaped stomata are not elliptical. Trees Struct. Funct. 2023, 37, 1333–1342. [Google Scholar] [CrossRef]
- Montgomery, E.G. Correlation Studies in Corn, Annual Report No. 24; Nebraska Agricultural Experimental Station: Lincoln, NB, USA, 1911; pp. 108–159. [Google Scholar]
- Shi, P.; Liu, M.; Ratkowsky, D.A.; Gielis, J.; Su, J.; Yu, X.; Wang, P.; Zhang, L.; Lin, Z.; Schrader, J. Leaf area–length allometry and its implications in leaf shape evolution. Trees 2019, 33, 1073–1085. [Google Scholar] [CrossRef]
- Yu, X.; Shi, P.; Schrader, J.; Niklas, K.J. Nondestructive estimation of leaf area for 15 species of vines with different leaf shapes. Am. J. Bot. 2020, 107, 1481–1490. [Google Scholar] [CrossRef]
- Schrader, J.; Shi, P.; Royer, D.L.; Peppe, D.J.; Gallagher, R.V.; Li, Y.; Wang, R.; Wright, I.J. Leaf size estimation based on leaf length, width and shape. Ann. Bot. 2021, 128, 395–406. [Google Scholar] [CrossRef]
- Mu, Y.; He, K.; Shi, P.; Wang, L.; Deng, L.; Shi, Z.; Liu, M.; Niklas, K.J. Comparison between computer recognition and manual measurement methods for the estimation of leaf area. Ann. Bot. 2024, 134, 501–510. [Google Scholar] [CrossRef] [PubMed]
- Yan, C.; Shi, P.; Yu, K.; Guo, X.; Lian, M.; Miao, Q.; Wang, L.; Yao, W.; Zheng, Y.; Zhu, F.; et al. Using the Montgomery-Koyama-Smith equation to calculate the stomatal area per unit lamina area for 12 Magnoliaceae species. Ann. Bot. 2024, 134, 1151–1163. [Google Scholar] [CrossRef]
- Spiess, A.N.; Neumeyer, N. An evaluation of R2 as an inadequate measure for nonlinear models in pharmacological and biochemical research: A Monte Carlo approach. BMC Pharmacol. 2010, 10, 6. [Google Scholar] [CrossRef] [PubMed]
- Jiao, Y.; Gao, Z.; Wang, R. Application of segregation process in observing the leaf stomatal structure of Michelia plants. Anhui For. Sci. Technol. 2021, 47(1), 26–29. [Google Scholar]
- Shi, P.; Li, B.L.; Wang, J.; Mu, Y.; Yao, W.; Lian, M.; Deng, L.; Niklas, K.J. Geometric series exists in nature: Evidence from sorted area sequences of floral parts and leaves. Ann. N. Y. Acad. Sci. 2025, 1543, 79–85. [Google Scholar] [CrossRef]
- Nelder, J.A.; Mead, R. A simplex method for function minimization. Comput. J. 1965, 7, 308–313. [Google Scholar] [CrossRef]
- Hsu, J.C. Multiple Comparisons: Theory and Methods; Chapman and Hall/CRC: New York, NY, USA, 1996. [Google Scholar]
- R Core Team. R: A Language and Environment for Statistical Computing; R Foundation for Statistical Computing: Vienna, Austria, 2022; Available online: https://www.r-project.org/ (accessed on 1 June 2022).
- Shi, P.; Ridland, P.; Ratkowsky, D.A.; Li, Y. IPEC: Root Mean Square Curvature Calculation, Version 1.1.0; R Foundation for Statistical Computing: Vienna, Austria, 2024; Available online: https://cran.r-project.org/web/packages/IPEC/index.html (accessed on 13 January 2024).
- Bates, D.M.; Watts, D.G. Relative curvature measures of nonlinearity (with discussion). J. R. Stat. Soc. Ser. B 1980, 42, 1–16. [Google Scholar] [CrossRef]
- Ratkowsky, D.A. Nonlinear Regression Modeling; Marcel Dekker: New York, NY, USA, 1983. [Google Scholar]
- Ratkowsky, D.A. Handbook of Nonlinear Regression Models; Marcel Dekker: New York, NY, USA, 1990. [Google Scholar]
- Ratkowsky, D.A.; Reddy, G.V.P. Empirical model with excellent statistical properties for describing temperature-dependent developmental rates of insects and mites. Ann. Entomol. Soc. Am. 2017, 110, 302–309. [Google Scholar] [CrossRef]
- Gielis, J. A general geometric transformation that unifies a wide range of natural and abstract shapes. Am. J. Bot. 2003, 90, 333–338. [Google Scholar] [CrossRef]
- Liu, C.; Li, Y.; Xu, L.; Li, M.; Wang, J.; Yan, P.; He, N. Stomatal arrangement pattern: A new direction to explore plant adaptation and evolution. Front. Plant Sci. 2021, 12, 655255. [Google Scholar] [CrossRef]
- Yao, W.; Niinemets, Ü.; Niklas, K.J.; Lian, M.; Yu, K.; Ratkowsky, D.A.; Shi, P. Low inequality in stomatal area distributions detected by two performance equations in 12 tree and shrub Magnoliaceae species. Trees Struct. Funct. 2025. under review. [Google Scholar]
Disclaimer/Publisher’s Note: The statements, opinions and data contained in all publications are solely those of the individual author(s) and contributor(s) and not of MDPI and/or the editor(s). MDPI and/or the editor(s) disclaim responsibility for any injury to people or property resulting from any ideas, methods, instructions or products referred to in the content. |
© 2025 by the authors. Licensee MDPI, Basel, Switzerland. This article is an open access article distributed under the terms and conditions of the Creative Commons Attribution (CC BY) license (https://creativecommons.org/licenses/by/4.0/).
Share and Cite
Yan, C.; Shi, P.; Yao, W.; Yu, K.; Niinemets, Ü. A Nonlinear Fitting Method Provides Strong Support for Geometric Series of Stomatal Area in 12 Magnoliaceae Species. Plants 2025, 14, 893. https://doi.org/10.3390/plants14060893
Yan C, Shi P, Yao W, Yu K, Niinemets Ü. A Nonlinear Fitting Method Provides Strong Support for Geometric Series of Stomatal Area in 12 Magnoliaceae Species. Plants. 2025; 14(6):893. https://doi.org/10.3390/plants14060893
Chicago/Turabian StyleYan, Chunxiu, Peijian Shi, Weihao Yao, Kexin Yu, and Ülo Niinemets. 2025. "A Nonlinear Fitting Method Provides Strong Support for Geometric Series of Stomatal Area in 12 Magnoliaceae Species" Plants 14, no. 6: 893. https://doi.org/10.3390/plants14060893
APA StyleYan, C., Shi, P., Yao, W., Yu, K., & Niinemets, Ü. (2025). A Nonlinear Fitting Method Provides Strong Support for Geometric Series of Stomatal Area in 12 Magnoliaceae Species. Plants, 14(6), 893. https://doi.org/10.3390/plants14060893