Article

Characterization of 4-Coumarate-CoA Ligase (4CL) Genes in Wheat Uncovers Ta4CL91’s Role in Drought and Salt Stress Adaptation

Institute of Wheat Research, Shanxi Agricultural University, Linfen 041000, China
*
Authors to whom correspondence should be addressed.
Plants 2025, 14(9), 1301; https://doi.org/10.3390/plants14091301
Submission received: 26 March 2025 / Revised: 21 April 2025 / Accepted: 23 April 2025 / Published: 25 April 2025
(This article belongs to the Section Plant Response to Abiotic Stress and Climate Change)

Abstract

:
During the growth process, wheat (Triticum aestivum L.) is frequently subjected to abiotic stress. However, the mechanisms of abiotic stress in wheat are not yet well understood. In other crops, 4-coumarate-CoA ligases (4CLs) have been found to be involved in abiotic stress responses, but a systematic analysis of the response of 4CLs to abiotic stress in wheat has not yet been conducted. Through a comprehensive genome-wide analysis, we identified 110 putative 4CL genes in wheat. These genes were phylogenetically divided into distinct groups, with the authentic 4CLs forming a separate branch and 4CL-like genes being further categorized into six subgroups. Each clade exhibited conserved gene structures and motif compositions. Promoter analysis identified a variety of stress-responsive cis-regulatory elements within Ta4CL genes, indicating their potential involvement in stress regulation mechanisms. Expression profiling under drought and salt stress conditions identified specific 4CL genes linked to stress tolerance. Notably, Ta4CL91, a member of the 4CL clade, showed strong dual responsiveness to both drought and salt stresses. Using virus-induced gene silencing (VIGS), we suppressed Ta4CL91 expression and observed that the Ta4CL91-silenced plants became more sensitive to drought and salt stresses, highlighting Ta4CL91’s critical role in stress adaptation in wheat. This comprehensive study not only expands our understanding of the 4CL gene family in wheat but also highlights the critical involvement of specific 4CL members, such as Ta4CL91, in mediating this plant’s resistance to abiotic stresses.

1. Introduction

Wheat is one of the world’s major staple crops, providing essential carbohydrates and proteins for humanity and serving as a primary food source in many countries [1]. However, wheat production is often affected by abiotic stresses such as drought, high temperatures, salinity, and low temperatures, which significantly reduce its growth and yield [2,3]. Climate change has intensified the frequency of extreme weather events, further threatening the stability and productivity of wheat [4]. Therefore, developing stress-resistant varieties and improving cultivation techniques are crucial for ensuring global food security.
4-coumarate-CoA ligases (4CL, EC 6.2.1.12) are the key enzymes in the phenylpropanoid pathway, serving as the main branch point enzymes. They catalyze the conversion of cinnamic acid into corresponding CoA thioesters [5]. The 4CL genes have the capacity to encode multiple enzymes and demonstrate distinct substrate affinities, which appear to align with various metabolic functions [6]. The compounds produced by 4CL serve as critical precursors for a diverse array of enzymes that drive the biosynthesis of numerous biologically and structurally significant substances, including lignin, anthocyanins, flavonoids, aurones, suberin, cutin, coumarins, stilbenes, sporopollenin, and other essential metabolites [5].
The 4CL proteins are characterized by the presence of two highly conserved domains: Box I, with the amino acid sequence SSGTTGLPKGV, and Box II, with the amino acid sequence GEICIRG [7]. Box I represents the AMP-binding functional domain, a pivotal component that is universally preserved across all members of the adenylate-forming enzyme family [7]. The Box II region exhibits a high degree of conservation specifically within the 4CL enzyme and does not play a direct role in catalysis [8,9]. In accordance with De Azevedo Souza’s classification, 104 proteins associated with 4CL have been classified into two overarching groups [10]. The first group encompasses a substantial cohort of adenylate-forming enzymes that potentially have vital metabolic functions and are conserved across a wide range of organisms [10]. The second group comprises adenylate-forming proteins, which include both authentic 4CL proteins and previously annotated Arabidopsis 4CL-like acyl-CoA synthetase (ACS) proteins [10]. In Arabidopsis thaliana, At4CL1–4 has been identified as the authentic 4CL and is further classified into two distinct types [11,12]. Specifically, At4CL1, At4CL2, and At4CL4 are grouped under type I (associated with lignin biosynthesis), while At4CL3 is situated within the type II cluster (linked to phenylpropanoid biosynthesis other than lignin) [12].
Existing reports indicate that the functions of the 4CL genes are intricately intertwined with the environmental pressures that plants confront [13,14]. A reduction in stress was primarily accomplished by regulating the biosynthesis of lignin, flavonoids, and other secondary metabolites [15,16,17,18]. Ta4CLs respond to UV radiation, hormonal signals, and environmental stimuli [19]. 6-BA promoted lignin accumulation in wheat cell walls and enhanced 4CL activity and Ta4CL gene expression under waterlogging stress [20]. In Fraxinus mandshurica, overexpression of Fm4CL2 conferred enhanced drought tolerance in tobacco [21]. The overexpression of Fm4CL-like1 in tobacco led to an enhancement in drought tolerance, attributed to the heightened accumulation of lignin and increased activities of antioxidant enzymes [22]. In the context of Mulberry, it was observed that all four Ma4CLs exhibited a response to salt stress. It was noted that Ma4CL1–3 displayed an overall up-regulation in the presence of salt stress, whereas Ma4CL4 demonstrated a pattern of up-regulation in stems and down-regulation in roots following exposure to salt stress [23]. In cotton plants, Gh4CL7-gene-silenced strains exhibited heightened sensitivity to drought treatment. Conversely, the overexpression of Gh4CL7 in Arabidopsis lines resulted in heightened tolerance of drought stress [24]. Despite the plethora of prior research, our understanding of the molecular mechanisms underlying the effects of 4CL on various stresses remains limited. Exploring the gene expression patterns of 4CL genes under different stress conditions could provide valuable insights for further elucidating the functional significance of 4CLs in wheat.
In this study, we adopted a unified 4CL nomenclature to designate both 4CL and 4CL-like genes. Through an extensive genome-wide analysis, we identified 110 Ta4CL genes and conducted detailed analyses of their protein structures, gene architectures, and promoter region cis-acting elements. By examining the transcriptional changes of Ta4CLs under drought and salt stress conditions, we identified Ta4CL91 as a gene significantly upregulated in response to these stressors. Functional validation through virus-induced gene silencing demonstrated that Ta4CL91-knockdown plants displayed reduced stress tolerance, highlighting this gene’s essential role in stress adaptation. These results establish Ta4CL91 as a promising candidate for breeding stress-resistant wheat varieties and offer significant insights into the functional roles of Ta4CLs.

2. Results

2.1. Genome-Wide Identification and Phylogenetic Analysis of 4CL Genes in Wheat

Based on the genome-wide data of bread wheat from Ensembl plants, two hidden Markov models corresponding to the AMP-binding (PF00501) and AMP-binding_C (PF13193) domains were employed as queries for screening protein sequences containing these specific domains. After screening and analysis, we identified a total of 110 Ta4CL genes and renamed them according to their chromosomal positions to enhance the convenience of subsequent research (Table S1). The physicochemical properties of Ta4CLs were evaluated using the ExPASy-ProtParam tool (Table 1). The Ta4CL proteins possess amino acid sequences of varying lengths, ranging from 325 to 1198 residues. These proteins display a wide range of molecular weights, spanning from 35.10 to 130.91 kDa, and theoretical isoelectric points that vary from 5.23 to 9.3. The range of the instability index spans from 23.98 to 49.26, with 70 proteins exhibiting values below 40 and 40 proteins displaying values above 40. This suggests a diminished level of stability within the latter group of proteins. The aliphatic index ranges from 78.19 to 104.94, indicating the varying thermal stability of different Ta4CL proteins. The grand average hydropathy (GRAVY) index spans from −0.232 to 0.309, indicating the degree of hydrophobicity or hydrophilicity. These results offer a comprehensive overview of the entire Ta4CL gene family, furnishing vital foundational information for further exploration and examination.
To further analyze the gene functions and phylogenetic relationships of the wheat 4CL family, a clustering analysis was conducted on the homologous genes of 4CL in wheat and Arabidopsis (Figure 1). Subsequently, the evolutionary relationships were classified based on the method for classifying the 4CL gene family described by De Azevedo Souza. The members of the 4CL gene family were classified into seven distinct clades, denoted as Clade 4CL and A–F. The wheat 4CL gene located in the Clade 4CL branch consists of a total of 11 genes. Among them, three wheat 4CL genes, namely, Ta4CL91, Ta4CL97, and Ta4CL100, show close homology to the At4CL3 gene in Arabidopsis. The remaining eight genes, named Ta4CL5, Ta4CL12, Ta4CL18, Ta4CL90, Ta4CL96, Ta4CL99, Ta4CL105, and Ta4CL110, exhibit relatively close homology to At4CL1 and At4CL2 in Arabidopsis. These genes are clustered within the 4CL clade, indicating their likely involvement in the biosynthesis of lignin and flavonoids. The Clade A–E encompasses the Arabidopsis At4CL-like acyl-CoA synthetase (ACS) proteins. Specifically, Ta4CL6, Ta4CL13, and Ta4CL19 cluster into Clade A, while Ta4CL43, Ta4CL52, and Ta4CL65 cluster into Clade B. Meanwhile, Ta4CL1, Ta4CL3, and Ta4CL4 form a cluster within Clade C, while Ta4CL54, Ta4CL67, and Ta4CL74 are grouped together in Clade D. Additionally, there are 19 Ta4CLs in Clade E branch, demonstrating a relatively large quantity. In Clade F, At4CL-like genes are notably absent, with only Ta4CL genes forming a distinct branch. This clade is potentially composed of AAEs (acyl-activating enzymes) or AAEL (acyl-activating enzyme-like) proteins.

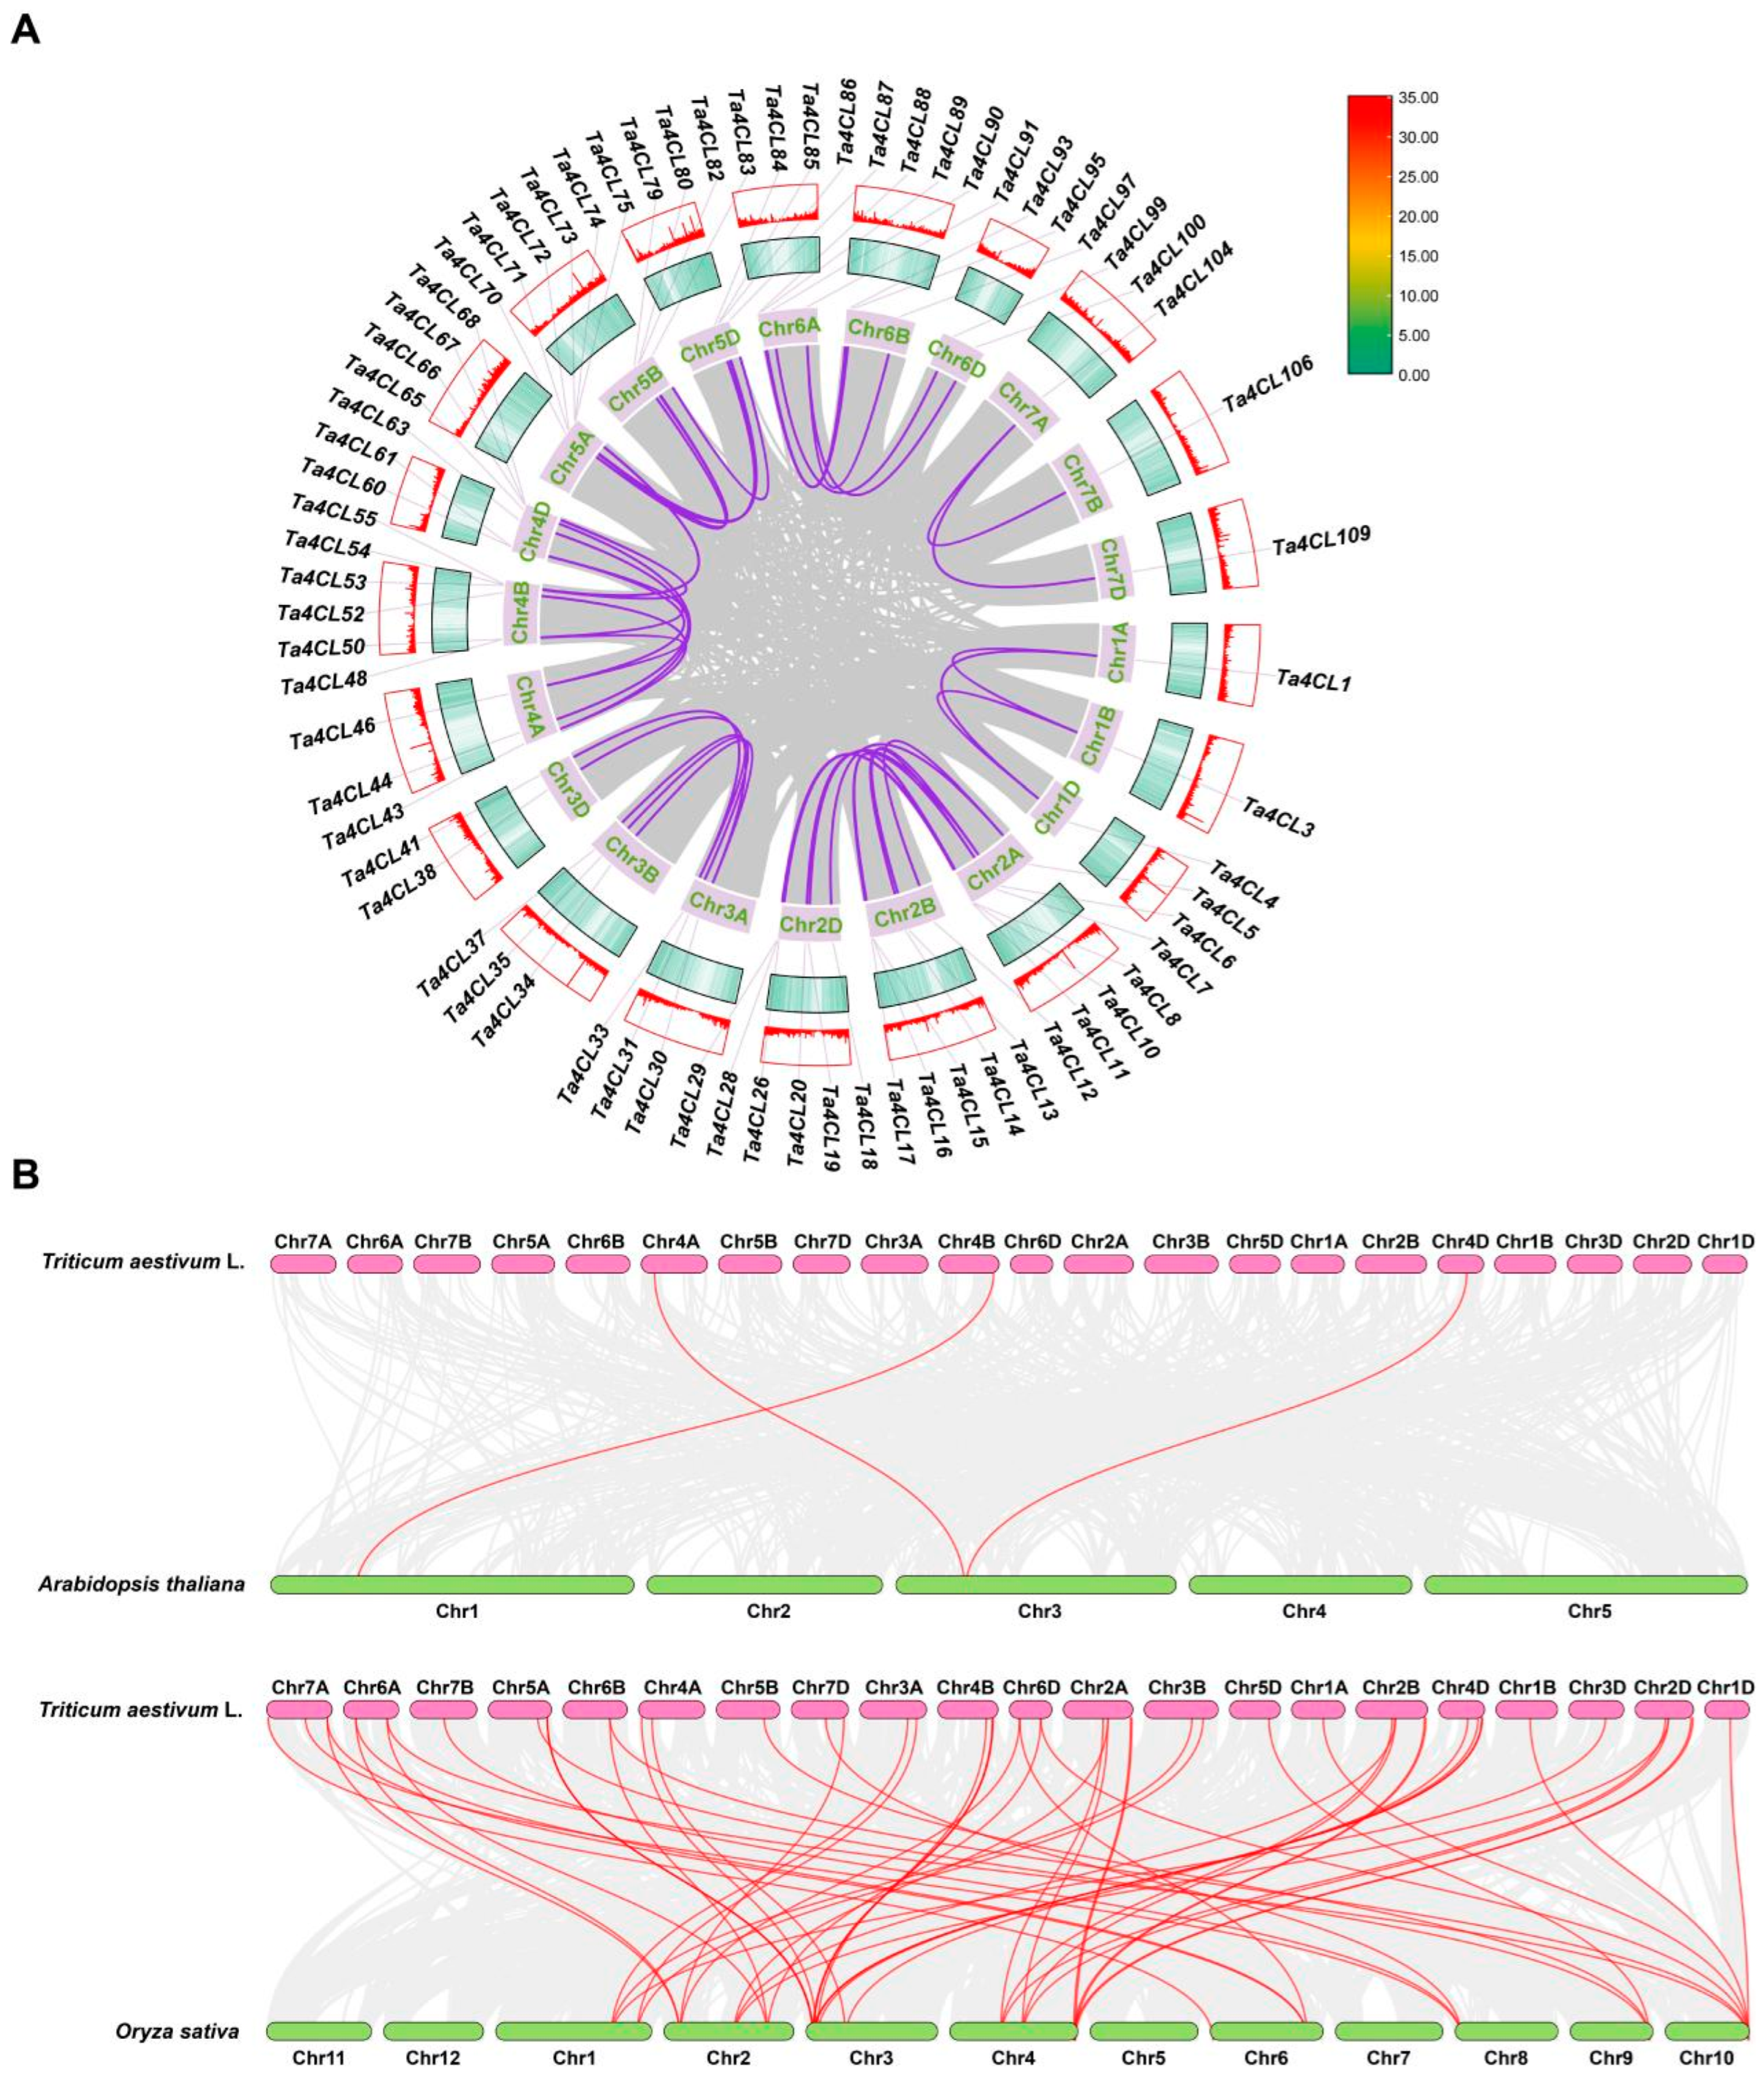
2.2. Chromosomal Distribution and Collinearity Analysis of Ta4CL Genes

Through an analysis of chromosomal distribution, a total of 110 4CLs were found to be unevenly mapped across 21 chromosomes from the wheat A, B, and D genomes (Figure 2). Among them, Chromosome 4B and 2D both possess 12 Ta4CL genes, exhibiting the highest Ta4CL density, at 10.9%. In contrast, Chromosome 1A and 1D each only have one Ta4CL gene, showing the lowest Ta4CL density, at only 0.9%. In the sub-genomes A, B, and D, there are 35, 37, and 38 members of the Ta4CL gene family in each sub-genome, respectively. This represents 31.8%, 33.6%, and 34.5% of the total, showcasing a balanced distribution across the different sub-genomes.
An analysis of intraspecific collinearity revealed the presence of 46 pairs exhibiting genomic synteny among 71 genes within the wheat 4CL gene family (Figure 3A). In the Clade 4CL branch, Ta4CL91 on Chr6A is collinear with Ta4CL97 on Chr6B and Ta4CL100 on Chr6D, and Ta4CL5 on Chr2A is colinear with Ta4CL12 on Chr2B and Ta4CL18 on Chr2D. Additionally, there is collinearity between Ta4CL90 on Chr6A and Ta4CL99 on Chr6D. This indicates that whole-genome duplication or polyploidization played a crucial role in driving the evolution of the wheat 4CL gene family. Subsequently, we conducted collinearity analyses of wheat and Arabidopsis, as well as wheat and rice, to investigate the potential evolutionary processes that have shaped 4CLs (Figure 3B). The results showed that there were 3 collinear gene pairs formed by 3 wheat 4CL genes and two Arabidopsis 4CL genes as well as 57 collinear gene pairs formed by a total of 48 wheat 4CL genes and 19 rice 4CL genes. This indicates that the 4CL family in wheat and rice exhibits a remarkably high level of homology. It is possible that these syntenic gene pairs of 4CL may possess analogous biological functions or even share a common ancestor.

2.3. Analysis of Conserved Motifs, Domains, and Gene Structures Within the 4CL Gene Family in Wheat

To gain a more profound understanding of the members of the Ta4CL gene family, we undertook an extensive investigation into the conserved motifs, domains, and gene structures of the identified Ta4CL genes (Figure 4). By utilizing MEME, we identified a total of ten distinct motifs within the Ta4CL gene family, which were designated as motif 1 through motif 10 (Table S2). The conservative motif abundance of Ta4CL proteins ranged from 5 to 10. Within the same branch, wheat 4CLs shared a similar composition of conserved motifs, highlighting their close evolutionary relationship (Figure 4B). All members of the Ta4CL gene family possess the 4CL domain and AFD_class_I superfamily domain in the NCBI CDD database. Additionally, they also feature the AMP binding domain and AMP binding_C domain from the Pfam database (Figure 4C). The number of exons in the Ta4CL genes ranges from 1 to 18, and the identified structures of the Ta4CL genes exhibit a similar intron–exon distribution within the same clustering branch (Figure 4D).

2.4. Analysis of Cis-Acting Elements for Ta4CLs

Cis-acting elements play a crucial role in the transcriptional regulation of genes. Therefore, to further analyze the potential functions of Ta4CLs, we predicted the cis-acting elements in the upstream 2000 bp promoter sequences of each member (Figure 5). The promoter regions of the wheat 4CL gene family are complex and diverse, encompassing a variety of cis-acting elements. These elements are involved in the response to abiotic stresses such as drought and low temperatures as well as plant hormones like salicylic acid, abscisic acid, auxin, methyl jasmonate, and gibberellins. Additionally, this region also includes response elements related to growth and development, including flavonoid biosynthesis, circadian rhythm regulation, and cell cycle control. Together, these functional elements participate in the formation of a sophisticated regulatory mechanism for the wheat 4CL gene family, providing crucial support for adaptive changes in different environmental conditions. Among the confirmed members of 4CL, a multitude of promoter regions contain cis-acting elements related to ABA hormone and drought stress response. This indicates that Ta4CLs play a crucial role in regulating plant abiotic stress.

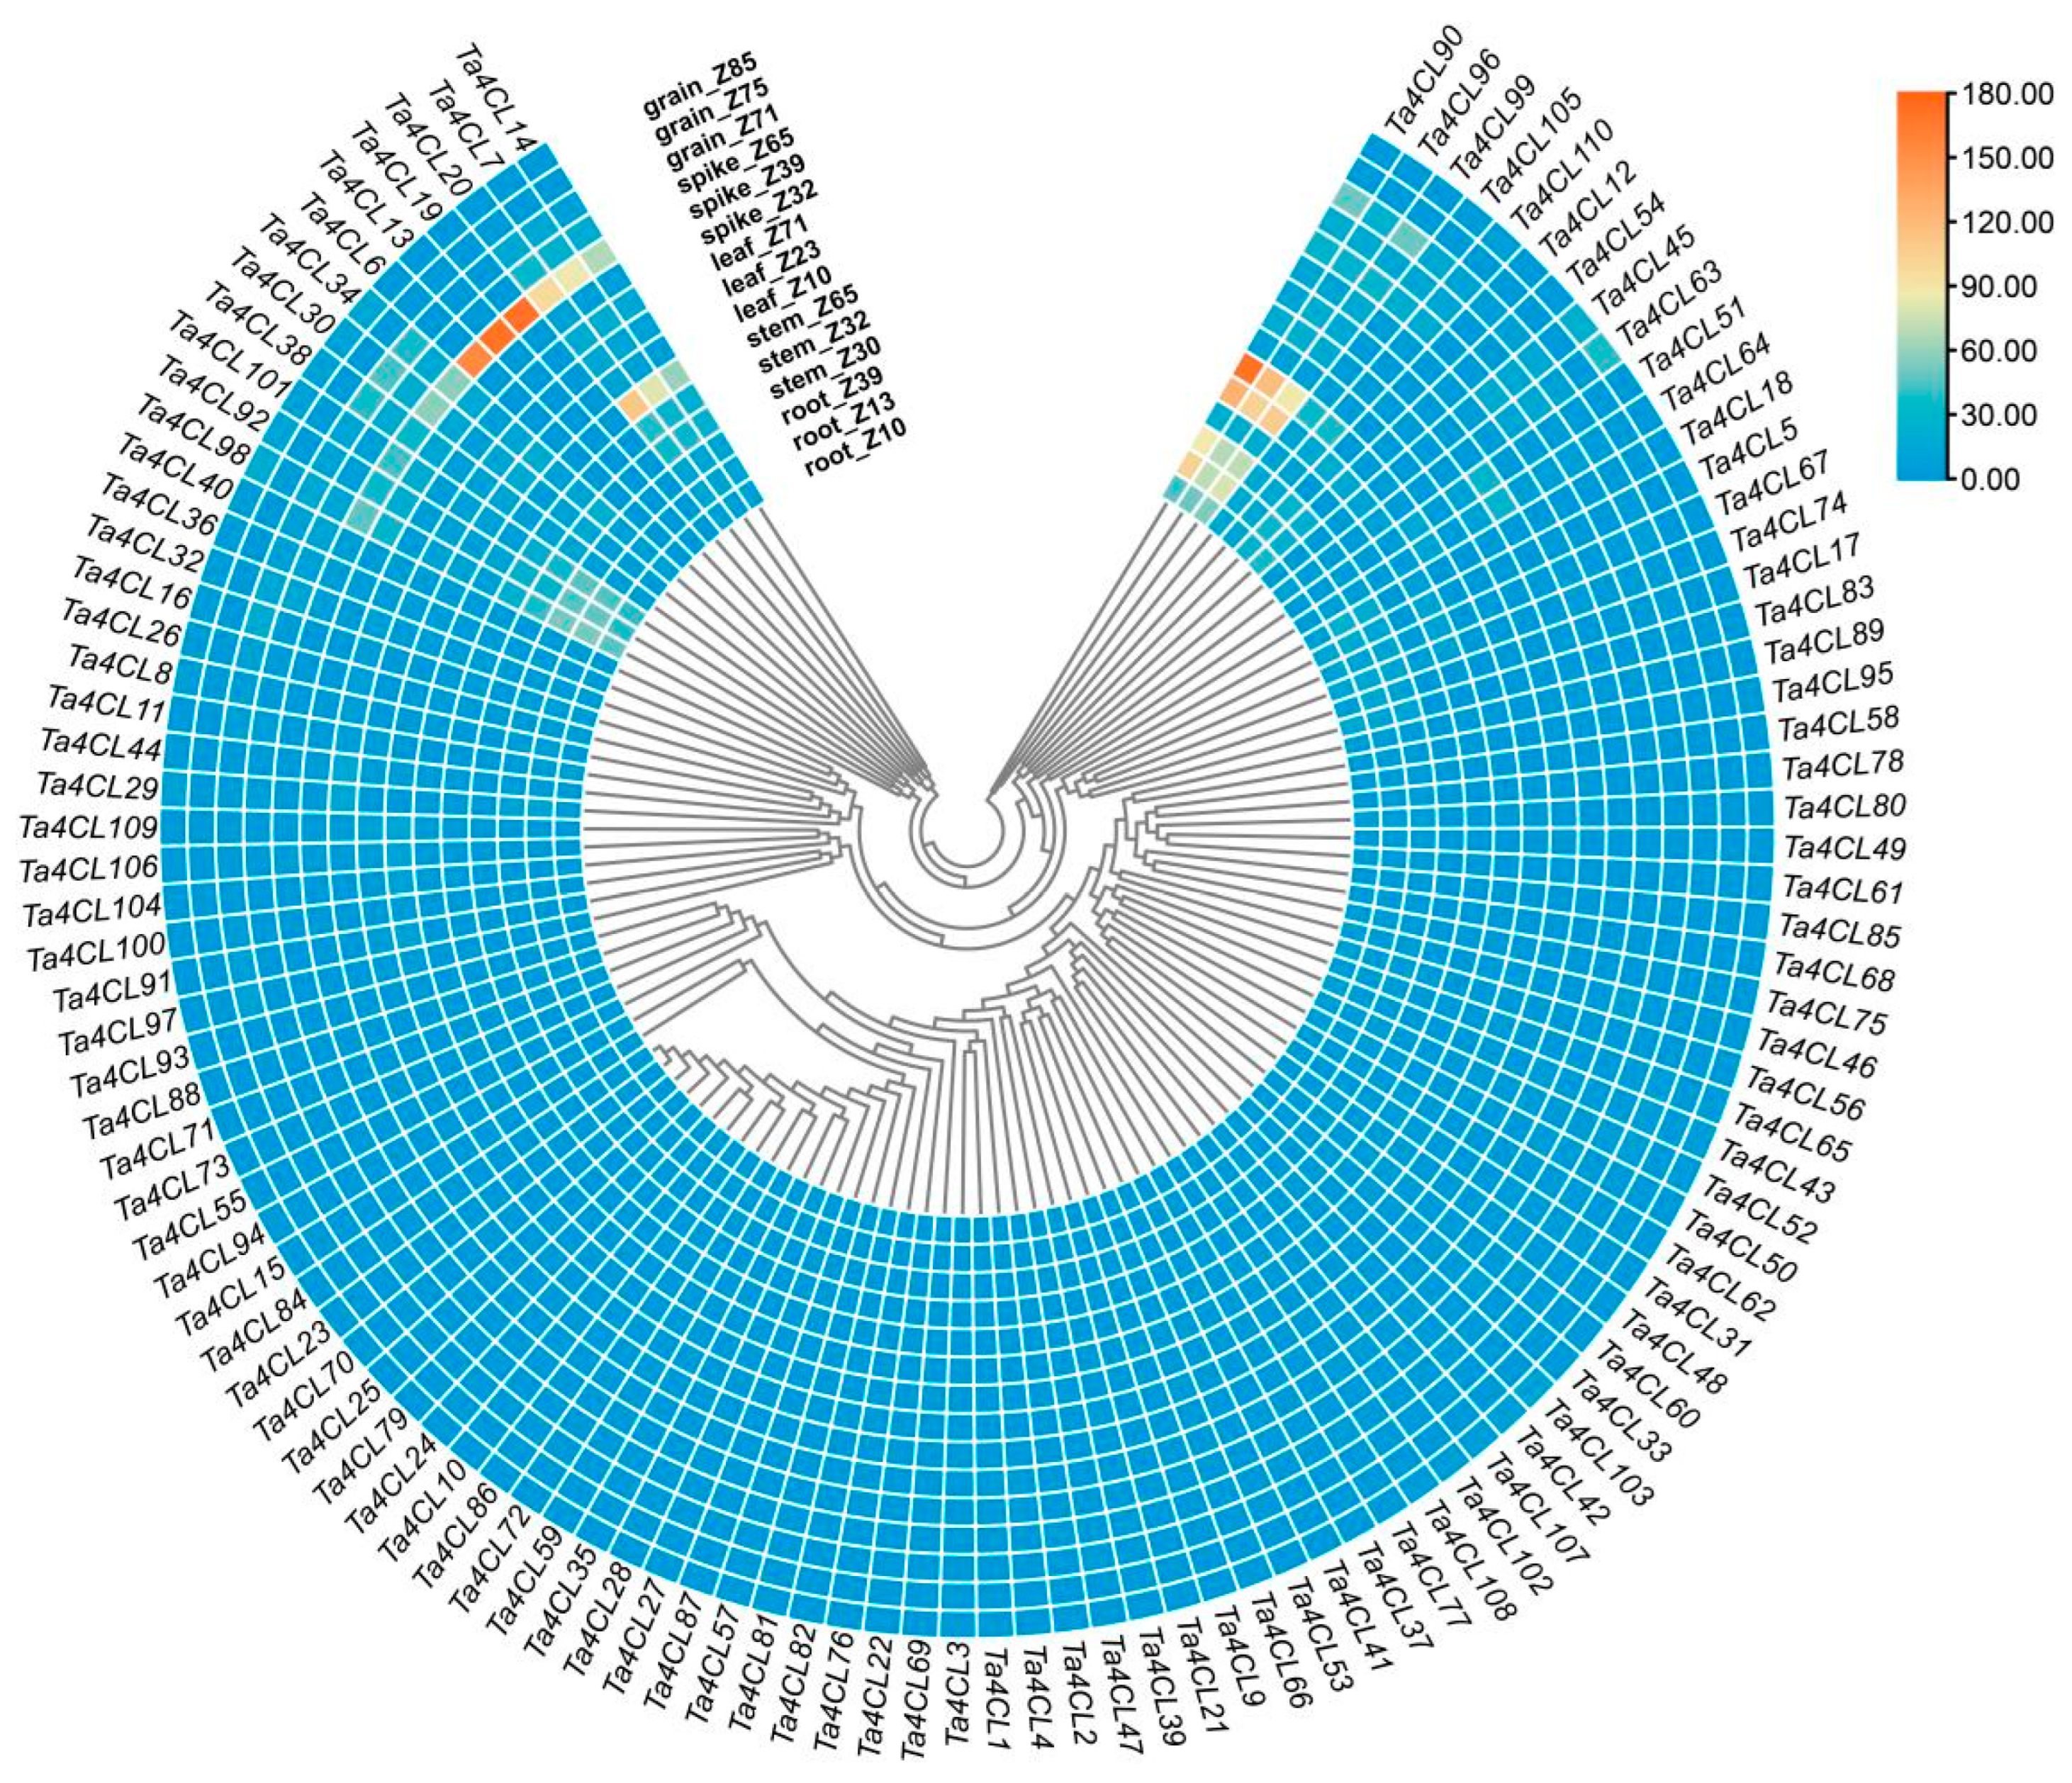
2.5. Analysis of the Tissue Expression Patterns of Ta4CL Genes

The expression profiles observed across diverse tissues offer valuable insights into the potential biological roles of genes that warrant further investigation. Therefore, we analyzed the transcriptional levels of the Ta4CL genes in five different wheat tissues (spikes, roots, leaves, grains, and stems) using publicly available RNA-seq data (Figure 6). The developmental stages of wheat were assessed based on the Zadoks growth scale within this database. The results show that Ta4CL6, Ta4CL7, Ta4CL13, Ta4CL19, and Ta4CL20 exhibit higher transcription levels in spikes. In stems, Ta4CL7, Ta4CL20, Ta4CL90, Ta4CL96, and Ta4CL99 exhibit elevated expression levels. Additionally, in roots, there are also high transcription levels of Ta4CL90, Ta4CL96, and Ta4CL99. These genes are likely to assume a pivotal role within these specific tissues. The intricate and distinctive tissue-specific expression profiles exhibited by the Ta4CL genes underscore their biological functional diversity as well as their potential contributions to the developmental and physiological processes of wheat.

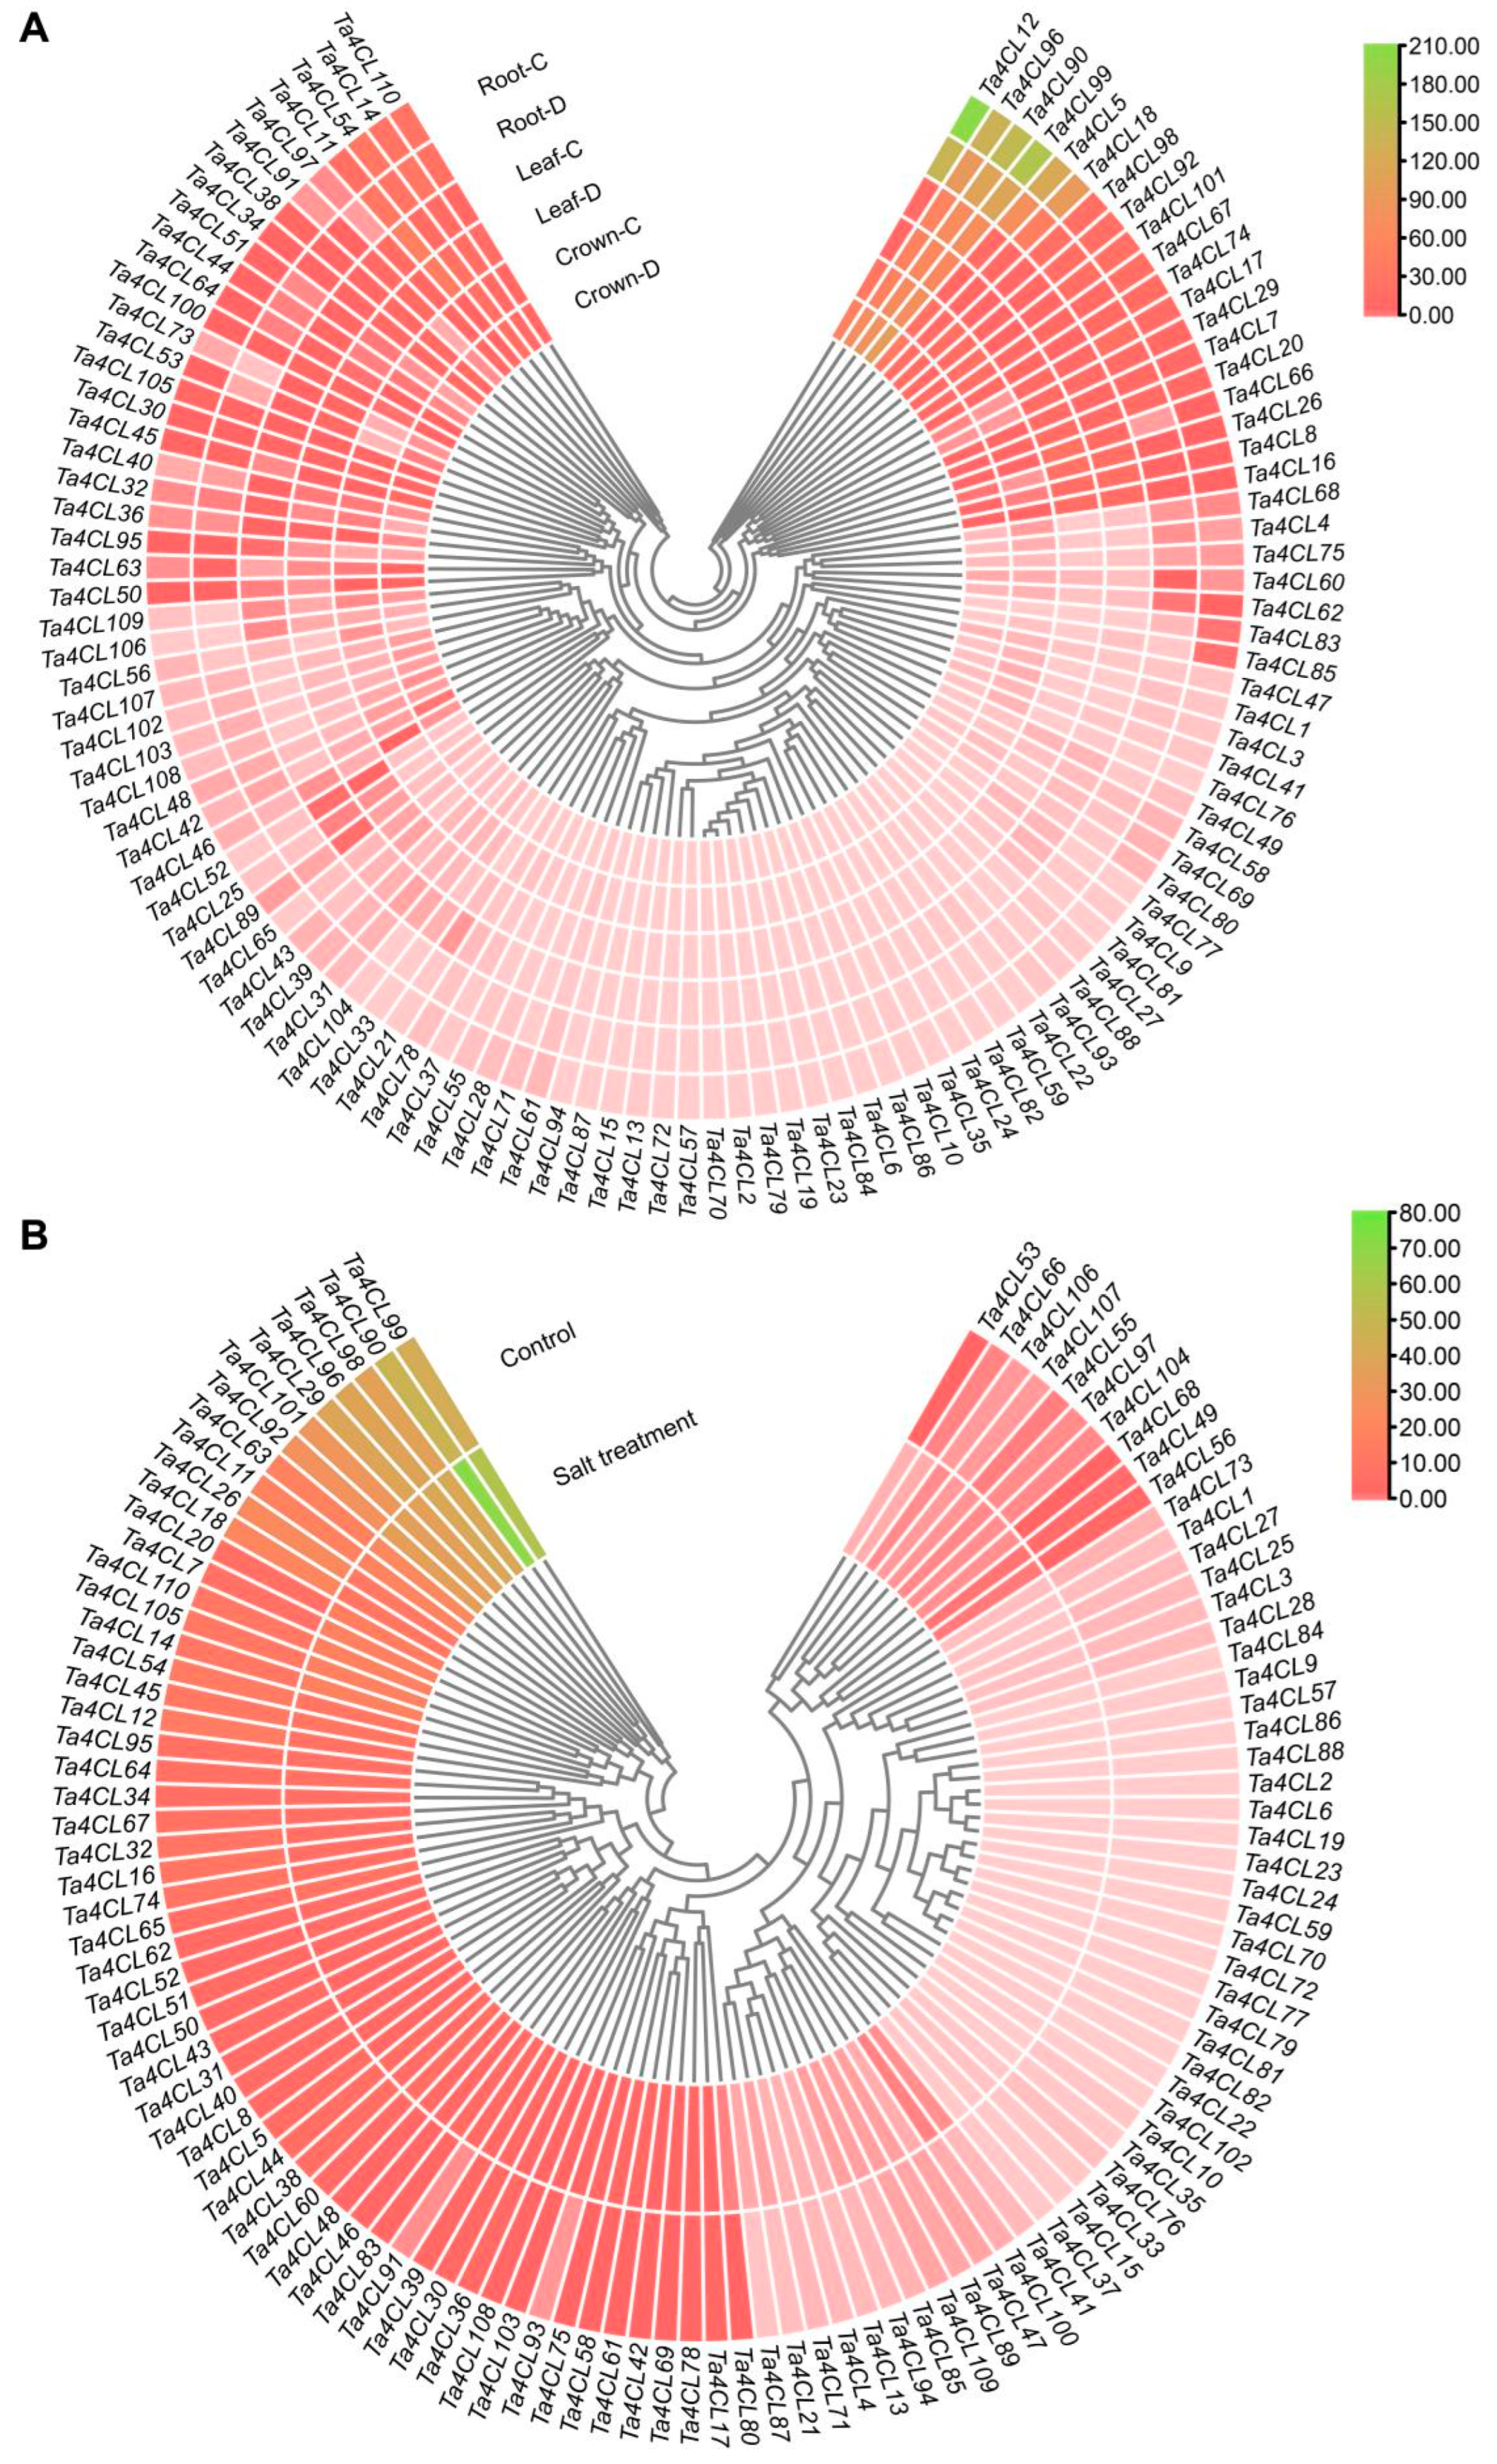
2.6. Expression Analysis of Ta4CLs Under Drought and Salt Stress

To investigate the response of Ta4CL genes to abiotic stress in wheat, we conducted an analysis of the transcriptional changes of Ta4CL genes under drought and salt stress conditions using RNA-seq data (NCBI accession number: SRP098756, SRP158842). The results showed that different Ta4CL genes exhibit varying degrees of response to drought (Figure 7A) and salt stress (Figure 7B). Under drought stress, the transcription of Ta4CL45 in wheat crowns and roots exhibited a twofold increase. Additionally, both Ta4CL53 and Ta4CL66 showed over-twofold upregulation in crowns and leaves. Furthermore, the transcription levels of Ta4CL63 and Ta4CL91 in roots also increased by more than twofold. In contrast, under salinity stress, the transcription levels of Ta4CL7, Ta4CL20, Ta4CL83, Ta4CL91, and Ta4CL93 exhibited an impressive, over-twofold upregulation. It is noteworthy that the Ta4CL91 gene, located within the Clade 4CL branch, exhibited a more than twofold increase in transcription levels under both salt and drought stress conditions. This observation suggests that this gene may play an increasingly significant role in the plant’s response to abiotic stresses. The varied expression profiles exhibited by the Ta4CL genes in response to salinity and drought stress underscore their potential as pivotal regulators in this plant’s response to abiotic challenges.
To further validate the drought- and salt-stress-responsive Ta4CL genes (showing >2-fold upregulation) identified through transcriptome analysis, we conducted RT-qPCR experiments. The results revealed distinct expression patterns among the Ta4CL genes under various stress conditions (Figure 8). Specifically, the transcription levels of Ta4CL45, Ta4CL63, and Ta4CL91 were significantly upregulated following drought treatment (Figure 8A–C). Similarly, under salt stress conditions, we observed an increase in transcript abundance for Ta4CL7, Ta4CL20, Ta4CL83, Ta4CL91, and Ta4CL93 (Figure 8D–H). Notably, the consistent upregulation of Ta4CL91 under both salt and drought treatments highlights its potential critical role in mediating wheat’s response to abiotic stresses.

2.7. Ta4CL91 Silencing Compromises Drought and Salt Stress Tolerance in Wheat Seedlings

Ta4CL91‘s activity is induced by both drought and salt stress, and it is phylogenetically classified within the 4CL clade. To investigate the functional role of Ta4CL91 in wheat under abiotic stress conditions, we employed virus-induced gene silencing using the TRV vector system to specifically downregulate Ta4CL91 expression (Figure S1). For VIGS validation, we included a positive control by targeting the TaPDS gene, which resulted in characteristic albino phenotypes in wheat seedlings following TRV-TaPDS inoculation (Figure S2). Phenotypic analysis demonstrated that the TRV-Ta4CL91 plants exhibited significantly reduced drought tolerance compared to the control lines after 9 and 13 days of drought stress (Figure 9A). This was evidenced by marked decreases in chlorophyll content (Figure 9B), survival rates (Figure 9C), and leaf relative water content (Figure 9D), accompanied by an increased rate of water loss in detached leaves (Figure 9E).
Similarly, following 8 days of salt stress treatment, the TRV-Ta4CL91 plants displayed compromised salt tolerance relative to the control plants (Figure 10A). The phenotypic differences became increasingly pronounced by the 14th day of salt treatment (Figure 10A), with statistically significant reductions in both chlorophyll content (Figure 10B) and survival rate (Figure 10C). These findings strongly suggest that Ta4CL91 plays a crucial role in mediating plant responses to both drought and salt stress conditions.

3. Discussion

The members of the 4CL gene family have been documented to play a pivotal role not only in the intricate processes of plant growth and development but also in mediating responses to both biotic and abiotic stresses [5,25,26]. Elevated 4CL activity enhances lodging resistance in wheat stems [27]. Compared to low-density (LD) homogeneous distribution, high-density (HD) treatment significantly reduced 4CL activity and Ta4CL gene expression in culms during their critical formation period [28]. The 4CL genes possess the ability to encode a variety of enzymes and exhibit distinct substrate affinities, which seem to correspond to diverse metabolic functions [5,10]. However, there exists a notable lack of comprehensive analyses regarding the 4CL genes within the realm of wheat. In this study, we conducted a comprehensive identification of 110 Ta4CL genes at the whole-genome level (Table 1) and performed an in-depth analysis of their fundamental characteristics (Figure 1, Figure 2, Figure 3, Figure 4 and Figure 5). Furthermore, we examined the expression patterns of these genes across various tissues (Figure 6) and investigated the transcriptional alterations under drought and salt stress conditions (Figure 7 and Figure 8). The aim was to identify Ta4CL genes with potential for stress resistance, providing important target genes for breeding wheat varieties that are tolerant to salt and drought. As performed by De Azevedo Souza [10], the members of the 4CL gene family in wheat were categorized into seven distinct clades, designated as Clade 4CL and A-F (Figure 1). The diverse isoenzymes of 4CL exhibit distinct substrate utilization preferences, indicating that the genes and enzymes associated with 4CL have undergone a process of subfunctionalization tailored for the biosynthesis of various classes of phenylpropanoid-derived compounds [5]. At4CL1–4 is situated within the clade of the 4CL branch and subsequently diverges into two distinct types. At4CL1, At4CL2, and At4CL4 are classified under type I, which is intimately linked to lignin biosynthesis, whereas At4CL3 resides within the type II cluster, associated with the biosynthesis of phenylpropanoids other than lignin [11,12]. In the clade of 4CL, eight genes demonstrate a relatively high degree of homology with At4CL1 and At4CL2 found in Arabidopsis (Figure 1). These 4CL genes are likely implicated in lignin biosynthesis, while Ta4CL91, Ta4CL97, and Ta4CL100 show close homology to the At4CL3 gene in Arabidopsis, suggesting their potential involvement in the biosynthesis of phenylpropanoids other than lignin (Figure 1). The Ta4CLs situated within Clade A-E exhibit a close homologous relationship with the At4CL-like ACS proteins (Figure 1), suggesting that these genes may not encode enzymes possessing 4CL activity and are devoid of functionality towards the known hydroxycinnamate substrates associated with 4CL. Based on the previously reported literature [10,29,30], the Ta4CLs within Clade F (Figure 1) may comprise either AAE or AAEL proteins.
Proteins’ physicochemical properties play a key role in plant stress resistance. For instance, heat shock proteins (HSPs) are highly conserved across species, maintaining proteostasis and protecting cells under stress [31,32]. Similarly, late embryogenesis abundant (LEA) proteins are small, hydrophilic polypeptides (10–30 kDa) with heat stability and diverse protective functions, including antioxidant activity, ion binding, and macromolecule stabilization [33]. In this study, different Ta4CL proteins exhibited distinct physicochemical properties (Table 1), likely influencing their stress tolerance capacities. The structural characteristics of genes, along with the conserved motifs and domains of their corresponding proteins, significantly influence gene functionality [34]. The Ta4CL proteins residing within the same phylogenetic branch exhibit a remarkable degree of similarity in both the types and quantities of conserved motifs (Figure 4B). Furthermore, the exon–intron architecture of these corresponding genes also reveals notable parallels (Figure 4D), underscoring the functional conservation among Ta4CLs clustered within identical branches. Ta4CLs are distributed across all chromosomes in both gene clusters and dispersed forms (Figure 2). Within wheat, there are 46 collinear gene pairs associated with Ta4CLs (Figure 3A). Polyploidization, segmental duplication, and tandem duplication events may have driven the evolution of the Ta4CL gene family. Notably, there are only 3 gene pairs between wheat and Arabidopsis 4CLs, whereas there are 57 gene pairs between wheat and rice (Figure 3B), further indicating the conservation of 4CLs among species within the Poaceae family.
Wheat encounters a myriad of abiotic stresses throughout its growth and development, with drought and salinity consistently posing significant challenges during its reproductive phase [35,36]. Numerous studies have demonstrated that the 4CL gene plays a crucial role in responding to and regulating the processes associated with both drought and salt stress [21,22,24,37]. However, a comprehensive analysis of the functions of 4CLs in wheat’s response to these adversities remains conspicuously underexplored. The aim of analyzing cis-acting elements in gene promoter regions is to predict their potential involvement in biological processes [38]. In this study, a significant proportion of the identified Ta4CL genes were found to contain cis-acting elements that respond to the abscisic acid (ABA) hormone and drought conditions (Figure 5). Previous studies have demonstrated that ABA plays a critical role in mediating plant responses to various abiotic stresses [39,40]. The presence of these ABA-responsive elements in Ta4CLs strongly suggests their essential function in conferring abiotic stress tolerance, highlighting their potential importance in plant stress adaptation mechanisms. To elucidate the functional relevance of Ta4CL genes under abiotic stress conditions, we systematically analyzed their transcriptional dynamics using RNA-seq data under drought and salt stress treatments (Figure 7). Distinct expression patterns were observed among Ta4CL family members, with individual genes demonstrating stress-specific regulation. This differential transcriptional responsiveness highlights their specialized roles in mediating plants’ adaptation to environmental stresses. Transcriptomic analysis and RT-qPCR validation under drought and salt stress revealed that Ta4CL45, Ta4CL63, and Ta4CL91 were significantly upregulated under drought conditions, whereas Ta4CL7, Ta4CL20, Ta4CL83, Ta4CL91, and Ta4CL93 showed increased expression under salt stress (Figure 7 and Figure 8). Notably, Ta4CL91 showed responsiveness to both salinity and drought stress conditions (Figure 7 and Figure 8), indicating its essential regulatory role in mediating wheat’s adaptive responses to abiotic stress. To functionally characterize Ta4CL91 in stress responses, we employed VIGS [41] to knock down its expression in wheat seedlings (Figure S1). Phenotypic analysis revealed that Ta4CL91-silenced plants displayed enhanced sensitivity to both salt and drought stress conditions compared to that of the controls (Figure 9 and Figure 10). These findings collectively demonstrate that Ta4CL91 serves as a key regulatory component in the molecular network governing wheat’s adaptation to abiotic stress. In crop breeding, the introduction of stress-resistance genes frequently improves stress tolerance but typically incurs growth penalties or yield reduction. This trade-off primarily stems from the substantial ATP and carbon resources consumed by stress-response pathways, which are consequently diverted from reproductive growth [42]. Moreover, constitutive activation of stress-signaling pathways may suppress developmental genes, as exemplified by DREB1A overexpression; while enhancing drought resistance, it simultaneously leads to stunted growth [43]. Therefore, achieving an optimal balance between stress resistance and agronomic performance remains a critical challenge in modern crop improvement.

4. Materials and Methods

4.1. Genome-Wide Identification of Members of the 4CL Gene Family in Wheat

Two hidden Markov models corresponding to the AMP-binding (PF00501) and AMP-binding_C (PF13193) domains were retrieved from the Pfam database (http://pfam-legacy.xfam.org/, accessed on 18 April 2024) [44]. These models were subsequently utilized as queries to screen the protein sequences of Ta4CL. Following this, both the Pfam and NCBI Conserved Domains Datebase (CDD) (https://www.ncbi.nlm.nih.gov/Structure/bwrpsb/bwrpsb.cgi, accessed on 18 April 2024) were employed to verify whether the selected Ta4CL proteins contain the AMP-binding domain and AMP-binding_C domain, thereby enabling us to identify members of the Ta4CL gene family.

4.2. Phylogenetic Analysis and Physicochemical Property Assessment

The amino acid sequences of the 4CL proteins from wheat and Arabidopsis thaliana were obtained from Ensembl Plants (https://plants.ensembl.org/index.html, accessed on 8 May 2024). Multiple sequence alignment was performed using MEGA7 (https://www.megasoftware.net/, accessed on 8 May 2024) [45], and phylogenetic tree construction was conducted employing the Neighbor-Joining (NJ) method. The phylogenetic tree was refined using the iTOL online tool (https://itol.embl.de/, accessed on 28 May 2024). The ProtParam online tool available on ExPASy (https://web.expasy.org/protparam/, accessed on 18 July 2024) [46] was utilized to predict the physicochemical properties of Ta4CL proteins. This analysis primarily encompasses a variety of parameters, including amino acid numbers, molecular weight of the protein, instability index, theoretical isoelectric point, and the grand average of hydropathicity (GRAVY), among others.

4.3. Analysis of Chromosomal Distribution and Gene Collinearity

The distribution of the 4CL gene family in wheat chromosomes was determined based on the annotation file of the wheat genome, and the physical distribution of candidate Ta4CL genes on wheat chromosomes was annotated using TBtools(v2.210) [47]. To facilitate further research, the wheat 4CL genes were renumbered according to their chromosomal positions. TBtools(v2.210) was utilized to analyze the gene collinearity relationships within wheat species as well as between wheat and Arabidopsis and between wheat and rice across different species. The results were visualized using TBtools(v2.210); subsequently, modifications were made, and the saved SVG-format images were integrated through Adobe Illustrator(v24.2.1) software.

4.4. Analysis of Conserved Motifs, Domains, and Gene Structure

The phylogenetic tree in Newick format was derived from MEGA7 (https://www.megasoftware.net/, accessed on 8 May 2024) [45]. The conserved motifs were analyzed using the MEME Suite version 5.5.5 (https://meme-suite.org/meme/tools/meme, accessed on 18 July 2024) [48] online platform, resulting in the generation of a meme.xml file. For the analysis of conserved domains, we employed the batch CD-search tool [49] provided by NCBI (https://www.ncbi.nlm.nih.gov/Structure/bwrpsb/bwrpsb.cgi, accessed on 18 July 2024), which yielded a hitdata.txt file. Gene structures were represented using wheat genome annotation files. Some of these files underwent modifications; ultimately, all files were imported into TBtools(v2.210) for comprehensive visualization.

4.5. Analysis of Cis-Acting Elements in Promoter Regions

The 2000 bp upstream promoter regions of Ta4CL genes, adjacent to the start codon of the coding sequence, were subjected to cis-acting element analysis using PlantCARE (http://bioinformatics.psb.ugent.be/webtools/plantcare/html/, accessed on 19 July 2024) [50]. After modifying the output files from PlantCARE, visualization was performed using TBtools(v2.210). The generated SVG format image was subsequently refined and enhanced with Adobe Illustrator software.

4.6. Expression Analysis Involving Varying Tissues Under Drought and Salinity Stress

The expression data regarding the Ta4CL genes in various tissues were derived from five distinct wheat tissues—spike, root, leaf, grain, and stem tissue—utilizing publicly accessible RNA-seq datasets (http://202.194.139.32/expression/wheat.html, accessed on 30 July 2024) [51]. Furthermore, the expression profiles of Ta4CL genes under drought and salt stress conditions were sourced from SRA data (SRP098756, SRP158842). The TPM (transcripts per kilobase of exon model per million mapped reads) and FPKM (fragments per kilobase of exon model per million mapped fragments) values for the Ta4CL genes were employed to construct a heat map using TBtools(v2.210).

4.7. Analysis of Drought and Salt Stress Responses in Selected Ta4CL Genes

To investigate the stress-responsive expression patterns of selected Ta4CL genes, a time-course experiment was conducted using 12-day-old Jimai22 wheat seedlings. The plants were exposed to drought stress and salt stress conditions through treatment with 5% polyethylene glycol 6000 (Sigma-Aldrich, St. Louis, MO, USA) and 200 mM NaCl solution, respectively. Root tissue samples were collected at five distinct time points (0, 1, 3, 6, and 12 h) following stress initiation to monitor the temporal dynamics of gene expression. Three independent biological replicates were established per treatment condition, with each replicate comprising a composite sample from three individual plant lines. Immediately after collection, all samples were flash-frozen in liquid nitrogen to preserve RNA integrity and stored at −80 °C until further molecular analysis.

4.8. RNA Isolation, Reverse Transcription, and qPCR Analysis

Total RNA was isolated from the samples using the RNAiso Easy Kit (TaKaRa, Kyoto, Japan) according to the manufacturer’s protocol. To ensure genomic DNA elimination and subsequent cDNA synthesis, we employed the PrimeScript™ FAST RT Reagent Kit with gDNA Eraser (TaKaRa, Japan). Quantitative real-time PCR (RT-qPCR) analysis was then conducted using the 2× SYBR Green qPCR Master Mix (Selleck, Houston, TX, USA) on the LineGene9600 fluorescence quantitative PCR system (Bioer Technology, Hangzhou, China). Gene expression quantification was performed using the 2−ΔΔCt method [52], with the wheat Actin gene serving as an internal control. The sequence-specific primers used for RT-qPCR amplification were carefully designed, and their details are provided in Table S3.

4.9. VIGS Vector Construction and Infection Methodology

The virus-induced gene-silencing system was established using pTRV1 and pTRV2 vectors obtained from Fenghui Biotechnology Co., Ltd. (Changsha, China). To design optimal VIGS target fragments, we employed the pssRNAit computational platform (https://www.zhaolab.org/pssRNAit/, accessed on 28 September 2024), an advanced bioinformatics tool specifically developed for plant small-RNA analysis and efficient VIGS fragment prediction. Based on the computational analysis, we selected two distinct gene-specific fragments: a 192 bp sequence from the Ta4CL91 coding region and a 188 bp sequence from the TaPDS coding region. These fragments were subsequently amplified and directionally cloned into the pTRV2 vector through restriction-enzyme-mediated cloning. Specifically, the insertion was performed using the EcoRI and BamHI restriction sites, which facilitated the generation of the recombinant constructs pTRV2-Ta4CL91 and pTRV2-TaPDS, respectively. The successful construction of these recombinant vectors was confirmed through sequencing verification.
For seed sterilization and germination, wheat cultivar Jimai22 seeds were subjected to a surface sterilization protocol. Initially, seeds were treated with 75% (v/v) ethanol for 1 min to remove surface contaminants; this was followed by immersion in 2.5% sodium hypochlorite solution supplemented with 0.1% Tween 20 for 5 min to ensure surface sterilization. After chemical treatment, seeds were thoroughly washed five times with sterile deionized water to remove residual sterilizing agents. For germination, the sterilized seeds were aseptically transferred onto 2–3 layers of sterile filter paper moistened with distilled water in a controlled-environment chamber. The germination process was carried out at a constant temperature of 28 °C under dark conditions for 30 h to ensure seed germination.
The Agrobacterium-mediated genetic transformation was conducted using a well-established VIGS protocol. We employed Agrobacterium tumefaciens strain GV3101 containing either the pTRV1 vector or various pTRV2-derived constructs (pTRV2, pTRV2-Ta4CL91, and pTRV2-TaPDS). Bacterial cultures were grown in Luria–Bertani (LB) medium supplemented with 100 mg·L−1 of rifampicin and 50 mg·L−1 of kanamycin at 28 °C with constant shaking at 180 rpm until reaching the optimal optical density (OD600 = 0.3). For the agroinfiltration process, we prepared a bacterial suspension by mixing equal volumes (1:1 ratio) of pTRV1-containing and pTRV2-derived vector-containing Agrobacterium cultures in an optimized infiltration buffer containing 19.62 mg·L−1 of acetosyringone (AS), 400 mg·L−1 of cysteine (Cys), and 5 mL·L−1 of Tween 20 to enhance transformation efficiency. The transformation procedure was conducted utilizing a specialized vacuum infiltration system. Approximately 5 mL of the bacterial suspension was transferred into 10 mL sterile medical glass bottles fitted with rubber caps. Surface-sterilized germinated wheat seeds were then placed in these bottles. Vacuum infiltration was performed for 30 seconds using a 20 mL syringe to ensure efficient entry of bacteria into the plant tissues. Following this vacuum treatment, the seeds were co-cultivated with the Agrobacterium suspension in a controlled environment shaker at 28 °C and 180 rpm for a duration of 15 h. After co-cultivation, the agroinfiltrated germinated wheat seeds underwent thorough washing with sterilized water to remove surface-adhered Agrobacteria. The transformed seeds were subsequently transferred to a sterilized soil mixture for further growth and phenotypic analysis. The entire infection procedure adhered to previously optimized protocols [41].

4.10. Tolerance Analysis Under Drought and Salt Stress Conditions

For the natural drought treatment, 12-day-old CK and VIGS wheat seedlings underwent water deprivation for 9 and 13 days, with phenotypic observations recorded and photographs taken. After rehydration, survival rates and chlorophyll content were measured. For salt treatment, seedlings were irrigated with 200 mM NaCl and then subjected to phenotypic observations and photography at days 8 and 14. Survival rates and chlorophyll content were also assessed to evaluate stress responses. For each replicate, approximately 20 individual plants were included for both the control and gene-silenced lines per treatment, with three independent replicates performed.

4.11. Measurement of Relative Water Content and Water Loss Rate in Detached Leaves

To measure relative water content (RWC), fresh leaves were collected from plants and weighed to determine fresh weight (FW). The leaves were then soaked in distilled water at 25 °C in the dark for 8 h, and their turgid weight (TW) was measured. After oven-drying at 65 °C to constant weight, the leaves’ dry weight (DW) was recorded. RWC was calculated as follows: RWC (%) = [(FW − DW)/(TW − DW)] × 100 [53].
For the water loss assays, leaves from wheat seedlings were promptly weighed and transferred to a growth chamber maintained at ambient temperature. The leaves were then weighed at hourly intervals. The water loss rate (WLR) was calculated using the following formula: WLR (%) = [(Initial fresh weight − Current fresh weight)/Initial fresh weight] × 100 [24].

5. Conclusions

In this study, we systematically identified the 4CL gene family in wheat, revealing both conserved features within phylogenetic clades and variations among individual Ta4CL members. Promoter analysis revealed that a substantial number of Ta4CL genes possess cis-regulatory elements associated with stress responses, particularly those responsive to ABA and drought stress. Transcriptional profiling demonstrated the responsiveness of multiple Ta4CL genes to diverse abiotic stresses. Particularly, Ta4CL91, a member of the 4CL clade, showed marked upregulation under both drought and salt stress conditions. Functional characterization through VIGS-mediated silencing revealed that the Ta4CL91-deficient plants displayed compromised stress tolerance compared to that of the wild-type controls. These findings not only provide a comprehensive identification of the 4CL gene family in wheat but also explore the responses and involvement of Ta4CL members, particularly Ta4CL91, in abiotic stress adaptation.

Supplementary Materials

The following supporting information can be downloaded at https://www.mdpi.com/article/10.3390/plants14091301/s1. Figure S1: Expression analysis of Ta4CL91 in control and silenced wheat lines. Figure S2: Phenotypic comparison of control and TaPDS-silenced wheat plants. Table S1: Identified 4CL gene family protein sequences in wheat. Table S2: Conserved motif sequences in wheat 4CL family proteins. Table S3: Primers used in this study.

Author Contributions

Conceptualization, Z.Z. and R.L.; data curation, Z.Z. and X.Y.; formal analysis, Z.Z. and R.L.; funding acquisition, Z.Z.; investigation, Z.Z., X.Y. and R.L.; methodology, Z.Z. and X.Y.; project administration, Z.Z.; software, Z.Z. and R.L.; supervision, Z.Z.; validation, D.N.; visualization, Z.Z.; writing—original draft, Z.Z.; writing—review and editing, D.N. and R.L. All authors have read and agreed to the published version of the manuscript.

Funding

This study was supported by the Fundamental Research Program of Shanxi Province (202403021212095).

Data Availability Statement

Data are contained within the article and its Supplementary Materials.

Conflicts of Interest

The authors declare no conflicts of interest.

References

  1. Shiferaw, B.; Smale, M.; Braun, H.-J.; Duveiller, E.; Reynolds, M.; Muricho, G. Crops that feed the world 10. Past successes and future challenges to the role played by wheat in global food security. Food Secur. 2013, 5, 291–317. [Google Scholar] [CrossRef]
  2. Dutta, D.; Karmakar, S.; Hossain, A.; Sadhukhan, R.; Atta, K.; Pramanick, S. Chapter 1—Wheat and abiotic stress challenges: An overview. In Abiotic Stresses in Wheat; Khan, M.K., Pandey, A., Hamurcu, M., Gupta, O.P., Gezgin, S., Eds.; Academic Press: Cambridge, MA, USA, 2023; pp. 1–13. [Google Scholar]
  3. Alam, M.N.; Islam, M.Z.; Farukh, M.A.; Chan, Z.; Akhter, M.M.; Abedin, M.T.; Hossain, M.M. Detrimental effects of abiotic stress on wheat and its management techniques. In Cereal Research Communications; Springer: Berlin/Heidelberg, Germany, 2024. [Google Scholar] [CrossRef]
  4. Furtak, K.; Wolińska, A. The impact of extreme weather events as a consequence of climate change on the soil moisture and on the quality of the soil environment and agriculture—A review. CATENA 2023, 231, 107378. [Google Scholar] [CrossRef]
  5. Lavhale, S.G.; Kalunke, R.M.; Giri, A.P. Structural, functional and evolutionary diversity of 4-coumarate-CoA ligase in plants. Planta 2018, 248, 1063–1078. [Google Scholar] [CrossRef] [PubMed]
  6. Hamberger, B.; Hahlbrock, K. The 4-coumarate:CoA ligase gene family in Arabidopsis thaliana comprises one rare, sinapate-activating and three commonly occurring isoenzymes. Proc. Natl. Acad. Sci. USA 2004, 101, 2209–2214. [Google Scholar] [CrossRef] [PubMed]
  7. Schneider, K.; Hövel, K.; Witzel, K.; Hamberger, B.; Schomburg, D.; Kombrink, E.; Stuible, H.P. The substrate specificity-determining amino acid code of 4-coumarate:CoA ligase. Proc. Natl. Acad. Sci. USA 2003, 100, 8601–8606. [Google Scholar] [CrossRef]
  8. Stuible, H.; Büttner, D.; Ehlting, J.; Hahlbrock, K.; Kombrink, E. Mutational analysis of 4-coumarate:CoA ligase identifies functionally important amino acids and verifies its close relationship to other adenylate-forming enzymes. FEBS Lett. 2000, 467, 117–122. [Google Scholar] [CrossRef]
  9. Stuible, H.P.; Kombrink, E. Identification of the substrate specificity-conferring amino acid residues of 4-coumarate:coenzyme A ligase allows the rational design of mutant enzymes with new catalytic properties. J. Biol. Chem. 2001, 276, 26893–26897. [Google Scholar] [CrossRef]
  10. De Azevedo Souza, C.; Barbazuk, B.; Ralph, S.G.; Bohlmann, J.; Hamberger, B.; Douglas, C.J. Genome-wide analysis of a land plant-specific acyl:coenzyme A synthetase (ACS) gene family in Arabidopsis, poplar, rice and Physcomitrella. New Phytol. 2008, 179, 987–1003. [Google Scholar] [CrossRef]
  11. Ehlting, J.; Büttner, D.; Wang, Q.; Douglas, C.J.; Somssich, I.E.; Kombrink, E. Three 4-coumarate:coenzyme A ligases in Arabidopsis thaliana represent two evolutionarily divergent classes in angiosperms. Plant J. 1999, 19, 9–20. [Google Scholar] [CrossRef]
  12. Li, Y.; Kim, J.I.; Pysh, L.; Chapple, C. Four Isoforms of Arabidopsis 4-Coumarate:CoA Ligase Have Overlapping yet Distinct Roles in Phenylpropanoid Metabolism. Plant Physiol. 2015, 169, 2409–2421. [Google Scholar] [CrossRef]
  13. Sun, H.; Li, Y.; Feng, S.; Zou, W.; Guo, K.; Fan, C.; Si, S.; Peng, L. Analysis of five rice 4-coumarate:coenzyme A ligase enzyme activity and stress response for potential roles in lignin and flavonoid biosynthesis in rice. Biochem. Biophys. Res. Commun. 2013, 430, 1151–1156. [Google Scholar] [CrossRef] [PubMed]
  14. Chowdhury, M.E.K.; Choi, B.; Cho, B.-K.; Kim, J.B.; Park, S.U.; Natarajan, S.; Lim, H.-S.; Bae, H. Regulation of 4CL, encoding 4-coumarate: Coenzyme A ligase, expression in kenaf under diverse stress conditions. Plant Omics 2013, 6, 254–262. [Google Scholar]
  15. Moura, J.C.; Bonine, C.A.; de Oliveira Fernandes Viana, J.; Dornelas, M.C.; Mazzafera, P. Abiotic and biotic stresses and changes in the lignin content and composition in plants. J. Integr. Plant Biol. 2010, 52, 360–376. [Google Scholar] [CrossRef] [PubMed]
  16. Cesarino, I. Structural features and regulation of lignin deposited upon biotic and abiotic stresses. Curr. Opin. Biotechnol. 2019, 56, 209–214. [Google Scholar] [CrossRef]
  17. Wang, M.; Zhang, Y.; Zhu, C.; Yao, X.; Zheng, Z.; Tian, Z.; Cai, X. EkFLS overexpression promotes flavonoid accumulation and abiotic stress tolerance in plant. Physiol. Plant. 2021, 172, 1966–1982. [Google Scholar] [CrossRef]
  18. Shomali, A.; Das, S.; Arif, N.; Sarraf, M.; Zahra, N.; Yadav, V.; Aliniaeifard, S.; Chauhan, D.K.; Hasanuzzaman, M. Diverse Physiological Roles of Flavonoids in Plant Environmental Stress Responses and Tolerance. Plants 2022, 11, 3158. [Google Scholar] [CrossRef]
  19. Li, X.-l.; LÜ, X.; Wang, X.-h.; Peng, Q.; Zhang, M.-s.; Ren, M.-j. Biotic and abiotic stress-responsive genes are stimulated to resist drought stress in purple wheat. J. Integr. Agric. 2020, 19, 33–50. [Google Scholar] [CrossRef]
  20. Gulzar, F.; Yang, H.; Chen, J.; Hassan, B.; Huang, X.; Qiong, F. 6-BA Reduced Yield Loss under Waterlogging Stress by Regulating the Phenylpropanoid Pathway in Wheat. Plants 2024, 13, 1991. [Google Scholar] [CrossRef]
  21. Chen, X.; Su, W.; Zhang, H.; Zhan, Y.; Zeng, F. Fraxinus mandshurica 4-coumarate-CoA ligase 2 enhances drought and osmotic stress tolerance of tobacco by increasing coniferyl alcohol content. Plant Physiol. Biochem. PPB 2020, 155, 697–708. [Google Scholar] [CrossRef]
  22. Chen, X.; Wang, H.; Li, X.; Ma, K.; Zhan, Y.; Zeng, F. Molecular cloning and functional analysis of 4-Coumarate:CoA ligase 4(4CL-like 1)from Fraxinus mandshurica and its role in abiotic stress tolerance and cell wall synthesis. BMC Plant Biol. 2019, 19, 231. [Google Scholar] [CrossRef]
  23. Wang, C.H.; Yu, J.; Cai, Y.X.; Zhu, P.P.; Liu, C.Y.; Zhao, A.C.; Lü, R.H.; Li, M.J.; Xu, F.X.; Yu, M.D. Characterization and Functional Analysis of 4-Coumarate:CoA Ligase Genes in Mul-berry. PLoS ONE 2016, 11, e0155814. [Google Scholar] [CrossRef]
  24. Sun, S.C.; Xiong, X.P.; Zhang, X.L.; Feng, H.J.; Zhu, Q.H.; Sun, J.; Li, Y.J. Characterization of the Gh4CL gene family reveals a role of Gh4CL7 in drought tolerance. BMC Plant Biol. 2020, 20, 125. [Google Scholar] [CrossRef] [PubMed]
  25. Lee, D.; Ellard, M.; Wanner, L.A.; Davis, K.R.; Douglas, C.J. The Arabidopsis thaliana 4-coumarate:CoA ligase (4CL) gene: Stress and developmentally regulated expression and nucleotide sequence of its cDNA. Plant Mol. Biol. 1995, 28, 871–884. [Google Scholar] [CrossRef] [PubMed]
  26. Douglas, C.J. Phenylpropanoid metabolism and lignin biosynthesis: From weeds to trees. Trends Plant Sci. 1996, 1, 171–178. [Google Scholar] [CrossRef]
  27. Yang, M.; Chen, S.; Chao, K.; Ji, C.; Shi, Y. Effects of nano silicon fertilizer on the lodging resistance characteristics of wheat basal second stem node. BMC Plant Biol. 2024, 24, 54. [Google Scholar] [CrossRef]
  28. Hu, Y.; Qin, F.; Wu, Z.; Wang, X.; Ren, X.; Jia, Z.; Wang, Z.; Chen, X.; Cai, T. Heterogeneous population distribution enhances resistance to wheat lodging by optimizing the light environment. J. Integr. Agric. 2024, 23, 2211–2226. [Google Scholar] [CrossRef]
  29. Cao, Y.; Han, Y.; Li, D.; Lin, Y.; Cai, Y. Systematic Analysis of the 4-Coumarate:Coenzyme A Ligase (4CL) Related Genes and Expression Profiling during Fruit Development in the Chinese Pear. Genes 2016, 7, 89. [Google Scholar] [CrossRef]
  30. Shockey, J.M.; Fulda, M.S.; Browse, J. Arabidopsis contains a large superfamily of acyl-activating enzymes. Phylogenetic and biochemical analysis reveals a new class of acyl-coenzyme a synthetases. Plant Physiol. 2003, 132, 1065–1076. [Google Scholar] [CrossRef]
  31. ul Haq, S.; Khan, A.; Ali, M.; Khattak, A.M.; Gai, W.-X.; Zhang, H.-X.; Wei, A.-M.; Gong, Z.-H. Heat Shock Proteins: Dynamic Biomolecules to Counter Plant Biotic and Abiotic Stresses. Int. J. Mol. Sci. 2019, 20, 5321. [Google Scholar] [CrossRef]
  32. Hu, C.; Yang, J.; Qi, Z.; Wu, H.; Wang, B.; Zou, F.; Mei, H.; Liu, J.; Wang, W.; Liu, Q. Heat shock proteins: Biological functions, pathological roles, and therapeutic opportunities. MedComm 2022, 3, e161. [Google Scholar] [CrossRef]
  33. Hong-Bo, S.; Zong-Suo, L.; Ming-An, S. LEA proteins in higher plants: Structure, function, gene expression and regulation. Colloids Surf. B Biointerfaces 2005, 45, 131–135. [Google Scholar] [CrossRef] [PubMed]
  34. Salgotra, R.K.; Chauhan, B.S. Genetic Diversity, Conservation, and Utilization of Plant Genetic Resources. Genes 2023, 14, 174. [Google Scholar] [CrossRef]
  35. Abhinandan, K.; Skori, L.; Stanic, M.; Hickerson, N.M.N.; Jamshed, M.; Samuel, M.A. Abiotic Stress Signaling in Wheat—An Inclusive Overview of Hormonal Interactions During Abiotic Stress Responses in Wheat. Front. Plant Sci. 2018, 9, 734. [Google Scholar] [CrossRef]
  36. Hossain, A.; Skalicky, M.; Brestic, M.; Maitra, S.; Ashraful Alam, M.; Syed, M.A.; Hossain, J.; Sarkar, S.; Saha, S.; Bhadra, P.; et al. Consequences and Mitigation Strategies of Abiotic Stresses in Wheat (Triticum aestivum L.) under the Changing Climate. Agronomy 2021, 11, 241. [Google Scholar] [CrossRef]
  37. Zhang, C.H.; Ma, T.; Luo, W.C.; Xu, J.M.; Liu, J.Q.; Wan, D.S. Identification of 4CL Genes in Desert Poplars and Their Changes in Expression in Response to Salt Stress. Genes 2015, 6, 901–917. [Google Scholar] [CrossRef] [PubMed]
  38. Hernandez-Garcia, C.M.; Finer, J.J. Identification and validation of promoters and cis-acting regulatory elements. Plant Sci. 2014, 217–218, 109–119. [Google Scholar] [CrossRef]
  39. Danquah, A.; de Zelicourt, A.; Colcombet, J.; Hirt, H. The role of ABA and MAPK signaling pathways in plant abiotic stress responses. Biotechnol. Adv. 2014, 32, 40–52. [Google Scholar] [CrossRef]
  40. Zhang, J.; Jia, W.; Yang, J.; Ismail, A.M. Role of ABA in integrating plant responses to drought and salt stresses. Field Crops Res. 2006, 97, 111–119. [Google Scholar] [CrossRef]
  41. Zhang, J.; Yu, D.; Zhang, Y.; Liu, K.; Xu, K.; Zhang, F.; Wang, J.; Tan, G.; Nie, X.; Ji, Q.; et al. Vacuum and Co-cultivation Agroinfiltration of (Germinated) Seeds Results in Tobacco Rattle Virus (TRV) Mediated Whole-Plant Virus-Induced Gene Silencing (VIGS) in Wheat and Maize. Front. Plant Sci. 2017, 8, 393. [Google Scholar] [CrossRef]
  42. Wang, Q.; Yu, F.; Xie, Q. Balancing growth and adaptation to stress: Crosstalk between brassinosteroid and abscisic acid signaling. Plant Cell Environ. 2020, 43, 2325–2335. [Google Scholar] [CrossRef]
  43. Kudo, M.; Kidokoro, S.; Yoshida, T.; Mizoi, J.; Todaka, D.; Fernie, A.R.; Shinozaki, K.; Yamaguchi-Shinozaki, K. Double overexpression of DREB and PIF transcription factors improves drought stress tolerance and cell elongation in transgenic plants. Plant Biotechnol. J. 2017, 15, 458–471. [Google Scholar] [CrossRef] [PubMed]
  44. Mistry, J.; Chuguransky, S.; Williams, L.; Qureshi, M.; Salazar, G.A.; Sonnhammer, E.L.L.; Tosatto, S.C.E.; Paladin, L.; Raj, S.; Richardson, L.J.; et al. Pfam: The protein families database in 2021. Nucleic Acids Res. 2021, 49, D412–D419. [Google Scholar] [CrossRef] [PubMed]
  45. Kumar, S.; Stecher, G.; Tamura, K. MEGA7: Molecular Evolutionary Genetics Analysis Version 7.0 for Bigger Datasets. Mol. Biol. Evol. 2016, 33, 1870–1874. [Google Scholar] [CrossRef]
  46. Wilkins, M.R.; Gasteiger, E.; Bairoch, A.; Sanchez, J.C.; Williams, K.L.; Appel, R.D.; Hochstrasser, D.F. Protein identification and analysis tools in the ExPASy server. Methods Mol. Biol. 1999, 112, 531–552. [Google Scholar] [CrossRef]
  47. Chen, C.; Chen, H.; Zhang, Y.; Thomas, H.R.; Frank, M.H.; He, Y.; Xia, R. TBtools: An Integrative Toolkit Developed for Interactive Analyses of Big Biological Data. Mol. Plant 2020, 13, 1194–1202. [Google Scholar] [CrossRef] [PubMed]
  48. Bailey, T.L.; Boden, M.; Buske, F.A.; Frith, M.; Grant, C.E.; Clementi, L.; Ren, J.; Li, W.W.; Noble, W.S. MEME SUITE: Tools for motif discovery and searching. Nucleic Acids Res. 2009, 37, W202–W208. [Google Scholar] [CrossRef]
  49. Marchler-Bauer, A.; Bryant, S.H. CD-Search: Protein domain annotations on the fly. Nucleic Acids Res. 2004, 32, W327–W331. [Google Scholar] [CrossRef]
  50. Rombauts, S.; Déhais, P.; Van Montagu, M.; Rouzé, P. PlantCARE, a plant cis-acting regulatory element database. Nucleic Acids Res. 1999, 27, 295–296. [Google Scholar] [CrossRef]
  51. A chromosome-based draft sequence of the hexaploid bread wheat (Triticum aestivum) genome. Science 2014, 345, 1251788. [CrossRef]
  52. Pfaffl, M.W. A new mathematical model for relative quantification in real-time RT-PCR. Nucleic Acids Res. 2001, 29, e45. [Google Scholar] [CrossRef]
  53. Sade, N.; Vinocur, B.J.; Diber, A.; Shatil, A.; Ronen, G.; Nissan, H.; Wallach, R.; Karchi, H.; Moshelion, M. Improving plant stress tolerance and yield production: Is the tonoplast aquaporin SlTIP2;2 a key to isohydric to anisohydric conversion? New Phytol. 2009, 181, 651–661. [Google Scholar] [CrossRef] [PubMed]
Figure 1. Phylogenetic analysis was conducted to examine the evolutionary relationships between 4CL genes from Triticum aestivum (Ta) and Arabidopsis thaliana (At). The resulting phylogenetic tree reveals the evolutionary divergence and relationships within the 4CL gene family members of these two species. The analysis classified all 4CL genes into seven distinct clades, with each clade represented by a different color for clear visualization.
Plants 14 01301 g001
Figure 2. Chromosomal distribution of the 4CL gene family in wheat. Yellow lines represent chromosomes, while grey lines mark the precise locations of Ta4CL genes, which are labeled in red font for emphasis.
Plants 14 01301 g002
Figure 3. Synteny analysis of 4CL genes. (A) Intraspecific synteny analysis of wheat 4CL genes. Chromosomes are represented by light-purple boxes, with gray lines connecting collinear gene pairs. The syntenic relationships between wheat 4CL genes are indicated by dark-purple lines. (B) Interspecific synteny of 4CL genes across various species. The upper and lower collinearity maps illustrate the syntenic relationships between wheat and Arabidopsis genes and between wheat and rice genes, respectively. Gray lines connect collinear gene pairs, while red lines specifically highlight collinear 4CL gene pairs.
Plants 14 01301 g003
Figure 4. Structural and evolutionary analysis of the 4CL gene family in wheat. (A) Phylogenetic analysis of 4CL gene family in wheat. The evolutionary tree was constructed using the Neighbor-Joining (NJ) method in MEGA7. (B) Conserved protein motifs of Ta4CLs. The motif composition was identified using MEME suite and visualized with TBtools(v2.210), where distinctively colored boxes represent conserved motifs (1–10) with specific amino acid sequences. (C) Protein domain architecture of Ta4CLs. Two characteristic domains (AMP-binding and AMP-binding_C) were identified using Pfam and visualized with TBtools, with the AMP-binding domain shown in green and the AMP-binding_C domain in yellow. (D) Genomic structures of Ta4CL genes. Gene structures were analyzed based on wheat genome annotations and visualized using TBtools, wherein untranslated regions (UTRs) are represented by green boxes, coding sequences (CDSs) are denoted by yellow boxes, and introns are denoted by gray lines.
Plants 14 01301 g004
Figure 5. Identification and analysis of cis-regulatory elements in Ta4CL gene promoters. The distribution pattern of cis-regulatory elements within the promoter regions of Ta4CL genes was systematically analyzed. This schematic representation illustrates the organization of various cis elements, with each distinctly colored ellipse denoting a different type of regulatory element. The promoter regions of individual Ta4CL genes are depicted as horizontal grey lines, providing a clear spatial reference for the positioned cis elements.
Plants 14 01301 g005
Figure 6. Expression profiling of Ta4CL genes across wheat tissues. The transcriptional profiles of Ta4CL genes were analyzed across five distinct wheat tissues (spike, root, leaf, grain, and stem tissues) utilizing publicly available RNA-seq data. The developmental stages of wheat samples were precisely determined according to the Zadoks growth scale within the database. To visualize the expression patterns, we generated a heatmap using TBtools(v2.210) software, with gene expression levels quantified as TPM (transcripts per kilobase of exon model per million mapped reads) values.
Plants 14 01301 g006
Figure 7. Expression profiling of Ta4CL genes under drought and salt stress conditions. (A) Differential expression analysis of Ta4CL genes in various wheat tissues subjected to drought stress. C, control; D, drought. (B) Expression profiles of Ta4CL genes under salt stress conditions. The heatmap illustrates differential gene expression patterns, with color gradients representing varying expression levels, as indicated in the color scale bar on the right.
Plants 14 01301 g007
Figure 8. Transcriptional modulation of selected Ta4CL genes under salinity and drought stress conditions. (AC) Temporal expression patterns of Ta4CL45 (A), Ta4CL63 (B), and Ta4CL91 (C) genes in response to drought stress were monitored 0, 1, 3, 6, and 12 h post-treatment using RT-qPCR. (DH) Similarly, the expression profiles of Ta4CL7 (D), Ta4CL20 (E), Ta4CL83 (F), Ta4CL91 (G), and Ta4CL93 (H) genes were analyzed under salt stress conditions at identical time points through RT-qPCR. All data are presented as means ± standard deviations (SDs) from three independent replicates. Statistical analyses were performed using Student’s t-test, with asterisks denoting significant differences (* p < 0.05, ** p < 0.01).
Plants 14 01301 g008
Figure 9. Drought tolerance analysis of Ta4CL91-silenced wheat plants. (A) Phenotypic comparison between control (CK) and TRV-Ta4CL91 (VIGS) plants at 9 and 13 days of drought treatment, followed by rewatering. (B) Chlorophyll content and (C) survival rate measurements for control and TRV-Ta4CL91 plants after 13 days of drought stress and subsequent rewatering. (D) Leaf RWC for control and TRV-Ta4CL91 plants under well-watered conditions and following drought stress. (E) Leaf water loss rates for detached leaves from control and TRV-Ta4CL91 plants. Data were analyzed using Student’s t-test, with statistical significance denoted as * p < 0.05 and ** p < 0.01.
Plants 14 01301 g009
Figure 10. Salt tolerance analysis of Ta4CL91-silenced wheat plants. (A) Phenotypic responses of control and TRV-Ta4CL91 plants to salt stress at 8 and 14 days post-treatment. (B) Chlorophyll content and (C) survival rate of control and TRV-Ta4CL91 plants following salt stress exposure. Statistical analyses were performed using Student’s t-test, with significance levels indicated as * p < 0.05 and ** p < 0.01.
Plants 14 01301 g010
Table 1. Identification and analysis of physicochemical properties of the 4CL gene family members in wheat.
GeneGene IDNo. of Amino AcidsMol. Wt (Da)Isoelectric Point (pI)Instability Index (II)Aliphatic IndexGrand
Average of Hydropathicity (GRAVY)
Ta4CL1TraesCS1A02G19670056860,239.37.724396.940.141
Ta4CL2TraesCS1B02G06760056461,444.376.1735.6289.95−0.048
Ta4CL3TraesCS1B02G21130058762,541.948.7848.4696.460.119
Ta4CL4TraesCS1D02G20020056860,358.448.5447.5796.060.13
Ta4CL5TraesCS2A02G14580054257,762.925.6533.4101.110.173
Ta4CL6TraesCS2A02G27290062066,508.686.2740.3396.420.102
Ta4CL7TraesCS2A02G29090069076,141.635.6423.9880.55−0.187
Ta4CL8TraesCS2A02G55690055860,323.356.8740.8186.99−0.024
Ta4CL9TraesCS2A02G55710055760,187.488.335.9186.62−0.006
Ta4CL10TraesCS2A02G57050054559,224.468.5629.1496.990.036
Ta4CL11TraesCS2A02G58160052955,281.216.1627.2895.690.15
Ta4CL12TraesCS2B02G17120054057,381.475.5834.13101.150.173
Ta4CL13TraesCS2B02G29110061966,374.56.2140.0796.250.106
Ta4CL14TraesCS2B02G30730072079,208.56.4832.2681.29−0.162
Ta4CL15TraesCS2B02G58630056561,427.818.0337.2586.96−0.025
Ta4CL16TraesCS2B02G58710055860,337.427.1639.9887.69−0.029
Ta4CL17TraesCS2B02G60580053655,673.586.125.2196.270.167
Ta4CL18TraesCS2D02G15040054057,178.255.733.88100.430.186
Ta4CL19TraesCS2D02G27220061966,428.596.1740.0796.580.11
Ta4CL20TraesCS2D02G28880073180,522.716.0129.5379.53−0.179
Ta4CL21TraesCS2D02G55600056361,094.648.7234.5287.96−0.009
Ta4CL22TraesCS2D02G55610050154,550.869.336.5379.38−0.105
Ta4CL23TraesCS2D02G55650057862,772.437.6338.3987.370.015
Ta4CL24TraesCS2D02G55660056461,297.78.0136.1383.83−0.028
Ta4CL25TraesCS2D02G55690047851,616.286.1640.4887.28−0.049
Ta4CL26TraesCS2D02G55790060164,808.668.2345.4987.77−0.03
Ta4CL27TraesCS2D02G58120054859,725.138.4128.2498.410.055
Ta4CL28TraesCS2D02G58190054859,739.148.5630.0397.140.04
Ta4CL29TraesCS2D02G59850053155,517.35.8527.5894.970.127
Ta4CL30TraesCS3A02G30460063169,199.487.2936.0789.95−0.143
Ta4CL31TraesCS3A02G39420055858,793.988.5648.5296.580.191
Ta4CL32TraesCS3A02G39430056058,750.77.1844.0197.290.18
Ta4CL33TraesCS3A02G47220055058,403.738.7744.697.420.177
Ta4CL34TraesCS3B02G33190063469,537.897.0338.3889.35−0.13
Ta4CL35TraesCS3B02G42620056058,750.766.4449.2694.110.213
Ta4CL36TraesCS3B02G42630056258,863.776.8543.9697.630.188
Ta4CL37TraesCS3B02G51540055058,190.558.9346.1998.130.218
Ta4CL38TraesCS3D02G29730062668,744.917.6337.988.93−0.174
Ta4CL39TraesCS3D02G38800055858,856.937.7147.8197.10.155
Ta4CL40TraesCS3D02G38810056258,981.886.8546.1296.420.164
Ta4CL41TraesCS3D02G46800055458,775.379.245.5998.120.204
Ta4CL42TraesCS3D02G4913001100120,520.265.8244.4986.14−0.098
Ta4CL43TraesCS4A02G03620054958,531.446.3937.9998.110.154
Ta4CL44TraesCS4A02G11910056761,510.767.5927.3489.52−0.025
Ta4CL45TraesCS4A02G11920057963,406.057.5730.984.23−0.092
Ta4CL46TraesCS4A02G23900055158,574.878.743.5394.920.151
Ta4CL47TraesCS4A02G23910054357,096.288.7145.96102.450.309
Ta4CL48TraesCS4B02G07590054357,570.918.1644.71104.940.308
Ta4CL49TraesCS4B02G07600055158,594.88.7943.7795.810.173
Ta4CL50TraesCS4B02G07610054357,750.898.914899.390.179
Ta4CL51TraesCS4B02G18540056761,574.87.5927.4688.48−0.03
Ta4CL52TraesCS4B02G26920055559,004.066.4838.3498.970.184
Ta4CL53TraesCS4B02G32390058163,176.87.9732.6191.98−0.009
Ta4CL54TraesCS4B02G32680055259,349.518.5936.0596.320.052
Ta4CL55TraesCS4B02G32970054958,957.746.6836.7686.03−0.005
Ta4CL56TraesCS4B02G32980065070,840.116.941.1185.22−0.083
Ta4CL57TraesCS4B02G32990060666,458.347.3145.7587.61−0.081
Ta4CL58TraesCS4B02G33010068274,136.937.6538.6184.28−0.073
Ta4CL59TraesCS4B02G33020055860,755.626.4233.9984.61−0.039
Ta4CL60TraesCS4D02G07450054357,442.688.4946.4103.540.291
Ta4CL61TraesCS4D02G07460055158,505.678.5643.2595.480.156
Ta4CL62TraesCS4D02G07470054657,945.919.0348.496.560.109
Ta4CL63TraesCS4D02G18670057963,262.767.5830.182.56−0.107
Ta4CL64TraesCS4D02G18680056761,535.777.2427.289.35−0.024
Ta4CL65TraesCS4D02G26840054758,328.246.5339.1298.990.181
Ta4CL66TraesCS4D02G32090058363,280.967.9733.3591.85−0.006
Ta4CL67TraesCS4D02G32350055159,036.28.8635.9896.520.062
Ta4CL68TraesCS4D02G32670058563,149.896.338.4990.430.03
Ta4CL69TraesCS4D02G32710065670,903.947.3240.3280.49−0.127
Ta4CL70TraesCS5A02G30750052857,725.398.7940.8286.95−0.098
Ta4CL71TraesCS5A02G35680056560,791.66727.9289.63−0.025
Ta4CL72TraesCS5A02G36830043046,523.437.6634.5293.65−0.006
Ta4CL73TraesCS5A02G49640058363,340.097.9733.3191.36−0.005
Ta4CL74TraesCS5A02G49880055259,198.418.7437.8696.340.061
Ta4CL75TraesCS5A02G50120054958,993.96.4837.5488.520.016
Ta4CL76TraesCS5A02G50130055860,574.436.6637.3184.46−0.06
Ta4CL77TraesCS5A02G50140036940,277.617.7438.792.550.067
Ta4CL78TraesCS5A02G50170065470,995.278.0339.9584.31−0.077
Ta4CL79TraesCS5B02G30790032535,103.077.6233.3683.05−0.141
Ta4CL80TraesCS5B02G35930056560,867.837.3227.0788.41−0.014
Ta4CL81TraesCS5B02G36500056260,813.736.6135.7792.38−0.015
Ta4CL82TraesCS5B02G37060047551,264.795.8426.9995.450.033
Ta4CL83TraesCS5B02G57010055458,737.128.5445.321000.195
Ta4CL84TraesCS5D02G31450047952,202.715.9435.0184.86−0.128
Ta4CL85TraesCS5D02G36580056560,803.717.0227.9389.45−0.018
Ta4CL86TraesCS5D02G37780055159,564.566.7426.7898.020.068
Ta4CL87TraesCS5D02G56150055558,863.238.8247.6899.080.184
Ta4CL88TraesCS6A02G02990055860,265.295.3641.1890.340.077
Ta4CL89TraesCS6A02G05940056960,521.646.8137.2286.330.078
Ta4CL90TraesCS6A02G15170054658,531.585.2335.9697.730.093
Ta4CL91TraesCS6A02G26670057360,626.985.4433.6100.280.234
Ta4CL92TraesCS6A02G39060070577,615.25.6226.8579.09−0.201
Ta4CL93TraesCS6B02G04240055660,106.145.3740.2391.350.088
Ta4CL94TraesCS6B02G04290055559,711.825.7636.8292.920.125
Ta4CL95TraesCS6B02G07980059262,860.47.9438.0787.40.057
Ta4CL96TraesCS6B02G17990033736,543.75.8430.85104.180.116
Ta4CL97TraesCS6B02G29410057360,767.15.4633.4799.420.224
Ta4CL98TraesCS6B02G43100057263,611.646.0124.8781.43−0.232
Ta4CL99TraesCS6D02G14170054958,829.935.2939.9697.190.087
Ta4CL100TraesCS6D02G24800056860,154.385.4532.4199.980.229
Ta4CL101TraesCS6D02G37690066773,8205.7425.8178.19−0.215
Ta4CL102TraesCS7A02G0117001198130,912.245.7641.4989.67−0.022
Ta4CL103TraesCS7A02G0337001143124,812.35.6839.8791.690.002
Ta4CL104TraesCS7A02G31010060565,750.568.6540.3991.69−0.023
Ta4CL105TraesCS7A02G49620055759,429.45.3136.5697.380.116
Ta4CL106TraesCS7B02G21000059163,758.298.2542.2890.90.069
Ta4CL107TraesCS7B02G4486001145125,202.445.8341.3588.72−0.05
Ta4CL108TraesCS7D02G03020089197,629.475.6839.2691.14−0.041
Ta4CL109TraesCS7D02G30670055159,312.916.9440.3592.40.011
Ta4CL110TraesCS7D02G48340056059,574.65.2536.7797.910.147
Disclaimer/Publisher’s Note: The statements, opinions and data contained in all publications are solely those of the individual author(s) and contributor(s) and not of MDPI and/or the editor(s). MDPI and/or the editor(s) disclaim responsibility for any injury to people or property resulting from any ideas, methods, instructions or products referred to in the content.

