Article

Smoothness of Graph Energy in Chemical Graphs

by
Katja Zemljič
1,† and
Petra Žigert Pleteršek
2,3,*,†
1
Faculty of Education, University of Maribor, 2000 Maribor, Slovenia
2
Faculty of Chemistry and Chemical Engineering, University of Maribor, 2000 Maribor, Slovenia
3
Faculty of Natural Sciences and Mathematics, University of Maribor, 2000 Maribor, Slovenia
*
Author to whom correspondence should be addressed.
These authors contributed equally to this work.
Mathematics 2023, 11(3), 552; https://doi.org/10.3390/math11030552
Submission received: 4 November 2022 / Revised: 12 January 2023 / Accepted: 17 January 2023 / Published: 20 January 2023

Abstract

:
The energy of a graph G as a chemical concept leading to HMO theory was introduced by Hückel in 1931 and developed into a mathematical interpretation many years later when Gutman in 1978 gave his famous definition of the graph energy as the sum of the absolute values of the eigenvalues of the adjacency matrix of G. One of the general requirements for any topological index is that similar molecules have close TI values, which is called smoothness. To explore this property, we consider two variants of structure sensitivity and abruptness as introduced by Furtula et al. in 2013 and 2019, for hydrocarbons with up to 20 carbon atoms. Finally, we investigate the relationships between graph energies of acyclic hydrocarbons compared to their cyclic versions.
MSC:
05C92; 05C70; 92E10

1. Introduction

In graph theory and chemical graph theory, graph invariants are quantitative measures that preserve the structural properties of graphs under isomorphism. Graph energy is one of the graph invariants which is associated with the physico-chemical properties of the selected molecules. The origin of this research field goes back 50 years when the famous graph energy was introduced in [1].
Countless papers and some monographs have been written on graph energy; for some of them, see [1,2,3]. The monograph [3] is an excellent compilation of results on graph energy, historical background of the subject and methodological approaches, which can serve as a guide for the reader who wishes to know more about this field.
Let G be a (simple) graph with vertex set V ( G ) and edge set E ( G ) . Let the number of vertices of the graph G be n and let them be denoted by v 1 , v 2 , …, v n . The adjacency matrix A ( G ) of the graph G is a square matrix of order n whose ( i , j ) entry is equal to 1 if the vertices v i and v j are adjacent and zero otherwise. The eigenvalues λ 1 , λ 2 , …, λ n of the adjacency matrix A ( G ) are called the eigenvalues of the graph G [4].
In [4], Gutman et al. state that for molecular graph G of a conjugated hydrocarbon with eigenvalues λ 1 , λ 2 , …, λ n , in the so-called Hückel molecular orbital (HMO) [5] approximation, the energy of the i-th molecular orbital is given by
E i = α + λ i β ,
where α and β are constants. To simplify the formalism, it is common to set α = 0 and β = 1 so that the π -electron orbital energies and the graph eigenvalues coincide. It follows that the total π -electron energy (E) is equal to the sum of all π -electron energies present in the molecule, i.e., E = i = 1 n g i E i = i = 1 n g i λ i , where g i is the number of electrons in the i-th molecular orbital with energy E i . In [4], it is explained that because of restrictions presented in [6], g i is 2, 1 or 0. It is important for us to note that in most chemically relevant cases g i = 2 when λ i > 0 and g i = 0 when λ i < 0 , which implies that energy is equal to summation over positive eigenvalues ( E = 2 + λ i , where + is summation over positive eigenvalues). However, since the sum of all eigenvalues is zero, it follows that
E = E ( G ) = i = 1 n | λ i | .
The total of π -electron energy and the right-hand side of the previous equation were studied by Coulson [7] back in the pioneering days of quantum chemistry. In the 1970s, Gutman [1] came up with the idea of defining the energy of a graph G as the sum of the absolute values of its eigenvalues.
In [2], Gutman describes a large number of lower and upper bounds for the graph energy, but the first to write a theorem for lower and upper bounds for the graph energy was McClelland in 1971 [8]. Koolen, Moulton and Gutman introduced an improvement to McClelland’s inequality for the total π -electron energy in [9].
Estrada and Benzi wrote in [10] that the graph energy is a weighted sum of the traces of the even powers of the adjacency matrix. They saw the potential benefit of this finding in new techniques that can be developed to constrain the graph energy where the specific contribution of subgraphs can be determined. This is very important in chemistry, where the search for additional rules for molecular properties contributes to the understanding of such properties in structural terms.
Gutman and Furtula in [11] outline basic principles and facts for the study of graph energies and point out their main applications. A comprehensive research on the subject did not begin until twenty-five years after graph energy was introduced. Over a hundred variants of graph energy have been proposed, based on various matrices rather than the adjacency matrix as in our case. Research on these graph energies is very active nowadays and has led to well over a thousand publications. This has led to a rapid increase in the number of published papers, which is now more than two per week. Graph energies have found unexpected applications in fields of science and engineering such as crystallography, air transport, satellite communication, face recognition, protein sequence comparison, spacecraft construction and high-resolution satellite image processing. Some applications have also been tested in medicine.
The aim of this paper is to study the smoothness of graph energy of certain acyclic and cyclic hydrocarbons. We calculate the graph energies and give linear relations for their prediction. We also compare the graph energies of acyclic molecules with those of their cyclic versions. We then establish measures of smoothness—the (modified) structure sensitivity and (modified) abruptness for 135 molecular graphs in our dataset.
The structure of the paper is the following: In the next section we introduce graph edit distance (GED), structure sensitivity and abruptness, as well as modified structure sensitivity and modified abruptness. The computational details and results are presented in Section 3. First, linear regression analysis of graph energy and correlations is considered and second (modified) structure sensitivity and (modified) abruptness is examined with respect to graph energy. The graph energies of acyclic and cyclic molecules from our dataset are compared finally. A discussion is presented in Section 4 and in Section 5 conclusions are presented. All the calculated data are gathered at the end of the paper.

2. Preliminaries

The concept of smoothness of a molecular descriptor (or topological index) can be viewed as an answer to the question of whether a slight change in the structure of a molecule leads to a slight change in the molecular descriptor. Furtula et al. approached this problem in [12] and introduced the structure sensitivity and the abruptness of a topological index. A sensitive topological index should have a high structure sensitivity, but needs to keep the abruptness as low as possible. The graph edit distance GED can be used to compare graphs with a small structural change. Graph edit distance is defined as the cost of the least expensive sequence of edit operations required to transform one graph into another; for a survey on GED, see [13]. Our goal is to compare molecules of the same size and order. More precisely, for a graph G, let S ( G ) be a set of graphs obtained from G by adding an edge together with its endpoint. Consequently, the graph edit distance between G and any graph from S ( G ) is equal to two. For a molecular descriptor T I of the graph G, the structure sensitivity S S G ( T I ) and the abruptness Abr G ( T I ) are defined as follows:
S S G ( T I ) = 1 | S ( G ) | H S ( G ) T I ( G ) T I ( H ) T I ( G )
and
Abr G ( T I ) = max H S ( G ) T I ( G ) T I ( H ) T I ( G ) .
In [14], a new method for quantifying the structure sensitivity and abruptness of a molecular descriptor is presented that outperforms the first method. Instead of comparing graphs based on a fixed graph edit distance, we chose a molecule M represented by a molecular graph G and then formed a set of all molecules in our dataset that are similar to M. The set of molecular graphs of these molecules is denoted by M ( G ) . Then, a modified structure sensitivity S S G * ( T I ) and a modified abruptness  Abr G * ( T I ) of a molecular descriptor T I for a molecular graph G were assessed with the following formulas:
S S G * ( T I ) = 1 | M ( G ) | H M ( G ) ( T I ( G ) T I ( H ) ) 2
and
Abr G * ( T I ) = max H M ( G ) T I ( G ) T I ( H ) .
The average values of a modified structure sensitivity and a modified abruptness of a molecular descriptor T I over molecular graphs in the set M were calculated as follows:
S S * ¯ ( T I ) = G M S S G * ( T I ) | M | max G M T I ( G ) min G M T I ( G )
and
Abr * ¯ ( T I ) = G M Abr G * ( T I ) | M | max G M T I ( G ) min G M T I ( G ) .

3. Computational Details and Results

Our dataset M is composed of four sets of hydrocarbons with up to 20 carbon atoms. The first set M 1 consists of 19 acyclic alkanes from ethane to icosane and the second set M 2 is formed of 18 cyclic versions of the molecules in the first set. The third and the fourth set, M 3 and M 4 , were obtained by adding the methyl group to the cycloalkanes and alkanes of the sets M 2 and M 1 , respectively (see Figure 1). So in the set M 3 there are 17 methyl-cycloalkanes and in the set M 4 there are 82 methyl-alkanes. The cardinality of M 4 is larger due to the structural isomers of methyl-alkanes. For all 135 molecules in the dataset M , the eigenvalues and then the graph energies are calculated; see Table A5 in Appendix A.

3.1. Linear Regression Analysis of Graph Energy and Correlations

First, we compare the values of the calculated graph energies as a linear function of the number of vertices in a molecular graph, denoted by n. Each of the four subsets M 1 , , M 4 is considered separately. In the subset M 4 , we have structural isomers with the same number of vertices, so in this case the average of the graph energies is considered in the regression analysis. Linear regressions for predicting the graph energy for alkanes (1), cycloalkanes (2), methyl-cycloalkanes (3) and the average value of graph energy for methyl-alkanes (4) are:
E ( M 1 ) = 1.2782 n 0.8149 , R 2 = 0.9996
E ( M 2 ) = 1.2806 n 0.1406 , R 2 = 0.9976
E ( M 3 ) = 1.2827 n + 0.8792 , R 2 = 0.9991
E ( M 4 ) = 1.2825 n + 0.0682 , R 2 = 0.9993
As we can observe, the correlations are very good, since the coefficients of determination are all higher than 0.99 .
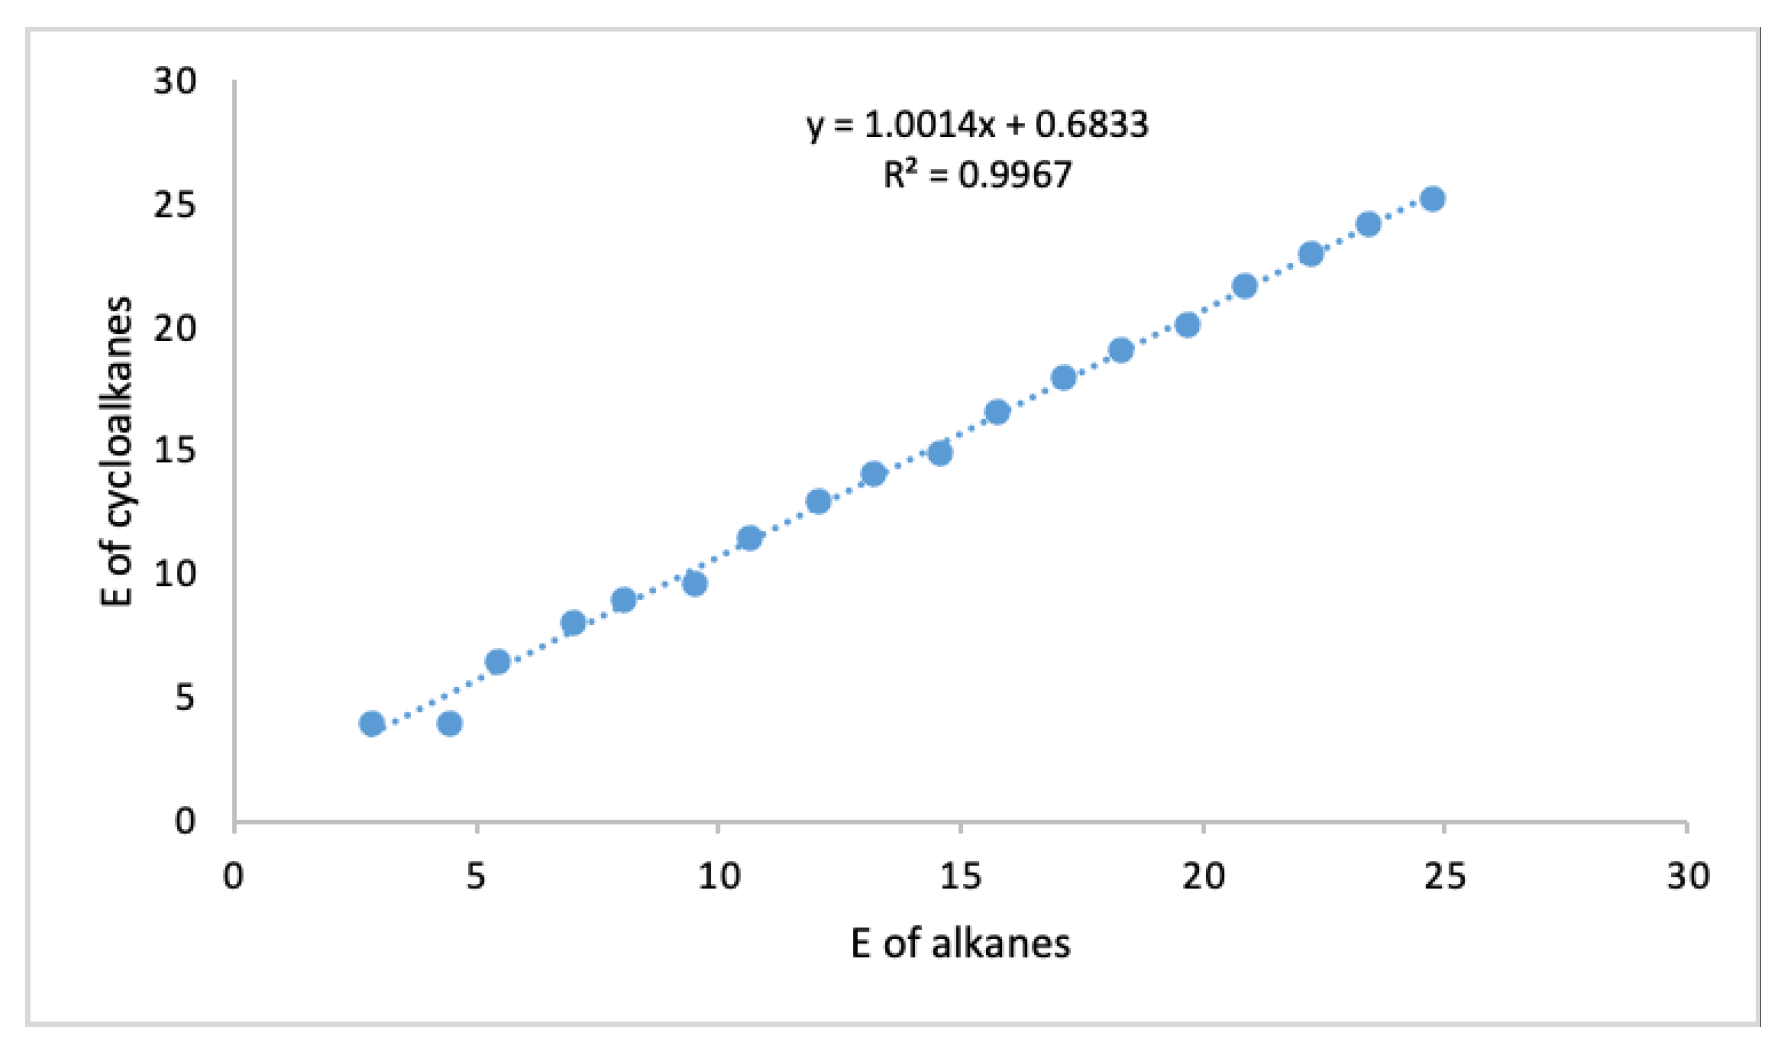
Second, we are interested in the connection between the graph energies of acyclic and cyclic molecules and so we compare the values of graph energies between molecular graphs in the sets M 1 and M 2 . More specifically, we perform the correlation analysis between alkanes and cycloalkanes with the same number of vertices. The results are gathered in Figure 2. We proceed similarly with the molecules in the subsets M 3 and M 4 , i.e., with methyl-alkanes and methyl-cycloalkanes. As in the linear regressions for the prediction of graph energies, because of the structural isomers of methyl-alkanes with the same number of vertices, the average value of graph energies of isomers is included in the calculation. The results can be seen in Figure 3.
Again, the correlations between graph energies of acyclic and cyclic molecules are very good, as the coefficients of determination are both above 0.99.

3.2. Structure Sensitivity and Abruptness of Graph Energy

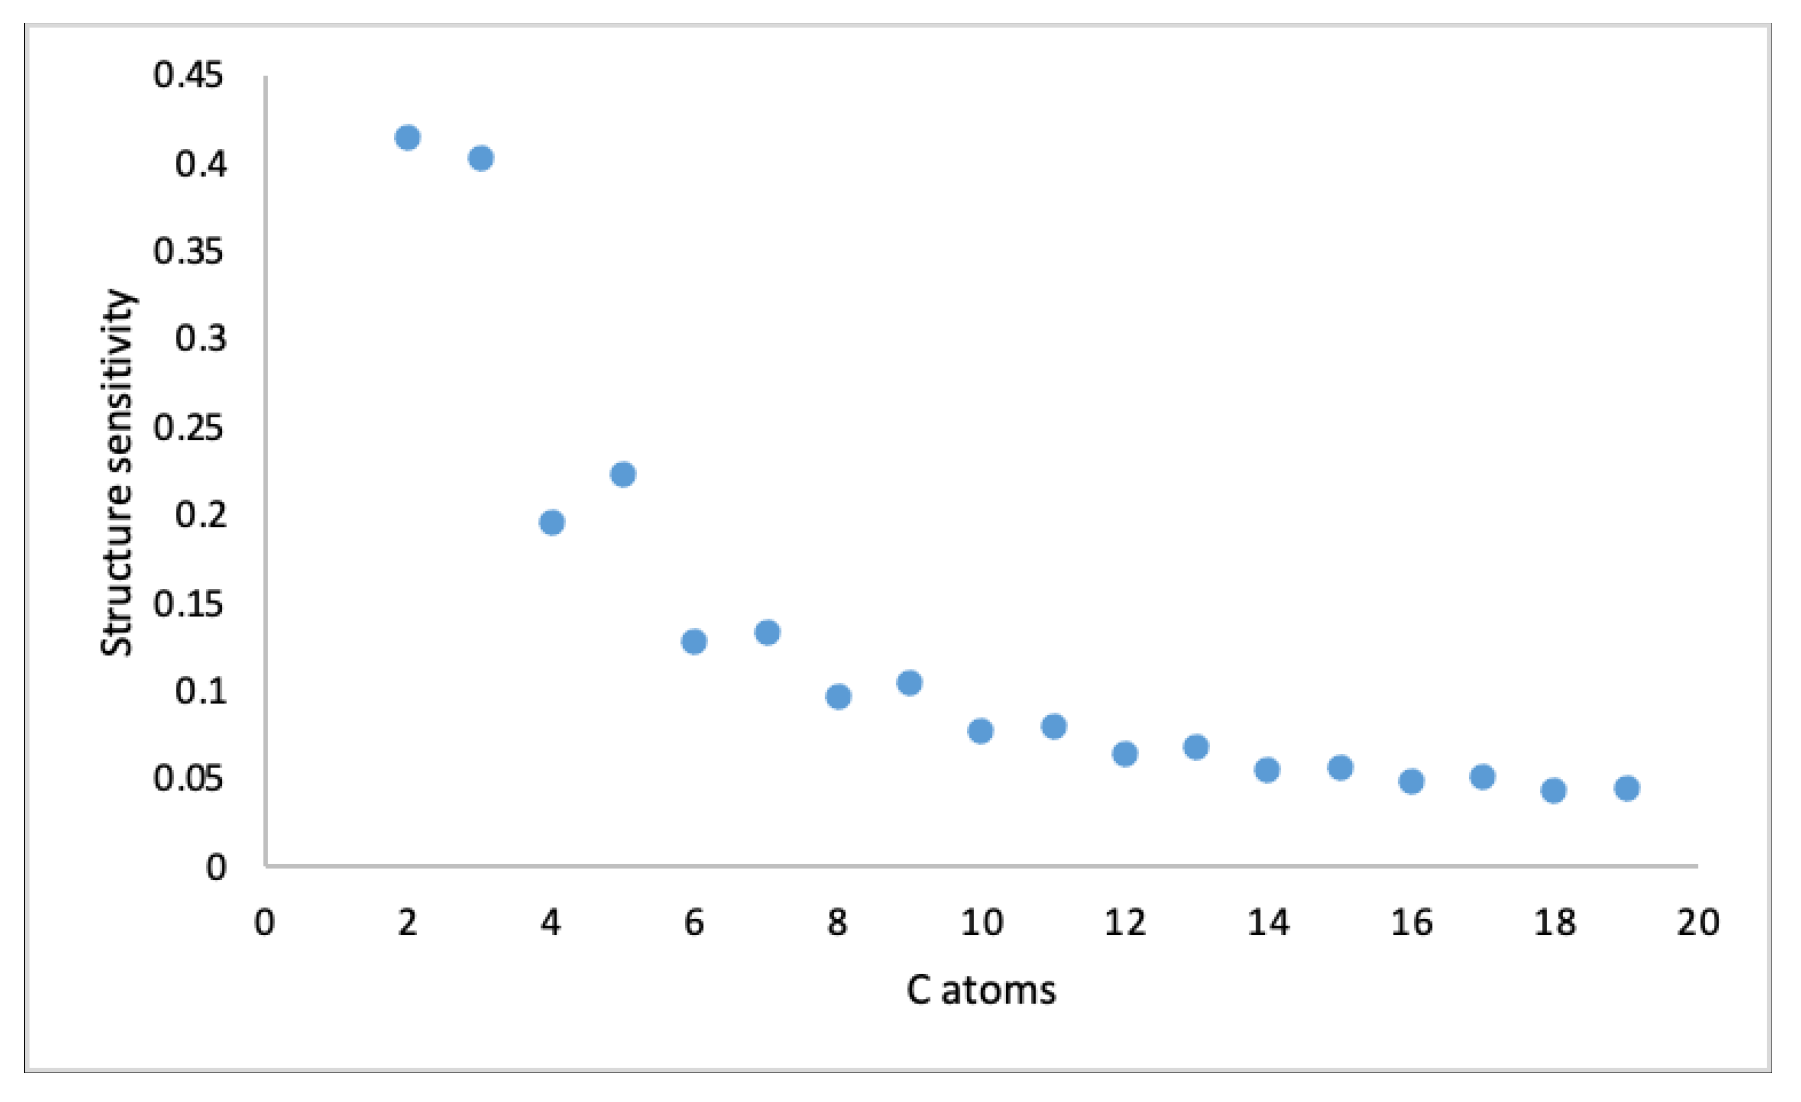
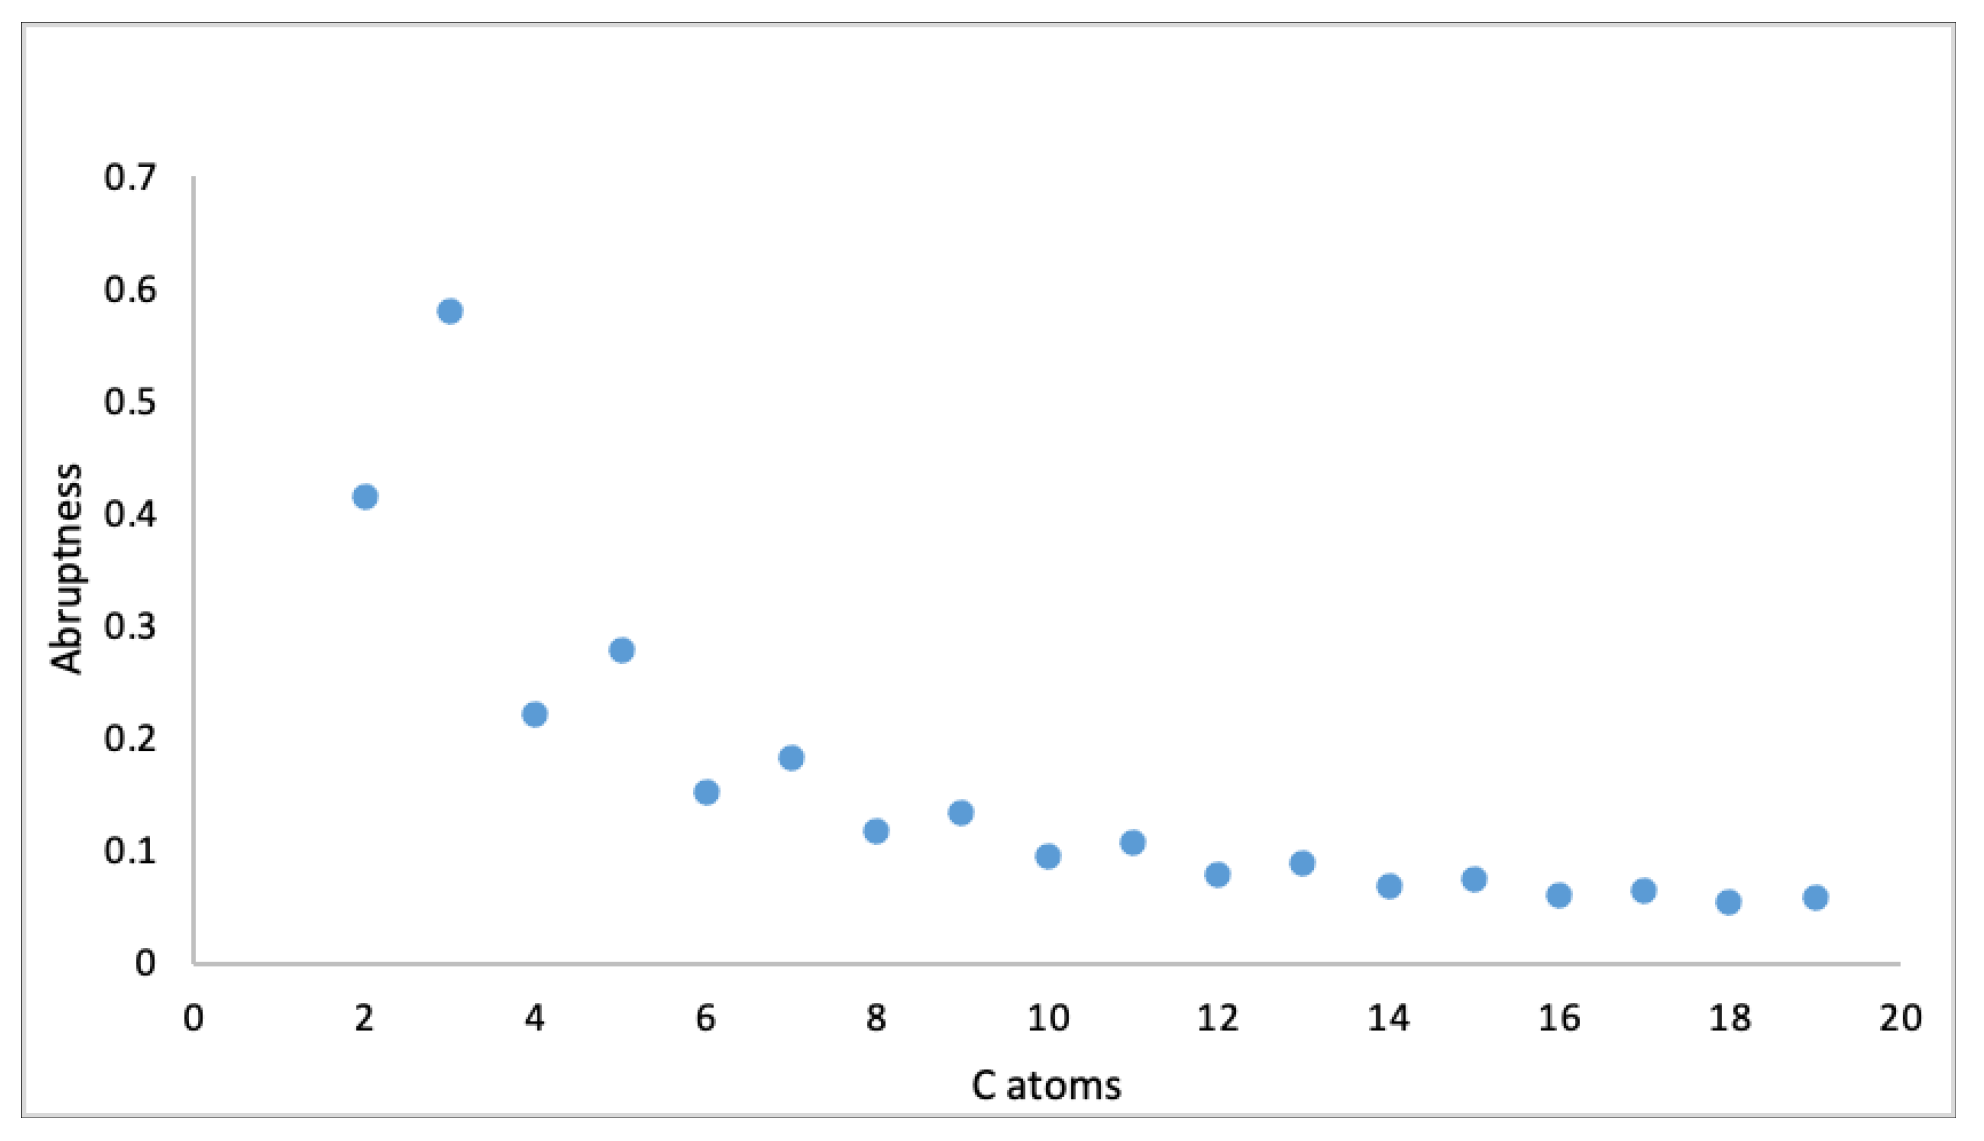
We now consider the structure sensitivity and the abruptness of the graph energy of alkanes and molecular graphs in the dataset M , which has a graph edit distance equal to 2. More precisely, for an alkane G, let S ( G ) be the set of all molecular graphs resulting from G with the addition of an edge and its endpoint. For example, for hexane G, there are three molecular graphs from our dataset with GED = 2, that is, the molecular graphs of 2-methylhexane, 3-methylhexane and heptane form the set S ( G ) (see Figure 4). The structure sensitivity and abruptness of graph energy are then calculated for each alkane G. The obtained values are shown in Table A1 in Appendix A.
Visualisation of the data from Table A1 from Appendix A is shown in Figure 5 for structure sensitivity and in Figure 6 for abruptness of graph energy. It can be seen that both structure sensitivity and abruptness of graph energy decrease with the order of a molecule.
Finally, we consider the modified structure sensitivity S S * and the modified abruptness Abr * as introduced by Furtula et al. in [14], where the authors aim to determine the structure sensitivity of molecular descriptors by grouping similar molecules using the Tanimoto index and the Morgan circular fingerprints. The same concept is also applied in [15], where the authors investigated structural sensitivity of some eigenvalue-based topological indices, including the graph energy. In this way we now consider isomeric molecules in the database instead of using the concept of graph edit distance.
Our dataset is again the set M without the smallest molecule ethane. The dataset is divided into 18 subsets of mutually isomeric molecules with respect to the number of carbon atoms, so the smallest subset contains molecules with 3 carbon atoms and the last subset contains molecules with 20 carbon atoms. The modified structure sensitivity and modified abruptness are considered separately in 18 subsets. For example, in Figure 7 we see isomers with five carbon atoms: pentane, 2-methylbutane, cyclopentane and methylcyclobutane. In each of these subsets, each molecule is set once as a referent molecule G and then the modified structure sensitivity and modified abruptness are computed for G, so that the calculations must be performed for all 134 molecules from M . Moreover, the average values are calculated for modified structure sensitivity and modified abruptness in each of the 18 subgroups of isomers. Due to the complexity of the calculations, an algorithm was developed in the Python programming language. The results are summarised in Table A2, Table A3 and Table A4 in Appendix A.
In Figure 8 and Figure 9, it can be seen that the modified sensitivity decreases with the order of the isomers considered, while the modified abruptness also decreases, but more slowly and depending on the parity of the vertices.

4. Discussion

The calculated graph energies allow us to establish a very good linear relationship for predicting the graph energies of (methyl)-(cyclo)alkanes. All four types of molecular groups are treated separately, as is common in chemical graph theory, to obtain more accurate predictions. Very high correlations ensure reliable prediction of graph energies obtained in a simple way from the order of a molecular graph. There is also a high correlation between the graph energies of cyclic molecular graphs compared to acyclic graphs.
According to [12], from a practical point of view, the desirable property of a topological index is that the structure sensitivity is as large as possible, but the abruptness is as small as possible. As for many of the topological indices considered therein, our results also show that the structure sensitivity and abruptness of graphs clustered with respect to the graph edit distance both decrease with the order of the molecular graphs, tending towards zero.
In our study, the structure sensitivity behaves similarly to the modified structure sensitivity. The modified abruptness also decreases with the number of vertices of the molecular graph, but at a slower rate. We also found that abruptness and modified abruptness behave similarly in graphs with even order and graphs with odd order. However, we must take into account that the sets of “similar” molecules are defined differently in these two cases. In the first case, we considered molecular graphs with the same graph edit distance and in the second case similar molecules were grouped together in terms of isomerism and therefore cannot be compared numerically.

5. Conclusions

This research gives us an insight into the relationship between graph energies of cyclic and acyclic structures and establishes the linear formulae for a very good prediction of this topological index from the order of the molecular graph.
The measures of smoothness of graph energy are provided and their behaviour is studied. The next line of work is to compare the data provided here with other molecular descriptors to derive how smooth the graph energy behaves compared to other topological indices.

Author Contributions

All authors contributed equally to this work. Conceptualization, P.Ž.P. and K.Z.; methodology, P.Ž.P. and K.Z.; software, P.Ž.P.; formal analysis, P.Ž.P. and K.Z; investigation, P.Ž.P. and K.Z.; resources, K.Z.; data curation, P.Ž.P.; writing—original draft preparation, P.Ž.P. and K.Z.; writing—review and editing, P.Ž.P. and K.Z.; visualization, P.Ž.P. and K.Z.; supervision, P.Ž.P. All authors have read and agreed to the published version of the manuscript.

Funding

This research was funded by the Slovenian Research Agency, grant number P1-0297 (P.Ž.P.).

Conflicts of Interest

The authors declare no conflict of interest.

Appendix A. Supplementary Data

Table A1. The structure sensitivity and the abruptness of graph energy of alkanes with up to 19 vertices with regard to the molecular graphs in the dataset with GED = 2.
G | S ( G ) | SS G ( E ) Abr G ( E )
ethane10.414210.41421
propane20.402940.58114
butane20.195220.22181
pentane30.222660.27888
hexane30.128640.15266
heptane40.133430.18162
octane40.096270.11662
nonane50.104330.13417
decane50.077060.09443
undecane60.079710.10620
dodecane60.064320.07936
tridecane70.068000.08781
tetradecane70.055230.06845
pentadecane80.056830.07481
hexadecane80.048410.06019
heptadecane90.050480.06515
octadecane90.043100.05371
nonadecane100.044160.05769
Table A2. Modified structure sensitivity and modified abruptness with average values, Part I.
# CG SS G * ( E ) Abr G * ( E ) SS * ¯ ( E ) Abr * ¯ ( E )
3propane0.828431.171570.707111.00000
cyclopropane0.828431.17157
4butane0.608151.008040.512710.82878
2-methylpropane0.941831.49829
cyclobutane0.599230.96239
methylcyclopropane0.923501.49829
5pentane0.521091.008040.601761.02855
2-methylbutane0.637131.24589
cyclopentane0.978701.24589
methylcyclobutane0.568181.12383
6hexane0.625111.012080.455780.77120
2-methylpentane1.128381.84463
3-methylpentane0.647221.10102
cyclohexane1.088531.84463
methylcyclopentane0.714501.31051
7heptane0.538980.933240.545550.88169
2-methylhexane0.735551.26051
3-methylhexane0.631491.10946
cycloheptane0.867431.26051
methylcyclohexane0.664890.99316
8octane0.466070.754970.492610.80174
2-methylheptane0.742691.23178
3-methylheptane0.441760.64669
4-methylheptane0.690681.16592
cyclooctane0.529250.89428
methylcycloheptane0.770311.23178
9nonane0.439360.890040.466110.83639
2-methyloktane0.629171.26588
3-methyloktane0.492571.04540
4-methyloktane0.540581.13356
cyclononane0.916211.26588
methylcyclooctane0.522340.75185
10decane0.527390.890920.449800.78752
2-methylnonane0.859781.60171
3-methylnonane0.533261.00676
4-methylnonane0.792531.51436
5-methylnonane0.536711.02626
cyclodecane1.061701.60171
methylcyclononane0.731721.18791
11undecane0.442580.861840.475310.85526
2-methyldecane0.636561.26844
3-methyldecane0.482541.00747
4-methyldecane0.552821.14338
5-methyldecane0.513901.07445
cycloundecane0.919441.26844
methylcyclodecane0.672510.96995
Table A3. Modified structure sensitivity and modified abruptness with average values, Part II.
# CG SS G * ( E ) Abr G * ( E ) SS * ¯ ( E ) Abr * ¯ ( E )
12dodecane0.433220.682150.479280.79161
2-methylundecane0.658901.15977
3-methylundecane0.404490.59723
4-methylundecane0.585031.06267
5-methylundecane0.402660.62438
6-methylundecane0.569341.04079
cyclododecane0.638851.01789
methylcycloundecane0.754351.15977
13tridecane0.401360.841970.428220.83628
2-methyldodecane0.582481.26986
3-methyldodecane0.423270.98223
4-methyldodecane0.501471.14839
5-methyldodecane0.444741.03935
6-methyldodecane0.467241.08698
cyclotridecane0.937901.26986
methylcyclododecane0.591770.85706
14tetradecane0.475160.842300.420320.79215
2-methyltridecane0.732791.50436
3-methyltridecane0.466080.96408
4-methyltridecane0.656941.40199
5-methyltridecane0.468810.99504
6-methyltridecane0.634801.37006
7-methyltridecane0.469801.00269
cyclotetradecane1.047371.50436
methylcyclotridecane0.739001.14013
15pentadecane0.400230.827200.425030.84107
2-methyltetradecane0.578071.27073
3-methyltetradecane0.414640.96417
4-methyltetradecane0.498611.1513
5-methyltetradecane0.431401.01587
6-methyltetradecane0.466381.09363
7-methyltetradecane0.447031.05359
cyclopentadecane0.941721.27073
methylcyclotetradecane0.682860.97177
16hexadecane0.411720.647170.455130.78507
2-methylpentadecane0.604471.12561
3-methylpentadecane0.377160.60159
4-methylpentadecane0.525631.02008
5-methylpentadecane0.374290.63474
6-methylpentadecane0.500040.98267
7-methylpentadecane0.373980.64622
8-methylpentadecane0.493400.97257
cyclohexadecane0.711801.08063
methylcyclopentadecane0.750501.12561
Table A4. Modified structure sensitivity and modified abruptness with average values, Part III.
# CG SS G * ( E ) Abr G * ( E ) SS * ¯ ( E ) Abr * ¯ ( E )
17heptadecane0.377760.815780.258750.83038
2-methylhexadecane0.544621.27131
3-methylhexadecane0.380810.95060
4-methylhexadecane0.465641.15315
5-methylhexadecane0.393330.99899
6-methylhexadecane0.434711.09763
7-methylhexadecane0.404701.03127
8-methylhexadecane0.417281.06138
cycloheptadecane0.950891.27131
methylcyclohexadecane0.630790.90527
18octadecane0.440990.815950.390230.79306
2-methylheptadecane0.655671.45164
3-methylheptadecane0.420650.94002
4-methylheptadecane0.577271.34405
5-methylheptadecane0.421360.97455
6-methylheptadecane0.550181.30334
7-methylheptadecane0.422430.98823
8-methylheptadecane0.540241.28771
9-methylheptadecane0.422800.99206
cyclooctadecane1.037671.45164
methylcycloheptadecane0.742031.11443
19nonadecane0.375500.806720.386810.83130
2-methyloctadecane0.538001.27170
3-methyloctadecane0.373280.94002
4-methyloctadecane0.459581.15440
5-methyloctadecane0.383490.98624
6-methyloctadecane0.429381.10022
7-methyloctadecane0.392531.01519
8-methyloctadecane0.412911.06615
9-methyloctadecane0.401711.03984
cyclononadecane0.953611.27170
methylcyclooctadecane0.690970.97670
20icosane0.395020.626570.424620.77814
2-methylnonadecane0.565151.11860
3-methylnonadecane0.354910.61675
4-methylnonadecane0.484311.00960
5-methylnonadecane0.350840.65221
6-methylnonadecane0.455740.96672
7-methylnonadecane0.350190.66727
8-methylnonadecane0.443840.94775
9-methylnonadecane0.350110.67330
10-methylnonadecane0.440460.94222
cycloicosane0.760361.11860
methylcyclononadecane0.748801.10555
Table A5. The graph energy of considered molecular graphs.
SetMoleculeE(G)SetMoleculeE(G)SetMoleculeE(G)
M 1 ethane2.00000 M 3 methylcycloundecane15.07008 M 4 2-methyltetradecane17.86281
M 1 propane2.82843 M 3 methylcyclododecane16.17966 M 4 3-methyltetradecane18.16937
M 1 butane4.47214 M 3 methylcyclotridecane17.61161 M 4 4-methyltetradecane17.98224
M 1 pentane5.46410 M 3 methylcyclotetradecane18.83458 M 4 5-methyltetradecane18.11767
M 1 hexane6.98792 M 3 methylcyclopentadecane20.15434 M 4 6-methyltetradecane18.03991
M 1 heptane8.05468 M 3 methylcyclohexadecane21.30986 M 4 7-methyltetradecane18.07995
M 1 octane9.51754 M 3 methylcycloheptadecane22.69787 M 4 2-methylpentadecane19.02873
M 1 nonane10.62750 M 3 methylcyclooctadecane23.92413 M 4 3-methylpentadecane19.55275
M 1 decane12.05335 M 3 methylcyclononadecane25.24196 M 4 4-methylpentadecane19.13426
M 1 undecane13.19151 M 4 2-methyilpropane3.46410 M 4 5-methylpentadecane19.51960
M 1 dodecane14.59246 M 4 2-methylbutane5.22625 M 4 6-methylpentadecane19.17167
M 1 tridecane15.75049 M 4 2-methylpentane6.15537 M 4 7-methylpentadecane19.50812
M 1 tetradecane17.13354 M 4 3-methylpentane6.89898 M 4 8-methylpentadecane19.18177
M 1 pentadecane18.30634 M 4 2-methylhexane7.72741 M 4 2-methylhexadecane20.40459
M 1 hexadecane19.67590 M 4 3-methylhexane7.87846 M 4 3-methylhexadecane20.72530
M 1 heptadecane20.86010 M 4 2-methylheptane8.76257 M 4 4-methylhexadecane20.52275
M 1 octadecane22.21913 M 4 3-methylheptane9.40926 M 4 5-methylhexadecane20.67691
M 1 nonadecane23.41241 M 4 4-methylheptane8.82843 M 4 6-methylhexadecane20.57827
M 1 icosane24.76298 M 4 2-methyloktane10.25166 M 4 7-methylhexadecane20.64463
M 2 cyclopropane4.00000 M 4 3-methyloktane10.47214 M 4 8-methylhexadecane20.61452
M 2 cyclobutane4.00000 M 4 4-methyloktane10.38398 M 4 2-methylheptadecane21.58344
M 2 cyclopentane6.47214 M 4 2-methylnonane11.34256 M 4 3-methylheptadecane22.09506
M 2 cyclohexane8.00000 M 4 3-methylnonane11.93751 M 4 4-methylheptadecane21.69103
M 2 cycloheptane8.98792 M 4 4-methylnonane11.42991 M 4 5-methylheptadecane22.06053
M 2 cyclooctane9.65685 M 4 5-methylnonane11.91801 M 4 6-methylheptadecane21.73174
M 2 cyclononane11.51754 M 4 2-methyldecane12.78491 M 4 7-methylheptadecane22.04685
M 2 cyclodecane12.94427 M 4 3-methyldecane13.04588 M 4 8-methylheptadecane21.74737
M 2 cycloundecane14.05335 M 4 4-methyldecane12.90997 M 4 9-methylheptadecane22.04302
M 2 cyclododecane14.92820 M 4 5-methyldecane12.97890 M 4 2-methyloctadecane22.94743
M 2 cyclotridecane16.59246 M 4 2-methylundecane13.91031 M 4 3-methyloctadecane23.27911
M 2 cyclotetradecane17.97584 M 4 3-methylundecane14.47285 M 4 4-methyloctadecane23.06473
M 2 cyclopentadecane19.13354 M 4 4-methylundecane14.00741 M 4 5-methyloctadecane23.23289
M 2 cyclohexadecane20.10936 M 4 5-methylundecane14.44570 M 4 6-methyloctadecane23.11891
M 2 cycloheptadecane21.67590 M 4 6-methylundecane14.02929 M 4 7-methyloctadecane23.20394
M 2 cyclooctadecane23.03508 M 4 2-methyldodecane15.32260 M 4 8-methyloctadecane23.15298
M 2 cyclononadecane24.21913 M 4 3-methyldodecane15.61023 M 4 9-methyloctadecane23.17929
M 2 cycloicosane25.25501 M 4 4-methyldodecane15.44407 M 4 2-methylnonadecane24.13641
M 3 methylcyclopropane4.96239 M 4 5-methyldodecane15.55311 M 4 3-methylnonadecane24.63826
M 3 methylcyclobutane5.34831 M 4 6-methyldodecane15.50548 M 4 4-methylnonadecane24.24541
M 3 methylcyclopentane7.46588 M 4 2-methyltridecane16.47148 M 4 5-methylnonadecane24.60280
M 3 methylcyclohexane8.72057 M 4 3-methyltridecane17.01176 M 4 6-methylnonadecane24.28829
M 3 methylcycloheptane9.99435 M 4 4-methyltridecane16.57385 M 4 7-methylnonadecane24.58774
M 3 methylcyclooctane11.00351 M 4 5-methyltridecane16.98080 M 4 8-methylnonadecane24.30726
M 3 methylcyclononane12.53047 M 4 6-methyltridecane16.60578 M 4 9-methylnonadecane24.58171
M 3 methylcyclodecane13.75486 M 4 7-methyltridecane16.97315 M 4 10-methylnonadecane24.31279

References

  1. Gutman, I. The energy of a graph. Ber. Math-Statist. Sekt. Forchungsz. Graz 1978, 103, 1–22. [Google Scholar]
  2. Gutman, I. The energy of a Graph: Old and New Results. Algebraic Combinatorics and Applications; Springer: Berlin/Heidelberg, Germany, 2001; pp. 196–211. [Google Scholar]
  3. Li, X.; Shi, Y.; Gutman, I. Graph Energy; Springer Science & Business Mediam: New York, NY, USA, 2012. [Google Scholar]
  4. Gutman, I.; Li, X.; Zhang, J. Graph energy. In Analysis of Complex Networks: From Biology to Linguistics; Wiley-VCH: Weinheim, Germany, 2009; pp. 145–174. [Google Scholar]
  5. Hückel, E. Quantentheoretische Beiträge zum Benzolproblem. Z. Phys. 1931, 70, 204–286. [Google Scholar] [CrossRef]
  6. Coulson, C.A.; O‘Leary, B.; Mallion, R.B. Hückel Theory for Organic Chemists; Academic Press: London, UK, 1987. [Google Scholar]
  7. Coulson, C.A. On the calculation of the energy in unsaturated hydrocarbon molecules. Proc. Camb. Phil. Soc. 1940, 36, 201–203. [Google Scholar] [CrossRef]
  8. McCelland, B.J. Properties of the latent roots of a matrix: The estimation of π-electron energies. J. Chem. Phys. 1971, 54, 640–643. [Google Scholar] [CrossRef]
  9. Koolen, J.H.; Moulton, V.; Gutman, I. Improving the McClelland inequality for total π-electron energy. Chem. Phys. Lett. 2000, 320, 213–216. [Google Scholar] [CrossRef]
  10. Estrada, E.; Benzi, M. What is the meaning of the graph energy after all? Discrete Appl. Math. 2017, 230, 71–77. [Google Scholar] [CrossRef] [Green Version]
  11. Gutman, I.; Furtula, B. Graph energies and their applications. Bull. Sci. Math. 2019, 44, 29–45. [Google Scholar]
  12. Furtula, B.; Gutman, I.; Dehmer, M. On structure-sensitivity ofdegree-based topological indices. Appl. Math. Comput. 2013, 219, 8973–8978. [Google Scholar]
  13. Gao, X.; Xiao, B.; Tao, D. A survey of graph edit distance. Pattern Anal. Appl. 2010, 13, 113–129. [Google Scholar] [CrossRef]
  14. Rakić, M.; Furtula, B. A novel method for measuring the structure sensitivity of molecular descriptors. J. Chemom. 2019, 33, e3138. [Google Scholar] [CrossRef]
  15. Redžepović, I.; Furtula, B. Comparative study on structural sensitivity of eigenvalue–based molecular descriptors. J. Math. Chem. 2021, 59, 476–487. [Google Scholar] [CrossRef]
Figure 1. Representatives of each of four sets M 1 , , M 4 .
Mathematics 11 00552 g001
Figure 2. Correlation between graph energy of alkanes and cycloalkanes.
Mathematics 11 00552 g002
Figure 3. Correlation between graph energy of methyl-alkanes and methyl-cycloalkanes.
Mathematics 11 00552 g003
Figure 4. Hexane G and graphs in the set S ( G ) with GED = 2 with respect to G.
Mathematics 11 00552 g004
Figure 5. Distribution of structure sensitivity of graph energy.
Mathematics 11 00552 g005
Figure 6. Distribution of abruptness of graph energy.
Mathematics 11 00552 g006
Figure 7. Isomers with five carbon atoms in the dataset.
Mathematics 11 00552 g007
Figure 8. Distribution of modified structure sensitivity of graph energy.
Mathematics 11 00552 g008
Figure 9. Distribution of modified abruptness of graph energy.
Mathematics 11 00552 g009
Disclaimer/Publisher’s Note: The statements, opinions and data contained in all publications are solely those of the individual author(s) and contributor(s) and not of MDPI and/or the editor(s). MDPI and/or the editor(s) disclaim responsibility for any injury to people or property resulting from any ideas, methods, instructions or products referred to in the content.