Article

Study of the Jet Output Characteristics under Multi−Source Coupling

1
School of Petroleum Engineering, China University of Petroleum (East China), Qingdao 266580, China
2
Key Laboratory of Unconventional Oil and Gas Development, Ministry of Education, Qingdao 266580, China
*
Author to whom correspondence should be addressed.
Processes 2023, 11(3), 900; https://doi.org/10.3390/pr11030900
Submission received: 13 January 2023 / Revised: 14 March 2023 / Accepted: 14 March 2023 / Published: 16 March 2023

Abstract

:
The challenges posed by elevated rock hardness, deficient drillability, excessive friction torque, and significant underpressure in extended−reach horizontal wells are the primary factors that contribute to low ROP (Rate of Penetration) and limited horizontal reach during the drilling operation. Reducing drag and friction is one of the primary methods of addressing the aforementioned challenges. To augment the pulse output characteristics of the oscillating jet and bolster the energy of the hydrodynamic impact load, we developed and designed a multi−source impact oscillation speed−increasing tool coupled with blade rotation disturbance and multi−order oscillation cavity self−excitation. We utilized fluid dynamics software to model and conduct numerical analysis on the multi−source pulsed jet generator. Furthermore, we constructed a prototype and subjected it to testing. This paper examines the impact of dimensionless structural parameters on the pressure output characteristics of the multi−source pulse−jet generator. Specifically, we used three dimensionless quantities (cavity length ratios, cavity diameter ratios, and inner wall collision angle ratios) to study this effect. The findings indicate that the multi−source impact oscillation speed−increasing tool is capable of augmenting the pulse oscillation amplitude, and the frequency of pulse oscillation can be adjusted within the range of 5 Hz to 15 Hz. During the study, we determined that the optimal oscillation output characteristics can be achieved when the cavity diameter ratio is 0.8, the cavity length ratio is 1.0, and the inner wall collision angle ratio is 1.5. These findings present a novel approach for the development of downhole hydraulic impact oscillation speed−increasing tools.

1. Introduction

During the 1920s, the United States pioneered the use of extended−reach horizontal wells technology to explore and extract offshore oil and gas resources from land. Over time, other countries in Europe and the United States have adopted this technology and developed a comprehensive engineering technology system for its implementation [1,2]. Despite a late start, China has made significant strides in the drilling and completion technology of extended−reach horizontal wells, thanks to advancements in technology, across various oil fields [3,4].
As the depth of the horizontal well increases, the friction drag resulting from the contact between the string and the borehole wall also increases. As a result, the common pressure support problem can cause a reduction in the rate of penetration (ROP) and the ability to extend horizontally [5,6,7,8]. The technology of vibration−based drag and friction reduction can not only transfer static and dynamic friction between the pipe string and the bottom wall but also enhance the efficiency of bit impact rock breaking [9,10,11,12,13,14]. The axial hydrodynamic impactor is a downhole tool that is suitable for enhancing drag and friction reduction in horizontal wells. It comprises various types of tools, including injection−type impact tools, valve−type impact tools, screw impact devices, and more [15,16,17,18,19,20]. Instantaneous changes in the flow out section of the drilling fluid cause periodic pressure fluctuations in the fluid within the tool, which in turn generates axial periodic vibrations. Structural parameters have a significant impact on the characteristics of pressure pulsations, which are the primary factors affecting drag and friction reduction [21,22,23,24,25].
The self−excited oscillating pulse jet exhibits high peak pressure at the stagnation point and exerts a strong impact force [26,27,28,29]. The self−excited oscillating pulse jet is widely used in deep well drilling because it can improve the transmission effectiveness of Weight on Bit (WOB) during drilling and reduce friction between the Bottom Hole Assembly (BHA) and the wellbore [30,31].
After analyzing hydrodynamic impact technology, a multi−source impact oscillation speed−increasing tool is proposed and designed by coupling the self−excitation oscillation cavity and impeller disturbance. The effects of dimensionless structural parameters, such as cavity length ratios, cavity diameter ratios, and inner wall collision angle ratios, on the pulsation output frequency and vibration amplitude of the multi−source pulse−jet generator model were studied using computational fluid dynamics simulation. Subsequently, the prototype of the multi−source impact oscillation speed−increasing tool was machined and tested on the ground. This design presents a new technical approach for enhancing the rate of penetration (ROP) and increasing the horizontal section extension length of extended−reach horizontal wells.

2. Tool Structure and Principle

The multi−source impact oscillation speed−increasing tool is composed of various components including an upper joint, transmission housing, outer housing, impact piston, impeller assembly, primary oscillation cavity, secondary oscillation cavity, and lower joint. Figure 1 illustrates the overall structural diagram.

3. Establishment of the Structural Model and Flow Field

3.1. Establishment of the Physical Model and Parameter Design

As shown in Figure 2 and Table 1, they are respectively the fixed working parameters and structural parameters in the numerical simulation: the flow is 35 L s−1, L1 = 12 mm, L2 = 70 mm, D1 = 30 mm, D2 = 80 mm, D3 = 30 mm, and D5 = 18 mm.
Among them, the group A fixed dimensionless structure parameter is D4 = 64 mm, β = 40°; the group B fixed dimensionless structure parameter is L3 = 56 mm, β = 40°; the group C fixed dimensionless structure parameter is D4 = 64 mm, L3 = 56 mm.

3.2. Establishment of the Mathematical Model

According to the principle of conservation of mass, the fluid is set as a continuously isothermal and incompressible Newtonian fluid, and the continuity equation is [32,33]:
( ρ v x ) x + ( ρ v y ) y + ( ρ v z ) z + ρ t = 0
According to Newton’s Second Law, the NS equation of the fluid is:
{ d v x d t = f v x 1 ρ p x + v ( 2 v x x 2 + 2 v y y 2 + 2 v z z 2 ) d v y d t = f v y 1 ρ p y + v ( 2 v x x 2 + 2 v y y 2 + 2 v z z 2 ) d v z d t = f v z 1 ρ p z + v ( 2 v x x 2 + 2 v y y 2 + 2 v z z 2 )
where ρ is the fluid density, kg·m−3; v is the fluid velocity, m·s−1; p is the fluid pressure, Pa, f is the body force, N/mm3.
The whole flow field is in a turbulent state of high Reynolds number. The RNG kε numerical model is adopted. The RNG kε model provides an analytical equation for the turbulent Prandtl number by adding a new term to transport equation of turbulent kinetic energy dissipation rate.
The calculation equations of turbulent kinetic energy k and dissipation rate ε are as follows.
The transport equation of turbulent kinetic energy k is:
t ( ρ k ) + x i ( ρ k μ t ) = x j ( a k μ e f f k x j ) + G k + G b ρ ε Y M + S k
The transport equation of the dissipation rate ε is:
t ( ρ ε ) + x i ( ρ ε μ t ) = x j ( a ε μ e f f ε x j ) + C 1 ε ε k ( G k + C 3 ε G b ) C 2 ε ρ ε 2 k R ε + S ε
where μt is the turbulence viscosity coefficient, μt = ρCμk2/ε; for high Reynolds numbers, set to Cμ, Cμ = 0.0845; Gk is the generating term of turbulent kinetic energy k caused by the average velocity gradient; Gb is the generating term of turbulent kinetic energy k caused by buoyancy; YM is the influence of turbulent fluctuation expansion on total dissipation rate; the tables αk and αε are respectively the reciprocal of the effective turbulent Prandtl number of turbulent kinetic energy k and dissipation rate ε; the default value in numerical simulation software are C1ε = 1.42, C2ε = 1.68.
The formula for calculating the turbulence viscosity coefficient is:
d ( ρ 2 k ε μ ) = 1.72 v ˜ v ˜ 3 1 + C v d v ˜
where ῦ is the viscosity coefficient of molecular motion, ῦ = μeff, Cv ≈ 100. After integration, the simulation of low Reynolds number and near−wall flow can be solved, and the influence of effective Reynolds number on turbulent transport can be clarified.
The passive motion process of the impeller under the impact of liquid flow and its basic theory are summarized as follows: driven by high speed flow and incompressible fluid, the impeller rotates around the impeller shaft at high speed. According to the rotating motion analysis of the fluid machinery, the governing equation of impeller rotation is:
w = d ω d t = 2 π f
The calculation formula of the basic NS control equation of fluid in the flow field is:
ρ u t + ρ ( u ) u = ( ρ I + μ ( u + ( u ) T ) ) + F
ρ u = 0
where w is the speed of impeller, rad·s−1; ω is the arc length of the impeller, rad; f is the frequency of impeller rotation, Hz; ρ is the density of the fluid medium, kg·m−3; u is the velocity of fluid medium, m·s−1; ∇ represents the Hamiltonian operator; I is a diagonal matrix; μ is the dynamic viscosity of the fluid medium, Pa·s; F is the volume force acting on the impeller by the working medium, N;

3.3. Setting the Boundary Conditions

The flow field model of the multi−source pulse−jet generator is depicted in Figure 3. The structural model is meshed using ANSYS Workbench. To ensure the accuracy of the data and improve the calculation speed, the grid’s independence was verified before conducting further numerical analysis on the structural model. The results indicate that the simulation outcomes remain unchanged when the number of grid cells exceeds 4.8 × 10⁶. Additionally, the simulation grid size tends to converge, ensuring accurate results. Figure 3 illustrates the grid model, which consists of tetrahedral grid elements totaling 4.8 × 10⁶. The oscillation cavity and impeller’s moving parts are locally intensified to enhance their accuracy in the calculation domain.
The physical model’s boundary conditions are processed separately. The left side is designated as the velocity inlet boundary, with a diameter set at 50 mm. The right side is defined as the pressure outlet boundary, with a specified pressure of 0 MPa. The area near the impeller is designated as the rotational region to account for the impeller’s fluid impact−induced rotation. An interface is also established between the external flow passage’s boundary and the computational domain. The interface and rotational region are defined as the motion domain together. The time step is 0.001 s, and the fluid medium is water−liquid, its density is 1000 kg·m−3, and its viscosity is 1 mPa·s.
The impeller rotates under the impact of fluid. This process is a passive motion process in which the external force forms a torque on the impeller. This paper intends to use the SDOF macro of FLUENT software to edit UDF (User−Defined Functions) to realize the numerical simulation calculation of the impeller passive motion under the impact of fluid flow.

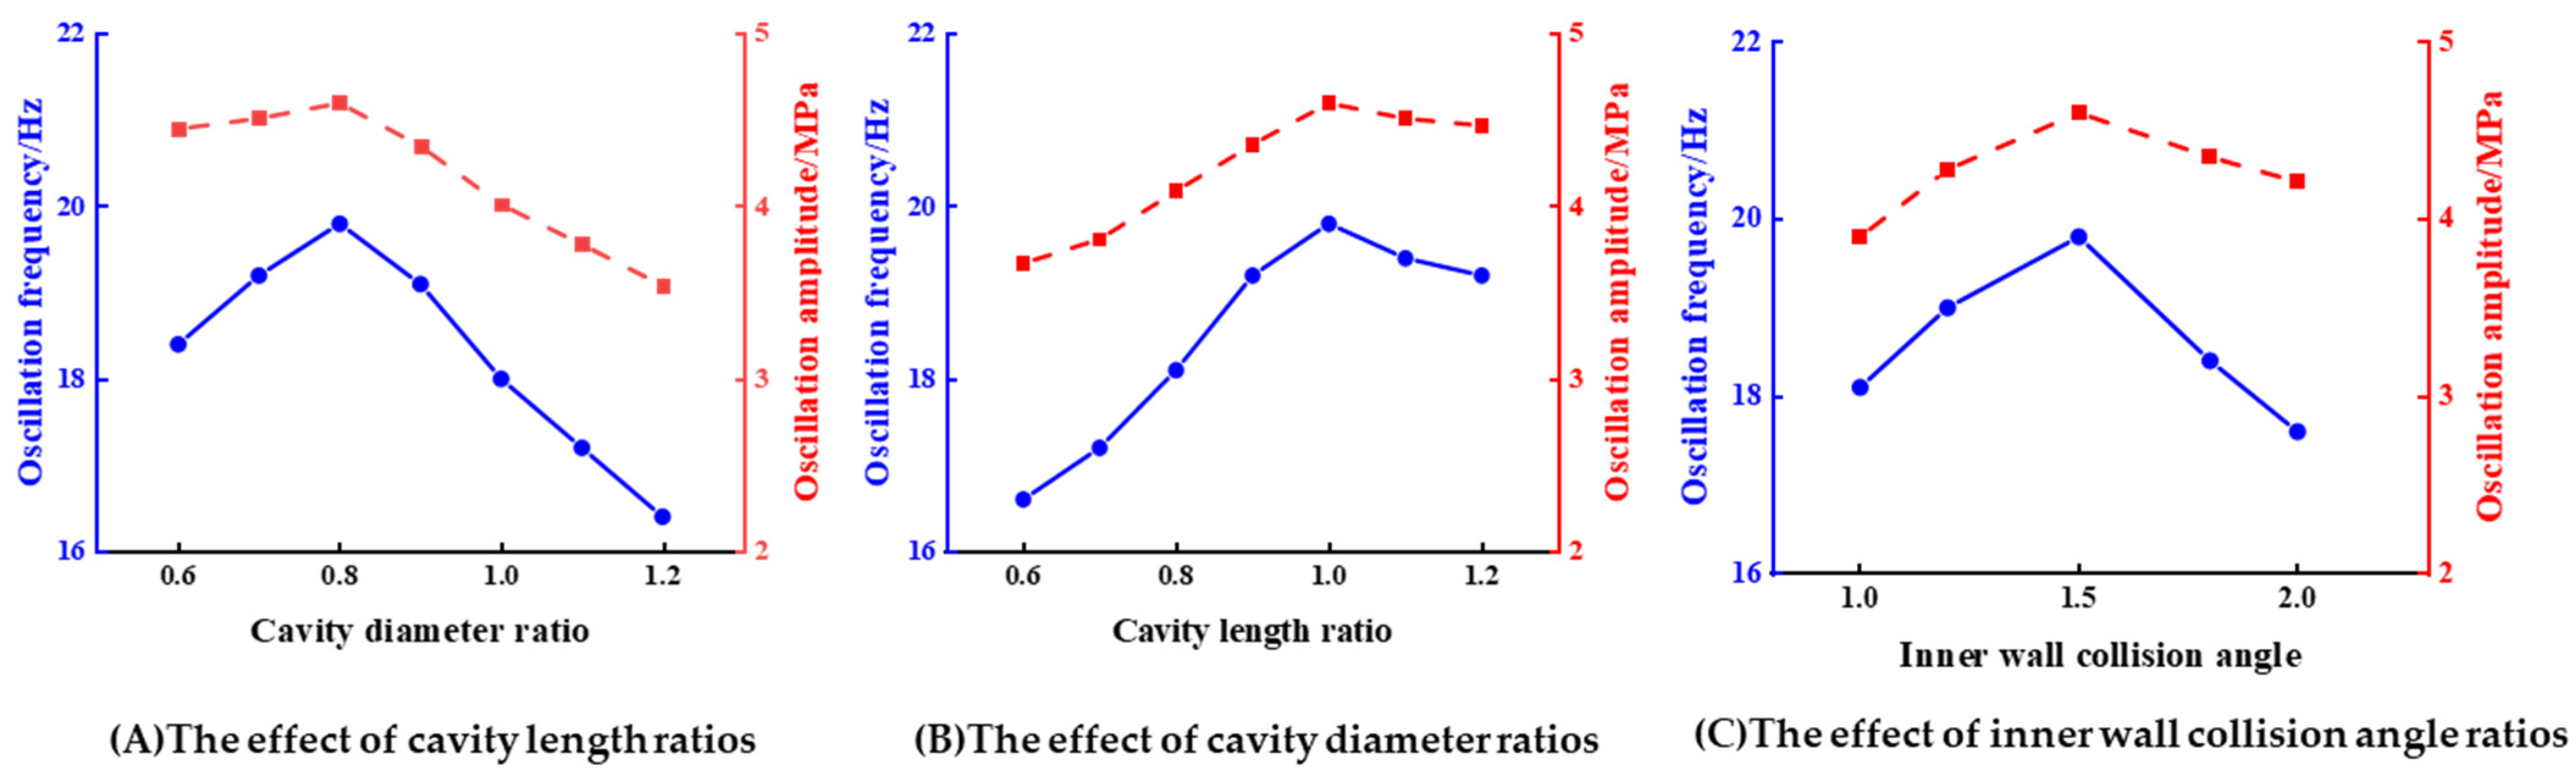
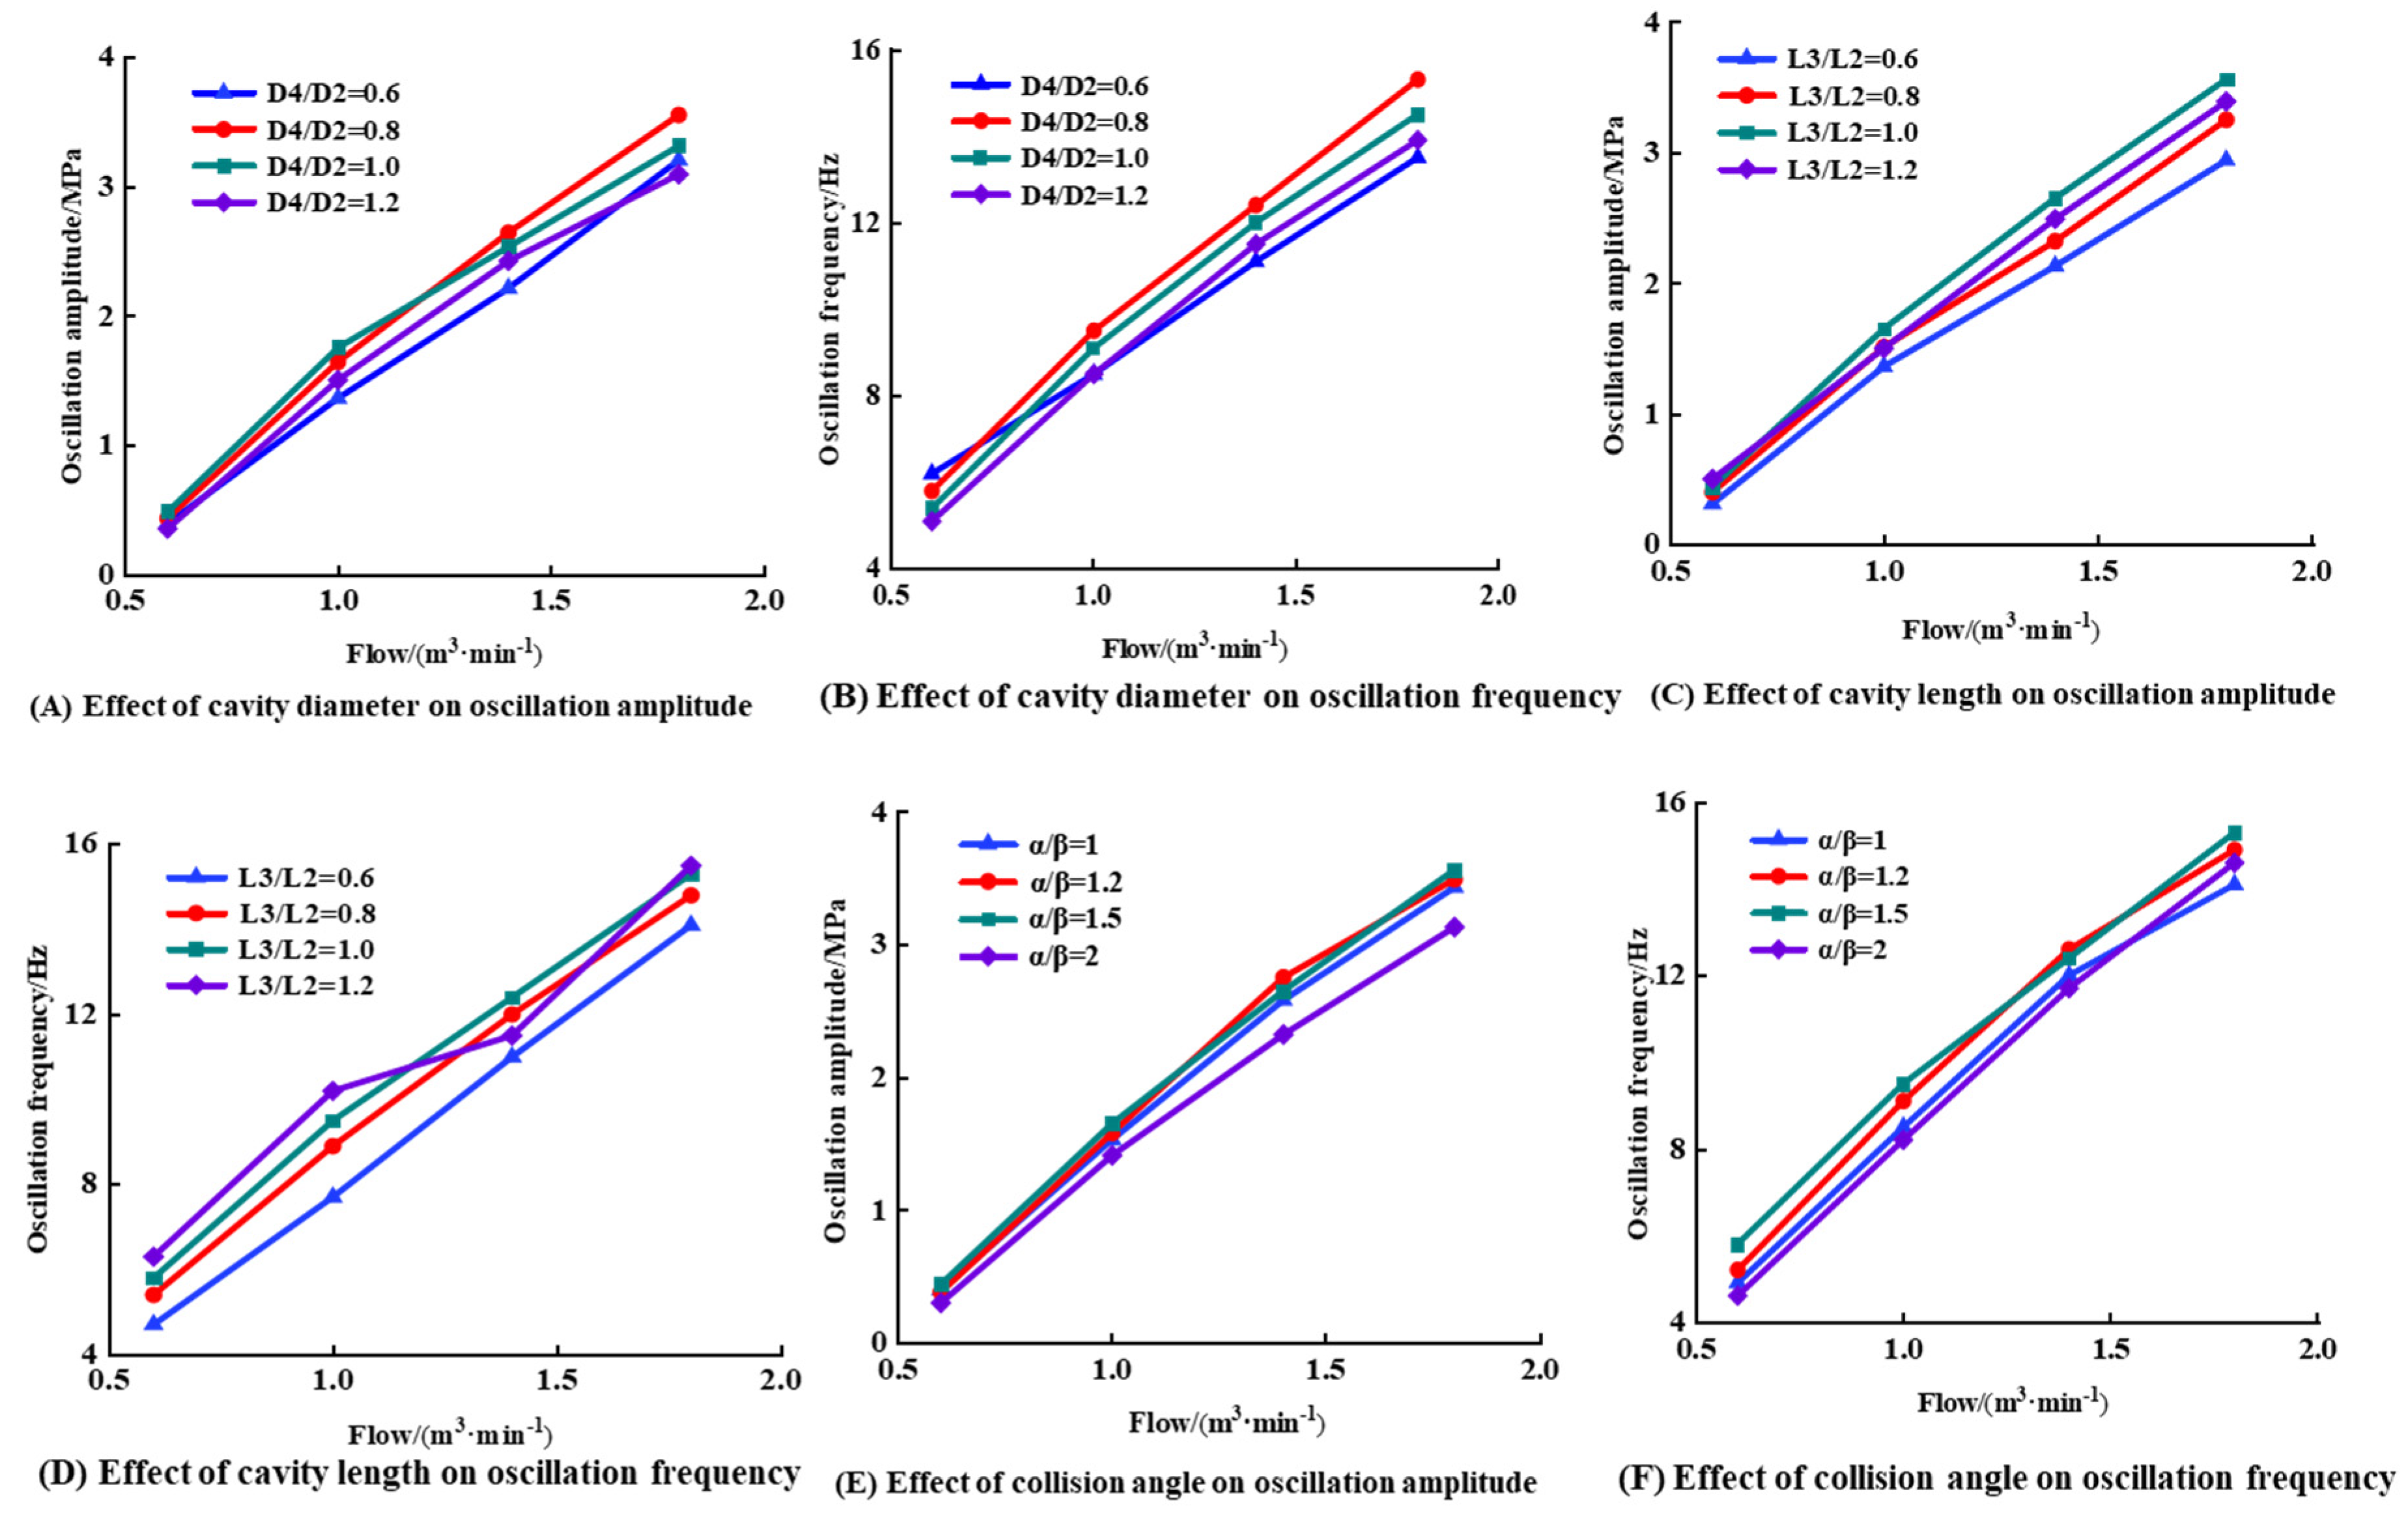
4. Analysis of the Numerical Simulation Results

Figure 4 displays the temporal variation of the internal velocity of the multi−source pulsed jet generator. At 0.002 s, the injected liquid at the inlet initiates the impeller’s rotation. Due to the initially low speed of the inertial impeller, fluid backflow does not occur in the primary and secondary oscillation cavity. As time progresses, the impeller speed gradually increases, causing the surrounding fluid to move through viscous interactions. The special structure of the oscillation cavity induces the rotational motion of the fluid in the primary and secondary oscillation cavities. The vortex ring gradually descends in both oscillation cavities, following a repeated cycle of nascent, collapse, and nascent phases. Consequently, the pulsating impact force exhibits a time−varying velocity effect.
During drilling, the high flow rate drilling fluid impinges on the impeller, causing it to rotate. The alternating flow intervals result in periodic pressure fluctuations of the initially continuous liquid flow. Figure 5 shows that Zone I corresponds to the upper runner area, Zone II corresponds to the shear and separation layer area, Zone III corresponds to the vortex ring area, and Zone IV corresponds to the lower runner area. Following the flow of the drilling fluid through the oscillation cavity, the transient vorticity converges and dissipates in the shear layer and cavity, inducing a periodic pressure fluctuation in the cavity that affects the vortex ring.
The discrete vortex ring generated in the shear layer impinges on the cavity wall at an angle after colliding with the inner wall. At this stage, the discrete vortex ring flows upstream along the shear layer area due to the reverse pressure disturbance, which causes another collision in the separation layer of the shear layer area and forms a new disturbance.
The instability of the shear layer area causes the disturbed vortex rings to converge and grow in the separation layer area. The two symmetric, large vortex rings will gradually detach from the shear layer area and repeatedly collide with the inner wall at an angle, eventually converging to form a larger vortex ring until dissipation. The generated vortex will continue to collide with the inner wall at an angle and simultaneously create a new wave of disturbance. Therefore, this process can be viewed as a periodic motor process of “vortex ring generation—collision—energy convergence—attenuation—dissipation—vortex ring generation”.
The structure of the oscillation cavity is the main factor that controls the energy of the vortex ring. As the jet along the central axis is constantly collided and squeezed by the symmetrical vortex ring on both sides of the axis, periodic pressure pulsation occurs in the cavity, resulting in a stronger pulse jet. The impeller is integrated with the primary and secondary oscillation cavities, and the impulse disturbance generated by the impeller acts as the excitation source, which is coupled with the self−excited oscillation generated by the oscillation cavity. This sliding friction effectively reduces the drilling resistance, which improves the drilling efficiency and reduces the drilling time. Moreover, the pulsating pressure can also enhance the flushing effect of the drilling fluid and remove the cuttings more efficiently. Overall, the multi−source pulsed jet generator can significantly improve the drilling efficiency and reduce the drilling cost. It can achieve breaking of both dynamic and static loads in rocks, thus preventing incidents of sticking and improving the rate of penetration (ROP)
Figure 6A demonstrates the impact of varying cavity length ratios (L3/L2) on oscillation frequency and amplitude. Specifically, when the cavity length ratio falls within the range of 0.6 to 1.2, both the frequency and amplitude of oscillation exhibit a linear increase, followed by a gradual decrease. When the cavity length (L3/L2) ratio equals 1, the oscillation frequency reaches its peak, as depicted in Figure 6A. In Figure 6B, it is shown that when the cavity diameter ratio (D4/D2) ranges from 0.6 to 0.8, both the frequency and amplitude of oscillation exhibit a linear upward trend. Conversely, when the cavity diameter ratio falls between 0.8 and 1.2, both the frequency and amplitude of oscillation show a downward trend. Figure 6C displays a trend in which oscillation frequency and amplitude increase initially and then decrease within the range of inner wall collision angle ratios between 1.0 and 2.0. The maximum values of both oscillation frequency and amplitude are reached when the inner wall collision angle ratio equals 1.5. Numerical simulation results indicate that an oscillation frequency of 20 Hz and an oscillation amplitude of 4.6 MPa can be generated when the cavity length ratio (L3/L2) is 1, the cavity diameter ratio (D4/D2) is 0.8, and the inner wall collision angle ratio is 1.5.

5. Test Verification

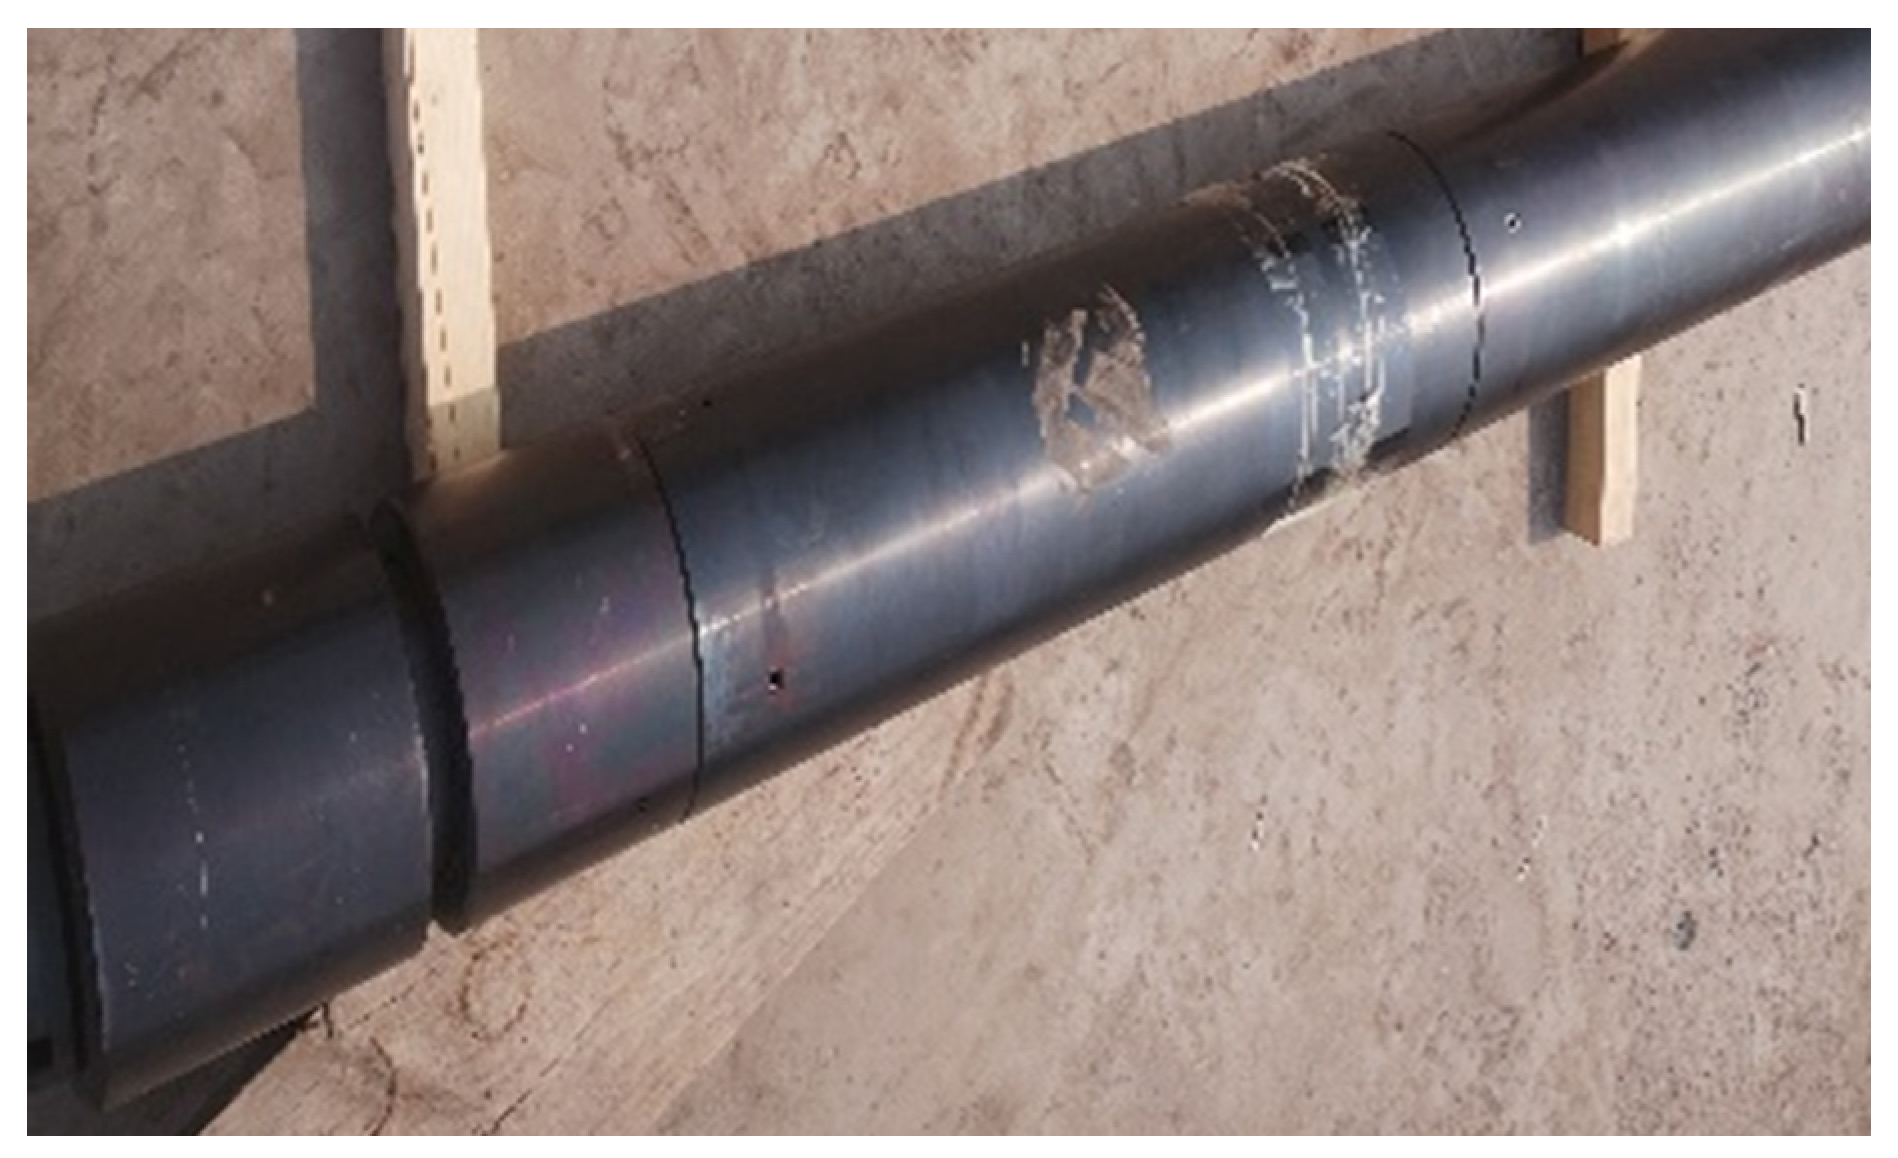
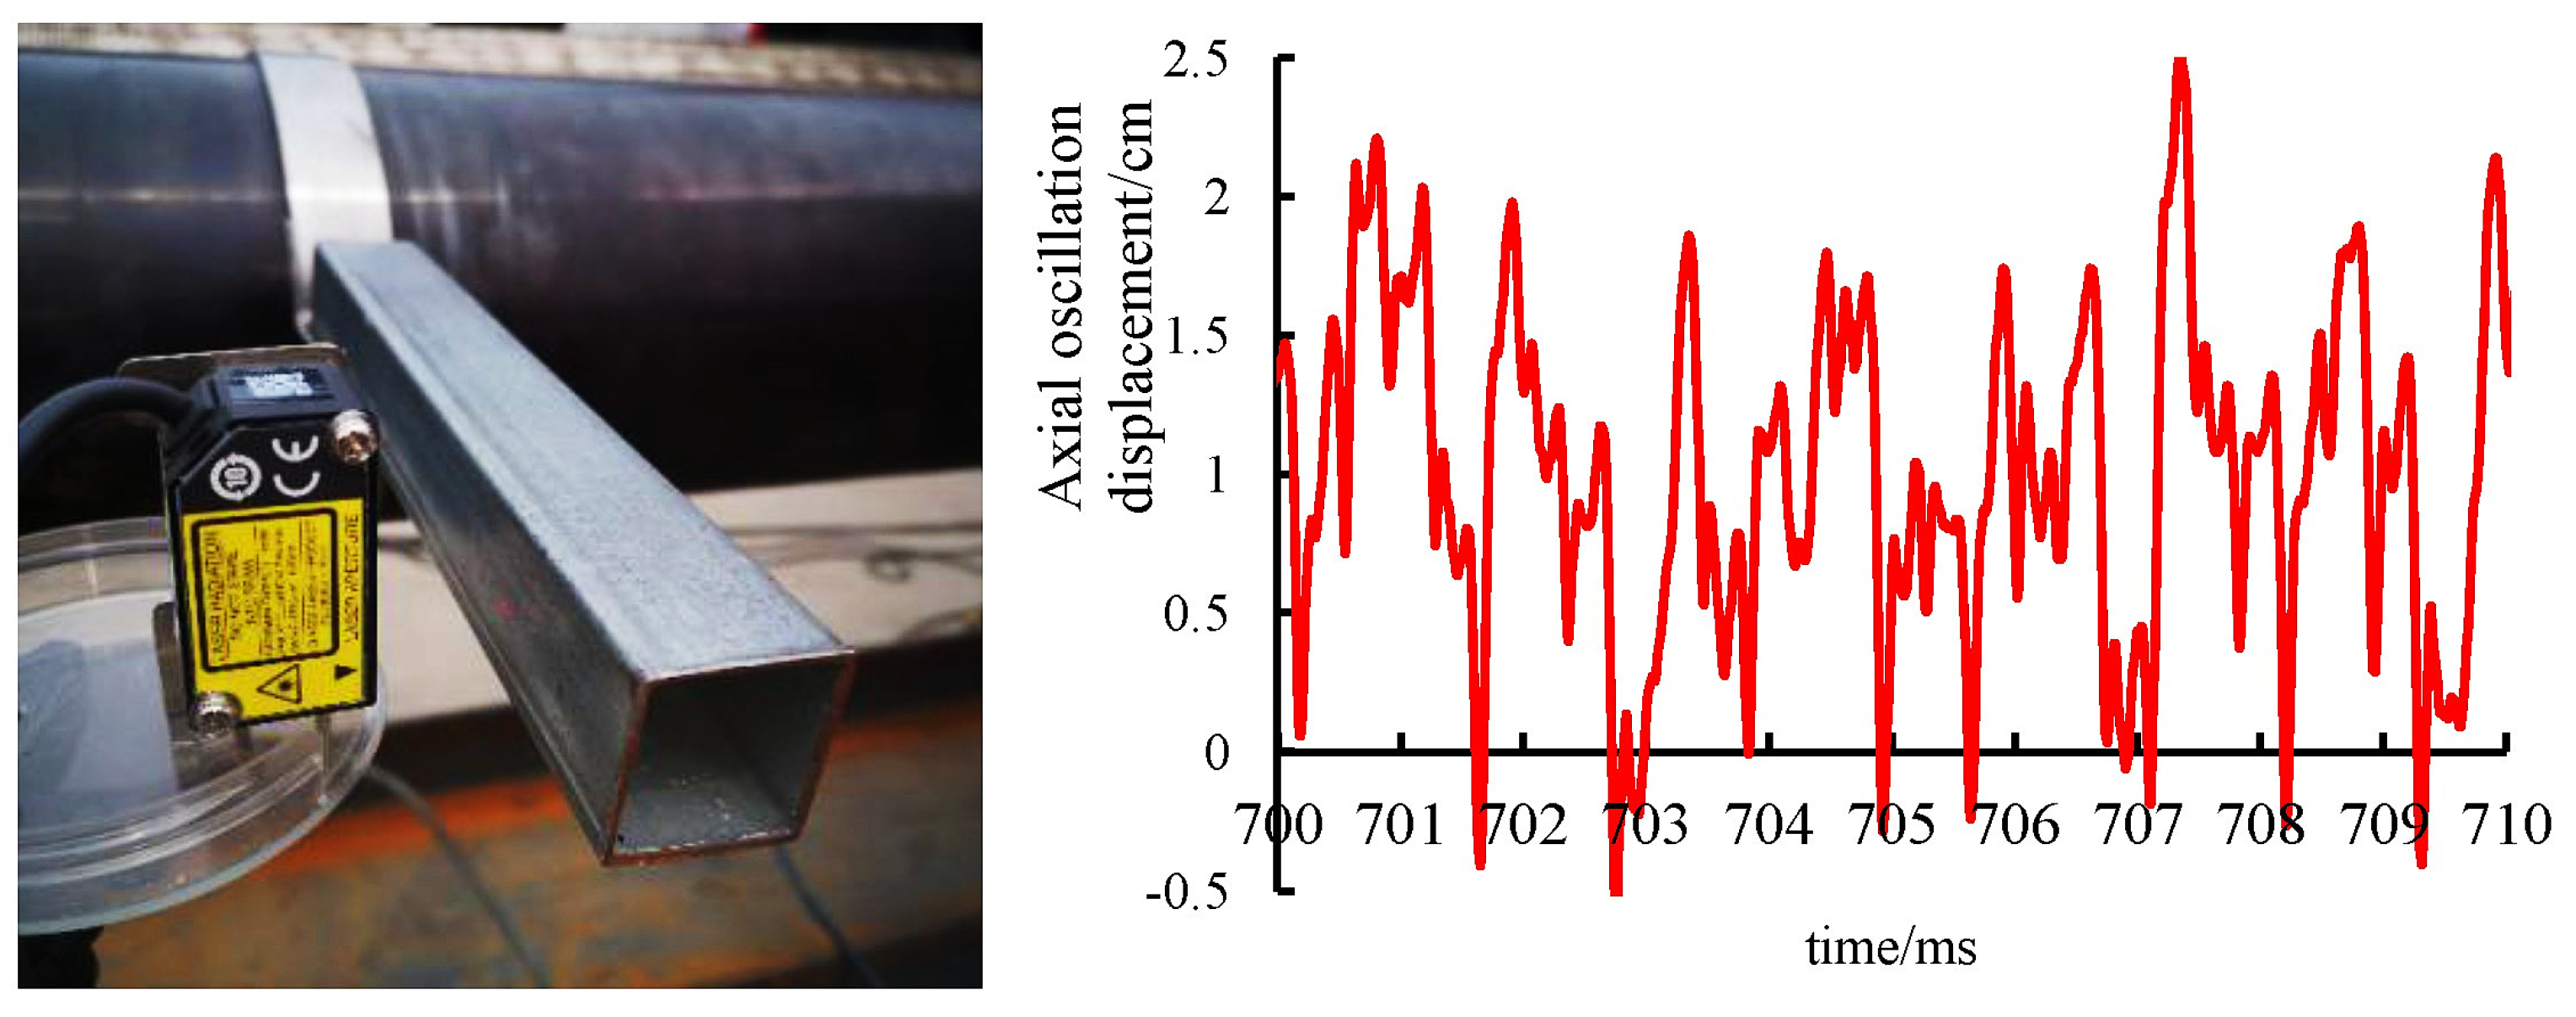
5.1. Ground Test of the Multi−Source Pulsed Jet Generator Output Characteristic

This study aims to analyze the influence of different operating and structural parameters of oscillating cavities on output pressure characteristics, in accordance with the similarity principle of fluid mechanics. As shown in Table 2, the pressure fluctuation curve is used to compare the relationship between output frequency and pulse amplitude with various dimensionless structural parameters, including cavity length ratios, cavity diameter ratios, and inner wall collision angle ratios.
The experimental setup includes a multi−source pulse jet generator test bench, a three−cylinder plunger pump, a high−pressure manifold, a reservoir, a laptop computer, a flow meter, pressure testing instruments, and a digital sensor hub. Figure 7 displays the test bench for the multi−source pulse jet generator.
In Figure 8A, the relationship between cavity diameter and oscillation amplitude is presented. As the flow rate increases, the amplitude of oscillation gradually increases. At low flow rates, the variation of cavity diameter ratios (D4/D2) has little effect on the oscillation amplitude. However, at a flow rate of 0.6 m3·min−1, the amplitude of oscillation fluctuates around 0.7 MPa. At flow rates between 1 and 1.8 m3·min−1, the influence of cavity diameter ratios (D4/D2) on oscillation amplitude gradually increases with the flow rate. Moreover, the influence of cavity diameter ratios on oscillation amplitude initially increases and then decreases. At a cavity diameter ratio (D4/D2) of 0.8, the oscillation amplitude is consistently high. Additionally, when the flow rate is higher than 1.4 m3·min−1, the oscillation amplitude is approximately 0.25–0.35 Mpa greater than the other three groups.
Figure 8B demonstrates that, as the flow rate increases, the oscillation frequency generated by different cavity diameter ratios (D4/D2) exhibits an upward trend. This trend is most prominent when the cavity diameter ratio is 0.8, as the oscillation frequency increases more significantly in this case. As the flow rate increases, the fluid speed of the impingement impeller rotation becomes enhanced, resulting in an accelerated rate of change of flow passage clearance. This, in turn, improves the impact frequency of the collision angle between the vortex ring and the inner wall, leading to an increase in fluid oscillation frequency. When the displacement reaches 1.8 m3·min−1, the oscillation frequency is about 15 Hz.
In Figure 8C, the relationship between cavity length and oscillation amplitude is presented. As the flow rate increases, the amplitude of oscillation gradually increases. When the flow is 0.6 m3·min−1, the influence of different cavity length ratios (L3/L2) on the oscillation amplitude is not significant. However, at flow rates between 1.0 and 1.8 m3·min−1, an interesting phenomenon occurs where the oscillation amplitude initially increases and then decreases as the cavity length ratio (L3/L2) increases. Within a certain range of cavity length ratios (L3/L2), the acceleration time of the vortex ring flow is prolonged, resulting in a greater amount of energy obtained upon impact with the inner wall collision angle. This, in turn, enhances the oscillation amplitude.
Figure 8D illustrates the impact of cavity length on the oscillation frequency. The influence of cavity length ratios (L3/L2) on frequency is readily apparent. Specifically, when the flow rate is less than 1.0 m3·min−1, smaller cavity length ratios (L3/L2) result in higher oscillation frequencies. When the flow rate falls between 1.0 and 1.8 m3·min−1, the impact of oscillation frequency increases initially and then decreases with the concurrent increase in flow rate and cavity length ratios (L3/L2). Specifically, an increase in flow rate results in a gradual acceleration of fluid velocity within the cavity. An increase in flow rate causes a gradual acceleration of fluid velocity within the cavity. While an increase in cavity length prolongs the time for the vortex ring to reach the inner wall collision angle, it also shortens the time for the nascent vortex ring to collapse, thereby reducing the difference in oscillation frequency.
Figure 8E demonstrates that an increase in flow results in an amplification of oscillation amplitude. At low flow rates, the collision angle ratios (α/β) of the inner wall have a negligible impact on oscillation amplitude. At a flow rate of 0.6 m3·min−1, the oscillation amplitude stabilizes at approximately 0.5 Mpa. For flow rates less than 1.0 m3·min−1, the oscillation amplitude remains consistent regardless of the inner wall collision angle ratios (α/β) being 1.2 or 1.5. However, at a flow rate of 1.8 m3·min−1 and an inner wall collision angle ratio of 1.5, an oscillation amplitude of approximately 3.5 Mpa is produced.
Figure 8F illustrates the impact of collision angle on oscillation frequency, with the inner wall collision angle ratios exhibiting a significant influence. As the flow rate increases, the oscillation frequency demonstrates a consistent upward trend. At a constant flow rate, the effect of inner wall collision angle ratios on oscillation frequency initially increases and then decreases. Within the range of test conditions, an inner wall collision angle ratio of 1.5 generates the maximum oscillation frequency at a flow rate of 1.8 m3·min−1.

5.2. Prototype Test of the Multi−Source Impact Oscillation Speed−Increasing Tool

The multi−source impact oscillation speed−increasing tool prototype has been manufactured with a cavity diameter ratio of 0.8, cavity length ratio of 1.0, and inner wall collision angle ratio of 1.5, as depicted in Figure 9. The vibration characteristics, impact load, oscillation frequency, and pressure loss have been evaluated through ground testing.
The ground test system for the multi−source impact oscillation speed−increasing tool prototype has been established as depicted in Figure 10A,B. Pressure sensors have been installed at the front, middle, and end of the tool string to record fluid pressure fluctuation characteristics. Additionally, an engineering parameter measurement sub has been installed at the front end to record impact load oscillation characteristics.
The Impact load oscillation, oscillation amplitude, oscillation frequency, and pressure loss have been recorded at flow rates of 0.6, 1.0, 1.4, and 1.8 m3·min−1, as the flow is increased from 0.6 to 1.8 m3·min−1.
The axial oscillation displacement is measured simultaneously using a laser displacement sensor, as depicted in Figure 11. Given that the tested tool prototype produces axial displacement during operation, a clamp with metal parts on the side has been installed and fastened onto the tool. This allows the laser point of the laser displacement sensor to be positioned on the metal parts, enabling for more accurate recording of changes in vibration displacement.
As depicted in Figure 12, the amplitude, frequency, pressure loss, and axial displacement of the oscillations generated by the tool all increase within the range of 0.6 to 1.8 m3·min−1. The multi−source impact oscillation speed−raising tool has been measured to have an adjustable oscillation frequency range of 5−15 Hz, capable of generating a maximum oscillation amplitude of 3.2 MPa and an oscillation impact load of 36 kN, along with a maximum axial oscillation displacement of 13.5 mm. It has been observed that the pressure loss generated by an increase of 0.4 m3·min−1 of the flow has an average difference of only about 0.35 MPa. This indicates that the ground test results confirm that the design objective has been met, and the tool can generate a high impact oscillation effect that meets the field requirements under real drilling working conditions.

6. Conclusions

1. Based on the fluid dynamics simulation and analysis software, we establish a physical model of unsteady flow in the multi−source pulse jet generator. This allows us to simulate the impeller’s passive rotation under the action of fluid impact.
2. The frequency and amplitude of oscillations increase as the flow rate increases. In order to stabilize the oscillation frequency of the multi−source pulse−jet generator, it is necessary to ensure a high oscillation amplitude. The multi−source impact oscillation speed−increasing tool can generate oscillations with low frequency and high amplitude characteristics, which concentrate the energy and enhance the impact of each individual oscillation. This paper presents a novel solution to address the low drilling rate resulting from high supporting pressure and substantial friction encountered in extended reach horizontal wells.
3. The size of the multi−source pulsed jet generator significantly impacts the characteristics of the oscillations and impact produced by the multi−source impact oscillation speed−increasing tool. During testing and research, it was observed that at a cavity diameter ratio of 0.8, a cavity length ratio of 1.0, and an inner wall collision angle ratio of 1.5, the oscillation amplitude and frequency were approximately 3.6 MPa and 15.3 Hz, respectively. An axial oscillation displacement of 13.5 mm has been achieved, satisfying the technical requirements for practical applications.

Author Contributions

Methodology, W.N. and H.L.; conceptualization, W.N., H.L. and J.N.; software, J.W. and H.W.; validation, J.N. and Y.S.; formal analysis, W.N.; investigation, W.N. and H.L.; data curation, W.N. and H.W.; writing—original draft, W.N.; writing—review and editing, H.L., J.L. and Y.S.; Funding acquisition, H.L. All authors have read and agreed to the published version of the manuscript.

Funding

This research was funded by the National Key Research and Development Program of China (2021YFE0111400), the National Key Research and Development Program of China, (2019YFA0708300), and the major project of CNPC (No. ZD2019−183−005).

Conflicts of Interest

All authors declare no conflict of interest.

References

  1. Su, Y. Introduction to the theory and technology on downhole control engineering and its research progress. Pet. Explor. Dev. 2018, 45, 754–763. [Google Scholar] [CrossRef]
  2. Gao, D. A high−efficiency development mode of shale gas reservoirs in mountainous areas based on large cluster horizontal well engineering. Nat. Gas Ind. B 2019, 6, 122–128. [Google Scholar] [CrossRef]
  3. Wang, H.; Liao, H.; Wei, J.; Liu, Y.; Niu, W.; Latham, J.-P.; Xiang, J.; Liu, J.; Chen, J. Pressure Drop Model and Jet Features of Ultra High Pressure Water Jet for Downhole Intensifier. J. Energy Resour. Technol. 2022, 144, 123005. [Google Scholar] [CrossRef]
  4. Kuanliang, Z.; Jinghai, F.; Fei, H.; Nan, L. Pilot test of horizontal drilling and completion techniques in Nanpu Oilfield. Pet. Explor. Dev. 2009, 36, 658–663. [Google Scholar] [CrossRef]
  5. Guo, B.; Li, J.; Feng, Y. How Much Can You Extend the Reach of Coiled Tubing in Horizontal Wells Using Pressure−Hammer/Pulsing Tools. In Proceedings of the Society of Petroleum Engineers—SPE USA Unconventional Resources Conference, The Woodlands, TX, USA, 10–12 April 2013. [Google Scholar]
  6. Wang, H.-J.; Liao, H.-L.; Wei, J.; Liu, J.-S.; Niu, W.-L.; Liu, Y.-W.; Guan, Z.-C.; Sellami, H.; Latham, J.-P. Stress release mechanism of deep bottom hole rock by ultra−high−pressure water jet slotting. Pet. Sci. 2023, 1995–8226. [Google Scholar] [CrossRef]
  7. Sauki, A.; Khamaruddin, P.N.F.M.; Irawan, S.; Kinif, I.; Ridha, S.; Ali, S.A.; Ali, M.A. Development of a modified Bourgoyne and Young model for predicting drilling rate. J. Pet. Sci. Eng. 2021, 205, 108994. [Google Scholar] [CrossRef]
  8. Schunnesson, H. Rock characterisation using percussive drilling. Int. J. Rock Mech. Min. Sci. 1998, 35, 711–725. [Google Scholar] [CrossRef]
  9. Ghasemloonia, A.; Rideout, D.G.; Butt, S.D. A review of drillstring vib Fluid hammer analysis with unsteady flow friction model in coiled tubing drilling ration modeling and suppression methods. J. Pet. Sci. Eng. 2015, 131, 150–164. [Google Scholar] [CrossRef]
  10. Sarker, M.; Rideout, D.G.; Butt, S.D. Dynamic model for longitudinal and torsional motions of a horizontal oilwell drillstring with wellbore stick−slip friction. J. Pet. Sci. Eng. 2016, 150, 272–287. [Google Scholar] [CrossRef]
  11. Sarker, M.; Rideout, D.G.; Butt, S.D. Dynamic model for 3D motions of a horizontal oilwell BHA with wellbore stick−slip whirl interaction. J. Pet. Sci. Eng. 2017, 157, 482–506. [Google Scholar] [CrossRef]
  12. Li, S.; Vaziri, V.; Kapitaniak, M.; Millett, J.M.; Wiercigroch, M. Application of Resonance Enhanced Drilling to coring. J. Pet. Sci. Eng. 2020, 188, 106866. [Google Scholar] [CrossRef]
  13. Zhang, W.; Shi, H.; Li, G.; Song, X.; Zhao, H. Mechanism analysis of friction reduction in coiled tubing drilling with axial vibratory tool. J. Pet. Sci. Eng. 2019, 175, 324–337. [Google Scholar] [CrossRef]
  14. Li, Z.; Zhang, C.; Song, G. Research advances and debates on tubular mechanics in oil and gas wells. J. Pet. Sci. Eng. 2017, 151, 194–212. [Google Scholar] [CrossRef]
  15. Wang, P.; Ni, H.; Wang, R.; Li, Z. Modulating downhole cuttings via a pulsed jet for efficient drilling−tool development and field testing. J. Nat. Gas Sci. Eng. 2015, 27, 1287–1295. [Google Scholar] [CrossRef]
  16. Wang, P.; Ni, H.; Wang, R. A novel vibration drilling tool used for reducing friction and improve the penetration rate of petroleum drilling. J. Pet. Sci. Eng. 2018, 165, 436–443. [Google Scholar] [CrossRef]
  17. Peng, J.; Ge, D.; Zhang, X.; Wang, M.; Wu, D. Fluidic DTH hammer with backward−impact−damping design for hard rock drilling. J. Pet. Sci. Eng. 2018, 171, 1077–1083. [Google Scholar] [CrossRef]
  18. Shi, X.; Huang, W.; Gao, D.; Zhu, N. Optimal design of drag reduction oscillators by considering drillstring fatigue and hydraulic loss in sliding drilling. J. Pet. Sci. Eng. 2022, 208, 109572. [Google Scholar] [CrossRef]
  19. Mu, Z.; Li, G.; Sun, Z.; Huang, Z.; Song, H. Mechanism research and field test of a novel axial vibratory tool for friction reduction in long horizontal wells. J. Pet. Sci. Eng. 2022, 208, 109534. [Google Scholar] [CrossRef]
  20. Mu, Z.; Huang, Z.; Sun, Z.; Wu, X.; Li, G.; Song, X. Experimental study on dynamic characteristics of axial−torsional coupled percussive drilling. J. Pet. Sci. Eng. 2022, 219, 111094. [Google Scholar] [CrossRef]
  21. Říha, Z.; Zeleňák, M.; Kruml, T.; Poloprudský, J. Comparison of the disintegration abilities of modulated and continuous water jets. Wear 2021, 478–489, 203891. [Google Scholar] [CrossRef]
  22. Song, H.; Shi, H.; Li, G.; Chen, Z.; Li, X. Numerical simulation of the energy transfer efficiency and rock damage in axial−torsional coupled percussive drilling. J. Pet. Sci. Eng. 2021, 196, 107675. [Google Scholar] [CrossRef]
  23. Zhang, W.; Shi, H.; Li, G.; Song, X. Fluid hammer analysis with unsteady flow friction model in coiled tubing drilling. J. Pet. Sci. Eng. 2018, 167, 168–179. [Google Scholar] [CrossRef]
  24. Shi, X.-L.; Huang, W.-J.; Gao, D.-L. Mechanical behavior of drillstring with drag reduction oscillators and its effects on sliding drilling limits. Pet. Sci. 2021, 18, 1689–1697. [Google Scholar] [CrossRef]
  25. Shi, H.; Li, G.; Guo, B.; He, Z. Hydraulic pulse jet: Test of characteristics and field applications in ultra−deep wells. J. Nat. Gas Sci. Eng. 2015, 27, 200–206. [Google Scholar] [CrossRef]
  26. Li, H.; Liu, S.; Zhou, F.; Jiang, H.; Wang, F.; Guo, C. Experimental investigation on concrete rock breaking performance of self−excited oscillation pulsed waterjet. Eng. Fract. Mech. 2022, 268, 108502. [Google Scholar] [CrossRef]
  27. Zhang, S.; Fu, B.; Sun, L. Investigation of the Jet Characteristics and Pulse Mechanism of Self−Excited Oscillating Pulsed Jet Nozzle. Processes 2021, 9, 1423. [Google Scholar] [CrossRef]
  28. Geveci, M.; Oshkai, P.; Rockwell, D.; Lin, J.-C.; Pollack, M. Imaging of the self−excited oscillation of flow past a cavity during generation of a flow tone. J. Fluids Struct. 2003, 18, 665–694. [Google Scholar] [CrossRef] [Green Version]
  29. Shi, D.; Xing, Y.; Wang, L.; Chen, Z. Numerical Simulation and Experimental Research of Cavitation Jets in Dual−Chamber Self−Excited Oscillating Pulsed Nozzles. Shock. Vib. 2022, 2022, 1268288. [Google Scholar] [CrossRef]
  30. Guan, Z.; Zhang, H.; Zhang, W.; Liu, Y.; Liang, D. Equipment and technique for improving penetration rate by the transformation of drill string vibration to hydraulic pulsating jet. Pet. Explor. Dev. 2014, 41, 678–683. [Google Scholar] [CrossRef]
  31. Yang, Y.; Liao, H.; Xu, Y.; Niu, J.; Yang, L. Theoretical investigation of the energy transfer efficiency under percussive drilling loads. Arab. J. Geoences 2019, 12, 175. [Google Scholar] [CrossRef]
  32. Yang, Y.; Liao, H.; Niu, J.; Wang, Z.; Chen, J. Three−dimensional simulation of rock breaking efficiency under various impact drilling loads. Arab. J. Geosci. 2020, 13, 444. [Google Scholar] [CrossRef]
  33. Yang, Y.; Liao, H.; Xu, Y.; Yang, S.; Niu, J. Coupled fluid−structure simulation of a vibration−assisted rotary percussion drilling tool. Energy Sources 2019, 41, 1725–1738. [Google Scholar] [CrossRef]
Figure 1. Structure diagram of the multi−source impact oscillation speed−increasing tool. 1—upper joint; 2—transmission housing; 3—outer housing; 4—adjusting gear; 5—spring; 6—impact piston; 7—sealing ring; 8—ring joint gaskets; 9—guide pedestal; 10—impeller assembly; 11—primary oscillation cavity; 12—secondary oscillation cavity; 13—lower joint.
Processes 11 00900 g001
Figure 2. The geometric model of the runner structure.
Processes 11 00900 g002
Figure 3. Structural model of the multi−source pulse−jet generator.
Processes 11 00900 g003
Figure 4. The watershed map of the velocity varies with time.
Processes 11 00900 g004
Figure 5. Watershed distribution of the primary and secondary oscillating cavities.
Processes 11 00900 g005
Figure 6. Influence of dimensionless structural parameters on the oscillation characteristics. (A) Influence of the cavity length ratios on oscillation characteristics. (B) Influence of cavity diameter ratios on oscillation characteristics. (C) Influence of inner wall collision angle ratios on oscillation characteristics.
Processes 11 00900 g006
Figure 7. The test bench of multi−source pulse jet generator. 1—pipeline joint; 2—bolt; 3—base of pressure testing apparatus; 4—sleeve sub; 5—lock washer; 6—runner base; 7—pads; 8—impeller base; 9—primary oscillation cavity; 10—clamp holder; 11—secondary oscillation cavity; 12—backing ring; 13—impeller; 14—support base; 15—joist steel.
Processes 11 00900 g007
Figure 8. Effect of the structure on oscillation amplitude and oscillation frequency.
Processes 11 00900 g008
Figure 9. The prototype of the multi−source impact oscillation speed−increasing tool.
Processes 11 00900 g009
Figure 10. The system of the ground test.
Processes 11 00900 g010
Figure 11. Position of the laser displacement sensor and curve of the impact displacement.
Processes 11 00900 g011
Figure 12. Influence of the flow on output characteristics with the multi−source impact oscillation speed−increasing tool.
Processes 11 00900 g012
Table 1. The parameters of the dimensionless structural.
Exit Diameter/mmGroup AGroup BGroup C
L3/L2D4/D2α/β
0.60.811.20.60.811.211.21.52
18A1A2A3A4B1B2B3B4C1C2C3C4
Table 2. The test parameters of the multi−source pulsed jet generator.
Serial NumberRate of Flow/(m3·min−1)Cavity Diameter Ratios (D4/D2)Cavity Length Ratios (L3/L2)Inner Wall Collision Angle Ratios (α/β)
10.6
1.0
1.4
1.8
0.80.6, 0.8, 1.0, 1.21.5
20.6, 0.8, 1.0, 1.21.01.0, 1.2, 1.5, 2.0
30.81.01.5
Disclaimer/Publisher’s Note: The statements, opinions and data contained in all publications are solely those of the individual author(s) and contributor(s) and not of MDPI and/or the editor(s). MDPI and/or the editor(s) disclaim responsibility for any injury to people or property resulting from any ideas, methods, instructions or products referred to in the content.

