Article

Investigating the Mechanism of Continuous–Discrete Coupled Destabilization of Roadway-Surrounding Rocks in Weakly Cemented Strata under Varying Levels of Moisture Content

1
School of Mining and Geomatics Engineering, Hebei University of Engineering, Handan 056038, China
2
Collaborative Innovation Center of the Comprehensive Development and Utilization of Coal Resource, Handan 056038, China
3
Chiyu Coal Mine of Shanxi Jindi Coal Coke Co., Ltd., Lüliang 032100, China
*
Author to whom correspondence should be addressed.
Processes 2023, 11(9), 2556; https://doi.org/10.3390/pr11092556
Submission received: 31 July 2023 / Revised: 18 August 2023 / Accepted: 22 August 2023 / Published: 26 August 2023
(This article belongs to the Special Issue Advanced Technologies of Deep Mining)

Abstract

:
This study examines frequent disasters, including large-scale deformation and collapse, caused by underground mining in weakly cemented strata in Western China. The weakly cemented rock’s unique characteristics, including low strength and easy disintegration, demonstrate a different damage pattern than that traditionally seen in the central and eastern regions. Using Fast Lagrangian Analysis of Continua-Particle Flow Code (FLAC2D-PFC2D) coupling, we model the strata, focusing on the 3-1 coal seam roadway at Hongqinghe mine. This study investigates the damage–rupture–destabilization progression in the peripheral rock under varying levels of moisture content. Our findings indicate that a water content of ω = 5.5% is the threshold for roadway damage, and moisture content <5.5% yields minimal rock deformation. However, moisture content >5.5% abruptly increases cracks and shifts the rock’s force chain, causing significant deformation and affecting the ceiling the most. Moreover, higher levels of moisture content weaken the anchor solid’s performance, with two primary failure modes: anchor interface slippage (comprising five stages: elasticity, elasticity–shear hardening, elasticity–shear hardening–decohesion, shear hardening–decohesion, and decohesion) and shear damage. These insights are vital for improving numerical simulations of underground mining, obtaining a more accurate understanding of mineral pressure disasters in weakly cemented strata mining regions in Western China, and developing a solid foundation for the better control of such strata.

1. Introduction

The western mining region has emerged as a crucial energy supply base in China. Owing to its unique rock-forming environments, this region is characterized by low strength, poor cementation, and susceptibility to disintegration upon water contact, and its strata are characterized by poor strength and several pores in the rock particles and cement (the rock is called “weakly cemented rock”), which differ significantly from the roadways in the central and eastern regions. The impact of water on the surrounding rocks of these roadways significantly weakens their mechanical properties, including their strength and cementation. Coupled with the pressures from original rock stress and mining stress, these rocks undergo substantial deformation, frequently resulting in supporting-structure failure. This highlights the urgent need to investigate the destabilization mechanism of tunnel-surrounding rocks under the combined effect of force and water to establish the groundwork for their effective control.
Wen et al. [1] and Teng et al. [2] examined the changes in the mechanical properties and acoustic emission characteristics of sandstones with varying moisture content under uniaxial compression. Meng et al. [3] conducted uniaxial and triaxial compression tests to analyze the damage forms of rock samples with varying levels of moisture content, concluding that the moisture content significantly impacts the damage forms of weakly cemented rock bodies. Zhang [4] simulated the moisture content’s weakening effect on the mudstone and anchorage interface stability and studied shear stress changes at these interfaces. Xu [5] conducted a comparative analysis of the stress field, displacement field, and plastic zone distribution in water-rich tunnels by using the creep damage ontological model. Zhao et al. [6] researched the stability of the surrounding rock in weakly cemented soft-rock roadways under high humidity and found that with increased humidity, tangential stress on the critical surface increased, intensifying the rock damage. Moreover, after exceeding the critical humidity, the surrounding rock exhibited plastic–elastic–plastic behavior. Lu et al. [7] studied the damage law of the perimeter rock in roadways with drenched roofs. Their findings indicated that water exposure weakened the physical and mechanical properties of the coal rock body, causing an increased plastic zone and displacement of the perimeter rock. Wang et al. [8] noted the poor cementation and reduced strength of the perimeter rock in weakly cemented, water-rich roadways, asserting that the water-bearing roof plate is a significant factor in the deformation and damage of the perimeter rock. Fang et al. [9] investigated the nonstable creep and significant deformation issues in water-bearing sandstone roadways. Their study analyzed the dynamic response of perimeter rock softening and the microscale mechanisms underlying deformation and destabilization.
In summary, the mechanical properties and stability of soft rock, sandstone, and other rocks and roadway-surrounding rock under different levels of water content have been analyzed through numerical simulations and theoretical analyses. However, due to the unique properties of weakly cemented rock, it is different from the fracture law of coal and rock mass in the central and eastern regions. The traditional fracture law of coal and rock mass no longer applies to weakly cemented rocks.
For the numerical simulation of roadways, predecessors mostly used FLAC software [10]. The software mainly studies macroscopic continuous changes such as deformation, stress, and plastic zones. However, the microscopic cementation performance of the weakly cemented rock plays a controlling role in its macroscopic performance [11,12]. Under variable levels of water content, the internal cementation of weakly cemented rock will weaken and collapse. The finite element research can no longer meet the research content, and the internal microscopic discrete element variation law has become the focus of our research. Thus, understanding the rupture and destabilization mechanism of weakly cemented strata under varying levels of moisture content requires considering the macroscopic deformation, microscale force chain network evolution, and collaborative evolution of the interparticle force chain rupture and structural and mechanical properties of the load-bearing body.
Considering the operational efficiency issues, this study uses a combined approach of finite difference and discrete element methods for coupled simulations and analyses. We employ PFC2D to simulate the damage area around the roadway, and other parts are simulated by using the FLAC2D continuous unit. This approach establishes a FLAC2D-PFC2D continuous–discrete coupled model, enabling the analysis of the deformation and damage law of the surrounding rock under varying levels of moisture content in the roadway roof plate. This study aims to investigate the destabilization mode of the roadway and provide a foundation for managing the surrounding rock of weakly cemented roadways.

2. Continuous–Discrete Coupling Modeling

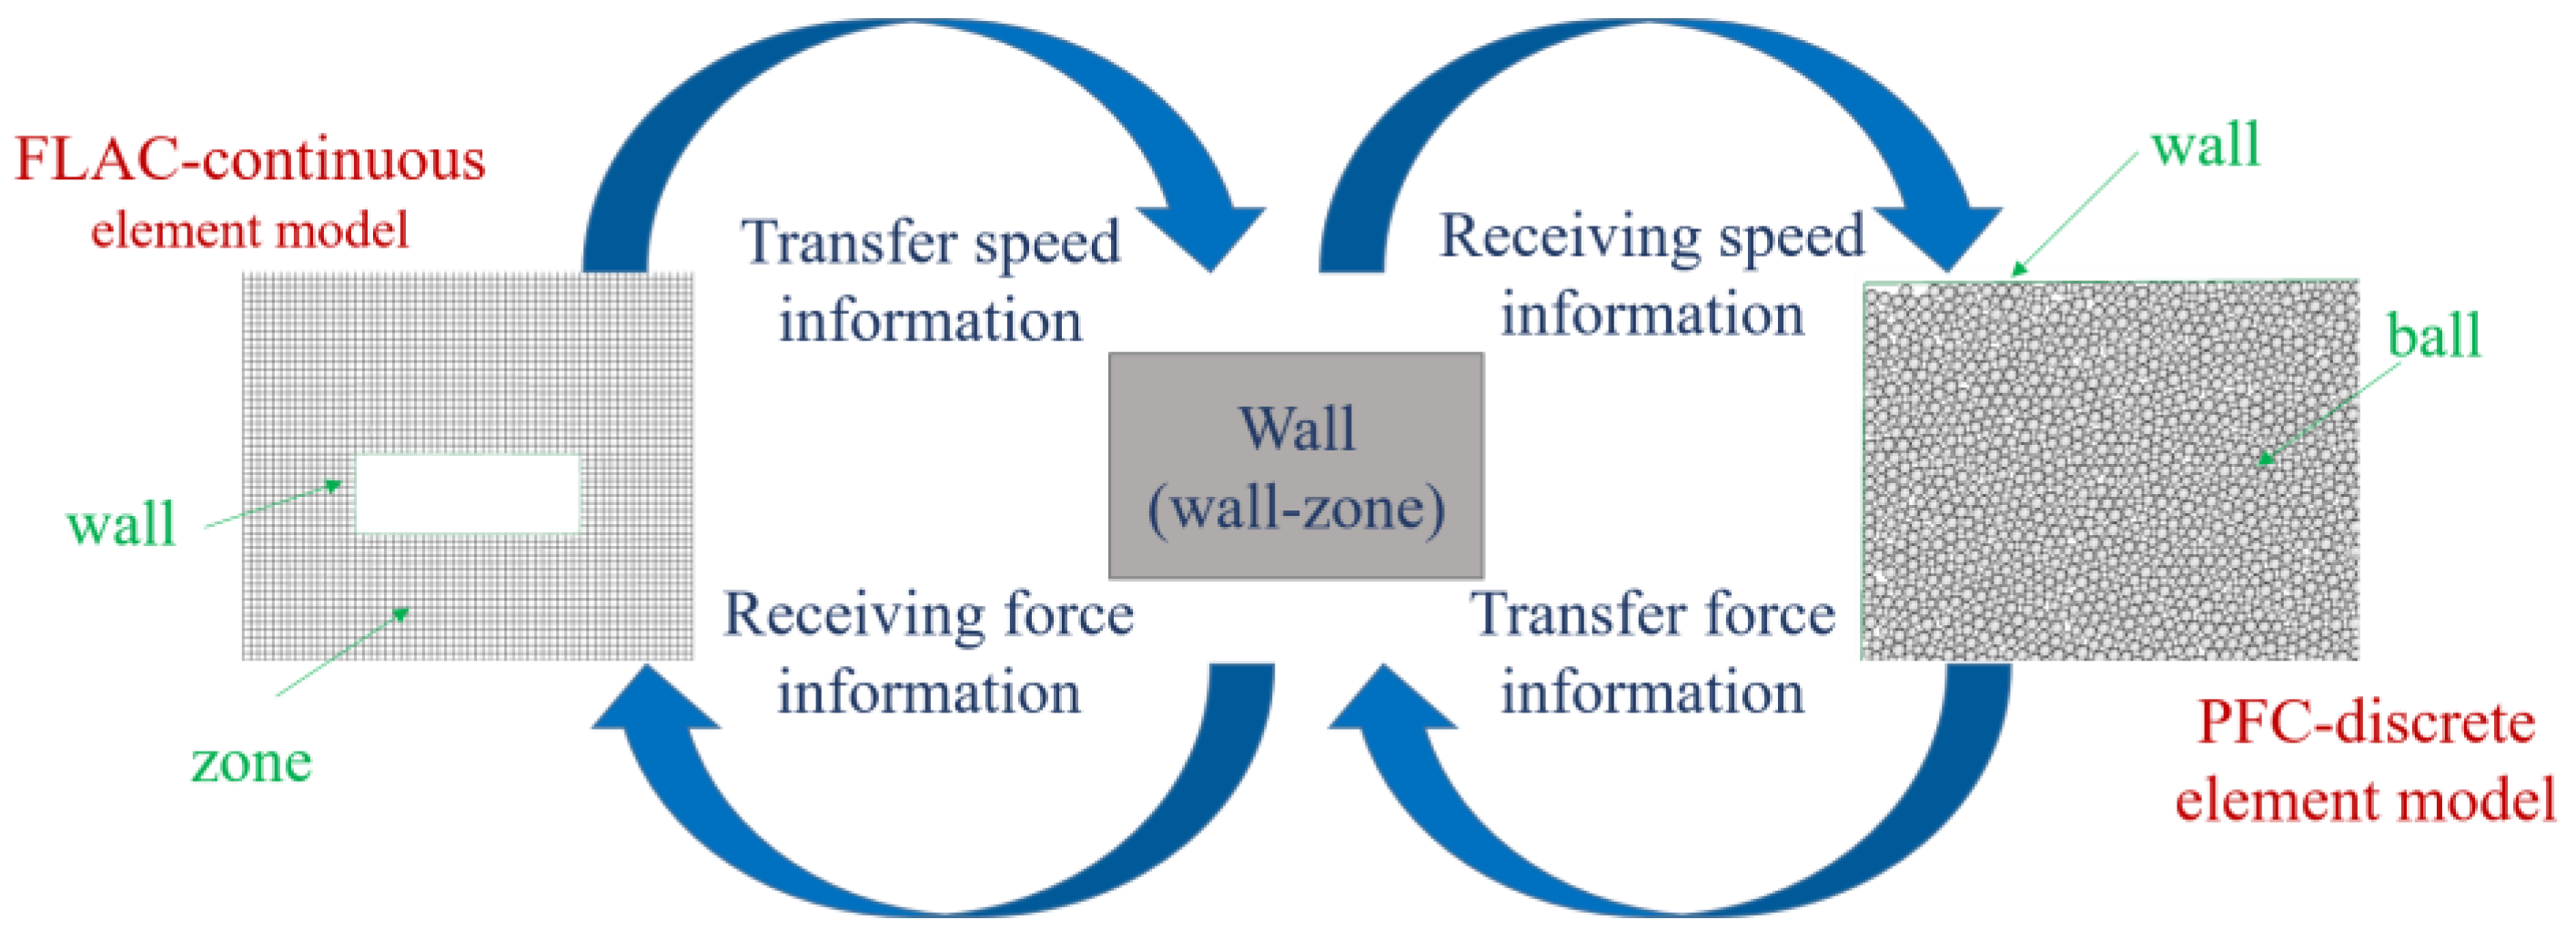
2.1. Principle of Continuous–Discrete Coupling Calculation
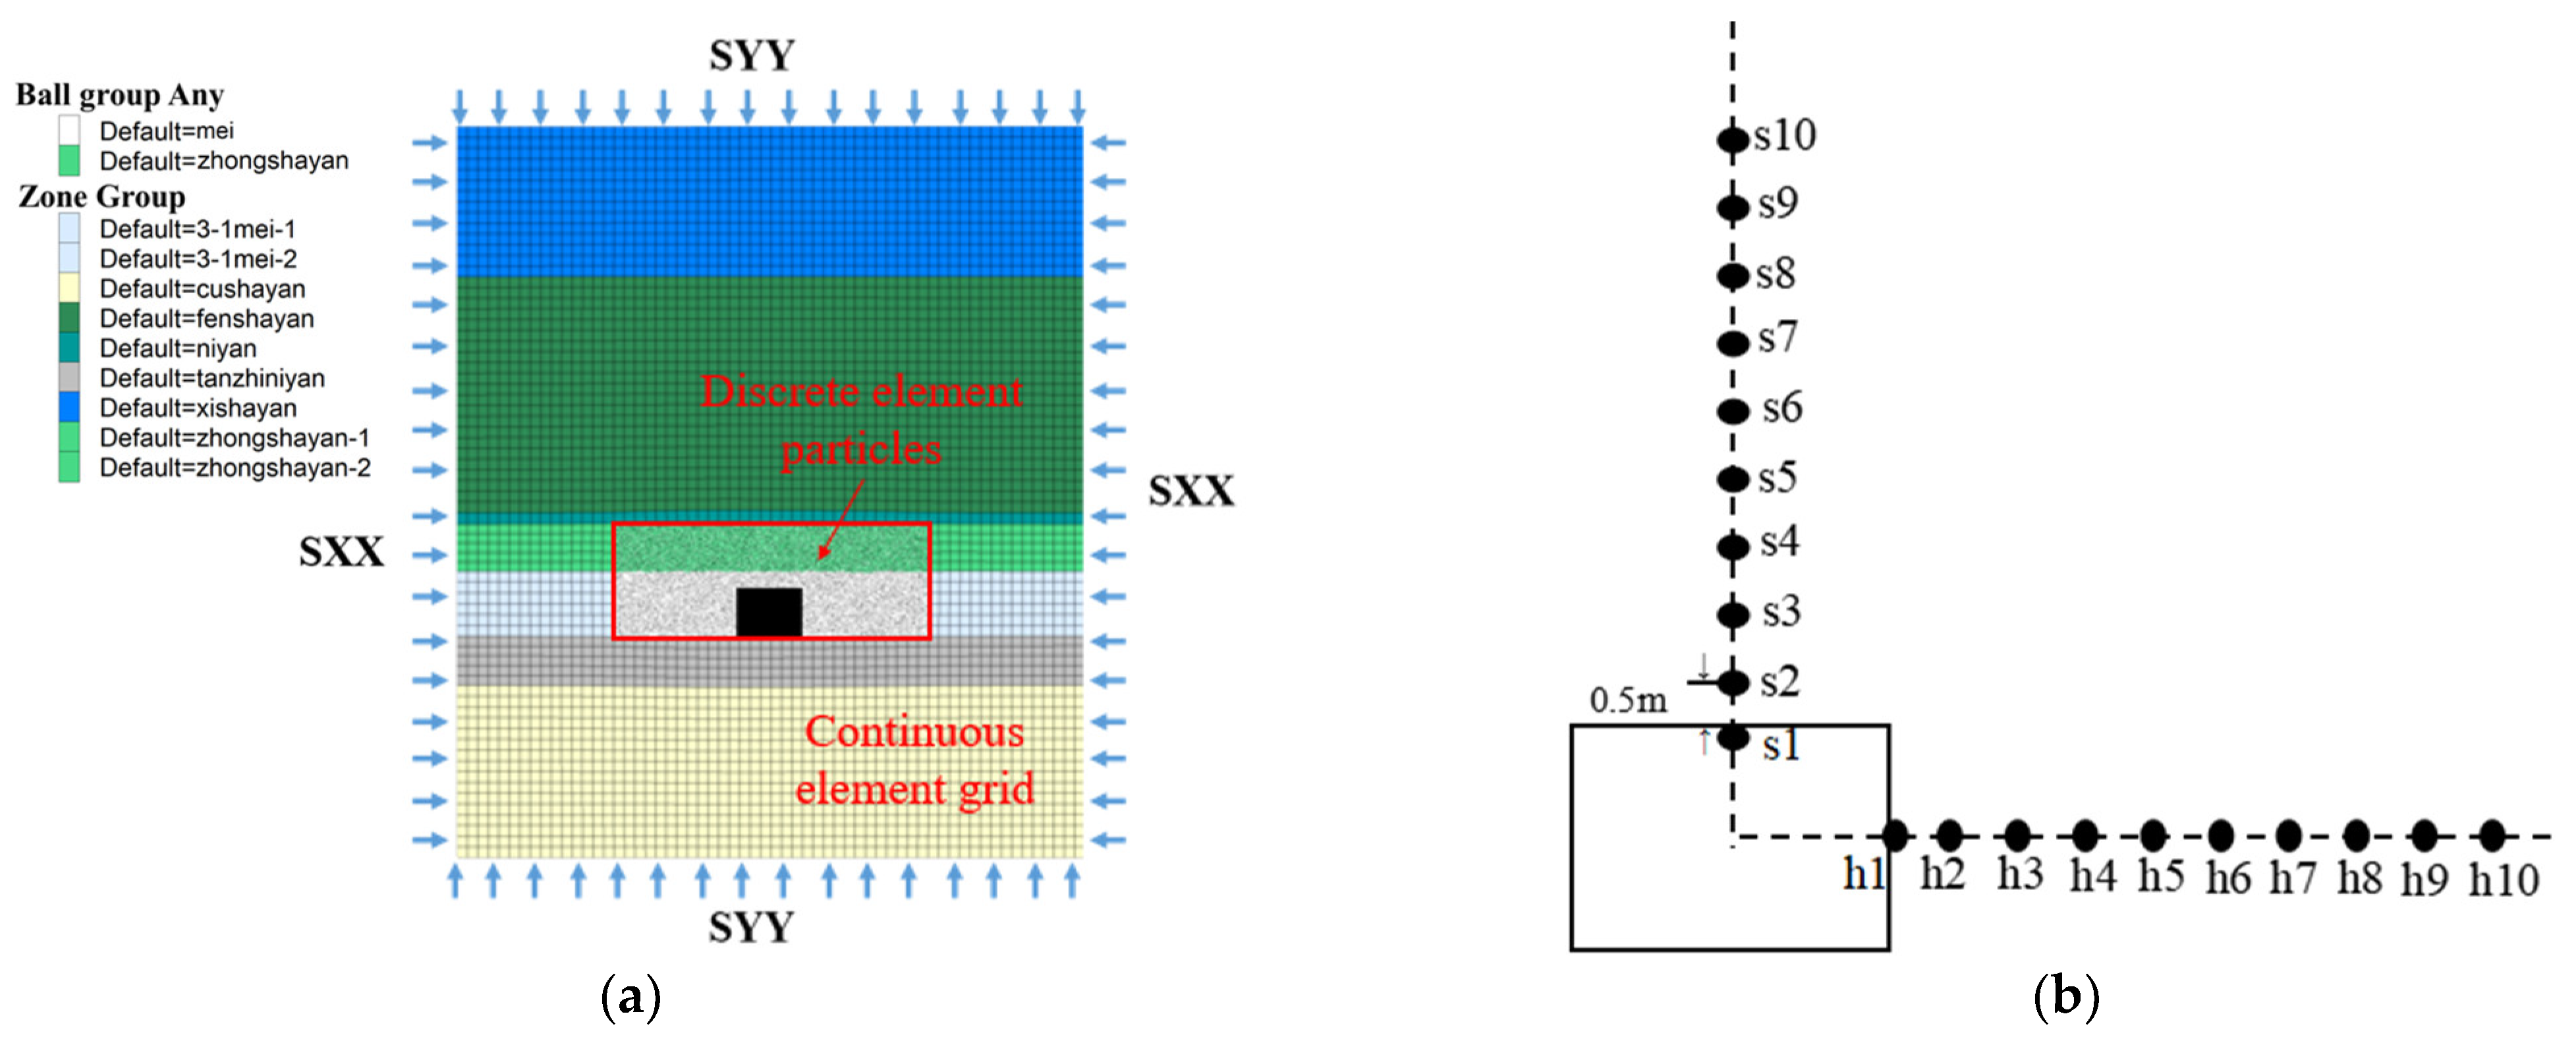
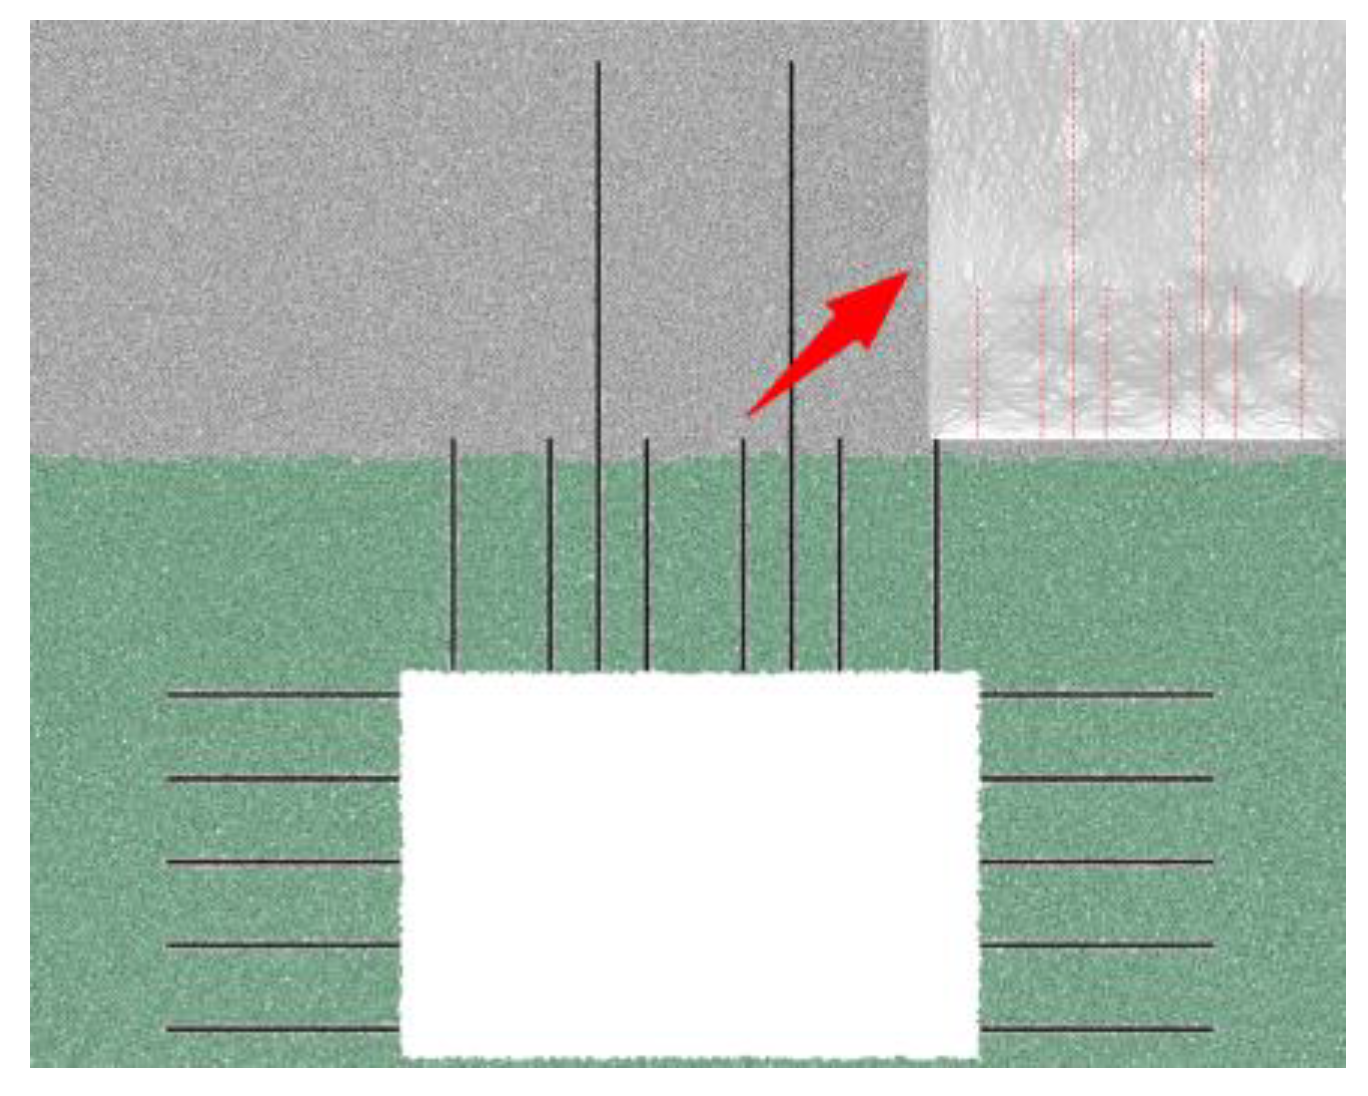
To understand the macroscopic deformation of surrounding rock, the force chain network evolution of microscopic granular units and the synergistic evolution law of inter-granular force chain breakage are crucial to revealing the damage characteristics of the roadway-surrounding rock in weakly cemented rock strata. Using discrete element software to simulate the macroscopic changes in the roadway’s surrounding rock would require numerous particles, thus exceeding the available computational capacities. This challenge can be addressed to some extent through a continuous–discrete coupled simulation. In this approach, a model is established by using continuous element software, leaving an empty area in the center. Discrete element modeling is applied in this empty area, transferring forces and displacements between the discrete and continuous elements via an interactive interface. This strategy maintains computational efficiency while ensuring accuracy.
Continuous–discrete coupling simulations can be conducted by using two methods: one method involves controlling the boundary particles, which is primarily used for small damage deformation problems, while the other method involves using a boundary (wall or shell) for control, primarily used for solving large deformation problems. The principle of continuous–discrete coupling, as shown in Figure 1, mainly involves using a wall or shell as the interaction boundary. The continuous finite element mesh in the FLAC2D model is subjected to external loads and self-gravitational stresses. At each computational timestep, the node velocity will be updated, and this value will be transferred to the endpoints of the wall zone on the boundary walls of the FLAC2D and PFC2D models. This ensures that the velocities of the nodes of the FLAC2D-coupled boundary grid and the endpoints of the PFC2D boundary wall are equivalent, thus guaranteeing the continuity of the coupled boundary displacements. Similarly, the external load’s effect induces movement in the PFC2D wall, which in turn triggers displacement within the discrete element model’s internal particle ball. This displacement results in new contact forces at the boundary, which are then transferred back to the FLAC2D model through the interaction interface. The grid segment node reaction force principle calculates the external force exerted on the nodes at both ends of each grid segment of the coupled boundary. The forces at the FLAC2D-coupled boundary and PFC2D wall contact must be consistent to ensure the continuity of the coupled boundary stress.
The coupling interface is activated in the FLAC2D and PFC2D coupled model, and calculations require the FLAC2D software to run in a large deformation mode. In this study, we adopt the second method. The transformation theory for the wall contact force transmitted from PFC2D is as follows:
From Figure 2, we assume that a wall is subjected to an x-direction contact force of f x , a y-direction contact force of f y , and a rotational bending moment of M. If the coordinates of the grid nodes corresponding to the wall in the FLAC2D model are ( x 1 , y 1 ) and ( x 2 , y 2 ), the rotational bending moments caused by f x and f y are
M d = f y ( x 1 x 2 ) f x ( y 1 y 2 )
If M d is not equal to 0, the force distribution factor a becomes
a = ( M f y ( x 1 x 2 ) + f x ( y 1 y 2 ) ) / M d
If a is greater than 1, then a = 1. If a is less than 0, then a = 0. Subsequently,
f x 1 = a f x ,   f y 1 = a f y
f x 2 = ( 1 a ) f x ,   f y 2 = ( 1 a ) f y
Figure 2. PFC2D wall and FLAC2D-coupled boundary-force conversion models.
Processes 11 02556 g002

2.2. Modeling

The coupled model comprises two components: a continuous grid produced by the FLAC software and discrete particles formulated by the PFC2D software. The two components are divided by allocating space in the center of the grid. The primary role of the FLAC2D model cell is to offer and uphold a steady envelope pressure for the PFC wall, thereby preserving the initial geostatic stresses for the excavation.
Figure 3a illustrates the continuous–discrete coupled model. Here, the dimensions for the continuous unit calculation model are 60 m × 50 m, divided into 22,552 finite difference grids. The discrete element model, located at the coal seam and overlying rock layer of the continuous unit model, measures 30 m × 6.5 m; a total of 31,777 particles are generated. A roadway of 6.0 m × 4.0 m is excavated within the discrete element model.
The model’s boundary conditions include a side constraint and a fixed bottom. An original rock stress of 9.81 MPa is applied to the upper part, and a lateral pressure coefficient of 1.25 is used to emulate the effect of a 400 m burial depth. The FLAC2D continuous unit model employs the Mohr–Coulomb model, while the linear-bond model is used for the cementation of the PFC2D discrete element particles.
Figure 3b shows the location of the measurement points around the roadway. Considering the model symmetry, ten measurement points are arranged at each right gang and the top plate position of the roadway (the spacing of each point is 0.5 m).

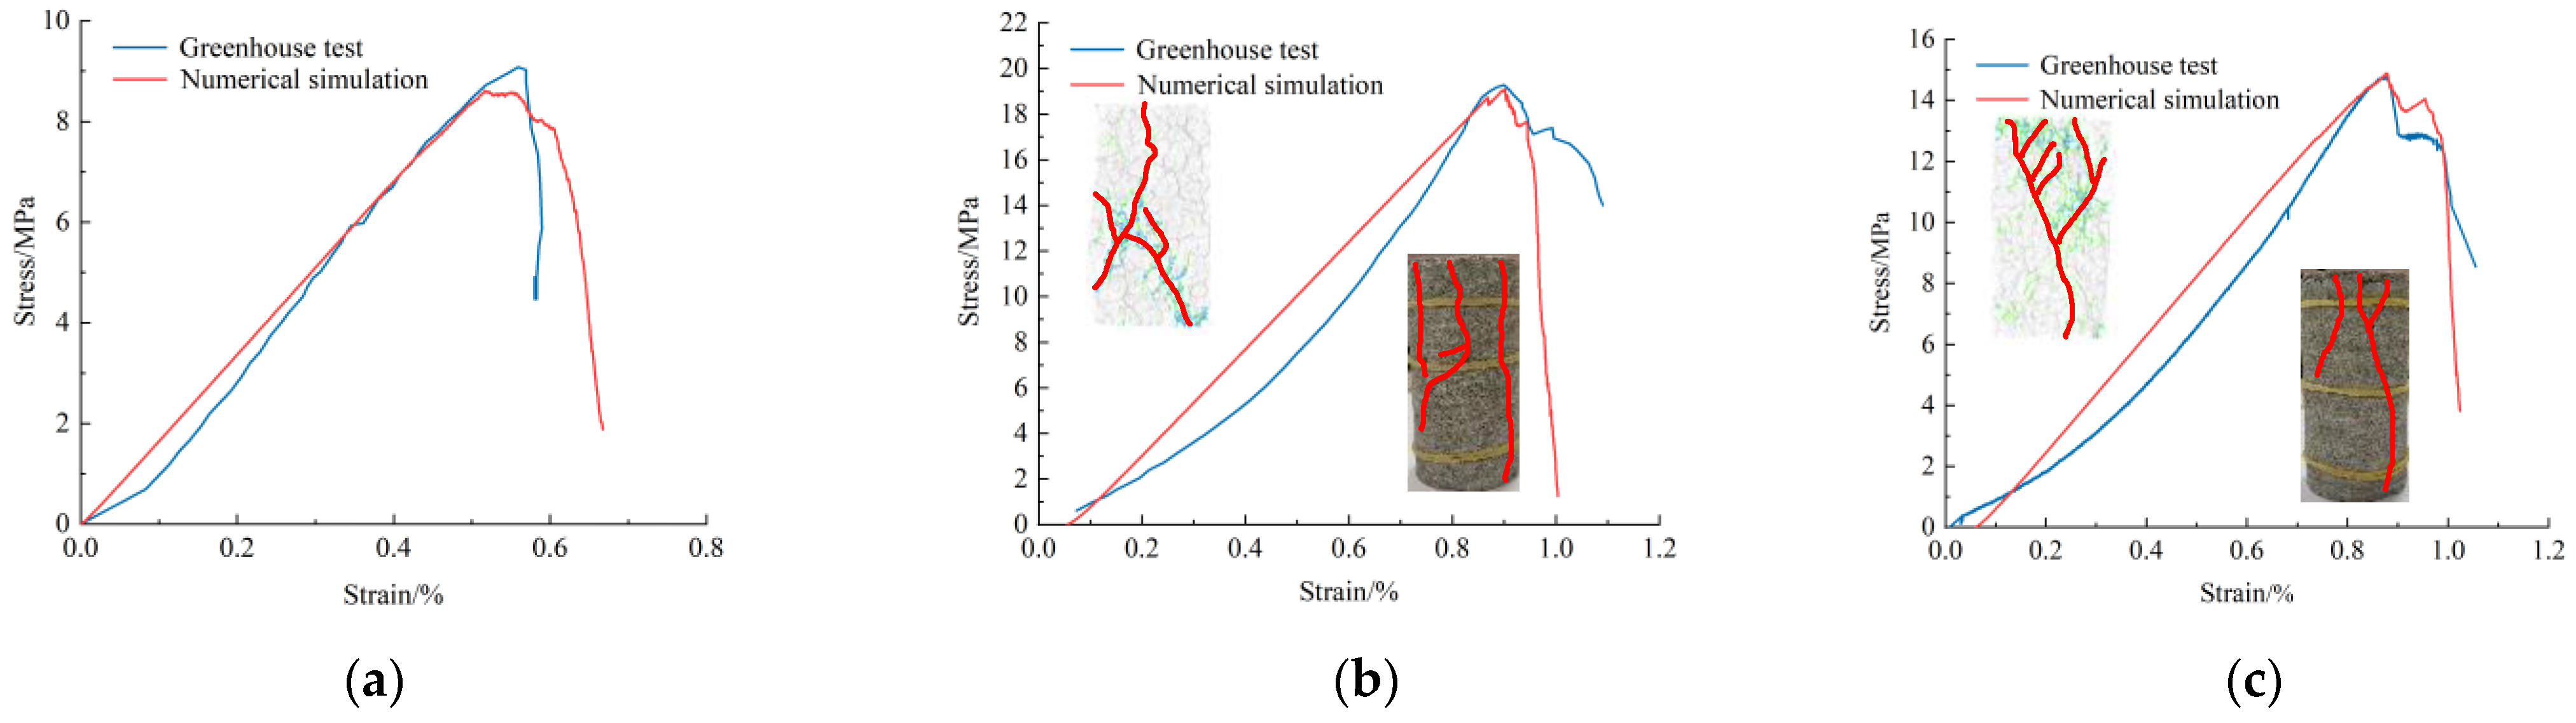
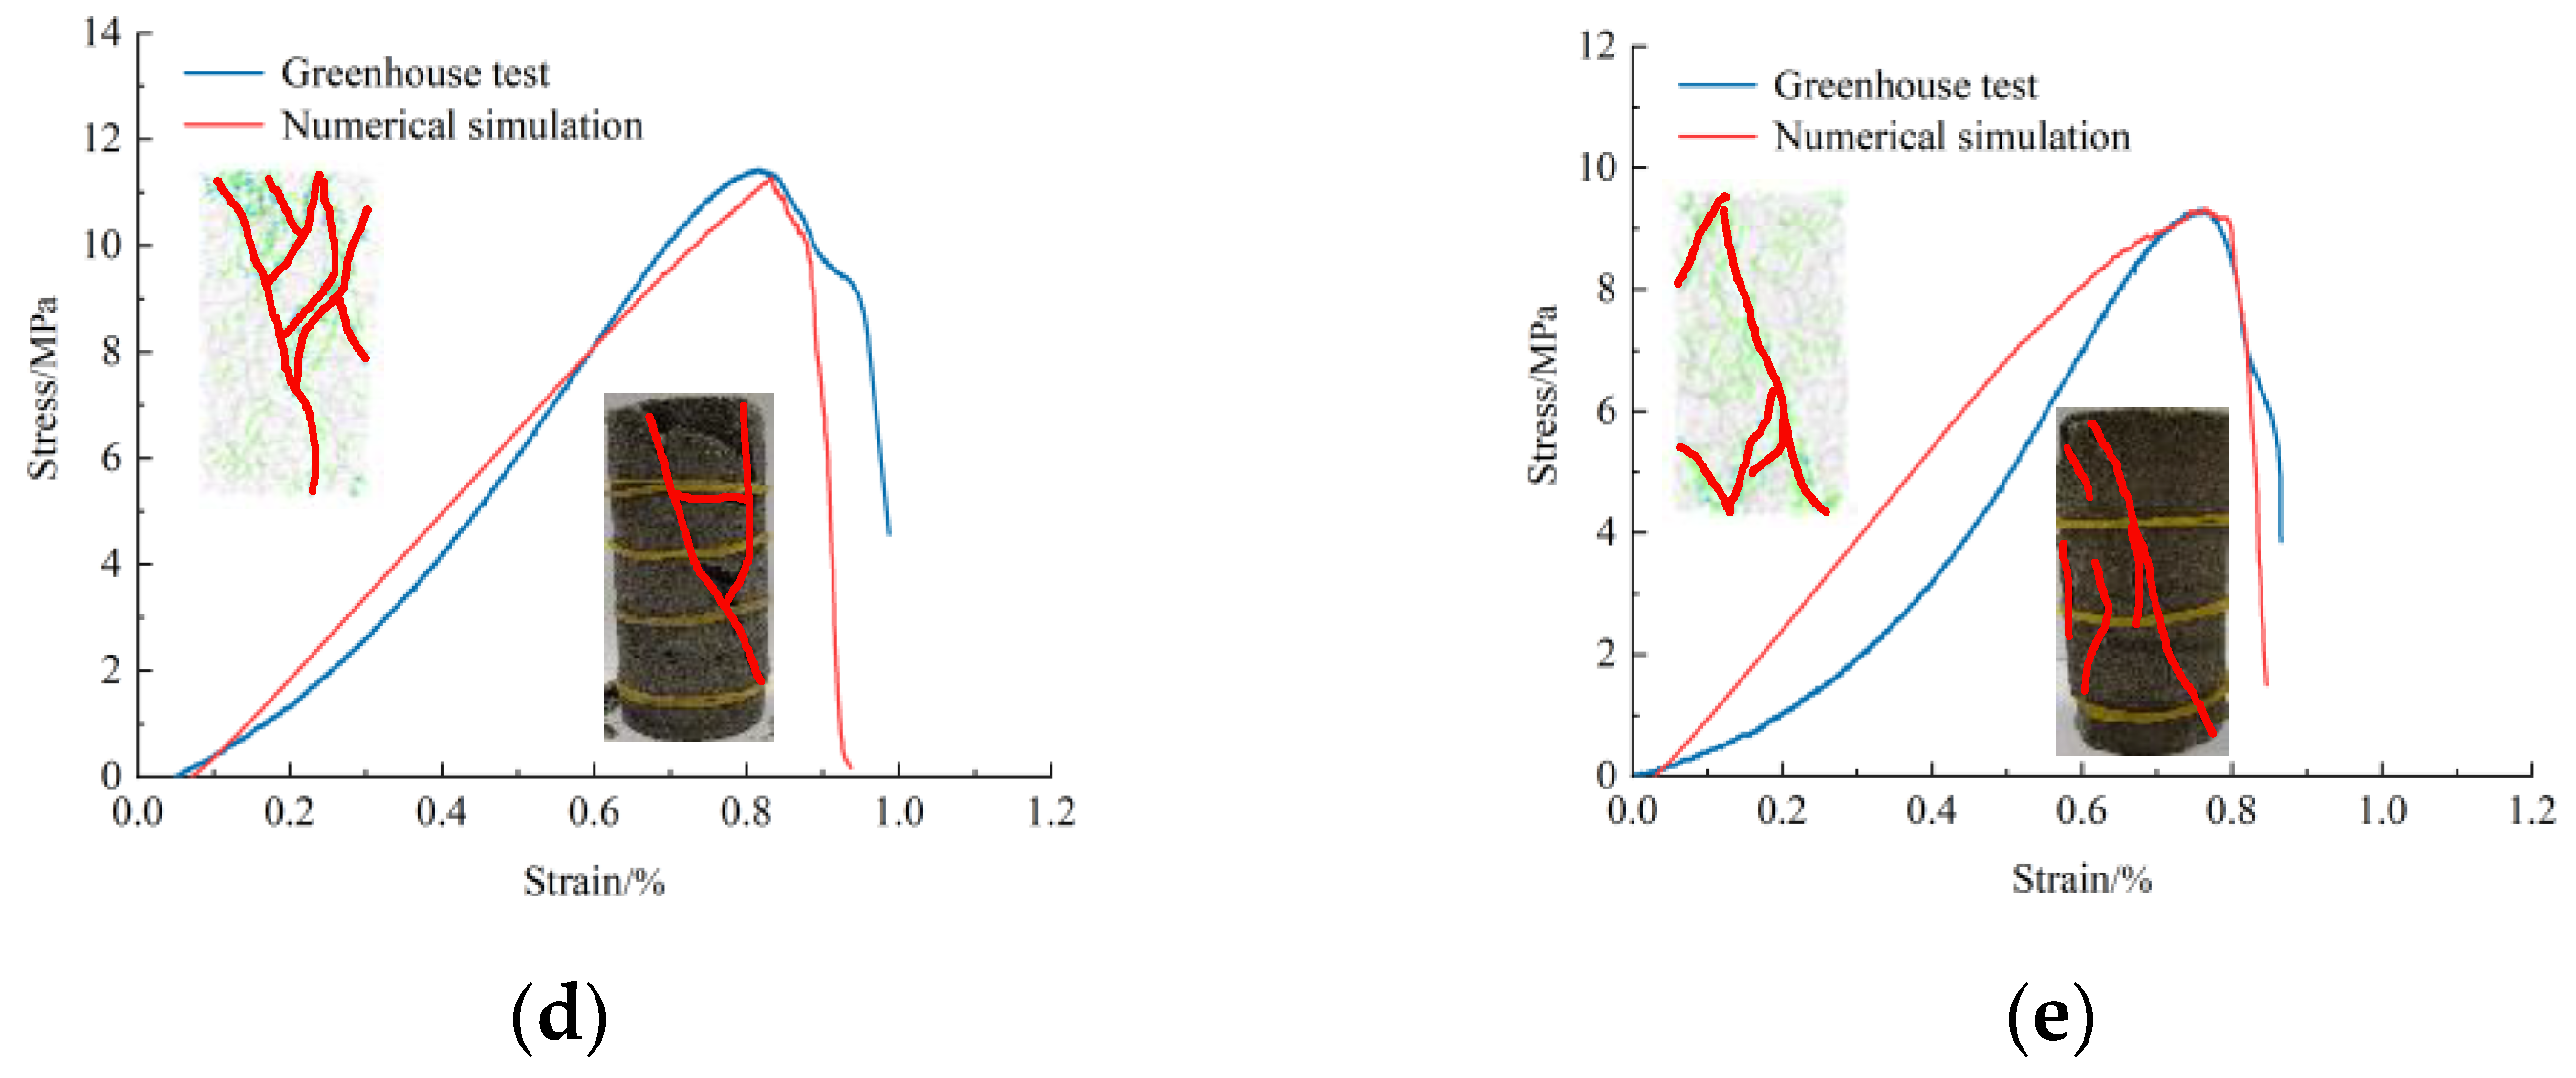
2.3. Calibration and Selection of Mesoscopic Parameters

The parameter selection for this experiment is primarily derived from the coal rock body specimen of the Hongqinghe coal mine. A standard 50 mm × 100 mm specimen is constructed by using PFC, with the particle contact mode following a parallel-bond model. The specimen is then subjected to uniaxial rock mechanics experiments through numerical simulations, and a trial-and-error method is utilized for parameter debugging. Ultimately, the microscale parameters for the discrete element coupling are determined. The results of the parameter calibration are depicted in Figure 4. According to the comparative analysis of the specimens, the uniaxial compression crack propagation mode of the laboratory and simulation tests is consistent. The fine-view parameters calculated from the continuous element and discrete element model are presented in Table 1 and Table 2. The continuous element parameters include the density (ρ), bulk modulus (K), cohesion (C), internal friction angle (φ), and tensile strength (σt); the discrete element parameters include the effective modulus (emod), stiffness ratio (kratio), parallel-bond effective modulus (pb_emod), parallel-bond stiffness ratio (pb_kratio), parallel-bond cohesion (pb_coh), parallel-bond tensile strength (pb_ten), and parallel-bond friction angle (pb_fa).

2.4. Pilot Program

The bearing capacity of weakly cemented strata is reduced due to the influence of groundwater, and the anchoring effect between the anchors and the weakly cemented rock strata is weakened. To study the deformation law of the roadway in weakly cemented strata under varying levels of moisture content and the failure mechanism of the anchors, this test simulates the excavation of a roadway in weakly cemented strata under varying levels of moisture content by using a continuous–discrete coupling method. A detailed analysis is performed on the deformation of the roadway, cracks, force chains, and other aspects. Different moisture content rates are realized based on the assignment of the discrete element calibration parameters mentioned above, and the roadway support is arranged as per Figure 5.

3. Damage Law of Roadway-Surrounding Rock in Weakly Cemented Strata under Different Water Conditions

3.1. Continuous–Discrete Coupled Data Consistency Analysis

In the coupling calculation, velocity and force are transmitted between the nodes of the continuous element mesh and discrete element particles via the interactive interface. During the coupling calculation, the displacement and stress data outputs from the continuous–discrete coupling boundary are recorded through monitoring. The comparison of the data continuity shows that both data outputs maintain data consistency and continuity in the cloud diagram during the coupling calculation process.
Figure 6 illustrates the displacement and its vector diagram in the continuous–discrete coupling model, wherein once the coupling calculation is complete, the displacement values change at the coupling boundary of both the zone and the ball and converge to the same value. For instance, the displacements of the zone and the ball at the midpoint of the upper coupling boundary are 0.0279 and 0.0276 m, respectively. This pattern of continuous displacement change within the specified range can also be observed at other coupling boundaries, as depicted in the figure. The consistency in both the value and direction of the displacement validates the accuracy of the coupling between the discrete and continuous elements.

3.2. Response Analysis of Moisture Content on the Deformation of Roadway-Surrounding Rock

3.2.1. Mechanism of Action of the Anchor Solid

Following the excavation of the roadway, it is reinforced with anchor rods and anchor cables. Figure 7 illustrates the support mode of the roadway and the effect of contact. This study simulates the impact and effectiveness of anchor solids on the surrounding rock under various moisture content levels. In this investigation, rigid round large particles are overlapped and connected to form the anchor solid. The rigid particles within the anchor solid are assigned to bond with the parameters in the parallel-bonding model. If the contact force between the anchor body particles and rock particles is less than the bond strength, the particles do not slide; however, if the bond strength is exceeded, the bond breaks. This anchor body model is capable of withstanding axial force, bending moments, and torque.
With the reinforcement of anchors, the displacement contour of the surrounding rock was distributed in a wave-like pattern (Figure 8). The deformation of the surrounding rock particles near the excavation surface was larger than that of the anchors, while the deformation of the deep surrounding rock particles far from the excavation surface was smaller than the anchor deformation. This pattern demonstrates the deformation inconsistency between the anchors and the surrounding rock during the excavation process, also known as the neutral point feature, when viewed from a fine perspective [13].

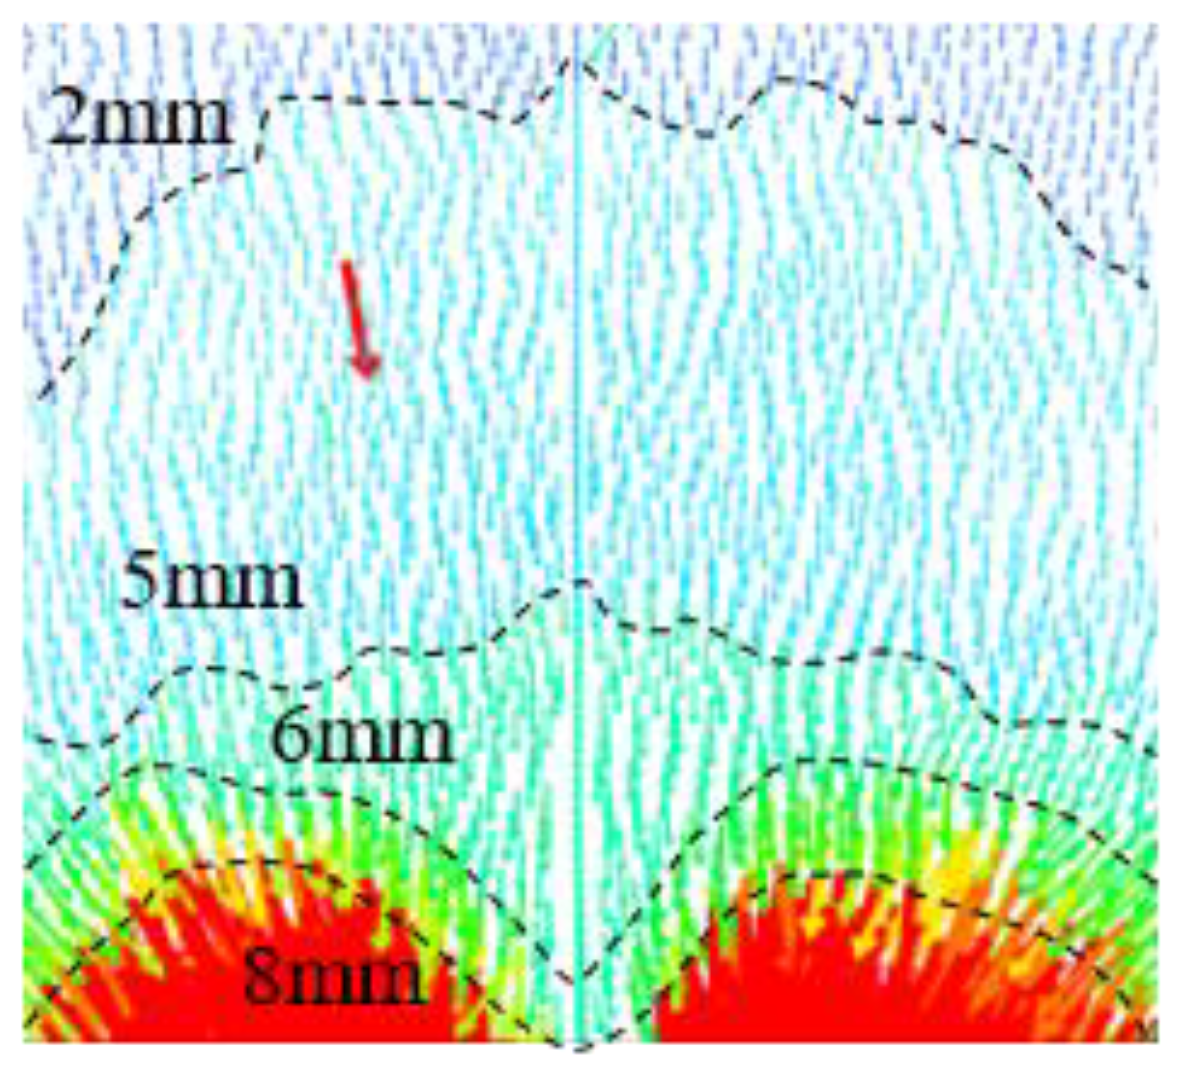
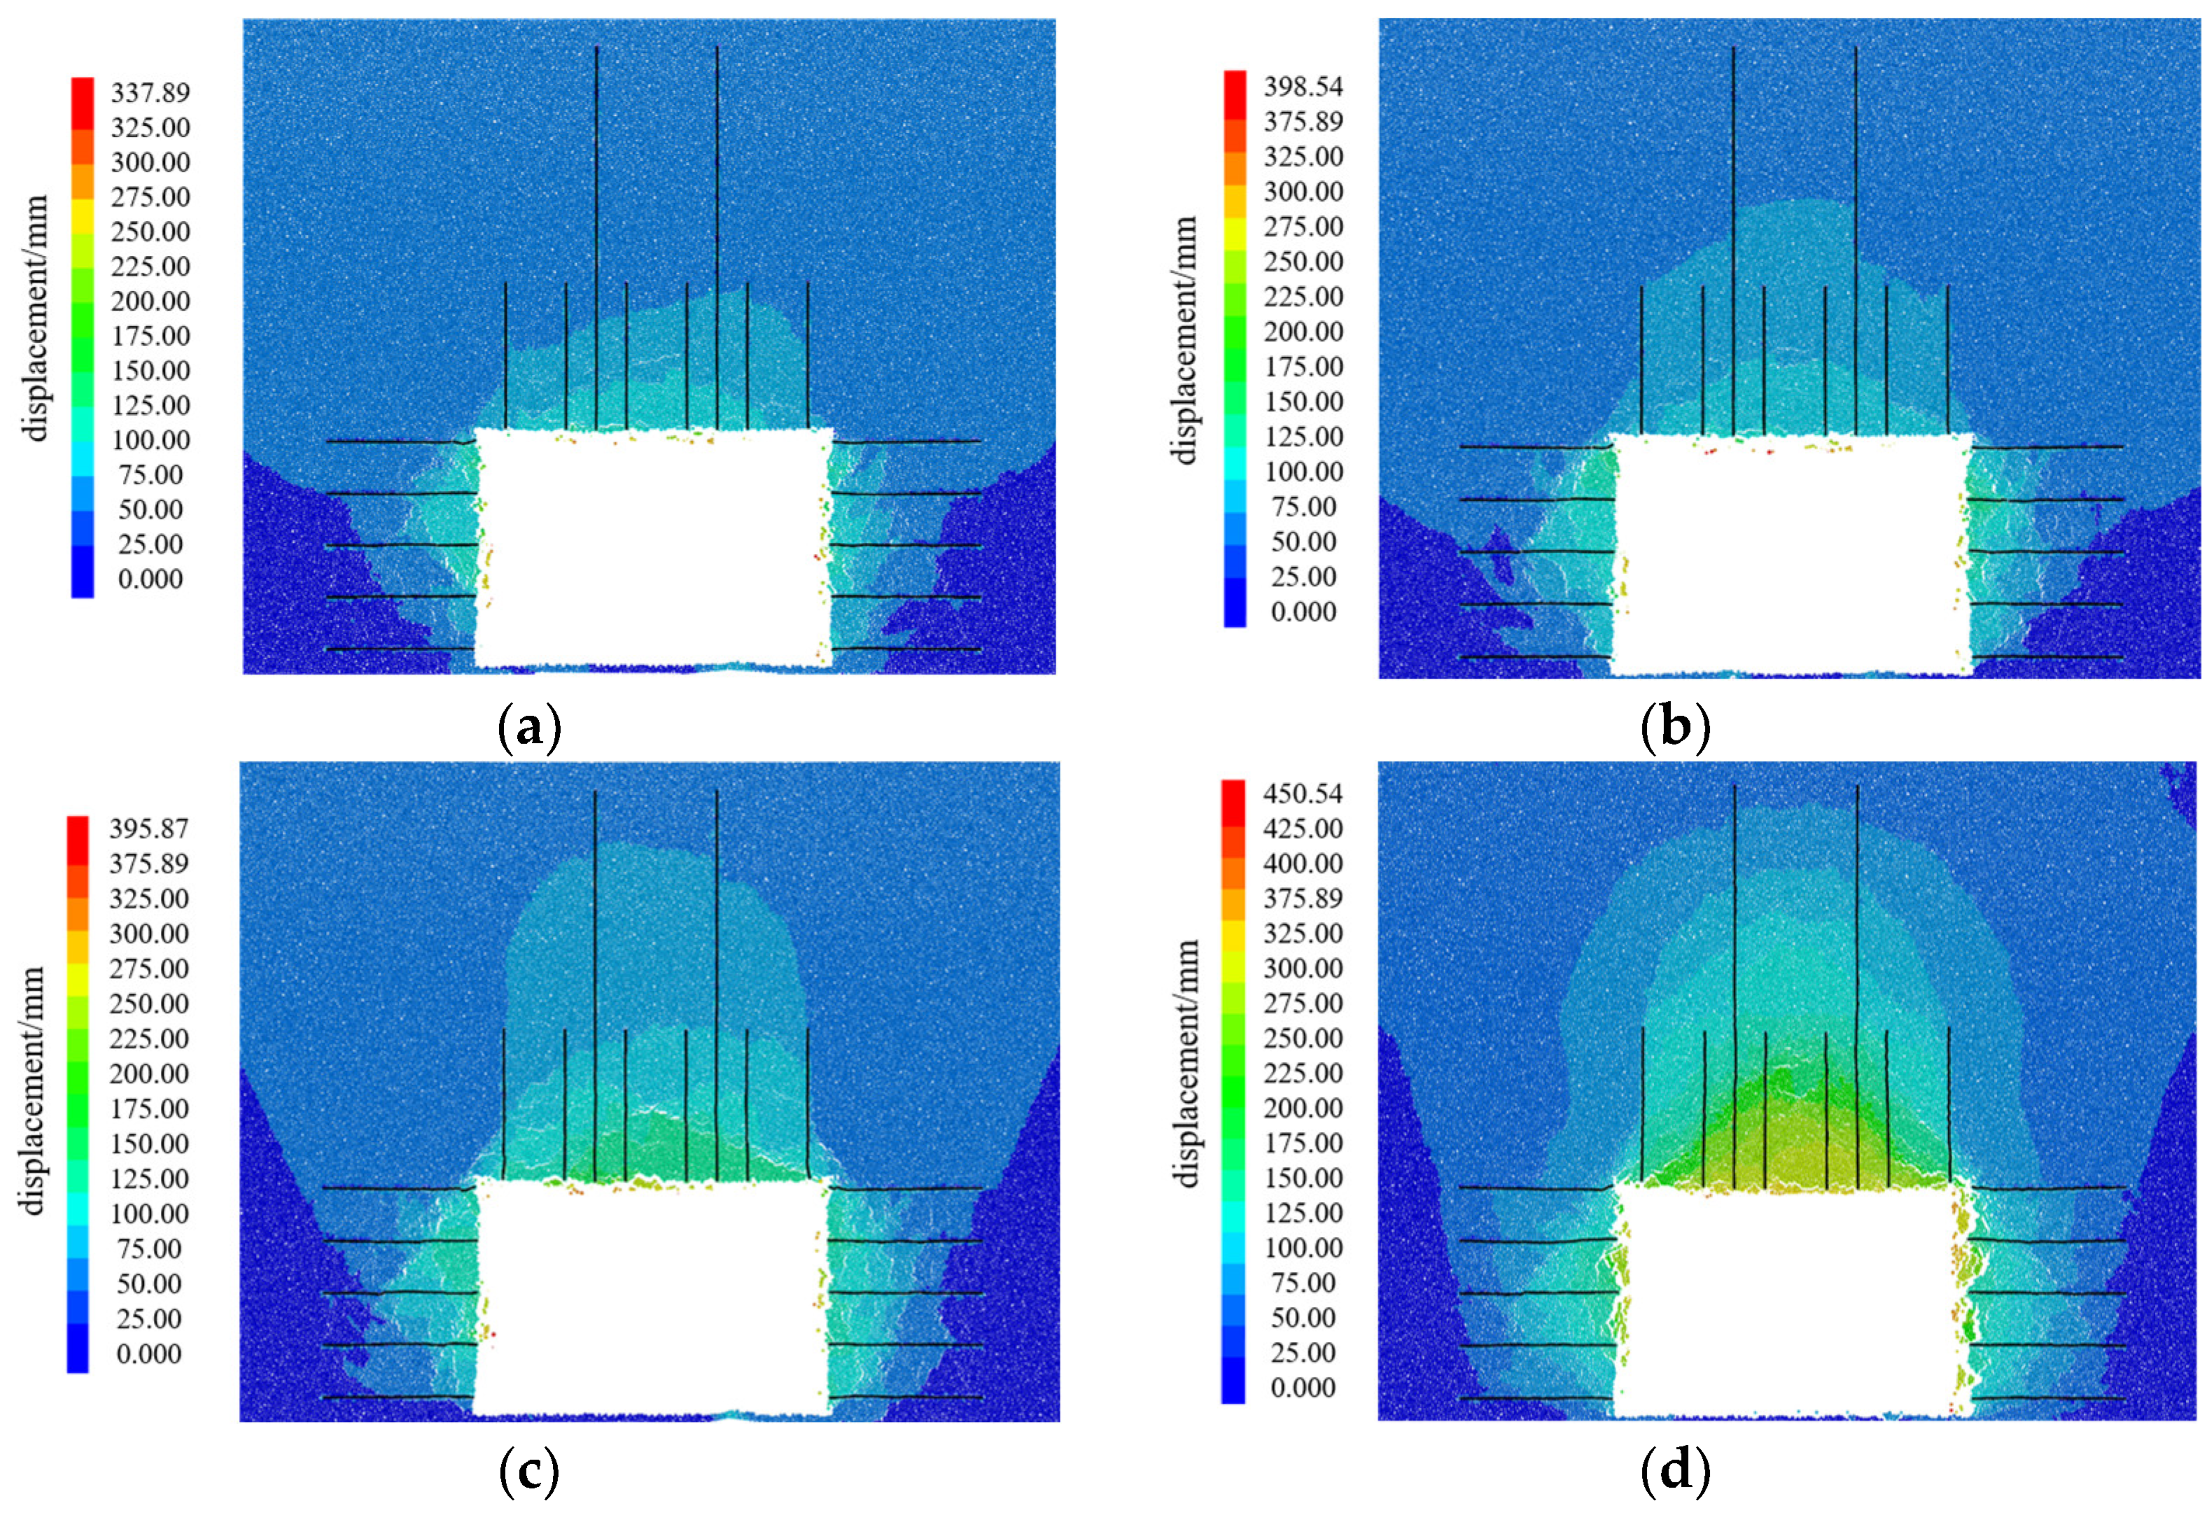
3.2.2. Deformation Pattern of the Perimeter Rock of the Roadway

Figure 9 illustrates the displacement cloud diagram of the surrounding rock of the roadway in weakly cemented strata under varying levels of moisture content. The figure shows that post roadway excavation, the two sides of the roadway destabilize first, with the largest displacements located in the middle of the roof plate and the waist of the roadway. These displacements gradually reduce toward both sides during the development process. When the moisture content of the overlying rock layer increases, the rock structure loosens, the damage scope expands into the deeper parts of the surrounding rock, and the surrounding rock of the entire roadway exhibits discontinuous damage. Under different water content conditions, the instability ranges are 1.12, 1.37, and 1.91 m; when the moisture content ω = 7.8%, the damage range extends 2.8 m beyond the anchoring range of the anchor rods, and the anchor rods move synchronously with the surrounding rock.
Figure 10 showcases the displacement curve of the roadway under different moisture content rates. From the curve, it can be determined that when the moisture content ω = 0%, 2.3%, 5.5%, and 7.8%, the maximum subsidence of the roadway top plate is 96, 121, 186, and 397 mm, respectively, and the maximum deformation of the two sides is 106, 137, 161, and 200 mm, respectively. Thus, the deformation of the roadway perimeter rock is smaller when the moisture content ω ≤ 5.5%. At ω = 5.5%, the anchor solid exerts a controlling effect, and the deformation of the roadway-surrounding rock becomes relatively small. However, when the moisture content ω = 7.8%, the displacements of the roof and two sides increase by 113.4% and 24.2%, respectively. Hence, the increase in the moisture content of the overlying rock layer significantly influences the roof of the roadway.
An analysis reveals that the physical and mechanical properties of the roof rock layer significantly determine the overall stability of the roadway’s surrounding rocks. Under the influence of water, the bearing capacity of weakly cemented rock reduces due to the weakening of the cement between the particles. The surrounding rock of the roadway roof and the two sides is subjected to a persistent, immense “squeeze” load. Consequently, spalling and topping phenomena of varying degrees occur in the surrounding rock on both sides of the roadway and the top. This load pressure leads to the downward movement of the roadway roof and the anchors as a whole or results in anchor fracture, which in turn diminishes the anchoring effect.

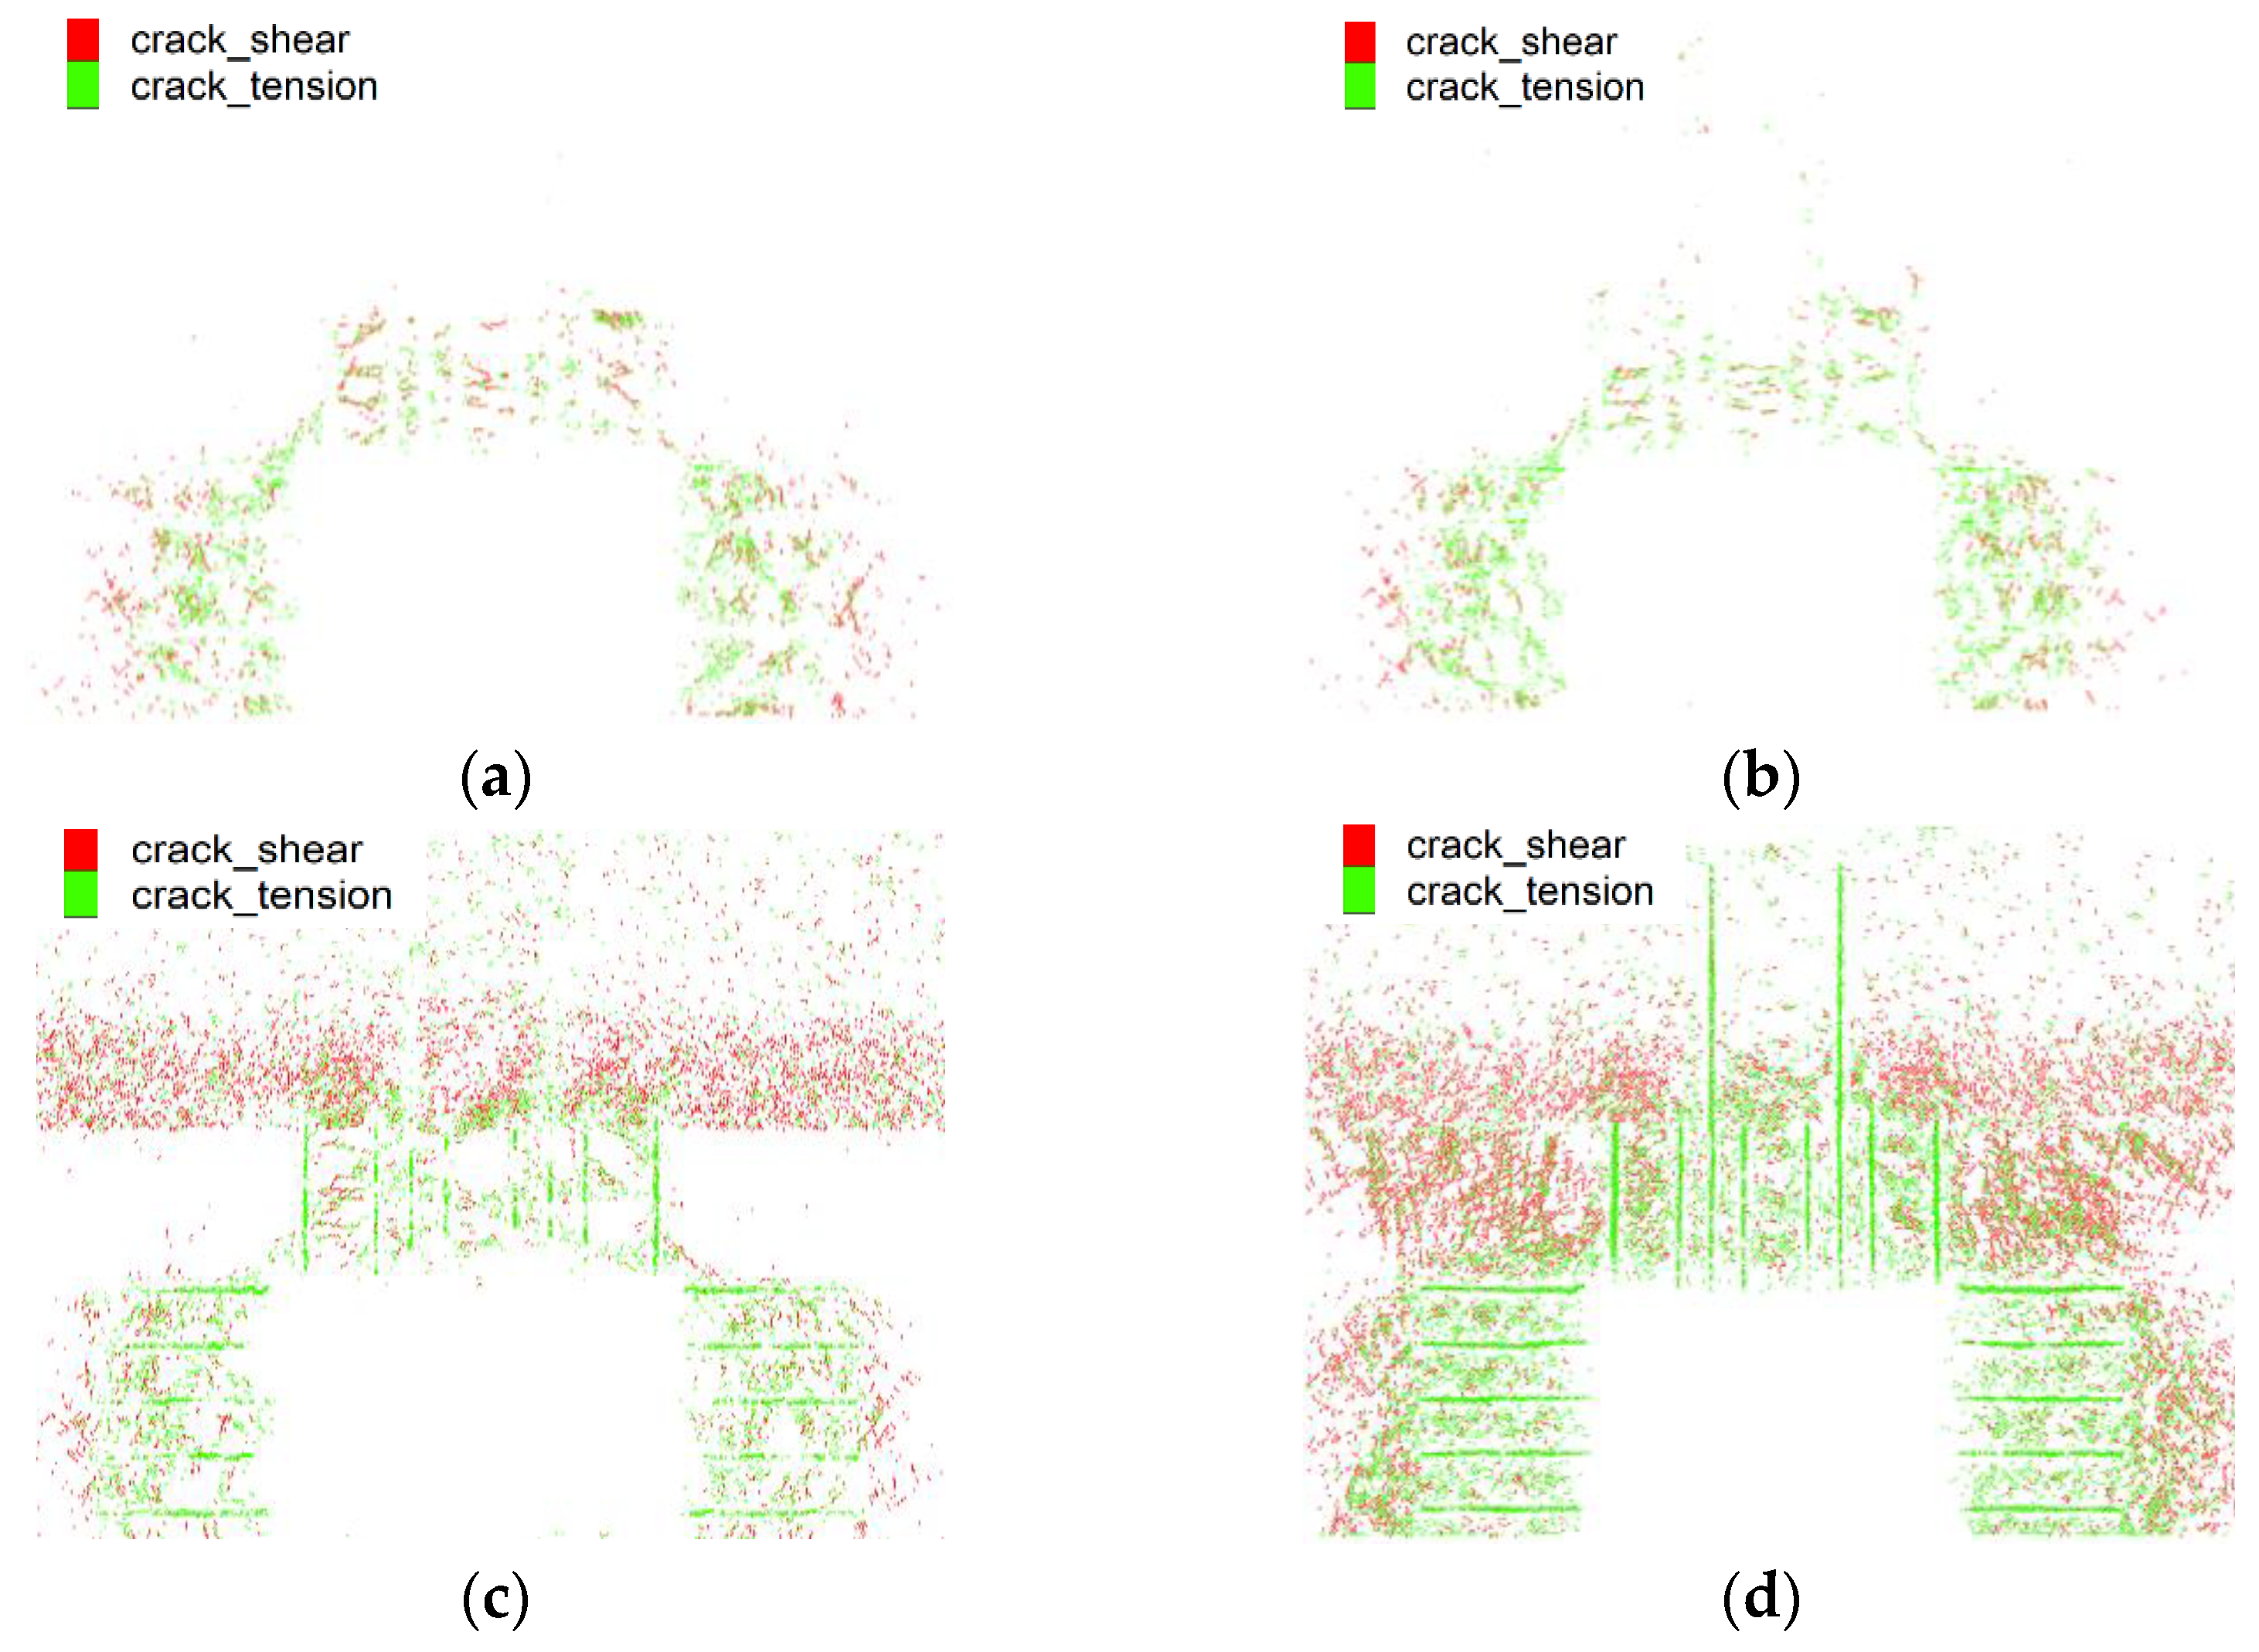
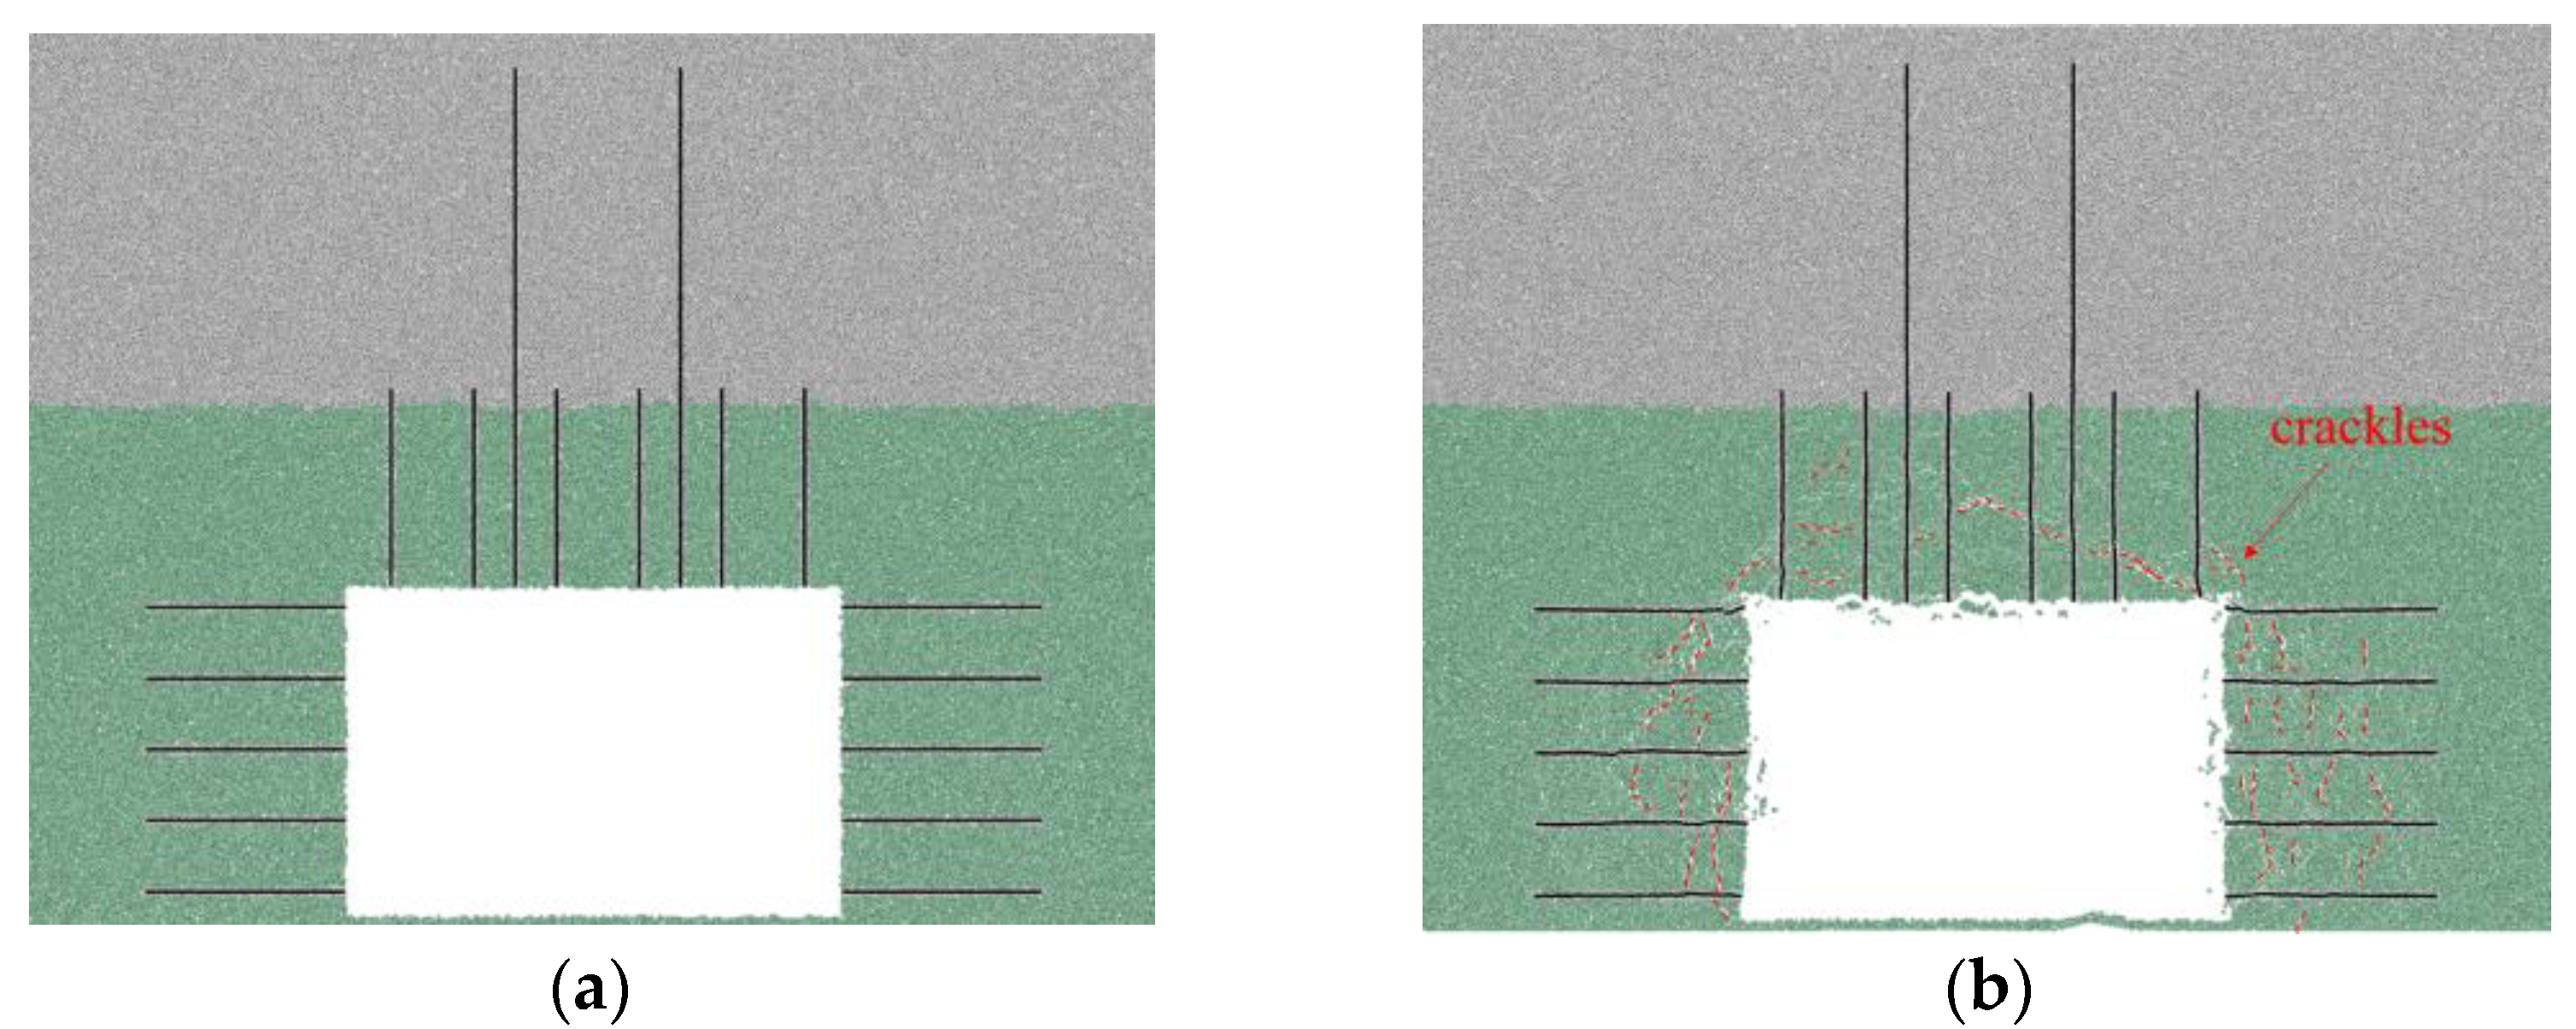
3.2.3. Distribution Pattern of Cracks in the Roadway-Surrounding Rock

The moisture content strongly influences the internal structure and mode of destruction of weakly cemented rocks. The distribution of cracks around the roadway in weakly cemented sandstone overlying strata significantly varies with varying moisture content, as displayed in Figure 11. Notably, when the moisture content ω < 5.5%, the number of cracks around the roadway exhibits a relatively stable state, even as the moisture content increases, with predominant tension cracks. However, when ω ≥ 5.5%, the number of cracks abruptly increases. At ω = 5.5%, cracks are primarily concentrated in the overlying aquifer, with mostly shear cracks and a mixture of tensile and shear cracks around the roadway. Around this moisture content, cracks appear at the critical surface of the anchor solid. At ω = 7.8%, the cracks around the roadway and in the overlying rock layer continually expand, with shear cracks primarily concentrated within the surrounding rock interior and tensile cracks distributed around the roadway. At this point, cracks are visible throughout the anchor solid.
An analysis of the internal structure shows that the increased moisture content weakens the friction between crystal particles on the rock body’s cleavage surface, reducing the rock body’s modulus of elasticity. The cohesion and angle of internal friction of the structural surface decrease, leading to the fracture of cementation between particles, yielding a loose rock body. The changes in the microstructure and mechanical properties cause the destabilization of rocks to exhibit combined damage characteristics. Hence, compared with dry rock, weakly cemented rock with increased moisture content generates a plethora of tension cracks with numerous fissures, accompanied by a gradual increase in shear cracks [14].

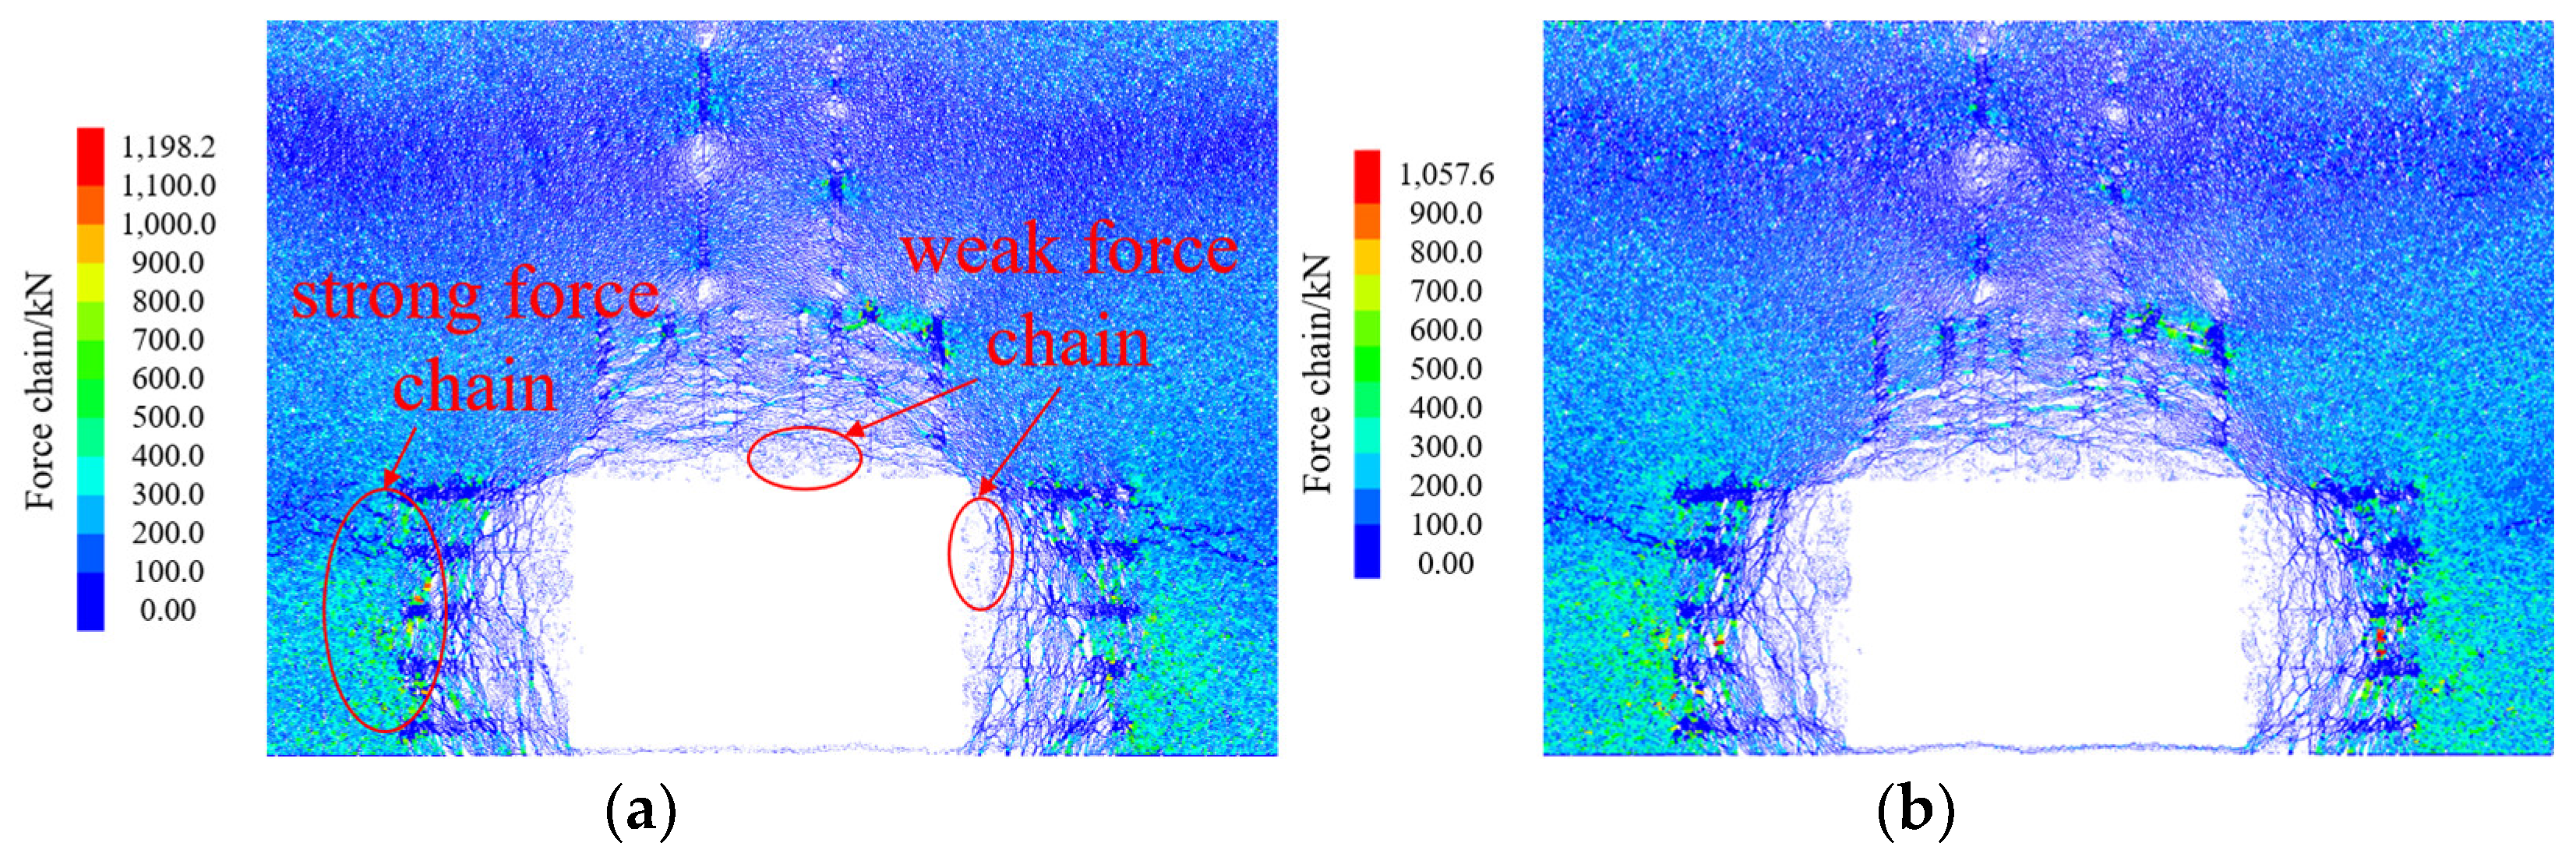
3.2.4. Evolutionary Patterns of the Roadway-Surrounding Rock and Anchored Body Force Chains

Force chains in a granular flow are load-bearing paths for stress transfer and can be visualized with the PFC granular flow software. The strength magnitude of these force chains can be categorized into strong force chains (thick lines) and weak force chains (thin lines) [15]. Figure 12 contains a cloud diagram that shows the evolution of these force chains in the surrounding rock of a tunnel with varying levels of moisture content, allowing us to visualize the strength of the force chains and their evolution laws.
When the moisture content ω = 0% and 2.3% (Figure 12a,b), the surrounding rock is either unaffected or minimally affected by water. In these scenarios, all areas of strong adhesive force chains are located at the ends of the anchor solids. The weak force chain (the one without adhesion) can be observed around the perimeter rock of the roadway as well as at the bottom parts of the anchor solids. The force chain of the overlying rock layer mostly assumes an arch structure. The strong adhesive force chain arch progressively experiences damage from the middle of the arch’s top and the exterior of the arch’s foot, bottom up. As the damage progresses, the strong force chain either disappears at the damage site or becomes the secondary contact [16,17,18,19].
When the moisture content ω = 5.5% (Figure 12c), an annular force chain structure forms around the roadway (caused by bubbling and falling blocks). All particles within this structure belong to weak force chain structures, which no longer maintain continuity with the surrounding force chain. The weak force chain area around the roadway expands, and the contact effect between the end of the anchor solid and the surrounding rock gradually weakens. Parts of the annular force chain in the roof plate fracture, which results in a clearly visible arch-shaped stress shell structure.
When the moisture content ω = 7.8% (Figure 12d), the top plate essentially ruptures, and the ruptured portions of the force chain consist entirely of weak force chains or areas with no force chain contact. The scope of the weak force chain area now reaches the weakly cemented medium sandstone layer located above the coal seam. The arch force chain structure evolves upwards, and the stress within the force chain arch generally remains low, with the entire structure in a weak adhesive force chain state. The contact force chain between the anchor solid and the surrounding rock also remains in a weak adhesive force chain state entirely.
Combining these observations with the crack distribution in Figure 11, conclusively, an increase in moisture content leads to an expanded internal destabilization range of the surrounding rock of the roadway. This seriously damages the critical surface of the perimeter rock, with a larger destabilization in the top plate.
The test shows that for the roadway under the weakly cemented stratum, due to the increase in the water content of the overlying strata, the overlying water-bearing strata are unstable and destroyed, cracks are continuously developed, and the bearing effect is poor [20]. The simulation experiments show that when the water content ω < 5.5%, the internal bearing structure and damage degree of the surrounding rock is small through the cracks and force chain situation, and there is a strong force chain structure around the anchor solids. When the water content ω > 5.5%, the roadway is seriously ruptured by the surrounding rock under the influence of water, the internal cracks are richly developed, and the surrounding force chain is transformed into a weak force chain. Due to the weakening of the bonding force chain between the anchoring solid and the surrounding rock, the anchoring effect cannot be achieved, resulting in the overall instability of the surrounding rock. This study shows that ω = 5.5% becomes the threshold value of water content for destabilizing the peripheral rock in the roadway.

4. Mechanism of Rupture of Roadway Perimeter Rock in Water-Rich and Weakly Cemented Strata

Based on the site conditions and simulation results, the failure of the anchors within the water-rich and weakly cemented perimeter rock of a tunnel is determined to be one of the primary factors contributing to the instability and rupture of the perimeter rock. According to the simulation results, the failure of the anchoring system seems to be a gradual destruction process. The failure mode of the anchoring system can be categorized into two types. This first type involves the loosening and collapsing of the roof when the anchoring force is insufficient or when the anchoring system fails. This failure is characterized by a weakened bonding effect between the anchoring agent and the surrounding rock due to water exposure, which leads to relative slippage, and the anchoring system gradually detaches from the surrounding rock. The second type of failure involves shear damage to the anchoring system. Within the weakly cemented rock layer within the anchoring range, the roof’s anchoring system is typically subjected to shear damage. This often results in the failure of the roof’s support structure.

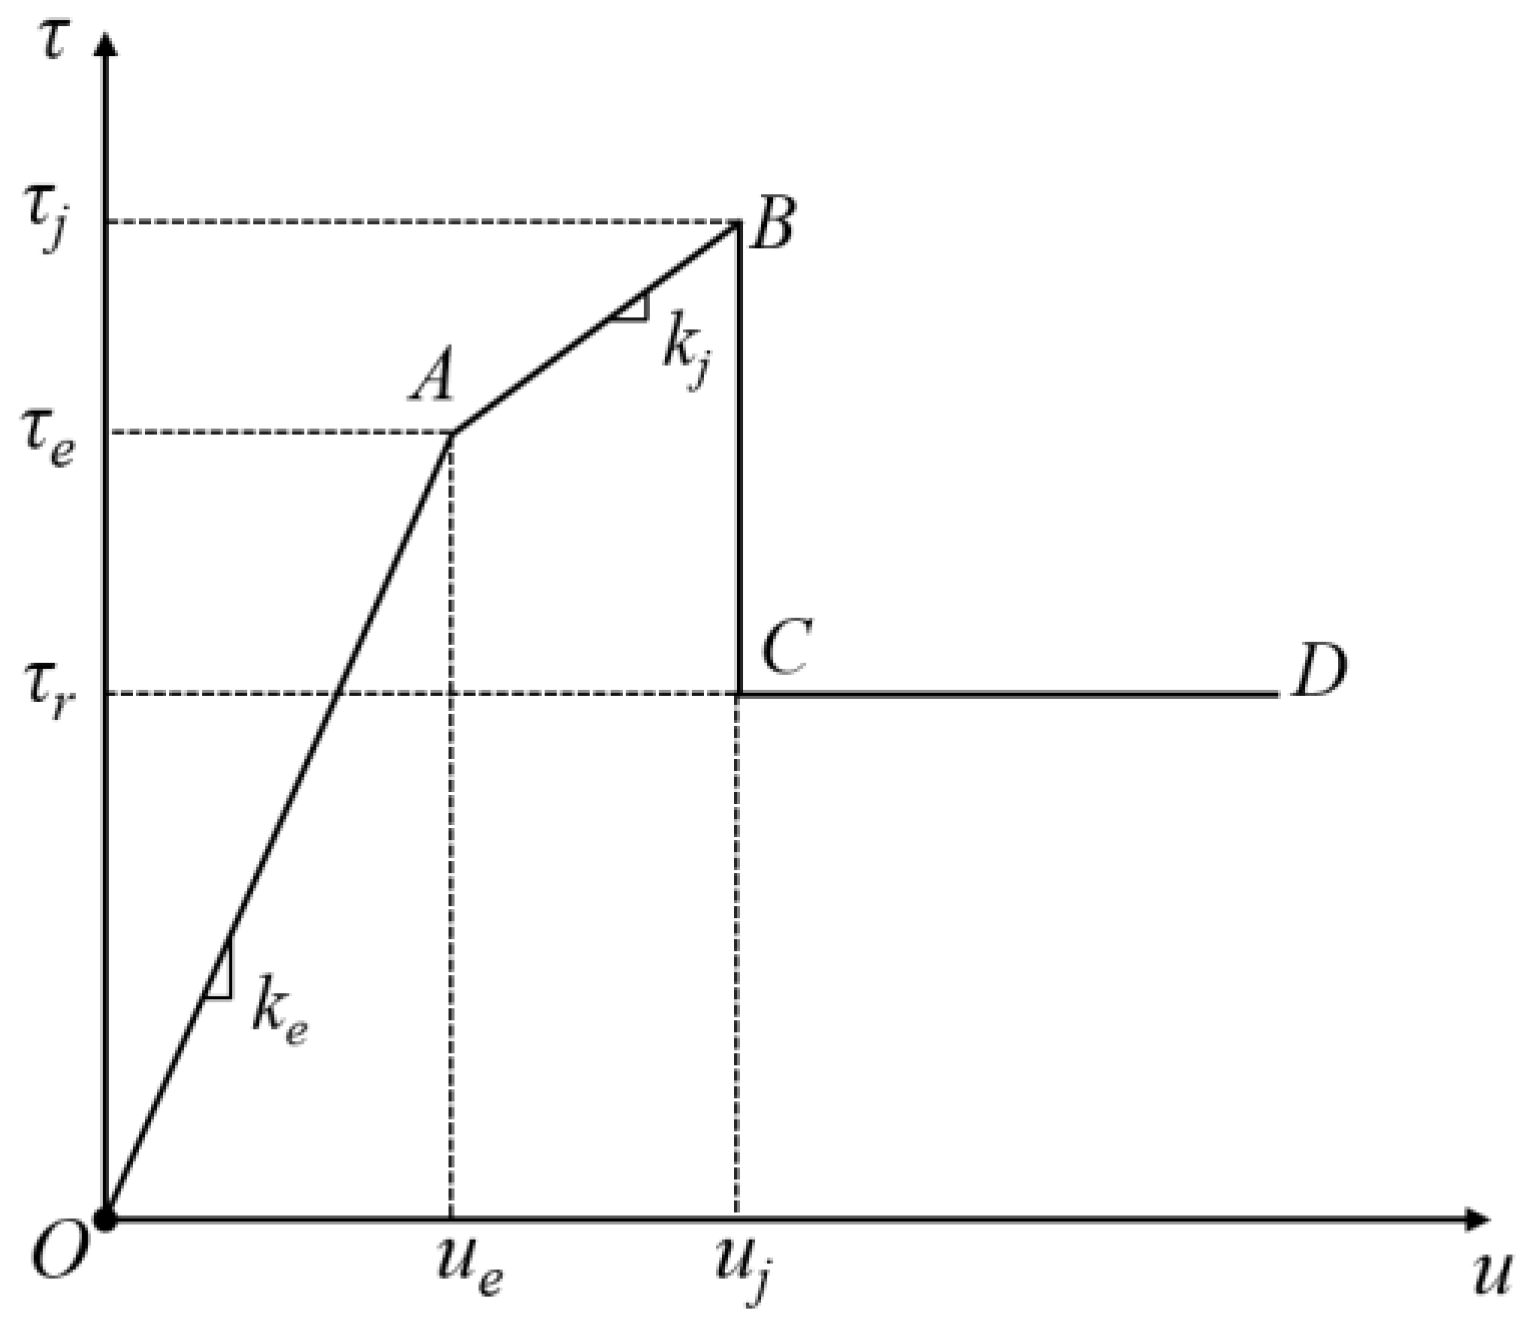
4.1. Anchor Solid Slippage

Under the dual influences of high-level stress and groundwater, the weakly cemented rock layer undergoes loosening and expansion. This results in a weakened preloading force of the anchor solid, leading to slippage. In severe cases, the weakly cemented rock layer and the anchor solid may sink synchronously, leading to a loose-type collapse of the roof. Figure 13 illustrates the cemented slip model of the anchorage interface. An analysis of this figure reveals various trends in shear displacement and the corresponding shear stress at the anchorage interface. These trends are as follows [21]:
  • Elastic phase (OA): The displacement between the anchorage interface is minimal, with no slippage between the anchorage and the surrounding rock. The interaction between the two results in elastic deformation, as represented by the following functional relationship:
    τ = k e u   ( 0 u < u e )
  • Shear-hardening stage (AB): The shear displacement incrementally increases while the curve’s slope decreases. The shear stress at the anchorage interface reaches the peak stage. Given the rough contact interface and low strength of the weakly cemented rock, the anchorage shear stress exhibits a shear-hardening phenomenon upon reaching a specific value due to compression at the anchorage interface:
    t = k j u + ( k e k j ) u e   ( u e u < u j )
  • Decohesion stage (CD): Weakly cemented rocks are poorly cemented. When the shear stress at the anchorage interface surpasses the peak shear stress, the anchoring agent and the surrounding rock are detached. During this stage, the friction at the anchorage interface serves as the primary load-bearing capacity and some residual strength is maintained:
    τ = τ r   ( u u j )
The progressive failure process of the anchor–solid interface in the water-rich and weakly cemented perimeter rock of a roadway can be divided into five stages: the elastic phase, elastic–shear hardening phase, elastic–shear hardening–decohesion phase, shear hardening–decohesion phase, and complete decohesion phase.
Figure 14 illustrates the evolution process of the anchor interface slippage. Under the influence of ground stress and its own load, the tensile force in the rock at the critical surface on the anchor solid gradually intensifies (elasticity). When the shear stress at the end of the anchor solid exceeds the critical shear stress during the elastic phase, the anchor solid transitions from an elastic to a plastic state (elasticity–shear hardening). As the anchor solid continues to endure the tension load, slippage occurs at one end of the anchor solid near the air void surface (elasticity–shear hardening–decohesion) and gradually extends deeper into the anchor solid of the surrounding rock (shear hardening–decohesion). Once the entire anchor solid has slipped, i.e., during the decohesion stage, the fundamental failure of the anchor solid system can be observed (decohesion). In Figure 15, the simulation results confirm this phenomenon. The displacement of the last portion of the anchor interface is greater than that of the surrounding rock, causing the roadway roof anchor solid to move synchronously with the surrounding rock and extend beyond the limits of the roof.

4.2. Anchor Solid Shear Damage

In weakly cemented strata, the interlayer cementation of the roof plate is poor. Under the combined influence of self-gravitational stress and horizontal stress, the roof plate undergoes a bending deformation, which generates shear stress. When this stress surpasses the interlayer shear resistance, shear displacement occurs between the layers, leading to shear damage. This damage is triggered by the lateral displacement force borne by the anchor solid in the rock layer, ultimately leading to roof instability.
Figure 16 illustrates the evolution of roof instability, revealing that under load, the weakly cemented rock layer bends, and shear stress in the roadway roof concentrates at the top corner. When this stress surpasses the shear strength of the roof rock, shear damage occurs, leading to crack formation at the top corner of the roadway (Figure 16b). The crack zone extends upward along the crack propagation angle to the weakly laminated or weakly interlayered surface, which is prone to delamination, and penetrates it. This results in a roof fall, with the fallen roof plate exhibiting a “cone-shaped” [22,23] pattern (Figure 16c). During this process, the anchor solid undergoes shear damage in the crack zone, losing its anchoring effect and falling down with the roof slab.

5. Conclusions

Postmining disturbances and the presence of weakly cemented rock layers with varying levels of moisture content progressively transform the destabilized state of the surrounding rock from a seemingly continuous state to discontinuous and discrete states. Concurrently, the efficacy of anchors is gradually diminished. Through the continuous–discrete coupling method, we investigated the changing characteristics of the surrounding rock in the roadway of weakly cemented strata under different levels of moisture content and the failure mechanism of the anchoring system. The following findings were obtained:
  • When the moisture content of the surrounding rock ω < 5.5%, the evolution of the cracks and force chains is relatively stable. Fewer cracks are present around the roadway, and weak force chain areas are confined to the roadway face. The anchoring system can then exert a certain level of control on the roadway. When the moisture content ω > 5.5%, the number of cracks suddenly increases. The force chain around the roadway transitions from a strong to a weak chain or even disappears, resulting in the severe deformation of the roadway. The roadway roof is most significantly affected by the moisture content. In particular, a water content ω = 5.5% is the water content threshold for the destabilization and damage of the tunnel perimeter rock.
  • The failure mode of the anchoring system within the roadway can be classified into two types. The first type involves the loosening and collapse of the roof when the anchoring force is insufficient or fails. This failure mode becomes evident when the bonding effect between the anchor agent and the surrounding rock weakens due to water exposure, resulting in relative slippage and gradual detachment from the surrounding rock. The second type is the shear damage of the anchoring system. In the weakly cemented rock layer within the anchorage range, the roof anchoring system typically incurs shear damage, leading to the failure of the roof-support structure.
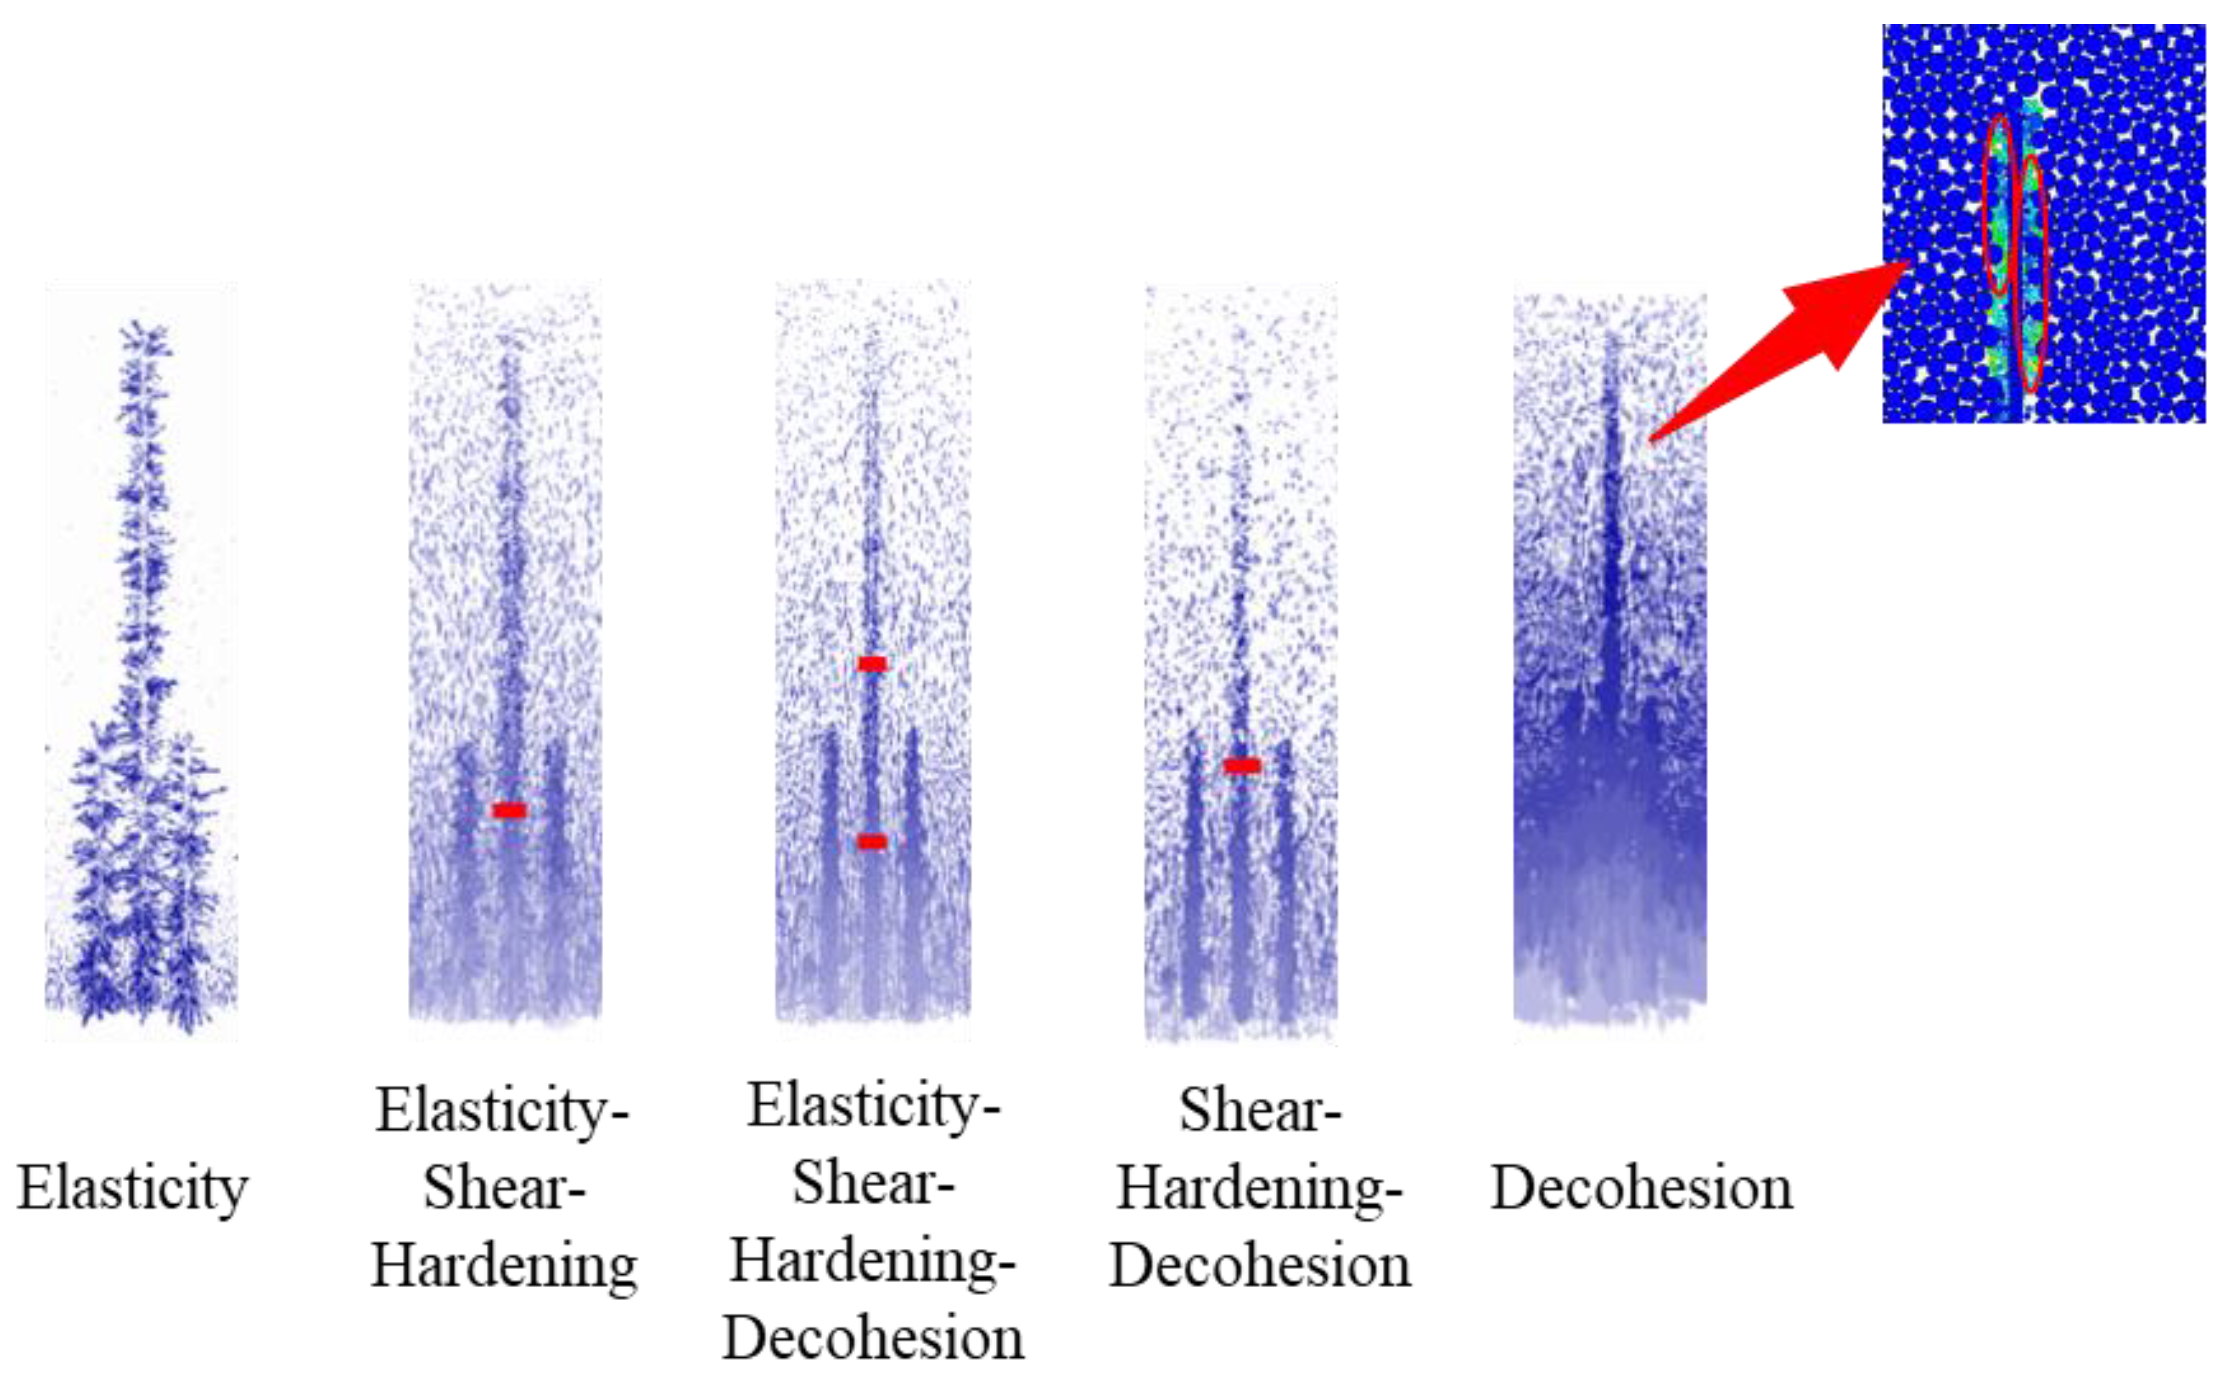
  • In water-rich and weakly cemented strata, anchor failure in the roadway-surrounding rock occurs gradually due to adhesive slippage at the anchor interface. This process can be divided into five stages: elastic, elastic–shear hardening, elastic–shear hardening–decohesion, shear hardening–decohesion, and complete decohesion.
  • The study of the failure law, morphology, and mechanism of the roadway-surrounding rock under different moisture content conditions provides a basis for studying the control of roadway-surrounding rocks in weakly cemented strata. In addition, this study holds a significant value for numerical simulations of underground mining, enabling a more accurate inversion and reproduction of strong rock pressure disaster phenomena observed in the mining areas of weakly cemented strata in Western China.

Author Contributions

Conceptualization, L.S.; methodology, Z.J.; software, Z.J.; validation, Y.L., H.Z. and Q.H.; formal analysis, H.Z.; investigation, Y.L. and Q.H.; resources, L.S.; data curation, H.Z. and Q.H.; writing—original draft preparation, Z.J.; writing—review and editing, L.S.; visualization, Z.J.; supervision, Y.L.; project administration, Z.J. and Y.L.; funding acquisition, L.S. All authors have read and agreed to the published version of the manuscript.

Funding

This research was funded by the National Natural Science Foundation of China (grant no. 52074100) and the Inner Mongolia “Science and Technology to Enhance Mongolia” action key project (grant no. 2022EEDSKJXM009-2).

Data Availability Statement

The data used to support the findings of this study are available from the corresponding author and senior author upon request.

Conflicts of Interest

The authors declare no conflict of interest.

References

  1. Wen, S.Y.; Han, L.J.; Zong, Y.J.; Meng, Q.B.; Zhang, J. Study on acoustic emission characteristics of sandstone uniaxial compression test with different moisture content. Coal Sci. Technol. 2013, 41, 46–48+52. [Google Scholar]
  2. Teng, T. Experimental Study on Acoustic Emission Characteristics of Red Sandstone under Uniaxial Compression with Different Moisture Content. Master’s Thesis, Jiangxi University of Science and Technology, Ganzhou, China, 2019. [Google Scholar]
  3. Meng, Q.; Qian, W.; Han, L.J.; Yu, L.Y.; Wang, C.K.; Zhou, X. Experimental study on formation mechanism and mechanical properties of regenerated structure of very weak cemented rock mass. Rock Soil Mech. 2020, 41, 799–812. [Google Scholar]
  4. Zhang, S. Study on the Weakening Mechanism of Interfacial Stability of Mudstone and Anchor with Different Moisture Content. Master’s Thesis, China University of Mining and Technology, Xuzhou, China, 2020. [Google Scholar]
  5. Xu, H.W. Study on Damage Mechanism of Water-Rich Soft Rock and Supporting Control of Roadway. Master’s Thesis, Shandong University of Science and Technology, Qingdao, China, 2017. [Google Scholar]
  6. Zhao, Z.; Yang, P.; Zhang, M.Z.; Lv, X.Z.; Chen, S.J. Stability of weakly cemented soft surrounding rock under combined effect of water environment and inhomogeneous ground stress. J. Min. Saf. Eng. 2022, 39, 126–135. [Google Scholar]
  7. Lu, H.; Qin, B.; Wang, B. Study on surrounding rock failure and control technology of roof water drenching roadway. Coal Technol. 2021, 40, 25–29. [Google Scholar] [CrossRef]
  8. Wang, X.; Zhang, H.; Li, G. Study on surrounding rock control technology of weakly cemented water-rich roof in roadway. Coal Sci. Technol. 2018, 46, 88–92+98. [Google Scholar]
  9. Fang, X.; Xue, G.; Liang, M.; Fan, H. Micro-failure mechanism and bolt-grouting reinforcement support technology of water-bearing sandstone roadway. J. China Univ. Min. Technol. 2014, 43, 561–568. [Google Scholar]
  10. Zhang, C.; Bai, Q.; Han, P. A review of water rock interaction in underground coal mining: Problems and analysis. Bull. Eng. Geol. Environ. 2023, 82, 157. [Google Scholar] [CrossRef]
  11. Sun, L.; Jiang, Z.; Long, Y.; Ji, Q.; Wang, Z.; Fan, Y.; Hao, Y. Influence of mesoscopic parameters of weakly cemented rocks on macroscopic mechanical properties. Sustainability 2022, 14, 13308. [Google Scholar] [CrossRef]
  12. Sun, L.; Long, Y.; Li, X.; Jiang, Z.; Fan, Y.; Wang, Z.; Han, X. Effect of loading rate on the mechanical properties of weakly cemented sandstone. Sustainability 2023, 15, 2750. [Google Scholar] [CrossRef]
  13. Li, D.D.; Hu, H.R.; Wang, X.M. Tunnel excavation and bolt support particle flow model based on PFC-FLAC discrete-continuous coupling analysis. J. Wuhan Univ. Eng. Ed. 2023, in print, 1–9. Available online: http://kns.cnki.net/kcms/detail/42.1675.T.20230215.1743.009.html (accessed on 30 July 2023).
  14. Xu, J.; Wang, X.; Zhang, Q.; Chen, C.; Chen, Y. Experimental study on damage evolution of tuff under different moisture states. J. Min. Saf. Eng. 2021, 38, 1189–1197+1209. [Google Scholar]
  15. Wei, J.; Wang, S.; Song, S.; Sun, Q. Numerical simulation on evolution law of overburden fractures and surface cracks in crossing ditch mining of shallow coal seam. Coalf. Geol. Explor. 2022, 50, 67–75. [Google Scholar]
  16. Wang, J.; Han, X.; Pang, W.; Liang, C.; Wang, M. Photoelastic experimental study on the force chain structure and evolution in top coal and overlaying strata under fully mechanized top coal caving mining. J. Eng. Sci. 2017, 39, 13–22. [Google Scholar]
  17. Ye, D.; Liu, G.; Wang, F.; Gao, F.; Yang, T.; Zhu, J. Fractal hydrological-thermal-mechanical analysis of unconventional reservoir: A fracture-matrix structure model for gas extraction. Int. J. Heat Mass Transf. 2023, 202, 123670. [Google Scholar] [CrossRef]
  18. Ye, D.; Liu, G.; Ma, T.; Cheng, G.; Fan, S.; Yang, T. The mechanics of frost heave with stratigraphic microstructure evolution. Eng. Geol. 2023, 319, 107119. [Google Scholar] [CrossRef]
  19. Yang, L.; Li, J.; Liu, H.; Jiao, H.; Yin, S.; Chen, X.; Yu, Y. Systematic review of mixing technology for recycling waste tailings as cemented paste backfill in mines in China. Int. J. Miner. Metall. Mater. 2023, 30, 1430–1443. [Google Scholar] [CrossRef]
  20. Han, P.; Zhang, C.; He, X.; Wang, X.; Qiao, Y. DEM fluid–solid coupling method for progressive failure simulation of roadways in a fault structure area with water-rich roofs. Geomech. Geophys. Geo-Energy Geo-Resour. 2022, 8, 194. [Google Scholar] [CrossRef]
  21. Wang, H. Study on Failure Mechanism of Rock Anchorage and Bearing Performance of Prestress Anchored Surrounding Rock. Master’s Thesis, Shandong University, Jinan, China, 2015. [Google Scholar]
  22. Cai, J.L.; Tu, M.; Zhang, H.L. Deformation and instability mechanism and control technology of mining gateway for Jurassic weak-cemented soft rock roadways. J. Min. Safety Eng. 2020, 37, 1114–1122. [Google Scholar]
  23. Sun, L.; Ji, H.; Jiang, H.; Zeng, P.; Yang, B.S. Experimental study on characteristics of broken caving and regularity of compaction deformation of rocks in caving zone in the weakly cemented strata. J. China Coal Soc. 2017, 42, 2565–2572. [Google Scholar]
Figure 1. Principle of continuous–discrete coupling.
Processes 11 02556 g001
Figure 3. Continuum-coupled model: (a) continuum-coupled model and boundary conditions; (b) excavation inspection points.
Processes 11 02556 g003
Figure 4. Coal and sandstone fitting curves under varying levels of moisture content (the following moisture content proportions are expressed in “%”): (a) 3-1 coal; (b) medium sandstone (0% moisture content); (c) medium sandstone (2.3% moisture content); (d) medium sandstone (5.5% moisture content); (e) medium sandstone (7.72% moisture content).
Processes 11 02556 g004aProcesses 11 02556 g004b
Figure 5. Culvert support design.
Processes 11 02556 g005
Figure 6. Continuous–discrete coupled model displacements and their vector plots: (a) coupled-domain displacement maps; (b) vector diagram of coupled-domain displacements.
Processes 11 02556 g006
Figure 7. Culvert support method and the contact effect.
Processes 11 02556 g007
Figure 8. Vector plot of the displacement of the anchor and nearby rock mass.
Processes 11 02556 g008
Figure 9. Deformation cloud diagram of the surrounding rock in the tunnel with varying levels of moisture content: (a) ω = 0%; (b) ω = 2.3%; (c) ω = 5.5%; (d) ω = 7.8%.
Processes 11 02556 g009
Figure 10. Displacement curve of the roadway with different moisture content rates: (a) axial displacement curve; (b) displacement curves of the two gangs of the roadway.
Processes 11 02556 g010
Figure 11. Cracks in the perimeter rock of the roadway under varying levels of moisture content: (a) ω = 0%; (b) ω = 2.3%; (c) ω = 5.5%; (d) ω = 7.8%.
Processes 11 02556 g011
Figure 12. Cloud diagram of the evolution of the force chain of the surrounding rock in the roadway under varying levels of moisture content: (a) ω = 0%; (b) ω = 2.3%; (c) ω = 5.5%; (d) ω = 7.8%.
Processes 11 02556 g012aProcesses 11 02556 g012b
Figure 13. Anchor interface bond-slip modeling.
Processes 11 02556 g013
Figure 14. Water-rich weakly cemented strata roadway perimeter rock anchorage interface slip evolution process.
Processes 11 02556 g014
Figure 15. Anchor solid slip.
Processes 11 02556 g015
Figure 16. Evolution of top plate instability: (a) initial lane; (b) generation of top corner cracks; (c) roof slab emplacement.
Processes 11 02556 g016aProcesses 11 02556 g016b
Table 1. Physical–mechanical parameters of the coupled continuous element mesh.
Lithologyρ/kg·m−3K/GPaC/MPaφ/(°)σt/MPa
Fine sandstone28208.53.1422.2
Siltstone26507.92.4351.8
Gritstone25009.53.8403.3
Sandy mudstone19604.72.9332.4
Medium sandstone (0% moisture content)22502.71.96.1526.1
Medium sandstone (2.3% moisture content)22502.11.74.9222.3
Medium sandstone (5.5% moisture content)22501.81.43.5219.3
Medium sandstone (7.8% moisture content)22501.71.13.0417.8
3-1 Coal13801.70.6180.5
Carbonaceous mudstone14502.00.7190.6
Table 2. Parallel adhesive contact parameters of coupled discrete element particles.
GroupsLinear Contact ParametersParallel-Bonding Model Parameters
FormEmod
/GPa
kratiopb_emod
/GPa
pb_kratiopb_coh
/MPa
pb_ten
/MPa
pb_fa
/(°)
3-1 Coal1.51.51.51.53.73.718
Medium sandstone (0% moisture content)1.51.01.51.08.212.340
Medium sandstone (2.3% moisture content)1.41.131.41.135.310.036.4
Medium sandstone (5.5% moisture content)1.251.321.251.323.569.134.2
Medium sandstone (7.8% moisture content)1.11.551.11.552.138.632.6
Disclaimer/Publisher’s Note: The statements, opinions and data contained in all publications are solely those of the individual author(s) and contributor(s) and not of MDPI and/or the editor(s). MDPI and/or the editor(s) disclaim responsibility for any injury to people or property resulting from any ideas, methods, instructions or products referred to in the content.

