Abstract
Yb (III) shows complex behavior of coordination dissolution and precipitation in carbonate solutions, but the properties of coordination and hydration to Yb (III) in the solution have not been explicated. In this work, the dissolution rule of Yb (III) with concentration has been studied. The radial distribution function and the coordination number of and to Yb (III) were calculated by molecular dynamics simulation, and the complex ion form of Yb was obtained. The ultraviolet–visible spectrum and the ionic structures of Yb (III) complex ions were geometrically optimized and calculated by using density functional theory. Then, the experimental ultraviolet–visible spectra and density functional theory results were combined to verify the molecular dynamics calculations. The results indicate that Yb (III) undergoes precipitation in low-concentration carbonate solution, but, in high-concentration carbonate solution, Yb (III)’s carbonates will undergo dissolution. The main reason for the dissolution of Yb (III)’s carbonates is the coordination effect of on Yb (III); the coordination of carbonate on Yb (III) occurs with a concentration range of 0.4~2.0 mol·. Yb (III) mainly exhibits hydrated form in the aqueous solution, while, in the carbonate solution, is converted into complex. complex is the main ionic form in high-concentration carbonate solutions. The analysis method in this work provides guidance for understanding the coordination and hydration characteristics of oxyacid radicals to rare earth elements.
1. Introduction
As a strategic resource, rare earth elements (REEs) are widely used in permanent magnet materials, hydrogen storage materials, and aerospace and national defense applications, as well as in alternative energy vehicles [1,2,3]. Due to their unique properties, REEs can not be substituted by other materials, and they are of significant importance to modern industries [4,5].
The solubility product (Ksp) of Lanthanide (Ln) carbonates in water solutions is very small, and their carbonate solubility is merely ~ mol· [6]. Hence, in industrial production, we can precipitate rare earth carbonate to separate rare earth elements [7]. But, in fact, due to the hydration and coordination characteristics of rare earth ions, the loss of rare earth elements in the precipitated solution is significant, especially for heavy rare earth elements [8]. In recent years, serious environmental issues have been caused by ammonia nitrogen precipitation of rare earth processes, so sodium carbonate and sodium bicarbonate precipitation have been used as a substitute for ammonium bicarbonate [9]. For this reason, many researchers have carried out research in this area of technology [10], but almost all of them have concentrated on the precipitation application of sodium carbonate and sodium bicarbonate. The properties of coordination and hydration on RE ions has not been made clear and systematic in the solutions [11].
Study on the coordination and hydration behavior of rare earth carbonate ions, using available related spectral studies, for example, by UV spectra, infrared, and near-infrared spectra, and a lot of similar work has been performed in order to clarify the structure of rare earth coordination ions [12]. Jeanvoine et al. [13] reported that, through theoretical calculation, if carbonate ions in the solution system are not limited, Ln(III) ions will appear as tetra-carbonate complex ions [14]. Philippini et al. have studied several Ln(III)-carbonate complexes [15], without considering the interaction of water molecules, and have concluded that the light RE ions can coordinate with four , while heavy RE can only coordinate with three [16].
Modern computational and spectroscopic research methods have made significant progress in analyzing the coordination behavior of RE ions in solution [17], but some existing research conclusions involved are extrapolated, and some relevant laws of different rare earth carbonates are obtained through analogy [18]. In carbonate solutions of different concentrations, due to the complex and diverse structure of rare earth complex ions in carbonate solutions, the behavior of dissolved RE ions is still unclear and unsystematic for the entire series of REEs [19]. On the hydration and carbonate coordination characteristics of REEs, Martelli et al. [20] obtained remarkable results through studying the ionic structure and coordination kinetics of RE complexes using polarization MD calculation, and Jeanvoine et al. [13] have calculated the bonding forms of RE(III) 3- and 4-carbonate coordination ions using DFT. Their main conclusions were that the most stable forms are fully bidentate structure in the gas phase, and the full bidentate forms are also the most stable complexes, explicitly without considering the H2O molecular interactions in the solutions [21]. These conclusions are of great significance for future research on RE carbonates.
Based on previous studies on the REE dissolution law and complex ion forms [22,23], in this work, by taking Yb (III) in high concentration solutions as a representative example of REEs, the coordination and hydration properties were investigated. We conducted the dissolution experiments, and molecular dynamics (MD) simulations of the actual solution were carried out considering coordination and hydration actions simultaneously. Next, we carried out density functional theory (DFT) calculations and UV-vis spectral experimental determination, and we analyzed the composition and ionic behavior of Yb (III) in high-concentration carbonate solution. The analysis method of this research provides guidance for understanding the coordination and hydration characteristics of oxyacid radicals to rare earth elements.
2. Methods and Materials
2.1. Raw Materials
The original solution for conducting the dissolution experiment of Yb in sodium carbonate solution was a high-purity ( concentration of 0.3421 mol·), determined by ICP-MS (ULTIMA2, HORIBA Jobin Yvon, Paris, France), and its distribution is shown in Table 1. Other non-rare earth impurity elements were all below 0.5 µg·m.

Table 1.
Contents of the high-purity solution of .
2.2. Research Methods
2.2.1. Dissolution Experiments
We prepared 0.4, 0.8, 1.2, 1.6, and 2.0 mol of Na2CO3 solutions. We put 100 mL of each solution into conical bottles, then we dropped the YbCl3 solution into the bottle while using a water bath to maintain the solution at 35 ± 1 degree. At first, a white precipitate was generated, but, as the conical flask shook, the white precipitate dissolved. We continued to add material by dropping until the white precipitate no longer dissolved [23]. At this point, the solution was separated by using a centrifuge (TGL-16MS, Anxin Experimental Instrument Co., Ltd. (Yancheng, China)) at 8000 rpm for 12 min, and the Yb concentration in the solution was measured by ICP-Ms.
2.2.2. MD and DFT Calculations
In this work, we use the MD method to study the coordination and hydration properties of Yb (III) by using the Materials Studio 8.0 [24] software. The SPC/E water model was used [25], and the radial distribution function (RDF) and coordination number in the carbonate solution system were calculated and analyzed [26]. At first, water molecules, Yb ions, and other particles in the solution were randomly distributed in the cubic system built by the amorphous cell module [27]. For the high-concentration sodium carbonate solutions, in order to ensure the adaptability of the force field, we selected universal as the computational force field, geometrically optimized by the Smart method [28]. In the simulation calculation process, we set the calculation step to 1 fs, to make the calculation converge, and set the total calculation time to 1000 ps. Andersen mode was set for temperature control in this study, and the dynamics calculation was carried out at 308 K, that is, at the dissolution experimental temperature, and actualized in an NVT ensemble [29]. The calculated temperature change curves were stable within 308 K ± 10%, and there was no obvious disturbance in the temperature change [30]. Calculated energy also tended to stabilize. The calculation results converged and were considered credible. The - solution model was conducted for molecular dynamics simulations, and the corresponding calculation information is shown in Table 2 (system a). Based on real experimental solution systems, we constructed - solution models with different concentrations (0.4, 0.8, 1.2, 1.6, and 2.0 mol·), then performed molecular dynamics simulations by using the same method, and their corresponding calculation information is also shown in Table 2 (systems b, c, d, e, and f).
Table 2.
Calculation parameters of the solution models.
Based on the molecular dynamics simulation results of the above solution system, the calculated UV spectrum and geometric optimization structure of the Yb (III) complex ions were calculated by using DFT methods [31]. In the Materials Studio 8.0 platform, we chose the DMol3 module to perform DFT calculations [32]. Using Generalized Gradient Approximation (GGA-PBE), we calculated the theoretical spectral properties of the complex ions by using the COSMO model [33]. The calculation parameters set the functional to DND4.4, and other running sets, such as track cutoff, integration precision, and SCF tolerance, were all specified as Fine. We selected the Electronic tab and checked the Use dissolution model checkbox to calculate the spectral theoretical characteristics of Yb carbonate complex ions and hydration ions. In this section, the most stable Yb (III) complex ion composition was obtained through molecular dynamics calculations, and, after DFT geometric optimization was performed, a reasonable Yb (III) complex ion structure (ball and rod model) and theoretical UV spectrum were obtained. This was used for mutual verification with the experimental solution UV spectrum.
2.2.3. UV Test
Exploratory experiments showed that the coordination behavior of Yb (III) carbonate complex ions can be quickly analyzed by testing the UV-vis spectrum (UV-5500-PC, Shanghai Yoke Instrument Co., Ltd. (Shanghai, China)). Its scanning wavelength is 190–1000 nm [34]. In this section, we use experimental UV spectroscopy to verify the MD calculation results. After adding Yb (III) to the solutions with different concentration of , the absorption spectrum of each solution system was tested. We transferred 1 mL of solution to 25 mL of sodium carbonate solution using a pipette, and the concentrations of these substrate solutions were 0.2, 0.4, 0.8, 1.2, 1.6, and 2.0 mol·. The mixtures were shaken well at 35 ± 1 °C, and then the solutions were removed and centrifuged for separation (the centrifuge temperature was set to 35 ± 1 °C, and samples were centrifuged at 8000 rpm for 12 min). Next, the centrifuged supernatants were scanned in the UV spectrum by using a quartz cliometric dish and taking pure water as the reference zero scale. The dissolved also causes a certain absorption band of the solvent; in order to provide a blank control analysis, we used a pipette to transfer 1 mL H2O to 25 mL sodium carbonate solution with different concentrations. The UV-vis spectrum of the blank control solutions was determined in the same way.
3. Results and Discussion
3.1. Yb (III) Dissolution Law
The samples were maintained at a dissolution temperature of 35 ± 1 °C. The dissolution law of Yb (III) in sodium carbonate base solutions with different concentration is exhibited in Figure 1.
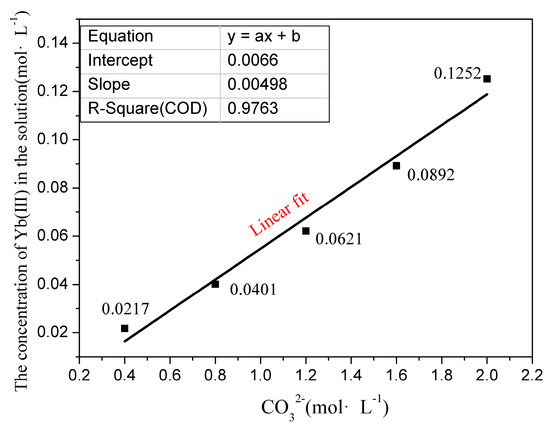
Figure 1.
The dissolution law of Yb (III) in different concentration solutions.
The solubility product (Ksp) of Yb carbonates in water is 31.67 ± 0.78, and its solubility is very small in aqueous solution. As can be seen from Figure 1, increasing the concentration of increases the dissolved amount of Yb (III); in a sense, this seems to violate common sense. In this part of the experiment, a precipitate instantly generated when was added to the sodium carbonate solution, but the white precipitate dissolved within a certain period. When the dropped Yb (III) amount exceeded the maximum saturation solubility, the solutions become cloudy, which appeared as a solid phase of suspended matter. In this case, when white precipitates were generated, the molar concentration of Yb (III) ions dissolved in the solution was considered the maximum saturation solubility. It can be seen from Figure 1 that the Yb (III) maximum saturation solubility in sodium carbonate solutions (with concentration of 0.4, 0.8, 1.2, 1.6, and 2.0 mol·) are up to 0.0217, 0.0401, 0.0621, 0.0892, and 0.1252 mol·, respectively. The Yb (III) maximum saturation solubility has a linear relation with concentration. It approaches a linear relationship y = 0.0066x + 0.005, and its linear correlation coefficient reaches 0.976. The interesting issue is that YbCl3 presents a low solubility in low-concentration sodium carbonate solutions, and may even precipitate rapidly, but YbCl3 exhibits a significant solubility in high-concentration sodium carbonate solutions. When the carbonate concentration is 0, YbCl3 is soluble in aqueous solution, and the extrapolation of the equation in Figure 1 can not qualitatively match the results of the pure aqueous solution data. RECl3 presents a low solubility in low-concentration sodium carbonate solutions and may even precipitate rapidly. The solubility in pure water can be calculated based on the solubility product (Ksp) of rare earth carbonate. Just like some heavy rare earth elements, YbCl3 exhibits a significant solubility in high-concentration sodium carbonate solutions, with a concentration range of 0.4~2.0 mol·. The concentration of carbonate cannot be further increased; it is limited by the saturated solubility of sodium carbonate in aqueous solution. At 35 °C, during the experiment, we achieved a concentration of 2.0 mol/L sodium carbonate, which is close to the saturated solubility of sodium carbonate. Based on the experimental results, we conducted research on MD and DFT in this work by building real solution models with different concentrations.
3.2. Molecular Dynamic Calculations
3.2.1. Radial Distribution Function and Coordination Behavior
In this paper, the calculation meaning of the Radial distribution function (RDF) needs to be explained. It is a g(r) function in the form of Equation (1), and RDFs are conducted on the MD results. The average coordination number (Cn) between the components in the system is calculated using Equation (2), according to RDF [35]. The integral variable dr of the g(r) function is shown in Figure 2.
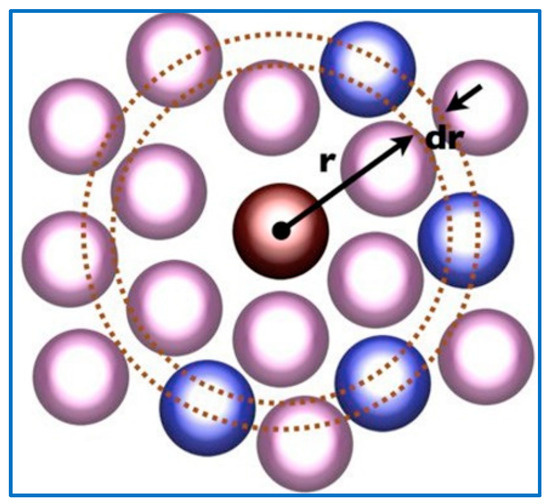
Figure 2.
Schematic diagram of integral variable for g(r).
The values of g(r) and Cn are calculated as follows:
where r is the intercept radius, V is the total volume, N is the number of each particle in the solution model, ρ is the quantity density of the coordination atom or molecule, and n is the total number of integrating particles from r to r + dr.
Before the MD results are reported and discussed, the meaning of the particles analyzed in the simulation system under study should be explained first. is the oxygen atom in the near shell (defined as the first layer) of Yb (III) complex ions, while is the oxygen atom in the carbonate far the shell (defined as the second layer), and is an oxygen atom in molecule. The RDFs and Cn of each ion pair for -OC, -, and - are calculated after the MD simulations are converged. The calculation results appear in Figure 3, Figure 4 and Figure 5 in detail.
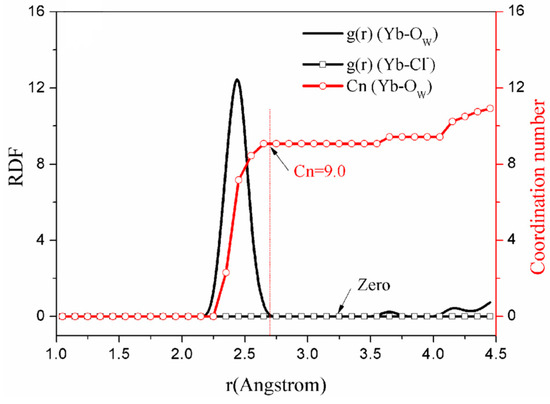
Figure 3.
The simulation result of solution model (System a).
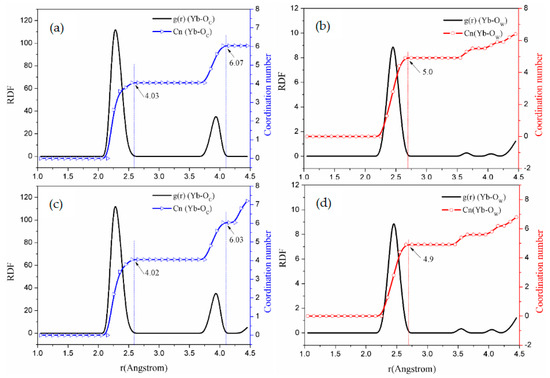
Figure 4.
The curves of RDF and coordination number for - solution simulations. (System b: (a,b); System c: (c,d)).
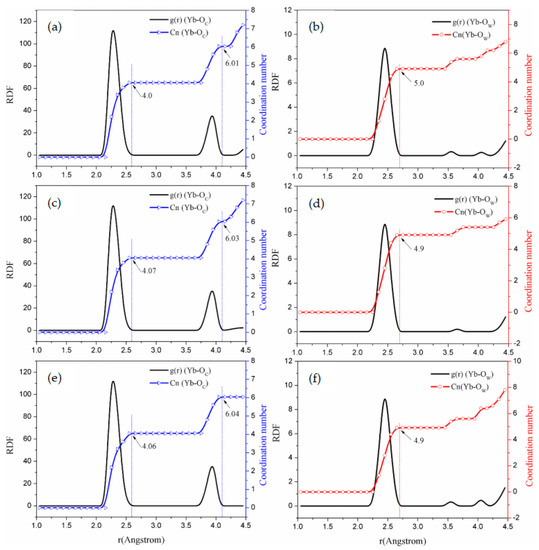
Figure 5.
RDF and coordination number graphs of solution simulations. (System d: (a,b); System e: (c,d); System f: (e,f)).
Figure 3 shows, in the aqueous solution in model a, that there are 9.0 molecules coordinated with Yb (III) in the first shell [35]. In addition, the coordination mode of molecules to cations is that the O atoms interact with the central atom or ion [36], which is a generally accepted notion. From Figure 3, it can also be observed that the RDF intensity of to is zero, and the coordination behavior between and did not occur.
It can be seen from Figure 4 and Figure 5 that the RDFs for , , and to Yb (III) directly reflect the interaction of the ions in the carbonate solution system. Within the range r < 0.26 nm [37], it is assumed that H2O molecules hydrate Yb (III). In the - solution system, as the concentration of increases, within the first shell, the to Yb (III) coordination number is reduced from 9.0 to 5.0. Therefore, two supplant molecules in the carbonate solution [38].
Considering the coordination of to Yb (III), Figure 4 and Figure 5 show that the g(r) function is integrated to r < 2.6 Å by using Equation (2) in the first shell, integrating to the RDF first peak valleys of to Yb (III). And when the g(r) function is integrated to r < 4.0 Å by using Equation (2), the integration into the second peak valleys occurs.
Table 3.
The MD simulation results of the solution models.
Figure 4 and Figure 5 display that the O atoms of carbonates exhibit a short-range ordering pattern. In addition, is distributed in the first shell layer, while is distributed in the second shell layer. According to the statistical values in Table 3, when the concentration of the solution is 0.4~2.0 mol·, the peak positions of the first shell are all 2.32 Å, and the peak positions of the second shell are all 3.95 Å. This means that changing the concentration of the - solution does not change the RDF peak position but only affects the g(r) peak value. Based on these simulation results of molecular dynamics, Yb (III) is in form of in the solution, while, in the sodium carbonate solution, two pass through the molecular shell from far away and enter the first ordered layer and coordinate for Yb (III). This behavior replaces the two molecules of the first shell of Yb(III), so that is converted into complex ion.
3.2.2. Coordinating Behavior
In the previous section, we obtained the composition of hydrated ions and carbonate complex ions of Yb (III). From the above MD results, it can be seen that there are two O atoms in ions, which are distributed in the Yb (III) first shell layer, while one remaining O atom is distributed in the second shell layer. We referred to the relevant literature [39] and found that the coordination bond distance between the ligand and the central ion is r < 2.6 Å [40]; therefore, we believe that two atoms of are coordinated with Yb (III), and the remaining atom is connected to C atoms in the form of double bonds.
In order to describe the coordination mode of to Yb (III), we suppose that the coordination mode of to Yb (III) is in full bidentate form [20,23]. is the bond length between the Yb atom and the in first shell layer, and is the bond length between Yb (III) and in second shell layer. Their relative positions are shown in Figure 6. During molecular dynamics calculations, is considered to be a rigid particle where ∠YbCO = 60° and ∠OCO = 120°; after geometric optimization of carbonate particles, the values of and are considered to be approximately equal and are 1.269 Å.
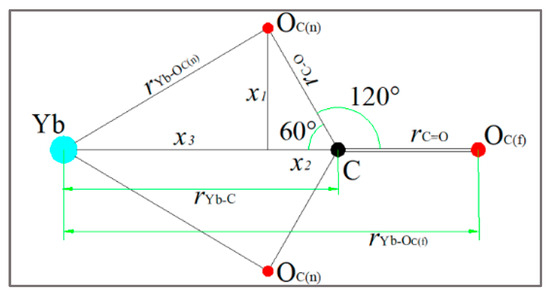
Figure 6.
Coordination schematic of to Yb (III).
Based on the results of Table 3, and referring to previous research results [23], the relationship between and can be known through the following process:
By taking the and values into Equation (7), can be calculated.
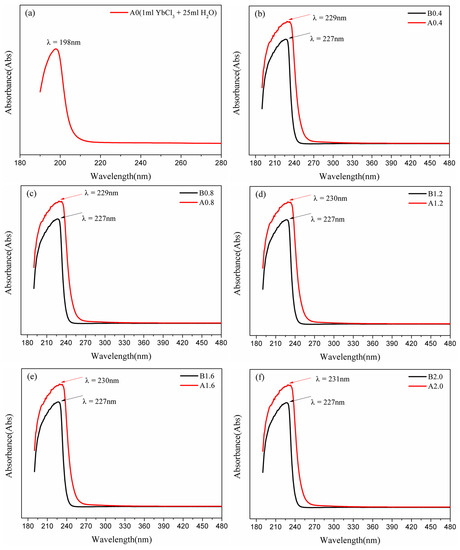
Figure 7.
UV test results of the - solution (a) and the - solution(b–f). (The lines of A0.4, 0.8, 1.2, 1.6, and A2.0 are the UV-vis absorbance curves, which tested by adding 1 mL of YbCl3 to 25 mL solutions of 0.4, 0.8, 1.2, 1.6, and 2.0 mol· Na2CO3, after dissoluting, the mixture solutions were centrifuged, and the supernatant is subjected to UV-vis full-wavelength scanning. The lines of B0.4, 0.8, 1.2, 1.6, and 2.0 were tested by adding 1 mL of pure water to 25 mL solutions of 0.4, 0.8, 1.2, 1.6, and 2.0 mol· Na2CO3).
According to the MD results in Table 3, for ordered particles around Yb (III), short-range, : are almost 2:1 in - solutions, as with simulation systems b, c, d, e, and f. The calculated distances of and are in agreement with Equation (8). Therefore, the coordinating behavior for to Yb (III) is in the form of bidentate coordination, and only in bidentate coordinating in - solutions. The atom is directly bonded to Yb (III), meaning that the (RDF first peak valley) is the average Cn of O element to Yb (III) [41]; hence, the two provide the coordination number of 4.0 for Yb (III), while the number of molecules directly acting on Yb (III) in carbonate solution is 5.0. Therefore, in the - solution, the total coordination number of Yb is 9.0, which is consistent with the coordination number in - solution.
3.3. UV-Vis Spectrum
In this section, the meanings of the experimental results should be explained. A0 means to drop 1 mL of solution into 25 mL of water to measure the solution sample, and its spectral curve was obtained through UV scanning [23]. A0.4, A0.8, A1.2, A1.6, and A2.0 are the UV-vis absorbance curves [27] tested by dripping 1 mL to 25 mL solutions, in which the concentrations were 0.4, 0.8, 1.2, 1.6, and 2.0 mol·, respectively. The solutions were centrifuged after mixing, then we took the supernatant for measurement. B0.4, B0.8, B1.2, B1.6, and B2.0 were determined by dripping 1 mL to 25 mL solutions with different concentrations [29]. The experimental UV-vis absorption curves are presented in Figure 7.
Figure 7a shows that the - solution system exhibits a UV spectrum absorption peak at λ = 198 nm, while Figure 7b–f illustrate the absorption peaks of the - solutions (with concentrations of 0.4, 0.8, 1.2, 1.6 and 0.8 mol·) at λ = 229~231 nm. The UV spectrum absorption curves of A0.4 and B0.4, A0.8 and B0.8, A1.2 and B1.2, A1.6 and B1.6, and A2.0 and B0.4 are similar, but A0.4, A0.8, A1.2, A1.6, and A2.0 peak absorbances at λ = 229~231 nm are significantly stronger than the corresponding blank control spectrum. It is necessary for the composition of Yb(III) complex ions calculated by MD to be verified by DFT methods in order to further clarify the structure and coordination behavior in the high-concentration sodium carbonate solutions.
3.4. Structure and UV Spectrum of DFT Calculations
Based on the MD simulation results, in order to analyze the coordination behavior of ions in the solutions more systematically, the role of water molecules in the RDF first shell layer of the Yb(III) complex ion should be considered [27]. Yb(III) complex ions were optimized considering hydration by DFT calculation. Figure 8 shows the optimized structure and the calculated UV spectrum of the and complex ions by DFT.
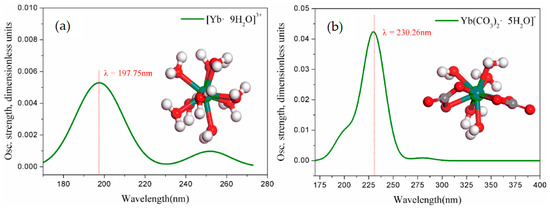
Figure 8.
(a), (b) structures and calculated UV spectra (green balls represent the Yb element, red balls represent the O element, and black balls represent the C element).
The experimental results of Figure 7 were the UV spectrum curves, which were measured by UV-vis scanning [27]. In fact, it is the overlap of the absorption bands generated by Yb (III) complex ions (including ,) and the absorption curves of the sodium carbonate itself [23]. The solubility of YbCl3 in sodium carbonate solution increases with the increase in concentration, rather than the complete precipitate. In low-concentration sodium carbonate solution, Yb exists in the form of [Yb9H2O]3+, but, when tested with pure water as the baseline, the sodium carbonate solvent itself exhibits a certain absorbance. Although the solvent appeared in the UV absorption band of itself [40], the wavelength of the characteristic peak position of the UV spectrum in Figure 7a is consistent with the calculated UV spectral absorption wavelength in Figure 8a. The experimentally tested UV and the calculated DFT results verify that is the hydrated ion form in the solution. Moreover, the experimental UV spectrum characteristic absorption peak positions of A0.4, A0.8, A1.2, A1.6, and A2.0 (at λ = 229~231 nm) are all in agreement with the UV spectrum of Figure 8b. Therefore, the DFT calculated results and the experimental UV spectrum are consistent, which proves that the Yb (III) complexes are in form of in .
To verify the consistency between the UV spectra and the theoretical calculations, we contrast the bond length of Yb (III) complex ions calculated by DFT [42]. The bond lengths of the and complex ions are listed in Table 4.
Table 4.
The bond length information of Yb (III) complex ions.
In previous molecular dynamics studies, the first shell layer of the O atoms of and interacting with the Yb (III) were mainly analyzed. Comparing the data in Table 3 and the bond length information in Table 4 in detail, we can find that the of model a is consistent with the bond length of Yb-; the (of models b, c, d, e, and f) is in agreement with the bond length of Yb-; and the is very close to the bond length of Yb-. In short, the structure and composition of Yb (III) complexes calculated by MD are validated by DFT calculations and experimental UV-vis spectra.
According to the morphology of Yb (III) and the behavior of other ions in the - solution system, we can know that there are the dynamic balances of the chemical reactions, as follows:
In the aqueous solution, nine molecules are coordinated in the Yb (III) first shell, and, when Yb (III) is present in the high-concentration solutions, as in the reaction of process Equation (13), transforms to , replacing the four molecules of the first shell with two . Under different concentration - solutions, the coordination behavior of Yb (III) is consistent with the conclusion reported by Johannesson [41]. The obtained bidentate coordination mode is also consistent with the conclusion reached by Martelli [20]. With the concentration increasing, the reaction of Equation (13) is promoted in the positive direction [42], increasing the solubility of Yb (III) in a high-concentration sodium carbonate solution, resulting in excessive RE loss during the precipitation process of rare earth carbonate [43,44]. In high-concentration carbonate solutions, due to the coordination effect of on Yb (III), the result is that rare earth carbonates undergo dissolution. The coordination of the carbonate with Yb(III) occurs in a high concentration solution environment, with a concentration range of 0.4~2.0 mol·. In carbonate solution systems, due to the saturation solubility of sodium carbonate, the concentration of carbonate can not be further increased, and the dissolution concentration of Yb(III) in carbonate solution cannot be further increased. These results were not clearly predicted in our work in the past few years, and the specific mechanism has not been described in the existing literature. We believe that these findings have good academic value for the basic research of RE aqueous chemical properties.
4. Conclusions
In this paper, the dissolution law of Yb (III) with different concentrations was investigated. Based on this, MD simulations of the actual solutions were performed, and DFT was used to calculate the structure and the theoretical spectrum of the Yb (III) complex ions, comparing with the experimental UV-vis spectra to verify the MD calculations results. Yb (III) undergoes precipitation in low-concentration carbonate solutions, but, in high-concentration carbonate solutions, Yb (III)’s carbonates will undergo dissolution. The main reason for the dissolution of Yb (III)’s carbonates is the coordination effect of on Yb (III). The coordination of the carbonate on Yb (III) occurs in a high concentration solution environment, with a concentration range of 0.4~2.0 mol·. In solution, Yb (III) presents in the form of , while, in the - solution system, Yb (III) preferentially forms hydrated ions, then two pass through the first shell layer and move into the inner layer of the Yb (III) short-range ordered layer, replacing four of nine hydrated water molecules and forming a bidentate coordination, which are then converted into complex ions.
Author Contributions
Conceptualization, Y.Y.; data curation, X.Z.; formal analysis, Y.Y.; funding acquisition, Y.Y.; investigation, Z.X.; methodology, X.Z.; project administration, Q.L.; validation, Q.L.; writing—original draft, X.Z.; writing—review and editing, H.G. and D.L. All authors have read and agreed to the published version of the manuscript.
Funding
This research was funded by the National Key Research and Development Program of China (No. 2021YFB3500902).
Data Availability Statement
Not applicable.
Acknowledgments
We acknowledge the National Key Research and Development Program of China (No. 2021YFB3500902), and we would like to thank to the Doctoral Scientific Research Foundation of Jiangxi University of Science and Technology (No. 205200100515). We also appreciate the support of the Jiangxi Provincial Department of Education’s science and technology project (GJJ210839).
Conflicts of Interest
The authors declare no conflict of interest.
References
- Takagi, K.; Hirayama, Y.; Okada, S.; Yamaguchi, W.; Ozaki, K. Novel powder processing technologies for production of rare-earth permanent magnets. Sci. Technol. Adv. Mater. 2021, 22, 150–159. [Google Scholar] [CrossRef]
- Prokofev, P.A.; Kolchugina, N.B.; Skotnicova, K.; Burkhanov, G.S.; Kursa, M.; Zheleznyi, M.V.; Dormidontov, N.A.; Cegan, T.; Bakulina, A.S.; Koshkidko, Y.S.; et al. Blending Powder Process for Recycling Sintered Nd-Fe-B Magnets. Materials 2020, 13, 3049. [Google Scholar] [CrossRef]
- Nelson, J.J.M.; Schelter, E.J. Sustainable Inorganic Chemistry: Metal Separations for Recycling. Inorg. Chem. 2019, 58, 979–990. [Google Scholar] [CrossRef]
- Lixandru, A.; Venkatesan, P.; Jönsson, C.; Poenaru, I.; Hall, B.; Yang, Y.; Walton, A.; Güth, K.; Gauß, R.; Gutflfleisch, O. Identifification and recovery of rare-earth permanent magnets from waste electrical and electronic equipment. Waste Manag. 2017, 68, 482–489. [Google Scholar] [CrossRef]
- Kuz’Min, M.D.; Skokov, K.; Jian, H.; Radulov, I.; Gutflfleisch, O. Towards high-performance permanent magnets without rare earths. J. Phys. Condens. Matter 2014, 26, 64205. [Google Scholar] [CrossRef]
- Xiong, Y.; Kuang, W.; Zhao, J.; Liu, H.Z. Ionic liquid-based synergistic extraction of rare earths nitrates without diluent: Typical ion-association mechanism. Sep. Purif. Technol. 2017, 179, 349–356. [Google Scholar] [CrossRef]
- Jha, M.K.; Kumari, A.; Panda, R.; Kumar, J.R.; Yoo, K.; Lee, J.Y. Review on hydrometallurgical recovery of rare earth metals. Hydrometallurgy 2016, 165, 2–26. [Google Scholar] [CrossRef]
- Vogit, M.; Rodriguez-Blanco, J.D.; Vallina, B.; Benning, L.G.; Oelkers, E.H. An experimental study of hydroxyl bastnasite solubility in aqueous solutions at 25 °C. Chem. Geol. 2016, 430, 70–77. [Google Scholar] [CrossRef]
- Safarbali, R.; Yaftian, M.R.; Zamani, A. Solvent extraction-separation of La(III), Eu(III) and Er(III) ions from aqueous chloride medium using carbamoyl-carboxylic acid extractants. J. Rare Earths 2016, 1, 91–98. [Google Scholar] [CrossRef]
- Shen, X.L.; Xing, M.M.; Tian, Y.; Fu, Y.; Peng, Y.; Luo, X.X. Upconversion photoluminescence properties of SrY2O4: Er3+, Yb3+ under 1550 and 980 nm excitation. J. Rare Earths 2016, 34, 458–463. [Google Scholar] [CrossRef]
- Xiao, Y.F.; Long, Z.; Huang, X.W.; Feng, Z.Y.; Cui, D.L.; Wang, L.S. Study on non-saponification extraction process for rare earth separation. J. Rare Earths 2013, 31, 512–516. [Google Scholar] [CrossRef]
- Reiller, P.E.; Vercouter, T.; Duro, L.; Ekberg, C. Thermodynamic data provided through the Funmig project: Analyses and prospective. Appl. Geochem. 2012, 27, 414–426. [Google Scholar] [CrossRef]
- Jeanvoine, Y.; Miró, P.; Martelli, F.; Cramer, C.J.; Spezia, R. Electronic Structure and Bonding of Lanthanoid(III) Carbonates. Phys. Chem. Chem. Phys. 2012, 14, 14822–14831. [Google Scholar] [CrossRef]
- Thakur, P.; Xiong, Y.L.; Borkowski, M. An improved thermodynamic model for the complexation of trivalent actinides and lanthanide with oxalic acid valid to high ionic strength. Chem. Geol. 2015, 413, 7–17. [Google Scholar] [CrossRef]
- Philippini, V.; Vercouter, T.; Aupiais, J.; Topin, S.; Ambard, C.; Chaussé, A.; Vitorge, P. Evidence of different stoichiometries for the limiting carbonate complexes across the lanthanide(III) series: A capillary electrophoresis-mass spectrometry study. Electrophoresis 2008, 29, 2041–2050. [Google Scholar] [CrossRef]
- Philippini, V.; Vercouter, T.; Vitorge, P. Evidence of different stoichiometries for the limiting carbonate complexes across the lanthanide(III) series. J. Solut. Chem. 2010, 39, 747–769. [Google Scholar] [CrossRef]
- Migliorati, V.; Serva, A.; Sessa, F.; Lapi, A.; D’Angelo, P. Influence of Counterions on the hydration Structure of Lanthanide Ions in Dilute Aqueous Solutions. J. Phys. Chem. B 2018, 122, 2779–2791. [Google Scholar] [CrossRef]
- Vercouter, T.; Vitorge, P.; Trigoulet, N.; Giffaut, E.; Moulin, C. and the limiting carbonate complexes of other M3+f-elements in aqueous solutions: A solubility and TRLFS study. New J. Chem. 2005, 29, 544–553. [Google Scholar]
- Tang, J.; Johannesson, K.H. Rare earth elements adsorption onto carrizo sand: Influence of strong solution complexation. Chem. Geol. 2010, 279, 120–133. [Google Scholar] [CrossRef]
- Martelli, F.; Jeanvoine, Y.; Vercouter, T.; Beuchat, C.; Vuilleumier, R.; Spezia, R. Hydration properties of lanthanoid(III) carbonate complexes in liquid water determined by polarizable molecular dynamics simulations. Phys. Chem. Chem. Phys. 2014, 16, 3693–3705. [Google Scholar] [CrossRef]
- D’Angelo, P.; Spezia, R. Hydration of Lanthanoids(III) and Actinoids(III): An Experimental/Theoretical Saga. Chem. Eur. J. 2012, 18, 11162–11178. [Google Scholar] [CrossRef] [PubMed]
- Migliorati, V.; Serva, A.; Terenzio, F.M.; D’Angelo, P. Development of Lennard-Jones and Buckingham Potentials for Lanthanoid Ions in Water. Inorg. Chem. 2017, 56, 6214–6224. [Google Scholar] [CrossRef] [PubMed]
- Zhang, X.L.; Niu, F.; Liu, D.H.; Yang, S.M.; Yang, Y.M.; Tong, Z.F. Molecular Dynamics Simulations of Y(III) Coordination and Hydration Properties. RSC Adv. 2019, 9, 32085–32096. [Google Scholar] [CrossRef] [PubMed]
- Yang, Y.; Zhang, X.; Li, K.; Wang, L.; Niu, F.; Liu, D.; Meng, Y. Maintenance of the Metastable State and Induced Precipitation of Dissolved Neodymium (III) in an Na2CO3 Solution. Minerals 2021, 11, 952. [Google Scholar] [CrossRef]
- Tong, Z.F.; Xie, Y.B.; Zhang, Y.H. Molecular dynamics simulation on the interaction between polymer inhibitors and β-dicalcium silicate surface. J. Mol. Liq. 2018, 259, 65–75. [Google Scholar] [CrossRef]
- Cheng, Y.M.; Yang, Z.W.; Liao, J.Y.; Qiu, J.B.; Song, Z.G.; Yang, Y. Color tunable up conversion emission in CeO2: Yb, Er three-dimensional ordered microporous materials. J. Rare Earths 2015, 33, 599–603. [Google Scholar] [CrossRef]
- Yang, Y.M.; Zhang, X.L.; Li, L.; Wei, T.M.; Li, K.Z. Metastable Dissolution Regularity of Nd3+ in Na2CO3 Solution and Mechanism. ACS Omega 2019, 4, 9160–9168. [Google Scholar] [CrossRef]
- Cetin, A.; Ilk Capar, M.; Zakharov, A.V. Miscibility and diffusivity of water in organic acids: Molecular dynamics simulations. J. Mol. Liq. 2019, 294, 111630. [Google Scholar] [CrossRef]
- Saxena, A.; Sept, D. Multisite Ion Models That Improve Coordination and Free Energy Calculations in Models Dynamics Simulations. J. Chem. Theory Comput. 2013, 9, 3538–3542. [Google Scholar] [CrossRef]
- Chopra, M.; Choudhury, N. Adsorption of uranyl ions from its aqueous solution by functionalized carbon nanotubes: A molecular dynamics simulation study. J. Mol. Liq. 2019, 294, 111569. [Google Scholar] [CrossRef]
- Tomono, H.; Nada, H.; Zhu, F.; Sakamoto, T.; Nishimura, T.; Kato, T. Effects of Magnesium Ions and Water Molecules on the Structure of Amorphous Calcium Carbonate: A Molecular Dynamics Study. J. Phys. Chem. B 2013, 117, 14849–14856. [Google Scholar] [CrossRef] [PubMed]
- Wan, H.; Yi, P.; Qu, J.; Bu, X.; Yang, W.; Li, H. Adsorption Behaviors of Straight-Chain Alkanes on a Molybdenite [001]/[100] Surface: A Molecular Dynamics Study. Minerals 2021, 11, 489. [Google Scholar] [CrossRef]
- Ma, Y.M.; Gao, Y.; Yang, Y.; Li, W.Y.; Shi, P.; Wang, S.; Tang, W.W. Thermodynamic analysis and molecular dynamic simulation of the solubility of vortioxetine hydrobromide in three binary solvent mixtures. J. Mol. Liq. 2018, 272, 676–688. [Google Scholar] [CrossRef]
- Soumya, S.; Sheemol, V.N.; Amba, P.; Mohamed, A.P.; Ananthakumar, S. Sn and Ag Doped ZnO Quantum Dots with PMMA by in Situ Polymerization for UV/IR Protective, Photochromic Multifunctional Hybrid Coatings. Sol. Energy Mater. Sol. Cells 2018, 174, 554–565. [Google Scholar] [CrossRef]
- Zhang, H.Y.; Jiang, Y.; Yan, H.; Yin, C.; Tan, T.W.; Spoel, D.V. Free energy calculations of ionic hydration consistent with the experimental hydration free energy of the proton. J. Phys. Chem. Lett. 2017, 8, 2705–2715. [Google Scholar] [CrossRef]
- Zhang, J.; Yang, C.; Niu, F.; Gao, S.; Dong, J. Molecular Dynamics Study on the Leaching of Zinc-Bearing Dust Sludge by Choline Chloride-Malonic Acid. Minerals 2021, 11, 1080. [Google Scholar] [CrossRef]
- Zhao, S.L.; Ma, Y.M.; Tang, W.W. Thermodynamic analysis and molecular dynamic simulation of solid-liquid phase equilibrium of griseofulvin in three binary solvent systems. J. Mol. Liq. 2019, 274, 111600. [Google Scholar] [CrossRef]
- Zhou, M.; Jiang, T.; Yang, S.T.; Xue, X.X. Sintering behaviors and consolidation mechanism of high-chromiun vanadium and titanium magnetite fines. Int. J. Miner. Metall. Mater. 2015, 22, 917–925. [Google Scholar] [CrossRef]
- Hu, G.Q.; Sun, Y.Q.; Xie, Y.X.; Wu, S.S.; Zhang, X.J.; Zhuang, J.L.; Hu, C.F.; Lei, B.F.; Liu, Y.L. Synthesis of Silicon Quantum Dots with Highly Efficient Full-Band UV Absorption and Their Applications in Antiyellowing and Resistance of Photodegradation. ACS Appl. Mater. Inter. 2019, 11, 6634–6643. [Google Scholar] [CrossRef]
- Hess, S.C.; Permatasari, F.A.; Fukazawa, H.; Schneider, E.M.; Balgis, R.; Ogi, T.; Okuyama, K.; Stark, W.J. Direct Synthesis of Carbon Quantum Dots in Aqueous Polymer Solution: One-Pot Reaction and Preparation of Transparent UV-Blocking Films. J. Mater. Chem. A 2017, 5, 5187–5194. [Google Scholar] [CrossRef]
- Johannesson, K.H.; Lyons, W.B. The rare earth element geochemistry of Mono Lake water and the important of carbonate complexing. Limnol. Oceanogr. 1994, 39, 1141–1154. [Google Scholar] [CrossRef]
- Serna-Carrizales, J.C.; Zárate-Guzmán, A.I.; Aguilar-Aguilar, A.; Forgionny, A.; Bailón-García, E.; Flórez, E.; Gómez-Durán, C.F.A.; Ocampo-Pérez, R. Optimization of Binary Adsorption of Metronidazole and Sulfamethoxazole in Aqueous Solution supported with DFT Calculations. Processes 2023, 11, 1009. [Google Scholar] [CrossRef]
- Yan, Y.N.; Xu, Y.; Hunang, X.W.; Feng, Z.Y.; Hou, Y.K.; Li, K.; Wang, L.S.; Hu, Y. Process optimization of neodymium chloride solutions precipitated by magnesium bicarbonate. J. Rare Earths 2019, 37, 437–442. [Google Scholar] [CrossRef]
- Lai, F.G.; Gao, G.H.; Huang, L.; Xiao, Y.F.; Yang, R.; Li, K.Z. Compound leaching of rare earth from the ion-adsorption type rare earth ore with magnesium sulfate and ascorbic acid. Hydrometallurgy 2018, 179, 25–35. [Google Scholar]


Disclaimer/Publisher’s Note: The statements, opinions and data contained in all publications are solely those of the individual author(s) and contributor(s) and not of MDPI and/or the editor(s). MDPI and/or the editor(s) disclaim responsibility for any injury to people or property resulting from any ideas, methods, instructions or products referred to in the content. |
© 2023 by the authors. Licensee MDPI, Basel, Switzerland. This article is an open access article distributed under the terms and conditions of the Creative Commons Attribution (CC BY) license (https://creativecommons.org/licenses/by/4.0/).