Article

Effects of Irrigation with Slightly Algae-Contaminated Water on Soil Moisture, Nutrient Redistribution, and Microbial Community

1
College of Water Resources and Civil Engineering, China Agricultural University, Beijing 100083, China
2
Faculty of Arts and Sciences, Beijing Normal University, Zhuhai 519087, China
3
Guangdong-Hong Kong Joint Laboratory for Water Security, Beijing Normal University, Zhuhai 519087, China
4
Songliao River Water Resources Commission of Ministry of Water Resources, Ministry of Water Resources of the People’s Republic of China, Jilin 130000, China
5
Rural Energy and Environment Agency, Ministry of Agriculture and Rural Affairs, Beijing 100125, China
6
Department of Water Ecology and Environment, China Institute of Water Resources and Hydropower Research, Beijing 100038, China
7
College of Horticulture and Forestry, Tarim University, Alar 843300, China
*
Authors to whom correspondence should be addressed.
Processes 2024, 12(8), 1639; https://doi.org/10.3390/pr12081639
Submission received: 11 July 2024 / Revised: 29 July 2024 / Accepted: 2 August 2024 / Published: 4 August 2024
(This article belongs to the Special Issue State-of-the-Art Wastewater Treatment Techniques)

Abstract

:
The presence of excessive algae in water is always considered as a negative factor in irrigation. However, the optimal balance between algal removal and retention in irrigation water when the algal biomass is controllable remains unknown. Therefore, this study explores the impact of low-level algal presence (Scytonema javanicum) on soil and microbial activity through controlled soil column experiments. Soil moisture was measured, and 16S rRNA gene amplicons sequencing was applied to characterize the microbial community. Slight community changes indicated no negative impact on the local microbial community of S. javanicum. Enzyme assays and quantitative polymerase chain reaction (qPCR) revealed that algae improved soil moisture retention, and enhanced the nutrient content of the topsoil. The decrease in moisture in the treatment group (from 27.53% to 26.42%) was significantly reduced (p < 0.05) compared to the control (from 27.55% to 25.17%), while the contents of ammonium (NH3-N) and total nitrogen (TN) in the treatment (0.70 mg/kg and 0.54 g/kg) were also higher (p < 0.05) than that of the control (0.43 mg/kg and 0.49 g/kg). The results of the abundance of functional gene suggested algae facilitated nitrogen fixation and nitrification. This research offers innovative insights for diversifying the sources of irrigation water.

1. Introduction

Agricultural irrigation accounts for more than 63% of the total water consumption in China [1]. Although an increase in the irrigation water use coefficient has kept China’s annual agricultural water consumption in a stable range, pollution of irrigation water sources [2] and increases in food demand [3] have made irrigation water resources increasingly scarce [4]. Expanding the source of irrigation water to include sources such as reclaimed water [5,6], brackish waters with low levels of pollution, is a promising strategy to address this problem. Among these strategies, irrigation with water containing low levels of algae has high economical and ecological potential. Water with high algal content is conventionally regarded as unsuitable for irrigation because of the potential toxicity of algae and [7] the risk of equipment clogging [8]. For example, microcystins released by algae can reduce the potential nitrification rate of soil and affect enzyme activity [9]. This necessitates additional treatment before such water is used, which increases cost. The pretreatment of slightly contaminated water containing small amounts of algae is even more time-consuming and laborious. However, algae-containing water often contains considerable amounts of nutrients that could be beneficial for improving soil fertility and quality [10]. This highlights the necessity of employing waters containing low levels of algal pollution wisely.
Algae could also improve the soil environment in various ways. The desert algal biocrust technique is a common tool for desertification control that can be used to maintain soil moisture content, improve soil nutrients, and regulate soil temperature [11,12,13,14]. Algal crust formation serves as a vital link between surface organisms and soil biological components and has ecological significance in areas with dry and nitrogen-deficient soils [15,16]. While algae actively exchange materials with their external environment through microbial life activities, they also induce changes in the microbial community structure. Microorganisms in turn regulate nutrient cycling and determine soil structure by participating in physiological and biochemical processes in soils, ultimately altering the structural characteristics and physicochemical properties of the algae [17]. The interaction between the two and their joint succession determines the growth of algae [18,19,20]. In addition, microorganisms play an important role in the nitrogen cycle [21] and are involved in the decomposition of organic matter and in humus formation [22,23]. Current research on genes related to soil N cycling has been focused on the relative abundance of individual genes involved in soil nitrification, denitrification and nitrogen fixation, such as nifH, amoA, nirS, and nosZ [24]. The soil N cycle is driven by functional genes carried by microorganisms involved in each key process. In the process, nifH genes converted N2 to NH3-N through nitrogen fixation, amoA and nxrA genes converted NH3-N to NO3-N through nitrification, and narG, nirK, nirS, and nosZ genes finally converted NO3-N to N2 through denitrification [25], completing the whole cycle.
However, the positive role of algae in agricultural irrigation has been largely overlooked in the current literature, which mainly focuses on the control of desertification. Previous studies have shown that using algae as biological fertilizers can help increase soil nutrient content, thereby reducing the use of inorganic and organic fertilizers [26]. Hence, it is believed that algae could have beneficial effects on irrigated fields in various ways. Moreover, the direct use of water resources with controllable algae content for irrigation could expand irrigation water sources and reduce irrigation costs.
This study examines the effects of irrigation with water containing low levels of algae on soil moisture content, microbial communities, fertility, enzyme activity, and nitrogen cycle functional potential. The target algae was Scytonema javanicum, a desert alga commonly used for biocrust [27]. An indoor simulated treatment method involving soil columns was used in this study, and the objectives were to (1) assess and analyze the impact of algal water irrigation on soil moisture content retention; (2) explore the effect of irrigation with water containing low levels of algae on the nutritional status of different soil layers; and (3) investigate the effect of irrigation with water containing low levels of algae on the soil nitrogen cycle. This article intends to clarify the feasibility of irrigating agricultural fields’ waters containing low levels of algae.

2. Materials and Methods

2.1. Soil Sample

Soil samples were collected from the Hetao irrigation area in Inner Mongolia, China (107.276963°E, 40.732998°N), which has a mid-temperate continental monsoon climate, and the agricultural sector in this region relies mainly on diversion irrigation. Figure S1 shows the locations of the sampling points. The soil column was sampled in layers up to a depth of 96 cm using a ring knife and preserved at 4 °C for laboratory pretreatment. A Malvern 3000 laser particle size meter was used to analyze the soil particle composition of the soil samples at different depths, and Table S1 presents the results.

2.2. Algal and Column Experimental Design

Scytonema javanicum (FACHB-887) was used as the target algal species in this experiment. This cyanobacterium was obtained from the Freshwater Algal Species Bank of the Chinese Academy of Sciences and isolated from a desert beetle. The algal suspensions were prepared by culturing the algae in BG11-N medium in an illuminated incubator at 25 °C and 2000 Lux light intensity for 15 days.
Six Plexiglas columns were employed with a height of 100 cm and an inner diameter of 15 cm. Instrument line access ports with a diameter of 1.5 cm were provided on the sides at 10 cm, 50 cm, and 90 cm from the top of the soil column for connecting to the moisture content sensor and collecting soil samples. Soil samples were placed in the columns in sequence according to the stratification depth at the time of sampling, simulating actual soil conditions. The moisture content sensor (HOBO H21-USB, Onset, Cape Cod, MA, USA) was inserted vertically into the line interface. Moisture content data were collected every 15 min during the experimental period. A schematic of the experimental setup is shown in Figure S2. The experiments were conducted in the laboratory hall of the China Agricultural University, Beijing. The ambient temperature was relatively stable during the experiment. Three independent, parallel experiments were conducted at the same time.
After the soil column was constructed, all columns were stabilized for 1 week to redistribute the moisture content between the layers of the soil column to avoid excessive fluctuations in moisture content caused by filling and transportation processes that could affect the subsequent experimental operations. Following the stabilization period, each column was irrigated with 113 mm (2 L) water, either with or without S. javanicum (biomass 3 mg/L), and were subsequently assigned to either the HZ group (with S. javanicum) or the HB group (without S. javanicum). The initial algae concentration in the HZ group was 3 mg/L. Moisture content and other relevant parameters were monitored for a period of 10 days. Thereafter, to investigate the impact of algae on soil water evaporation, specific time points were chosen for various soil columns, which reflected similar soil moisture content (approximately 27.5%) at the onset of the experiment. During the evaporation experimental period, there was no free water on the surface of the soil. The goal was to observe the decline in soil moisture content over the ensuing 7 days.

2.3. Chemical Analysis

Soil samples were collected from the sample port at the beginning and end of each experimental phase. To increase the representativeness of the samples, three replicates were taken from each port and homogenized. The samples were then labeled, air-dried, pulverized, sieved, blended, bottled, and stored in a frozen state until further analysis. The soil parameters measured in this study included NH3-N, NO3-N, TN, and total phosphorus (TP), which were measured following the standard methods of the American Public Health Association by an ultraviolet-visible spectrophotometer (UV7, Mettler Toledo Inc., Zurich, Switzerland). Total organic carbon (TOC) was measured by a TOC analyzer (vario TOC cube from Elementar, Germany). The activity of alkaline phosphatase (AKP) and urease (UE) was determined using a multimode plate reader (Synergy 2, Biolog Inc., Hayward, CA, USA). A soil alkaline phosphatase activity assay kit and soil urease activity assay kit were selected for analysis. The activity of AKP was expressed as micrograms of phenol produced per gram of soil reacted in 24 h at 37 °C, and the activity of UE was expressed as micrograms of NH3-N produced per gram of soil reacted in 24 h at 37 °C.

2.4. Molecular Analysis

The FastDNA® SPIN Kit for Soil (MP Biomedicals, Santa Ana, CA, USA) was used for the extraction of total DNA following the instructions. The V3–V4 highly variable region of the bacterial 16S rRNA gene was selected for PCR amplification with the primers 338F (5′ACTCCTACGGGAGGCAGCAG-3′) and 806R (5′-GGACTACHVGGGTWTCTAAT-3′). PCR products were examined by 1% agarose gel electrophoresis and then purified and recovered by the Agencourt AMPure XP Nucleic Acid Purification Kit (Beckman Coulter Life Sciences, Beijing, China). After purification, the quality and concentration of PCR products was tested using NanoDrop (ND-1000, Thermo, Waltham, MA, USA). Finally, the products were sequenced on the Illumina MiSeq 2500 platform. The raw sequence data reported in this paper have been deposited in the China National Center for Bioinformation, Beijing, China (GSA: CRA011824) [28]. The operations such as trimming adapters, quality filtering, and removing chimeras on the raw data were performed on EasyAmplicon [29,30]. Subsequently, the clean sequences are grouped into distinct operational classification units (OTUs) at 97% identity. Representative sequence for the OTU is then annotated with the Silva138 database.
Real-time fluorescence quantitative PCR (QuantStudio3, Thermofisher, Waltham, MA, USA) was used to quantify the abundance of eight functional genes (nifH, amoA, amoA, nxrA, narG, nirS, nirK, and nosZ) involved in the nitrogen cycle. Their roles in the nitrogen cycle are shown in Table S2. The primers and sequences for the functional genes are shown in Table S3. The qPCR amplification system and amplification procedure are shown in Tables S4 and S5.

2.5. Data Analysis

Formula (1) was used for calculating the cumulative infiltration of soil water:
h = M × m/(ρ × S) × 1000
where h is the cumulative infiltration, mm. M is the value of soil moisture content change, %. m is the mass of dry soil, kg. S is the cross-sectional area of the column, m2. ρ is the density of water, kg/m3.
The physicochemical data were processed with Excel and analyzed for significance with SPSS 22.0 and GraphPad Prism 9 software. Data are presented as the mean ± standard error. Statistical analyses and visualization were performed using the software R (4.1.2) and Origin (v.2021). Principal coordinate analysis (PCoA) and redundancy analysis (RDA) were also conducted and plotted using R software with PCAtools and the vegan package. The Mantel analysis was then performed, and the results were plotted using the linkET package in R software. A species correlation matrix was generated using the psych package in R, and network plotting was performed using Gephi (0.9.7).

3. Results

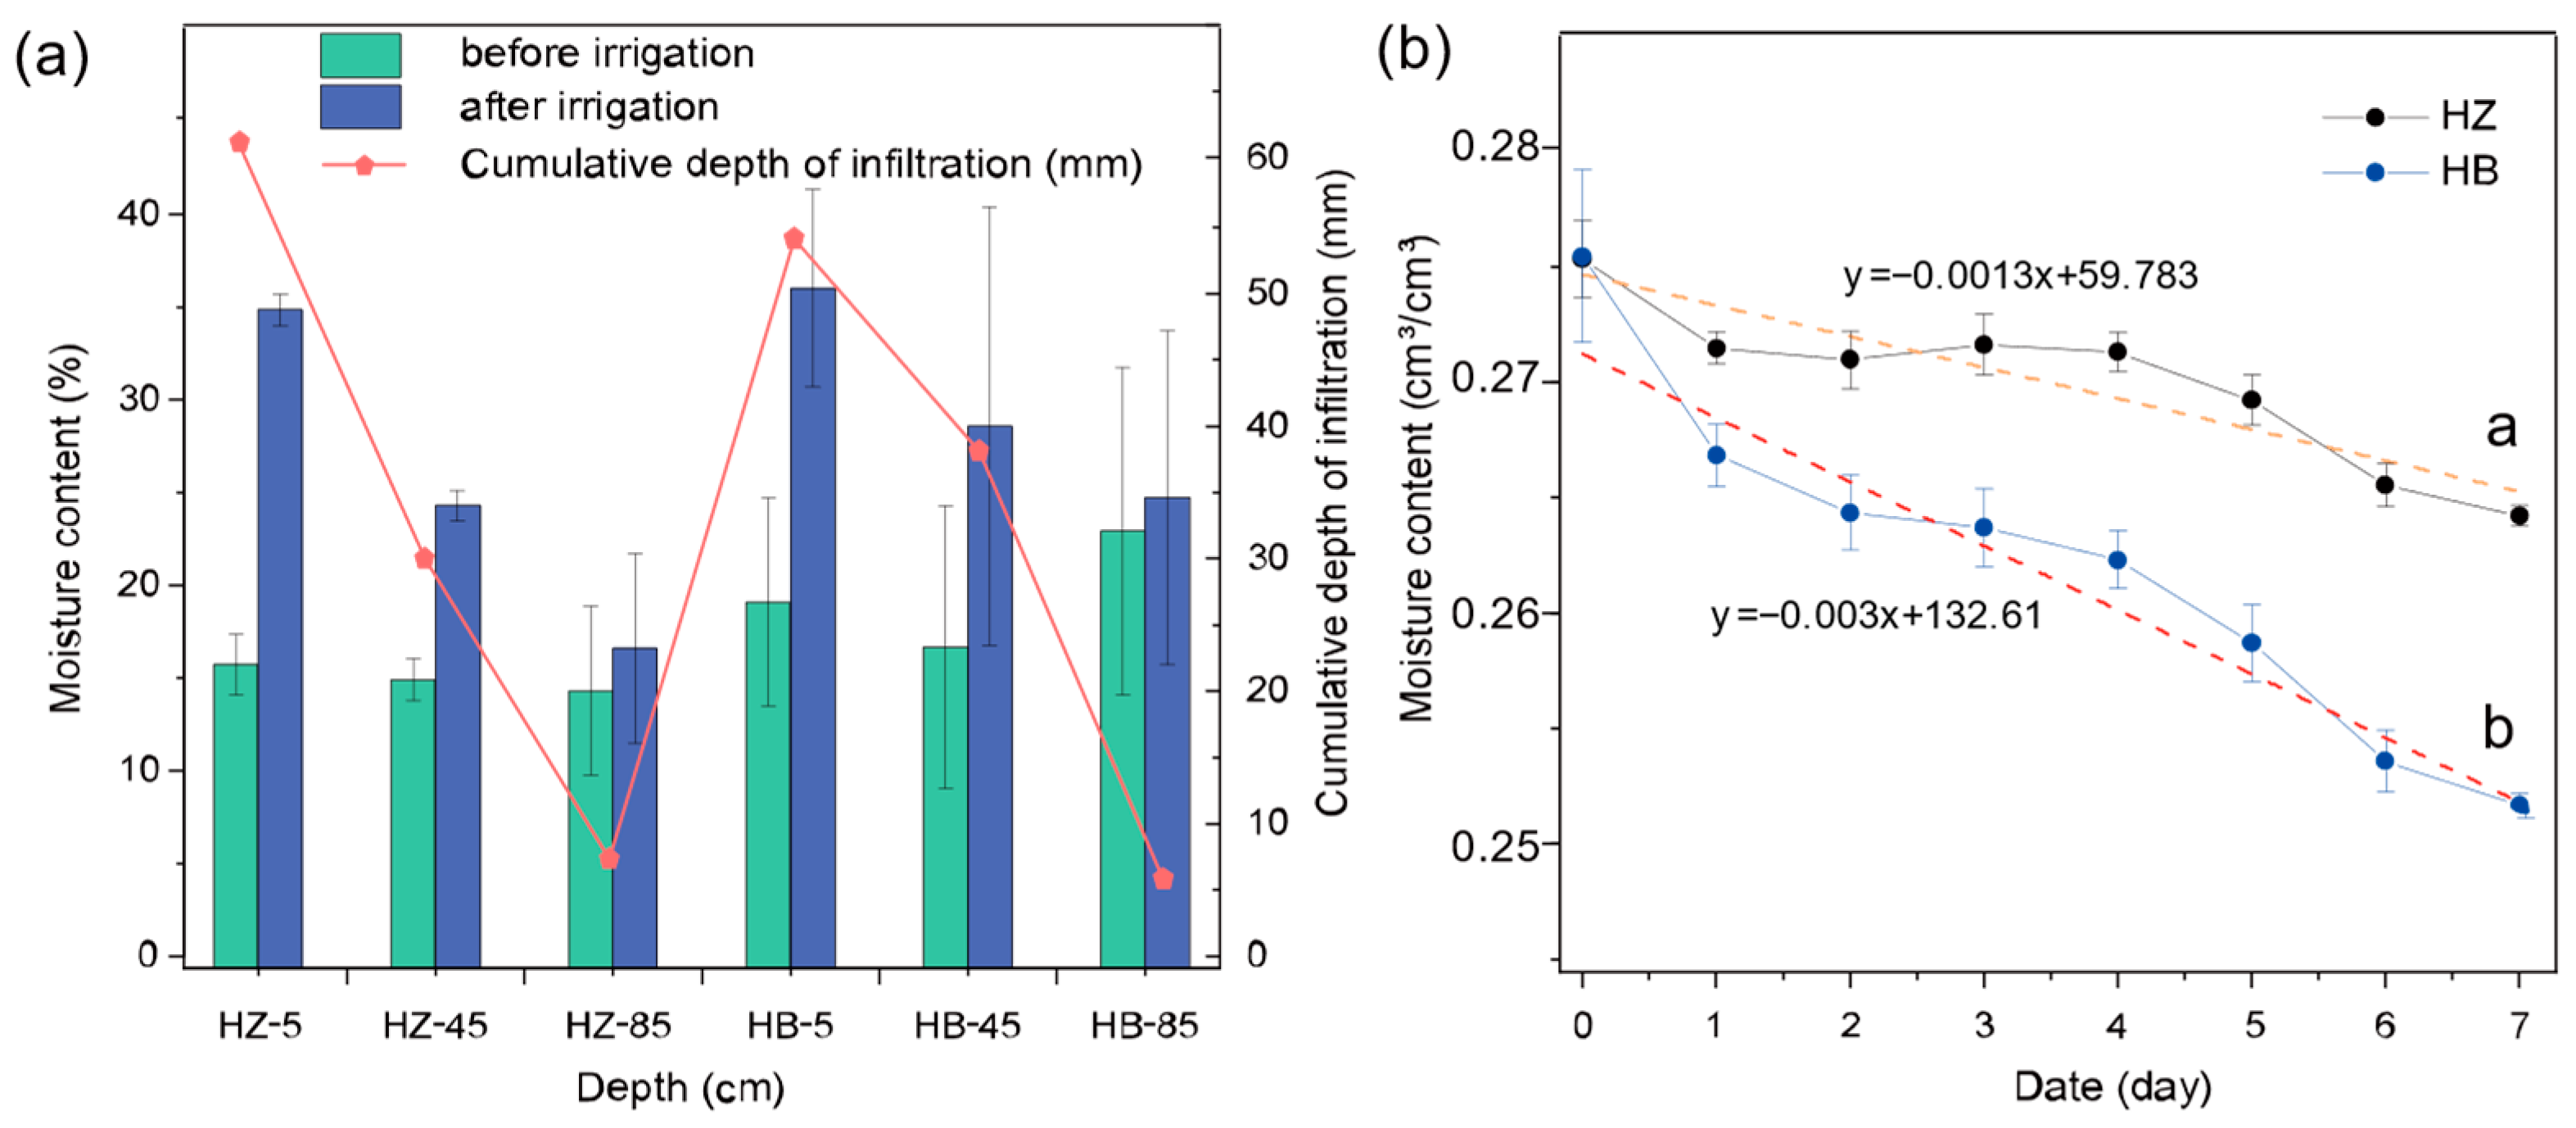
3.1. Soil Moisture Content Characteristics

The moisture content characteristics of each soil column at different depths are illustrated in Figure 1. The initial moisture content of each layer did not differ significantly between the treatment and control groups. After irrigation, the soil moisture content of both groups increased in each layer (ranging from 16.60–36.02% to 14.30–22.91%). The cumulative depth of infiltration was 61.15 mm, 30.02 mm, and 7.34 mm in the treatment group from top to bottom, respectively, and 54.18 mm, 39.11 mm, and 5.84 mm in the control group. The treatment group did not show significant differences in moisture content in the 85 cm soil layer before and after the experiment (p > 0.05), but the treatment group showed significant differences in the 5 cm (p < 0.01) and 45 cm soil layers (p < 0.05), while the control group did not show significant differences in moisture content in each soil layer.
Figure 1b illustrates the variation in soil water with time for the soil columns during the evaporation phase. The average moisture contents of the three layers gradually decreased from 27.53 cm3/cm3 to 26.42 cm3/cm3 over 8 days in the treatment group and from 27.55 cm3/cm3 to 25.17 cm3/cm3 in the controls. Through calculations, the cumulative evaporative loss of the control group during the experimental period was 22.84, which is 2.14 times that of the treatment group (10.66 mm). With the same initial soil moisture content, at the end of the 8-day experimental period, the treatment group demonstrated exceptional soil moisture retention characteristics (p < 0.05), which showed that the application of S. javanicum was indeed beneficial for maintaining soil moisture. Moreover, after irrigation, there was no significant difference in the increase of moisture content at the 85 cm depth between the treatment and control groups (p > 0.05); this suggests that the better soil moisture retention in the treatment group is primarily due to the reduction in the evaporation of soil moisture. Figure S3 also presents a comparative analysis of the overall soil moisture content between the treatment group and the control group at the evaporation stage. At almost all spots above the 1:1 reference line, indicating that under the experimental conditions, the moisture content of the treatment group is significantly higher than that of the control. Furthermore, a linear function with an intercept on the y-axis was obtained through fitting, which crosses with the 1:1 reference line at x = y = 0.277, indicating that at corresponding soil moisture content below 0.277 cm3/cm3, the application of S. javanicum is beneficial for maintaining soil moisture.

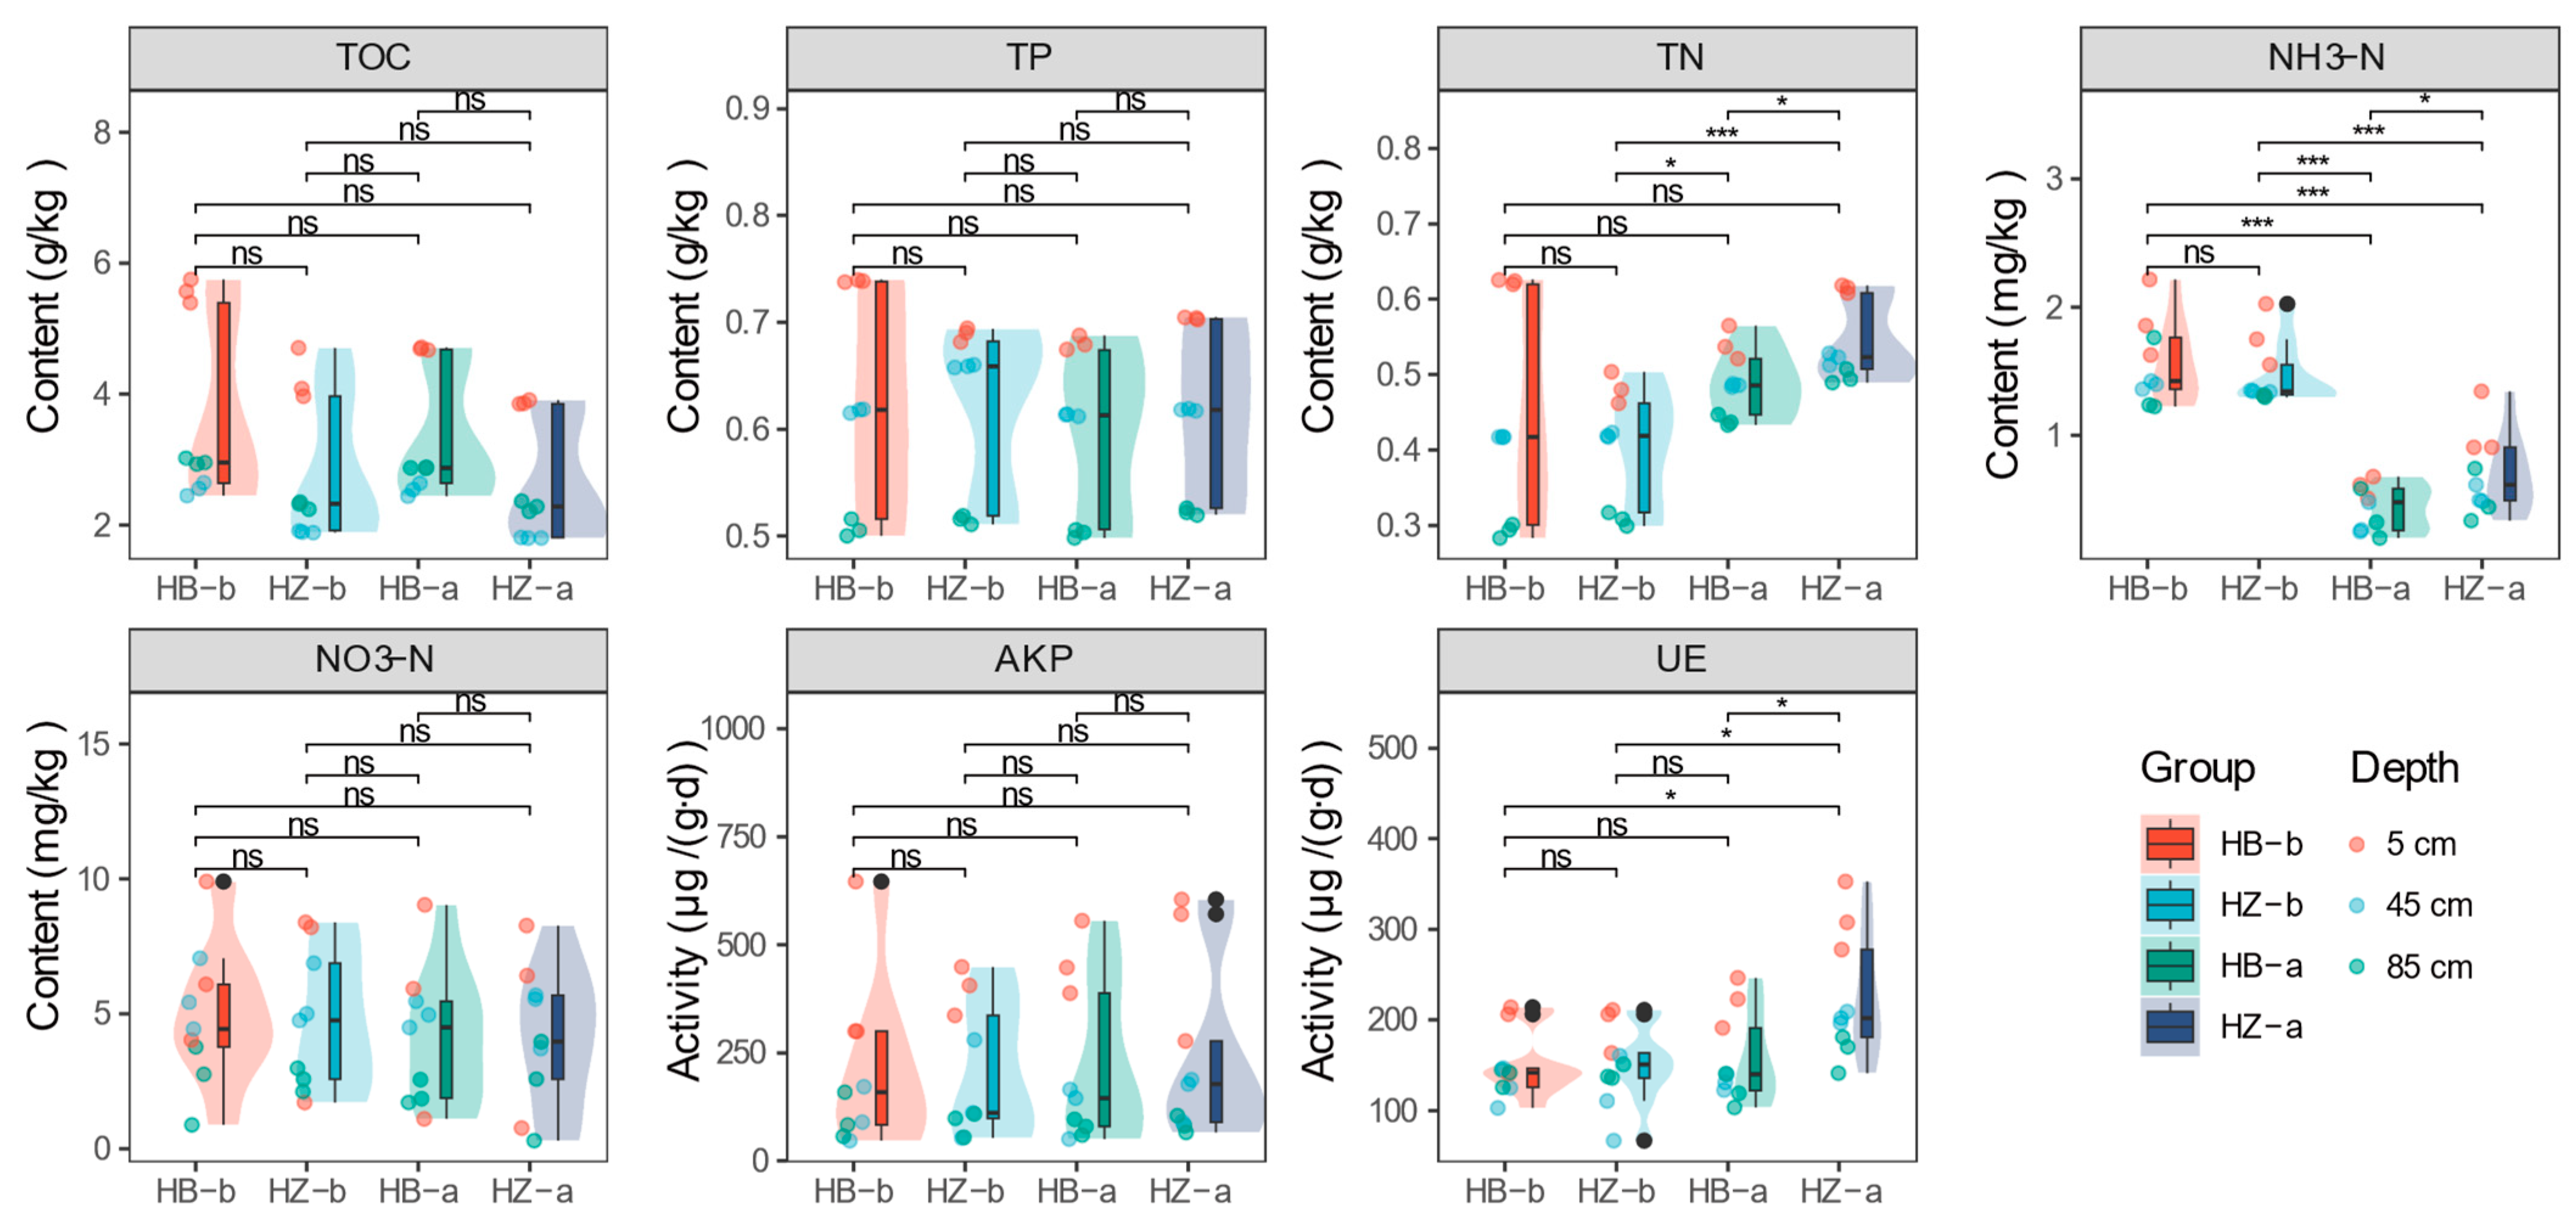
3.2. Soil Nutrient Characteristics

As illustrated in Figure 2, the content of TOC, TP, and NO3-N remained relatively consistent across all treatments. However, TN, NH3-N were significantly higher in the HZ treatment (mean values of 0.54 g/kg and 0.70 mg/kg, respectively) compared to the HB treatment (mean values of 0.49 g/kg and 0.43 mg/kg, respectively) at the end of the experiment (p < 0.05). This suggests that the presence of S. javanicum enhances nitrogen retention, primarily in the form of ammonia nitrogen, which is less prone to loss through runoff [31]; such an increase is advantageous for soil nutrient fixation and mitigates the risk of non-point source pollution [32]. The activities of AKP and UE, both integral to the nitrogen and phosphorus transformation processes in soil, were also examined. In general, AKP activity did not exhibit significant changes before and after the experimental period. However, at the end of the experiment, a notable increase in UE activity was observed in the HZ-a treatment group, which showed significantly higher activity (226.40 μg/(g∙d)) compared to the beginning of the treatment (HZ-b, 149.14 μg/(g∙d), p < 0.05) and the control group (HB-a, 157.45 μg/(g∙d), p < 0.05), particularly in the topsoil level, where UE activity peaked at 312.62 μg/(g∙d), approximately 1.5 times that of the control group. This finding aligns with the results observed for NH3-N, as urease has been established to be intimately linked to the production of this nitrogenous compound [33].
The spotlight then shifts to the topsoil, where all nutrient characteristics and enzyme activities were found to be most pronounced in the 5 cm layer (Figure S4), indicating its critical role in crop growth [34]. The control group experienced a significant decrease in TOC (from 5.57 g/kg to 4.69 g/kg, p < 0.01), TN (from 0.62 g/kg to 0.54 g/kg, p < 0.01), NH3-N (from 1.90 mg/kg to 0.60 mg/kg, p < 0.01), and TP (from 0.74 g/kg to 0.68 g/kg, p < 0.001). In contrast, the treatment group, despite a significant reduction in NH3-N (from 1.77 mg/kg to 1.05 mg/kg, p < 0.05), which still had levels 1.75 times higher than those of the HB-a group, TN (from 0.48 g/kg to 0.61 g/kg, p < 0.001), TP (from 0.68 g/kg to 0.71 g/kg, p < 0.05), and UE (from 193.52 μg/(g∙d) to 312.62 μg/(g∙d), p < 0.05), showed an increase, while TOC, NO3-H, and AKP did not exhibit significant changes in the topsoil of the HZ treatment group. At the experiment’s conclusion, the nutritional status of the topsoil between the HZ-a and HB-a groups displayed significant differences, except for AKP and NO3-N. Especially, HB-a had a higher TOC content (4.69 g/kg) than the HZ-a group (3.87 g/kg, p < 0.001). However, the latter group exhibited higher levels of NH3-N (1.05 mg/kg, p < 0.05), TN (0.61 g/kg, p < 0.01), TP (0.71 g/kg, p < 0.01), and UE (312.62 μg /(g∙d), p < 0.05) compared to HB-a (0.60 mg/kg, 0.54 g/kg, 0.68 kg, and 220.15 μg/(g∙d), p < 0.05). These results indicated that the application of S. javanicum positively impacts nutrient retention, particularly nitrogen in the topsoil, which is beneficial for crop growth; it is hypothesized that this beneficial effect may be attributed to the elevated activity of UE [35].

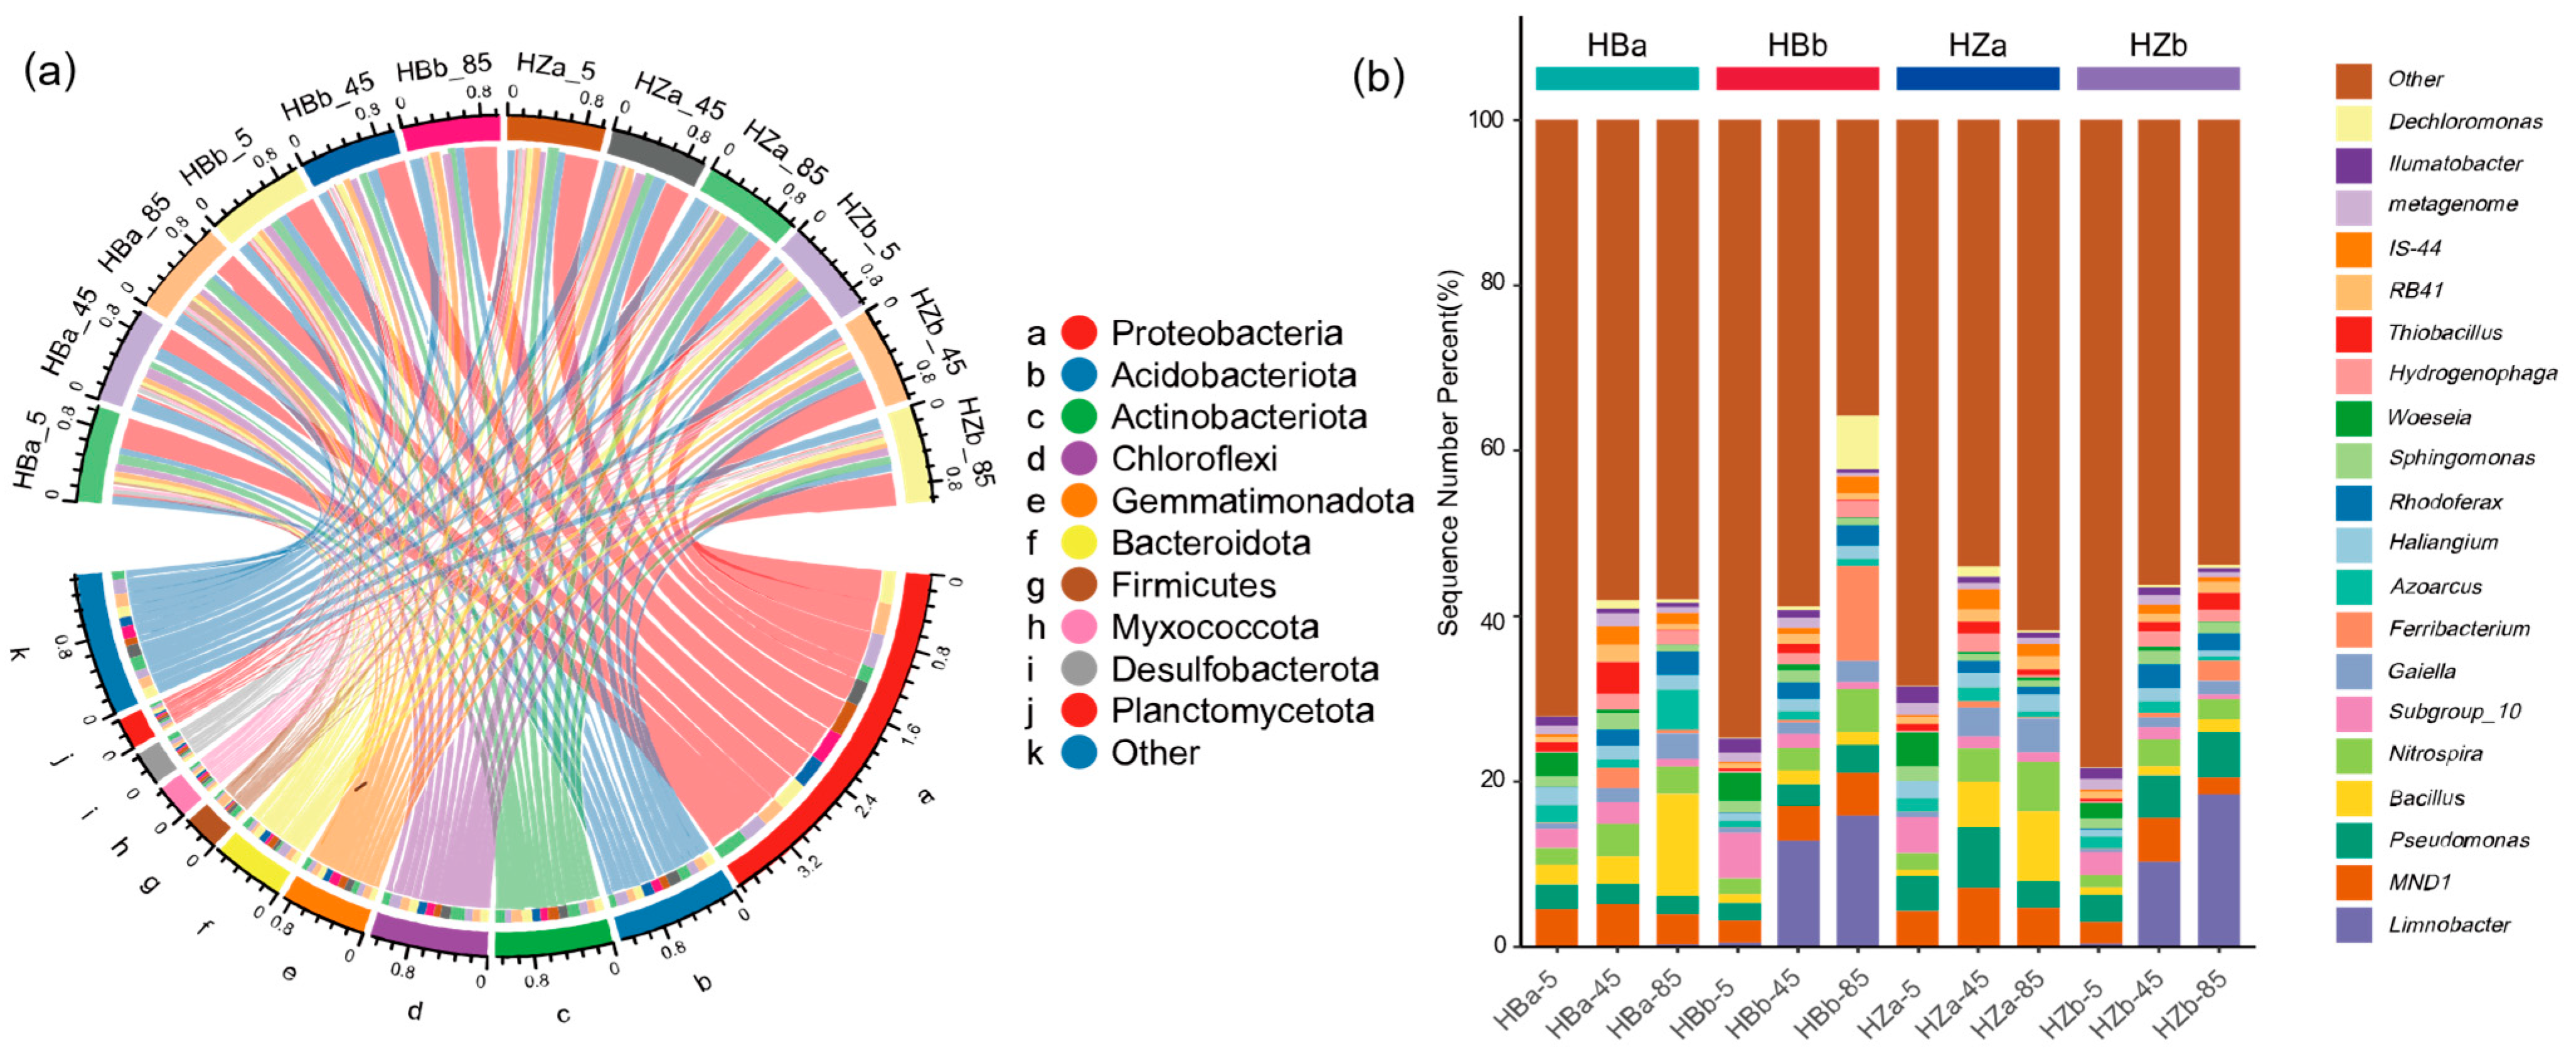
3.3. Soil Microbial Communities and Structure

The alpha dilution curves using the microbial diversity of each sample sequencing volume at different sequencing depths (Figure S5) was constructed, and the results showed that the species coverage of the samples was above 90%, indicating that the results of the sequencing experiments represented the actual composition of microorganisms in the samples. Table S6 represents the α-diversity indices of soil microorganisms in each soil layer before and after the experiment. The Chao 1, goods_coverage, and observed_species indices showed significant decreases in each soil layer before and after the experiment (p < 0.01), while the changes in other indices were not obvious.
Figure 3 shows the microbial abundance and diversity of soil samples from the treatment and control groups before and after the experiment. In this study, the top 10 phyla and 20 genera in terms of abundance were selected, as shown in Figure 3. The dominant microorganisms in each sample at the phylum level were Proteobacteria, Acidobacteriota, Actinobacteriota, and Chloroflexi; the combined abundance of the four phyla accounts for more than 50% of all the microorganisms.. After irrigation, Proteobacteria (ranging from 17.98–37.48% to 33.42–37.96%) showed an overall significant increase (p < 0.05), while the percentage of Actinobacteriota (ranging from 9.97–13.71% to 8.11–9.05%) in the treatment group was significantly lower (p < 0.05). In addition, the relative abundance of Actinobacteriota showed significant differences between the treatment (10.01–13.71%) and control groups (8.00–9.15%, p < 0.05). Analysis of the abundance of species clades within different soil layers revealed that the abundance of Actinobacteriota (ranging from 12.15–13.71% to 8.65–9.05%) decreased significantly at 85 cm (p < 0.05), and the abundance of Chloroflexi increased significantly at 5 cm (ranging from 7.15–8.69% to 8.26–9.71%) and decreased significantly at 45 cm (ranging from 10.98–12.20% to 8.75–9.71%) after the experiment (p < 0.05).
As shown in Figure 3b, the microorganisms that dominated at the genus level mainly included Limnobacter, MND1, Pseudomonas, Bacillus, and Nitrospira. The average relative abundance of S. javanicum only accounts for 0.02%. By comparing the abundance of strains before and after the experiment in different groups, only the treatment group showed a significant decrease (p < 0.05) in MND1 abundance (ranging from 4.32–7.02% to 2.06–5.33%), while the other groups showed no significant change overall. By comparing the strain abundance in different soil layers before and after the experiment, the abundance of Limnobacter (p < 0.05) and Pseudomonas (p < 0.05) increased significantly and the abundance of MND1 decreased extremely significantly at the 5 cm soil layer (p < 0.01). It is worth noting that Limnobacter was almost exclusively found in the deep soil layers (45 cm and 85 cm layers) before irrigation, and was not detected in the soil surface after irrigation (p < 0.05).
Network analysis of the top 50 genera in terms of abundance yielded a total of 446 edges, of which 280 were positively correlated and 166 were negatively correlated (Figure S6). According to the degree of nodes, the key network nodes were Pelagibius, Gaiella, TX1A-55, Halomonas, SM1A02, etc., and their degrees were greater than 30. Therefore, the significant change in the abundance of these genera could remarkably affect the structure of the soil microbial community. Among them, Pelagibius, TX1A-55 and Halomonas belonged to Proteobacteria, and Gaiella belonged to Actinobacteriota, all of which were the top three phyla in terms of abundance. In contrast, Planctomycetota, to which SM1A02 belongs, was among the top 10 phyla in terms of abundance.
Variations in the composition of bacterial communities across various soil depths were observed under different experimental treatments and at different times relative to irrigation events (Figure 4). According to the sample distance matrix PCoA analysis, the principal components PCo1 and PCo2 contributed 49.5% and 12.8%, respectively, to the total variations. The microbial composition was separated in the second axis. The soil layer at 5 cm, 45 cm, and 85 cm depths each formed distinct clusters. Notably, the 5 cm layer was more distant from the deeper layers, indicating significant differences in the microbial community structure between the topsoil and the subsoil (p < 0.01). This statement is supported by Figure S8. This may be due to the higher moisture content and greater susceptibility of the topsoil soil to external environmental influences than the deeper soils, resulting in some changes in microbial community structure. In contrast, no significant differences were observed between the treatment and control groups, indicating that the presence of algae did not significantly affect the overall microbial community of the soil and thus did not disrupt the community composition of the soil. Further analysis of the distance matrix at the 5 cm soil level showed that the distance before and after the experiment was smaller in the treatment group (0.376) than in the control group (0.401), indicating that the microbial community was more altered in the control group. In conclusion, the above results show that the addition of algae did not significantly alter the soil microbial community and contributed to the maintenance of the original microbial community.
The RDA was employed to assess the impact of the individual environmental factor on the structure and composition of soil microbial communities (Figure S7), and the results showed that the explanatory power of the effects of RDA1 and RDA2 on community structure and composition were 62.55% and 20.28%, respectively. The environmental factors were selected as depth (D), moisture content, TOC, TN, TP, NH3-N and NO3-N, AKP, and UE, and the species information was selected as the results of the top 10 genus levels in absolute abundance of each sample. Bacillus showed a significant negative correlation with NH3-N. Pseudomonas, also a denitrifying bacterium, showed a significant positive correlation with both TN and NO3-N. Furthermore, according to the arrow length, it is easy to see that Limnobacter was the most influential microbial genus, which was most affected by moisture content, while there was no significant difference in the effect of environmental factors.

3.4. Functional Genes Involved in the Soil Nitrogen Cycle

The distribution of nitrogen cycle-related functional genes across various soil layers, contrasting the treatment and control groups, is presented in Figure S9. By the conclusion of the experiment, significant reduction was only observed (p < 0.05) in the overall abundance of the narG gene (from 2.22 × 10⁷ to 6.48 × 10⁷ copies/g down to 0.30 × 10⁶ to 6.07 × 10⁷ copies/g) and nirK genes (from 4.78 × 10⁶ to 8.42 × 10⁶ copies/g down to 1.07 × 10⁶ to 8.23 × 10⁶ copies/g). In the control group, no significant changes were observed in the abundance of any functional genes at the 0.05 significance level when comparing pre-irrigation (HB-b) and post-irrigation (HB-a) samples. In contrast, within the treatment group, a significant decrease was noted for the nirK gene (p < 0.05). Variability was also noted with depth. The abundance of nifH and nirS genes at the 5 cm depth notably increased post-experiment (p < 0.05), while the abundance of nirK, narG and nirS at the 85 cm depth significantly decreased (p < 0.05). In addition, the abundance of genes amoA, narG, nifH, nxrA in the topsoil of the treatment group were significantly higher than that of the control group after the experiment (p < 0.05).
Figure 5 illustrates a Principal Coordinates Analysis (PCoA) based on Bray–Curtis distances, which accounts for 87% of the total variation in functional gene composition. The analysis indicated no significant impact of experimental treatments on the functional genes, either before and after the irrigation or with and without the presence of S. javanicum. However, it is noteworthy that the functional genes in the 5 cm, 45 cm, and 85 cm soil layers distinctly formed three main clusters along the second principal axis (p < 0.05), suggesting that soil depth is the predominant factor influencing the overall distribution of functional genes, and the topsoil is the hotspot of nitrogen cycling.

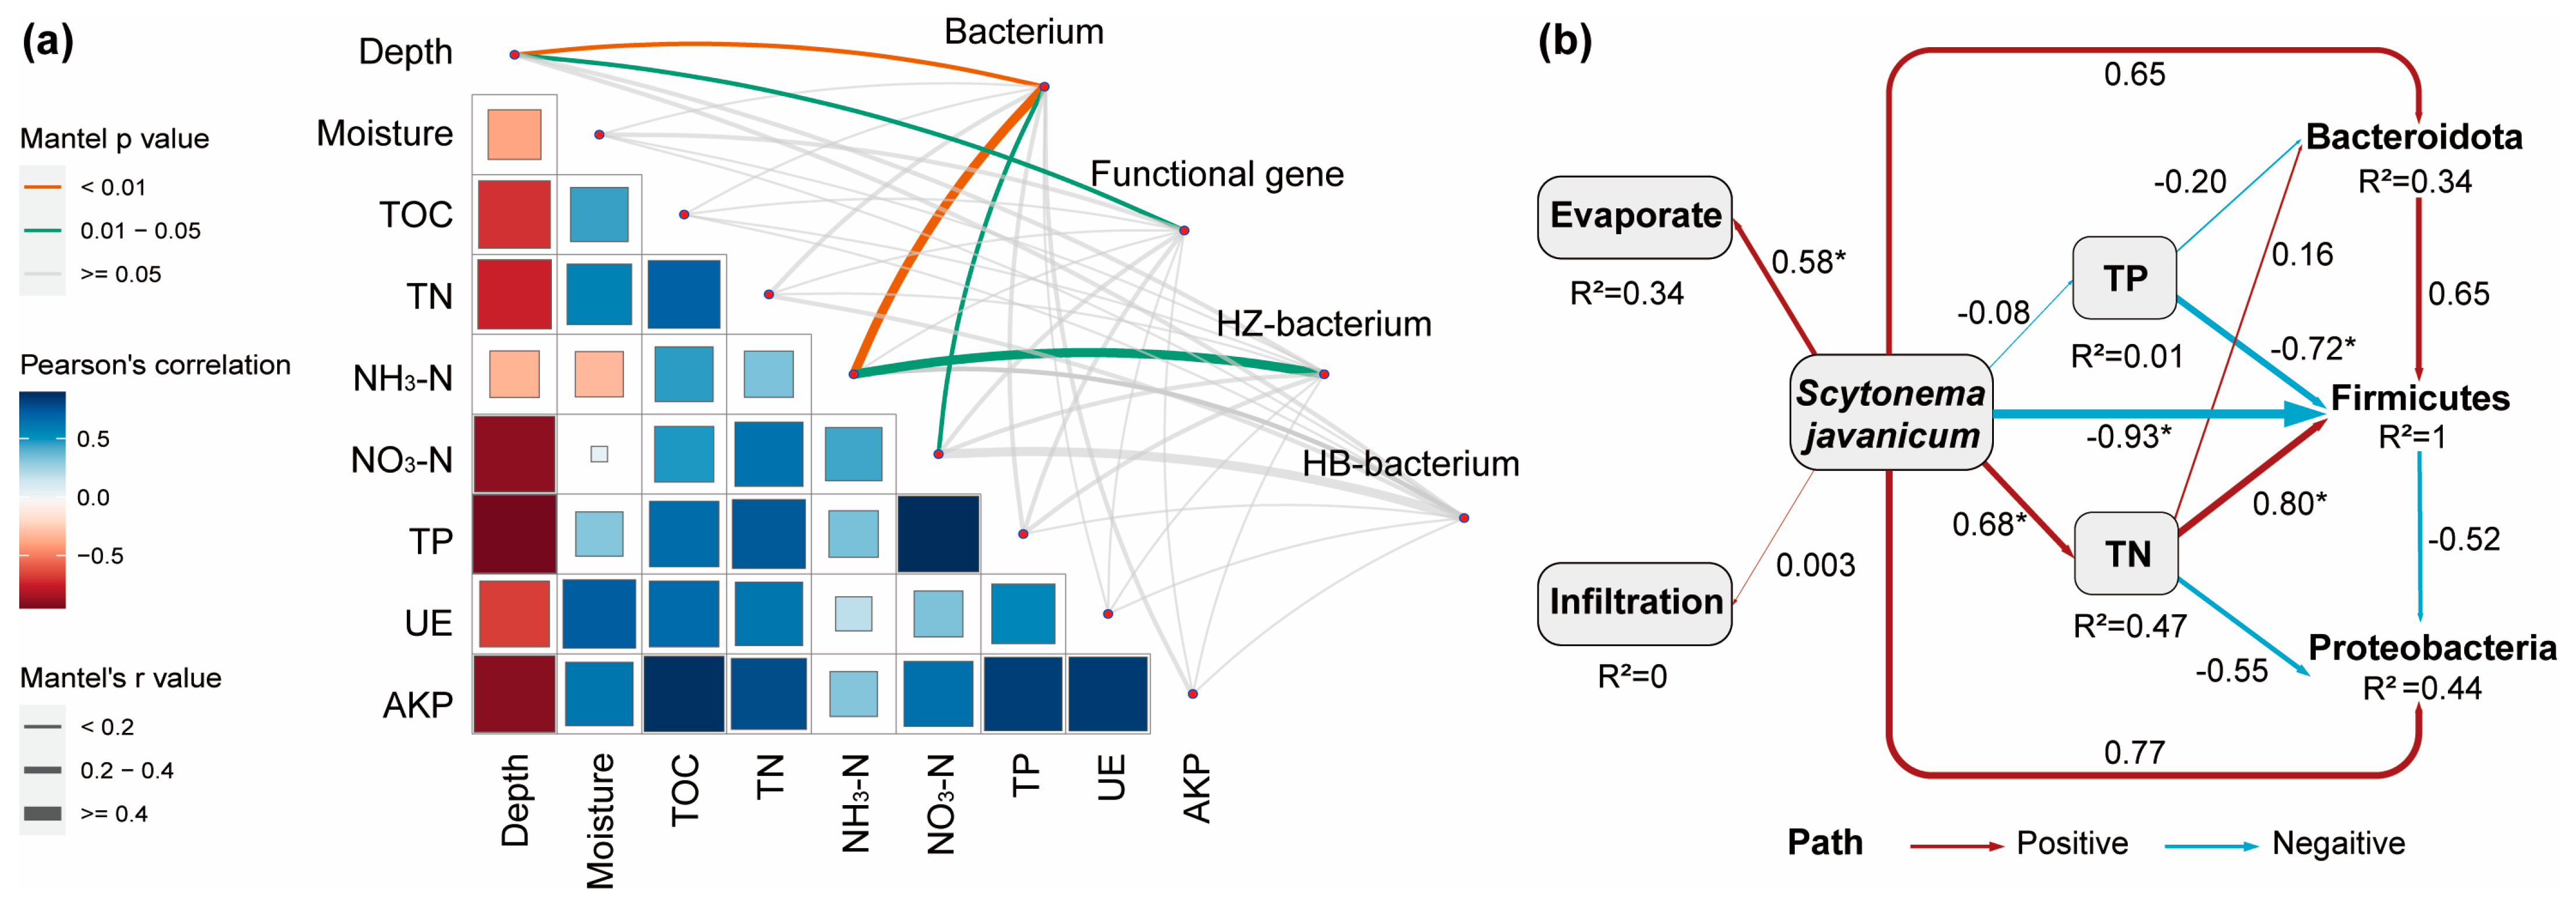
3.5. Factors Influencing Microbial Communities

The correlation between environmental factors and microbiota is illustrated in Figure 6. Most environmental factors are correlated with each other; among them, TN, NO3-N, and TP all showed significant correlations with depth (p < 0.05), with r values of −0.7293, −0.8284, and −0.9303, respectively. TOC and TP both showed significant correlations with TN (p < 0.05), with r values of 0.7497 and 0.6327, respectively. TP and NO3-N also showed a significant correlation (p < 0.05), with an r value of 0.8221. Functional genes were significantly correlated with depth only (p < 0.05), with an r value of 0.2558. Bacteria were significantly correlated with depth and NH3-N (p < 0.01) and significantly correlated with NO3-N (p < 0.05), with r values of 0.3507, 0.4557, and 0.3620, respectively. Mantel analysis of the treatment group showed that bacteria were significantly correlated with NH3-N (p < 0.05), with an r value of 0.5294. No significant correlation was found between bacteria and environmental factors in the control group. In general, both bacteria and functional genes were affected by depth, and the presence of algae essentially did not have a significant effect on the soil; only NH3-N was correlated, which is consistent with the previous changes in soil nutrients.
The RDA analysis at phyla level revealed that Bacteroidota, Firmicutes, and Proteobacteria exert the most significant explanatory influence. Based on the structural equation model (SEM), the path analysis was conducted to determine the direct and indirect effects of environmental factors on these three phyla (Figure 6b). The findings revealed that the presence of algae significantly influenced moisture, TN, and the abundance of Firmicutes. Specifically, algae presence had no significant positive effect on moisture infiltration but greatly enhanced moisture retention during the evaporation phase. Moreover, algae had a direct positive effect on TN (p < 0.05). Algae also indirectly impacted the microbial community through TN and TP. Among them, TP negatively affected Bacteroidota and Firmicutes (p < 0.05), while TN had a positive effect on both Bacteroidota and Firmicutes (p < 0.05). Proteobacteria was basically unaffected by changes in TN and TP. The findings suggest that the prevalence of Scytonema javanicum predominantly influences the nutritional profile of soil, which in turn has a significant impact on the composition of the dominant microbial communities.

4. Discussion

4.1. The Effect of Algae on the Physicochemical Properties of Soils

Previous studies have demonstrated that algal exudates [10] or algal products, such as compost [36] and biochar [37], can enhance soil water retention. The results of this work indicate that the presence of algae cells also played a positive role in maintaining soil moisture content; they allow more infiltrating water to remain in the topsoil. The combined action of algal and microorganisms [38,39] formed water-stable soil aggregates’ protective layer and increased the soil surface roughness, facilitating a reduction in the evaporation rate and maintaining soil moisture content [40,41]. In addition, the growth of algae in the topsoil can bind bacterial flocs and soil aggregates, and results in the formation of a dense structure [42] that inhibits evaporation [43,44]. Therefore, it is believed that the presence of algae in irrigation water helps to retain soil moisture content and reduce water loss, reducing the frequency and cost of irrigation.
The growth of S. javanicum may also affect soil nutrient characteristics through changes in the moisture content and microecological properties of the soil, which are important for the growth of crops. This finding is in line with the report of Alavarez [45]; it is believed that the cyanobacterium Anabaena cylindrica UTEX 1611 had a significant positive impact on the soil nutrients, especially the nitrogen content. Based on the changes in soil nutrients, it is presumed that the growth of algae contributes to the maintenance of TOC, TN, TP, and other nutrients in the surface soil [46,47]. Based on the specific conditions of the soil column surface and the characteristics of algae, this result may occur because the growth and reproduction of algae improved the physical structure of the surface soil, increased soil porosity and permeability, altered soil pH, and provided a good environment for microbial metabolic activities [48]. Additionally, S. javanicum has the capacity to regulate the redox potential of soil by modulating its moisture levels, thereby influencing the microbial activity, which aligns with the perspective of Khoshru [49]. This alteration can subsequently exert a significant impact on the nitrification and denitrification processes that transpire within the soil environment [50].
However, in the 5 cm soil layer, the TN of the treatment and control groups showed opposite changes briefly, which increased in the treatment group (p < 0.05), but decreased in the control, although it is not significant. The previous study [51,52,53] has proven that that nitrogen fixation does not compensate for N loss during denitrification, so the decrease in TN is expected in the topsoil of the control group. But the significant increasing of TN content within the topsoil of the treatment group can be predominantly attributed to the direct effects of S. javanicum, potentially operating through three ways. Firstly, the presence of algae may enhance nitrogen fixation; secondly, it could potentially reduce the process of denitrification; and thirdly, the decomposition of algal cells could release nitrogen-contained organic matter. In this study, the conditions with low levels of algal pollution were simulated, characterized by minimal biomass content. Consequently, the decomposition of deceased algal cells is unlikely to induce significant changes in the nitrogen content. Compared to the control group, the treatment group showed a higher relative abundance of denitrification-related functional genes, narG and nxrA, indicating that S. javanicum did not inhibit the denitrification activity of the broader microbial community. On the other hand, the capability of fixing atmospheric nitrogen of S. javanicum has been confirmed by Wu et al. [54]. Consequently, it is postulated that the principal driver behind the observed increase in nitrogen within the treatment group is the elevated nitrogen fixation capacity; this is substantiated by the notable increase of the nifH gene in the topsoil of the treatment group.
Analysis of the changes in TP revealed an interesting situation: the difference between the treatment group and control group at the 5 cm soil layer was approximately equal to the sum of the differences between the treatment group and the control group at the 45 cm and 85 cm soil layers, with the concentration of TP in the treatment group being higher at the 5 cm layer and that in the control group being higher in the 45 and 85 cm layers. This could be attributed to the presence of S. javanicum, which appears to mitigate the translocation of TP from the irrigation water towards the deeper strata of the soil column. This is consistent with the view of Liu et al. [55], that soil mulches and plant residues can effectively mitigate the loss of nutrients, particularly dissolved P, from soil to groundwater.
As a carbon source, TOC is involved in the process of nitrification and denitrification, providing energy and electron donors for the reactions to proceed [56,57], so all groups showed a decreasing trend in TOC after the experiment. However, the reduction in TOC in the treatment group was less than that in the control group at the 5 cm soil layer; this might be due to the metabolization and degradation of S. javanicum which can increase the TOC content in the environment [58]. Moreover, it has been shown that the accumulation rate of soil TOC can be accelerated by the degree of coverage and degradation of algae and plants, which supports the results of this study [59,60]. However, it is worth noting that the extracellular polysaccharides secreted by S. javanicum also played the important role that increases soil associativity and thus contributes to TOC accumulation [61,62]. Li et al. [63] also observed the important role of algal extracellular polymers that enhanced carbon accumulation in marine environments.
UE can hydrolyze urea to produce NH3-N, which provides substrates for nitrification and denitrification processes [64]. The results of Yahya [65] showed that the activity of UE is inhibited by the higher concentrations of NH3-N, which supports the results of higher UE in the treatment group. In addition, the enzyme activity of the surface soil was significantly greater than that of the deep soil, and the enzyme activity of the treatment group was stronger; it indicates the potential higher nutritional conversion efficiency in the topsoil of the treatment group, which is probably because the algae and microorganisms could secrete enzymes into the surrounding environment, directly or indirectly promoting the biogeochemical cycling of nutrients.

4.2. The Effect of Algae on Soil Microbial Communities and Functional Genes

Nitrifying and denitrifying microorganisms are crucial for the N-cycling; the results of the network analysis also showed that the key genera within the soil microbial community mainly belonged to the phylum associated with nitrification and denitrification. According to previous research [66], most denitrifying bacteria belong to Proteobacteria [66], which also dominated in this work. In both the treatment and control groups, Proteobacteria did not show significant changes before and after the irrigation, and was shown as not significantly affected by TN or TP. Therefore, it is speculated that the presence of B may have more of an impact on the ecological function of the microbial community, rather than the microbial community itself.
In this study, the presence of S. javanicum increased the number of copies of functional genes for nitrification, prompting more NH3-N to be oxidized to NO3-N and providing more reactants for denitrification. The presence of S. javanicum would increase the topsoil moisture content and enhance the anaerobic soil environment, which is conducive to the progress of denitrification [50]. Therefore, there was an overall trend showing promotion of more NO3-N to undergo the denitrification process; this is consistent with the trend of changes in NO3-N content in soil. The evidence is an increase in the abundance of narG and nxrA genes in the 5 cm soil layer of the treatment group compared to the control (p < 0.01); both genes were closely related to the denitrification process [67].
The nirS and nirK genes play equivalent functions [68], but showed completely different trends. Overall, nirK was decreased after the irrigation treatment, but nirS was increased. However, the decrease in the abundance of functional genes mainly occurs in deeper soil layers, especially 85 cm, but for the topsoil, the total abundance of nirS and nirK genes increased, especially the nirS which was almost doubled to 11.60 × 10⁷ copies/g from 5.38 × 10⁷ copies/g. The changes in the nirK gene copy number were significantly lower than those in the nirS gene (p < 0.01). This may be because nirS-containing microorganisms are more dominant in the environment, and thus the nirS gene abundance is less influenced by the environment [69,70]. Chen et al. [71] also found that nirK-containing microorganisms show higher sensitivity to mineral nitrogen compounds than nirS-containing microorganisms [72,73,74]. In addition, there are many other functional genes and undiscovered biochemical reactions involved in the nitrogen cycle, which may also have an impact on the results of this experiment [75,76].

5. Conclusions

In this work, the impact of irrigating with slightly algae-contaminated water on various soil properties was investigated, including its hydrological and nutrient profiles, enzymatic activities, microbial community composition, and the prevalence of nitrogen cycle-associated functional genes. The findings indicate that the application of S. javanicum does not disrupt the equilibrium of the local microbial community, while positively influencing soil moisture retention. Following the experimental treatments, a notable reduction in water content was observed in the control group (25.17%) compared to the treatment group (26.42%), mainly attributed to diminished evaporative losses (10.66 mm and 22.84 mm in the treatment versus control group, respectively). Additionally, the incorporation of S. javanicum has led to a significant reallocation of soil nutrients, particularly nitrogen, essential for plant growth, with both ammonia nitrogen and total nitrogen levels in the treatment (0.70 mg/kg and 0.54 g/kg) markedly exceeding those in the control group (0.43 mg/kg and 0.49 g/kg). In sum, employing slightly algae-contaminated water as an alternative to conventional irrigation sources is a practical and beneficial approach. It diversifies irrigation options and alleviates the financial and time-related pressures of irrigation, thereby easing the strain on agricultural water resources. However, it is important to recognize that current research is limited to a single type of exogenous cyanobacteria, which may affect the general applicability of our conclusions. Future studies should expand the range of cyanobacteria species to gain a more comprehensive understanding.

Supplementary Materials

The following supporting information can be downloaded at: https://www.mdpi.com/article/10.3390/pr12081639/s1, Figure S1: Sampling point location diagram. Figure S2: Experimental setup diagram (a) Soil column design drawings; (b) actual arrangement of soil columns. Figure S3: The comparison of soil water content between experimental and control groups. Figure S4: The nutrient characteristics of each layer of soil. Asterisk represents a significant difference, where * represents p < 0.05,** represents p < 0.01,*** represents p < 0.001. Figure S5: The rarefaction curves of various groups. Figure S6: The microbial network for the top 50 genera in terms of abundance. Different colored nodes represent different clades and the size of the nodes is related to the number of links. Red lines represent positive correlations between two nodes; green lines represent negative correlations. Figure S7: Dendrogram of the differences in relative abundance of microbial communities in each soil layer. Figure S8: Redundancy analysis (RDA) between environmental factors, the top 10 genera (a) and phyla (b) of the microbial community and different samples. Blue arrows indicate environmental factors; red arrows indicate microorganisms; green circles indicate samples without experimental treatment; brown circles indicate samples with experimental treatment; green names indicate control groups; brown sample names indicate experimental groups. Figure S9: Effect of algal growth on the copy number of soil functional genes. Including functional genes for (a) amoA, (b) amoB, (c) narG, (d) nifH, (e) nirK, (f) nirS, (g) nosZ, and (h) nxrA.; Table S1: Particle size composition of soil particles at different depths. Table S2: Major functional genes involved in the soil nitrogen cycle. Table S3: Primers and sequences of functional genes. Table S4: System of qPCR amplification. Procedure of PCR and qPCR amplification. Table S5: Procedure of PCR and qPCR amplification. Table S6: The α-diversity index of each sample.

Author Contributions

Conceptualization, E.X. and Z.B.; formal analysis, H.Z., X.W. and C.H.; funding acquisition, E.X. and Z.T.; methodology, E.X. and H.Z.; project administration, E.X. and Z.B.; resources, E.X., Z.B. and X.Z.; supervision, E.X. and X.Z.; investigation H.Z. and X.W.; writing—original draft, H.Z., X.W. and C.H.; visualization H.Z. and X.W.; writing—review and editing, E.X. and Z.B. All authors have read and agreed to the published version of the manuscript.

Funding

This research was supported by the Xinjiang Production and Construction Corps Science and Technology Bureau (No. 2023AB071) and the Ministry of Science and Technology of the People’s Republic of China (No. 2023YFD1900803 and 2021YFE0192500).

Data Availability Statement

Raw data of microbial community are available in the National Genomics Data Center at the link https://ngdc.cncb.ac.cn/gsa/browse/CRA011824 (accessed on 14 July 2023). All other data will be available from the corresponding author on reasonable request.

Acknowledgments

This research was supported by the Bintuan Science and Technology Program (No. 2023AB071) and National Key R&D Program of China (No. 2023YFD1900803 and 2021YFE0192500). The authors would also like to thank Dr. Naomichi Tanaka and Dr. Akira Harimoto for their input on this paper.

Conflicts of Interest

The authors declare that they have no known competing financial interests or personal relationships that could have appeared to influence the work reported in this paper.

References

  1. Liu, K.; Bo, Y.; Li, X.; Wang, S.; Zhou, G. Uncovering Current and Future Variations of Irrigation Water Use Across China Using Machine Learning. Earth’s Future 2024, 12, e2023EF003562. [Google Scholar] [CrossRef]
  2. Bhardwaj, A.; Kumar, M.; Alshehri, M.; Keshta, I.; Abugabah, A.; Sharma, S.K. Smart water management framework for irrigation in agriculture. Environ. Technol. 2024, 45, 2320–2334. [Google Scholar] [CrossRef]
  3. Siebert, S.; Kummu, M.; Porkka, M.; Doell, P.; Ramankutty, N.; Scanlon, B.R. A global data set of the extent of irrigated land from 1900 to 2005. Hydrol. Earth Syst. Sci. 2015, 19, 1521–1545. [Google Scholar] [CrossRef]
  4. Bakhoum, G.S.; Sadak, M.S.; Thabet, M. Induction of tolerance in groundnut plants against drought stress and Cercospora leaf spot disease with exogenous application of Arginine and Sodium nitroprusside under field condition. J. Soil Sci. Plant Nutr. 2023, 23, 6612–6631. [Google Scholar] [CrossRef]
  5. Chen, W.; Lu, S.; Jiao, W.; Wang, M.; Chang, A.C. Reclaimed water: A safe irrigation water source? Environ. Dev. 2013, 8, 74–83. [Google Scholar] [CrossRef]
  6. Lyu, S.; Chen, W. Soil quality assessment of urban green space under long-term reclaimed water irrigation. Environ. Sci. Pollut. Res. 2016, 23, 4639–4649. [Google Scholar] [CrossRef]
  7. Moreira, C.; Vasconcelos, V.; Antunes, A. Cyanobacterial Blooms: Current Knowledge and New Perspectives. Earth 2022, 3, 127–135. [Google Scholar] [CrossRef]
  8. Yamamoto, T.; Fujiyama, H.; Miyamoto, K.; Hatanaka, J.; Wen, G.; Asae, A. Optimizing water cleaning system for microirrigation in the Tohaku irrigation project of Japan. In National Irrigation Symposium Proceedings of the 4th Decennial Symposium, Phoenix, Arizona, USA, November 14–16; American Society of Agricultural Engineers: St. Joseph, MO, USA, 2000. [Google Scholar]
  9. Cao, Q.; Steinman, A.D.; Su, X.; Xie, L. Effects of microcystins contamination on soil enzyme activities and microbial community in two typical lakeside soils. Environ. Pollut. 2017, 231, 134–142. [Google Scholar] [CrossRef]
  10. Bakhoum, G.S.; Tawfik, M.M.; Kabesh, M.O.; Sadak, M.S. Potential role of algae extract as a natural stimulating for wheat production under reduced nitrogen fertilizer rates and water deficit. Biocatal. Agric. Biotechnol. 2023, 51, 102794. [Google Scholar] [CrossRef]
  11. Xiao, B.; Hu, K.; Ren, T.; Li, B. Moss-dominated biological soil crusts significantly influence soil moisture and temperature regimes in semiarid ecosystems. Geoderma 2016, 263, 35–46. [Google Scholar] [CrossRef]
  12. Sandoval, P.A.; Lucia, C.S.; Manuel, M.N.; Garcia-Oliva, F.; Alarcon, A.; Adriana, M.S.; Esperon-Rodriguez, M. Biocrusts, inside and outside resource islands of Mimosa luisana (Leguminosae), improve soil carbon and nitrogen dynamics in a tropical semiarid ecosystem. Eur. J. Soil Biol. 2016, 74, 93–103. [Google Scholar] [CrossRef]
  13. Lan, S.; Zhang, Q.; He, Q.; Yang, H.; Hu, C. Resource utilization of microalgae from biological soil crusts: Biodiesel production associated with desertification control. Biomass Bioenergy 2018, 116, 189–197. [Google Scholar] [CrossRef]
  14. Canton, Y.; Chamizo, S.; Rodriguez-Caballero, E.; Lazar, R.; Roncero-Ramos, B.; Raul, R.J.; Sole-Benet, A. Water Regulation in Cyanobacterial Biocrusts from Drylands: Negative Impacts of Anthropogenic Disturbance. Water 2020, 12, 720. [Google Scholar] [CrossRef]
  15. Wang, Z.; Liu, Y.; Zhao, L. Development of fungal community is a potential indicator for evaluating the stability of biological soil crusts in temperate desert revegetation. Appl. Soil Ecol. 2020, 147, 103404. [Google Scholar] [CrossRef]
  16. Fisher, K.; Jefferson, J.; Vaishampayan, P. Bacterial Communities of Mojave Desert Biological Soil Crusts Are Shaped by Dominant Photoautotrophs and the Presence of Hypolithic Niches. Front. Ecol. Evol. 2020, 7, 518. [Google Scholar] [CrossRef]
  17. Coban, O.; De, D.G.B.; van der Ploeg, M. Soil microbiota as game-changers in restoration of degraded lands. Science 2022, 375, abe0725. [Google Scholar] [CrossRef] [PubMed]
  18. Kheirfam, H. Increasing soil potential for carbon sequestration using microbes from biological soil crusts. J. Arid. Environ. 2020, 172, 104022. [Google Scholar] [CrossRef]
  19. Housman, D.C.; Powers, H.H.; Collins, A.D.; Belnap, J. Carbon and nitrogen fixation differ between successional stages of biological soil crusts in the Colorado Plateau and Chihuahuan Desert. J. Arid. Environ. 2006, 66, 620–634. [Google Scholar] [CrossRef]
  20. Zhang, Y. The microstructure and formation of biological soil crusts in their early developmental stage. Chin. Sci. Bull. 2005, 50, 117–121. [Google Scholar] [CrossRef]
  21. Yoon, S.; Cruz-Garcia, C.; Sanford, R.; Ritalahti, K.M.; Loeffler, F.E. Denitrification versus respiratory ammonification: Environmental controls of two competing dissimilatory NO3/NO2 reduction pathways in Shewanella loihica strain PV-4. ISME J. 2015, 9, 1093–1104. [Google Scholar] [CrossRef]
  22. Neumann, D.; Heuer, A.; Hemkemeyer, M.; Martens, R.; Tebbe, C.C. Importance of soil organic matter for the diversity of microorganisms involved in the degradation of organic pollutants. ISME J. 2014, 8, 1289–1300. [Google Scholar] [CrossRef] [PubMed]
  23. Wang, M.; Qu, L.; Ma, K.; Yuan, X. Soil microbial properties under different vegetation types on Mountain Han. Sci. China-Life Sci. 2013, 56, 561–570. [Google Scholar] [CrossRef] [PubMed]
  24. Sun, R.; Wang, F.; Hu, C.; Liu, B. Metagenomics reveals taxon-specific responses of the nitrogen-cycling microbial community to long-term nitrogen fertilization. Soil Biol. Biochem. 2021, 156, 108214. [Google Scholar] [CrossRef]
  25. Grassmann, C.S.; Mariano, E.; Diniz, P.P.; Borges, B.M.F.; Borges, C.D.; Tsai, S.M.; Rosolem, C.A. Functional N-cycle genes in soil and N2O emissions in tropical grass-maize intercropping systems. Soil Biol. Biochem. 2022, 169, 108655. [Google Scholar] [CrossRef]
  26. Ammar, E.E.; Aioub, A.A.A.; Elesawy, A.E.; Karkour, A.M.; Mouhamed, M.S.; Amer, A.A.; El-Shershaby, N.A. Algae as Bio-fertilizers: Between current situation and future prospective. Saudi J. Biol. Sci. 2022, 29, 3083–3096. [Google Scholar] [CrossRef] [PubMed]
  27. Zhu, Q.; Wu, L.; Li, X.; Li, G.; Li, J.; Li, C.; Zhao, C.; Wang, F.; Du, C.; Deng, C.; et al. Effects of ambient temperature on the redistribution efficiency of nutrients by desert cyanobacteria- Scytonema javanicum. Sci. Total Environ. 2020, 737, 139733. [Google Scholar] [CrossRef] [PubMed]
  28. Chen, T.; Chen, X.; Zhang, S.; Zhu, J.; Tang, B.; Wang, A.; Dong, L.; Zhang, Z.; Yu, C.; Sun, Y.; et al. The Genome Sequence Archive Family: Toward Explosive Data Growth and Diverse Data Types. Genom. Proteom. Bioinform. 2021, 19, 578–583. [Google Scholar] [CrossRef] [PubMed]
  29. Wei, Y.J.; Wu, H.Y.; Zhang, X.D.; Liang, Y.B.; Shi, D.Y.; Wang, L.; Li, H.B. Comparative analysis of chlorine-resistant bacteria after chlorination and chloramination in drinking water treatment plants. J. Hazard. Mater. 2024, 4, 100138. [Google Scholar] [CrossRef]
  30. Liu, Y.X.; Chen, L.; Ma, T.; Li, X.; Zheng, M.; Zhou, X.; Chen, L.; Qian, X.; Xi, J.; Lu, H.; et al. EasyAmplicon: An easy-to-use, open-source, reproducible, and community-based pipeline for amplicon data analysis in microbiome research. iMeta 2023, 2, e83. [Google Scholar] [CrossRef]
  31. Li, T.; Zhang, Y.; He, B.; Wu, X.; Du, Y. Nitrate loss by runoff in response to rainfall amount category and different combinations of fertilization and cultivation in sloping croplands. Agric. Water Manag. 2022, 273, 107916. [Google Scholar] [CrossRef]
  32. Cao, Y.; Bai, M.; Han, B.; Butterly, C.; Hu, H.; He, J.; Griffith, D.W.T.; Chen, D. NH3 and greenhouse gas emissions during co-composting of lignite and poultry wastes and the following amendment of co-composted products in soil. Environ. Technol. 2024, 1, 1–14. [Google Scholar]
  33. Lan, T.; He, X.; Wang, Q.; Deng, O.; Zhou, W.; Luo, L.; Chen, G.; Zeng, J.; Yuan, S.; Zeng, M.; et al. Synergistic effects of biological nitrification inhibitor, urease inhibitor, and biochar on NH3 volatilization, N leaching, and nitrogen use efficiency in a calcareous soil–wheat system. Appl. Soil Ecol. 2022, 174, 104412. [Google Scholar] [CrossRef]
  34. Chen, T.; Zhang, Y.; Xia, M.; Wang, Q. Soil properties and functional genes in nitrogen removal process of bioretention. Environ. Technol. 2024, 45, 2268–2283. [Google Scholar] [CrossRef] [PubMed]
  35. Rodriguez, M.J.; Saggar, S.; Berben, P.; Palmada, T.; Lopez-Villalobos, N.; Pal, P. Use of a urease inhibitor to mitigate ammonia emissions from urine patches. Environ. Technol. 2021, 42, 20–31. [Google Scholar] [CrossRef] [PubMed]
  36. González Fernández, L.A.; Castillo Ramos, V.; Sánchez Polo, M.; Medellín Castillo, N.A. Fundamentals in applications of algae biomass: A review. J. Environ. Manag. 2023, 338, 117830. [Google Scholar] [CrossRef] [PubMed]
  37. Pak, T.; Gomari, K.E.; Bose, S.; Tonon, T.; Hughes, D.; Gronnow, M.; Macquarrie, D. Biochar from brown algae: Production, activation, and characterisation. Bioresour. Technol. Rep. 2023, 24, 101688. [Google Scholar] [CrossRef]
  38. Yue, Y.; Cheng, L.; Sun, Y.; Pang, Y.; Wu, B.; Shi, L.; He, J.; Jia, X. Changes of soil water budget in the area covered by biological soil crusts in Mu Us sandy land, China. J. Appl. Ecol. 2022, 33, 1861–1870. [Google Scholar]
  39. Chamizo, S.; Mugnai, G.; Rossi, F.; Certini, G.; De Philippis, R. Cyanobacteria Inoculation Improves Soil Stability and Fertility on Different Textured Soils: Gaining Insights for Applicability in Soil Restoration. Front. Environ. Sci. 2018, 6, 49. [Google Scholar] [CrossRef]
  40. Eldridge, D.J.; Freudenberger, D.; Koen, T.B. Diversity and abundance of biological soil crust taxa in relation to fine and coarse-scale disturbances in a grassy eucalypt woodland in eastern Australia. Plant Soil 2006, 281, 255–268. [Google Scholar] [CrossRef]
  41. David, Q.; Jonah, M.G.; John, M.; Jason, C.Q. Geographical assessment of open pond algal productivity and evaporation losses across the United States. Algal Res. 2021, 60, 102483. [Google Scholar]
  42. Sun, L.; Bai, Z.; Yang, Q.; Fu, R.; Li, H.; Li, X. In situ assessment of the initial phase of wastewater biofilm formation: Effect of the presence of algae in an aerobic bacterial biofilm system. Water Res. 2024, 253, 121283. [Google Scholar] [CrossRef] [PubMed]
  43. Zhou, L.; Lamusa, A. Influence mechanism of development of biological soil crust on evaporation process. J. Arid Land Resour. Environ. 2011, 25, 193–200. [Google Scholar]
  44. Chamizo, S.; Canton, Y.; Rodriguez-Caballero, E.; Domingo, F. Biocrusts positively affect the soil water balance in semiarid ecosystems. Ecohydrology 2016, 9, 1208–1221. [Google Scholar] [CrossRef]
  45. Alvarez, A.L.; Weyers, S.L.; Gardner, R.D. Cyanobacteria-based soil amendments in the soil-plant system: Effects of inoculations on soil nutrient and microbial dynamics under spring wheat growth. Algal Res. 2024, 77, 103326. [Google Scholar] [CrossRef]
  46. Elbert, W.; Weber, B.; Burrows, S.; Steinkamp, J.; Budel, B.; Andreae, M.O.; Poschl, U. Contribution of cryptogamic covers to the global cycles of carbon and nitrogen. Nat. Geosci. 2012, 5, 459–462. [Google Scholar] [CrossRef]
  47. Jassey, V.E.J.; Walcker, R.; Kardol, P.; Geisen, S.; Heger, T.; Lamentowicz, M.; Hamard, S.; Lara, E. Contribution of soil algae to the global carbon cycle. New Phytol. 2022, 234, 64–76. [Google Scholar] [CrossRef] [PubMed]
  48. Lan, S.; Ouyang, H.; Wu, L.; Zhang, D.; Hu, C. Biological soil crust community types differ in photosynthetic pigment composition, fluorescence and carbon fixation in Shapotou region of China. Appl. Soil Ecol. 2017, 111, 9–16. [Google Scholar] [CrossRef]
  49. Khoshru, B.; Khoshmanzar, E.; Asgari Lajayer, B.; Ghorbanpour, M. Soil moisture–mediated changes in microorganism biomass and bioavailability of nutrients in paddy soil. In Plant Stress Mitigators; Ghorbanpour, M., Adnan Shahid, M., Eds.; Academic Press: Cambridge, MA, USA, 2023; pp. 479–494. [Google Scholar]
  50. Liu, M.; Xia, L.; Liu, R.; Gao, Z.; Han, C.; Feng, J.; Wang, J.; Qu, W.; Xing, T. Degradation of High-Concentration Nitrate Nitrogen in Groundwater: A Laboratory Study. J. Chem. 2021, 2021, 4797946. [Google Scholar] [CrossRef]
  51. Yao, X.; Zhang, L.; Zhang, Y.; Zhang, B.; Zhao, Z.; Zhang, Y.; Li, M.; Jiang, X. Nitrogen Fixation Occurring in Sediments: Contribution to the Nitrogen Budget of Lake Taihu, China. J. Geophys. Res.-Biogeosci. 2018, 123, 2661–2674. [Google Scholar] [CrossRef]
  52. Shatwell, T.; Koehler, J. Decreased nitrogen loading controls summer cyanobacterial blooms without promoting nitrogen-fixing taxa: Long-term response of a shallow lake. Limnol. Oceanogr. 2019, 64, S166–S178. [Google Scholar] [CrossRef]
  53. Xu, H.; McCarthy, M.J.; Paerl, H.W.; Brookes, J.D.; Zhu, G.; Hall, N.S.; Qin, B.; Zhang, Y.; Zhu, M.; Hampel, J.J.; et al. Contributions of external nutrient loading and internal cycling to cyanobacterial bloom dynamics in Lake Taihu, China: Implications for nutrient management. Limnol. Oceanogr. 2021, 66, 1492–1509. [Google Scholar] [CrossRef]
  54. Wu, L.; Zhang, C.; Vadiveloo, A.; Montes, M.L.; Xia, L.; Song, S.; Fernandez, M.A.; Lan, S. Efficient nutrient recycling from wastewater to deserts: A comparative study on biocrust cyanobacteria performance. Chem. Eng. J. 2024, 491, 151927. [Google Scholar] [CrossRef]
  55. Liu, J.; Macrae, M.L.; Elliott, J.A.; Baulch, H.M.; Wilson, H.F.; Kleinman, P.J.A. Impacts of Cover Crops and Crop Residues on Phosphorus Losses in Cold Climates: A Review. J. Environ. Qual. 2019, 48, 850–868. [Google Scholar] [CrossRef]
  56. Sun, D.; Jiang, X.; Wu, Q.; Zhou, N. Intragenomic Heterogeneity of 16S rRNA Genes Causes Overestimation of Prokaryotic Diversity. Appl. Environ. Microbiol. 2013, 79, 5962–5969. [Google Scholar] [CrossRef]
  57. Bothe, H.; Schmitz, O.; Yates, M.G.; Newton, W.E. Nitrogen Fixation and Hydrogen Metabolism in Cyanobacteria. Microbiol. Mol. Biol. Rev. 2010, 74, 529–551. [Google Scholar] [CrossRef]
  58. Nguyen, M.L.; Westerhoff, P.; Baker, L.; Hu, Q.; Esparza-Soto, M.; Sommerfeld, M. Characteristics and reactivity of algae-produced dissolved organic carbon. J. Environ. Eng. 2005, 131, 1574–1582. [Google Scholar] [CrossRef]
  59. Li, X.; Zhang, P.; Su, Y.; Jia, R. Carbon fixation by biological soil crusts following revegetation of sand dunes in arid desert regions of China: A four-year field study. Catena 2012, 97, 119–126. [Google Scholar] [CrossRef]
  60. Su, Y.; Li, X.; Chen, Y.; Zhang, Z.; Li, Y. Carbon fixation of cyanobacterial–algal crusts after desert fixation and its implication to soil organic carbon accumulation in desert. Land Degrad. Dev. 2013, 24, 342–349. [Google Scholar]
  61. Song, X.; Bo, Y.; Feng, Y.; Tan, Y.; Zhou, C.; Yan, X.; Ruan, R.; Xu, Q.; Cheng, P. Potential applications for multifunctional microalgae in soil improvement. Front. Environ. Sci. 2022, 10, 1035332. [Google Scholar] [CrossRef]
  62. Redmile-Gordon, M.; Gregory, A.S.; White, R.P.; Watts, C.W. Soil organic carbon, extracellular polymeric substances (EPS), and soil structural stability as affected by previous and current land-use. Geoderma 2020, 363, 114143. [Google Scholar] [CrossRef]
  63. Li, J.; Xu, M.; Wang, J.; Lan, C.; Lai, J. Effects of nutrient limitation on cell growth, exopolysaccharide secretion and TEP production of Phaeocystis globosa. Mar. Environ. Res. 2023, 183, 105801. [Google Scholar] [CrossRef]
  64. Kappaun, K.; Piovesan, A.R.; Carlini, C.R.; Ligabue-Braun, R. Ureases: Historical aspects.; catalytic.; and non-catalytic properties—A review. J. Adv. Res. 2018, 13, 3–17. [Google Scholar] [CrossRef]
  65. Yahya, M.N.; Gökçekuş, H.; Orhon, D.; Keskinler, B.; Karagunduz, A.; Omwene, P.I. A Study on the Hydrolysis of Urea Contained in Wastewater and Continuous Recovery of Ammonia by an Enzymatic Membrane Reactor. Processes 2021, 9, 1703. [Google Scholar] [CrossRef]
  66. Yang, Z.; Zhou, Q.; Sun, H.; Jia, L.; Zhao, L.; Wu, W. Metagenomic analyses of microbial structure and metabolic pathway in solid-phase denitrification systems for advanced nitrogen removal of wastewater treatment plant effluent: A pilot-scale study. Water Res. 2021, 196, 117067. [Google Scholar] [CrossRef]
  67. Yuan, D.; Zheng, L.; Liu, Y.X.; Cheng, H.; Ding, A.; Wang, X.; Tan, Q.; Wang, X.; Xing, Y.; Xie, E.; et al. Nitrifiers Cooperate to Produce Nitrous Oxide in Plateau Wetland Sediments. Environ. Sci. Technol. 2023, 57, 810–821. [Google Scholar] [CrossRef]
  68. Shrewsbury, L.H.; Smith, J.L.; Huggins, D.R.; Carpenter-Boggs, L.; Reardon, C.L. Denitrifier abundance has a greater influence on denitrification rates at larger landscape scales but is a lesser driver than environmental variables. Soil Biol. Biochem. 2016, 103, 221–231. [Google Scholar] [CrossRef]
  69. Chen, X.; Jiang, H.; Sun, X.; Zhu, Y.; Yang, L. Nitrification and denitrification by algae-attached and free-living microorganisms during a cyanobacterial bloom in Lake Taihu.; a shallow Eutrophic Lake in China. Biogeochemistry 2016, 131, 135–146. [Google Scholar] [CrossRef]
  70. Dai, H.; Zhu, R.; Sun, B.; Che, C.; Hou, L. Effects of Sea Animal Activities on Tundra Soil Denitrification and nirS- and nirK-Encoding Denitrifier Community in Maritime Antarctica. Front. Microbiol. 2020, 11, 573302. [Google Scholar] [CrossRef]
  71. Chen, Z.; Ma, J.; Liu, Y.; Zhao, J.; Ma, J.; Yu, Q.; Zou, P.; Lin, H.; Wang, Q. Differential responses of soil nirS- and nirK-type denitrifying microbial communities to long-term application of biogas slurry in a paddy soil. Appl. Soil Ecol. 2023, 182, 104711. [Google Scholar] [CrossRef]
  72. Li, J.; Wang, J.; Hu, H.; Cai, Z.; Lei, Y.; Li, W.; Zhang, M.; Li, Z.; Zhu, Y.; Cui, L. Changes of the denitrifying communities in a multi-stage free water surface constructed wetland. Sci. Total Environ. 2019, 650, 1419–1425. [Google Scholar] [CrossRef]
  73. Shi, R.; Xu, S.; Qi, Z.; Huang, H.; Liang, Q. Seasonal patterns and environmental drivers of nirS- and nirK-encoding denitrifiers in sediments of Daya Bay.; China. Oceanologia 2019, 61, 308–320. [Google Scholar] [CrossRef]
  74. Zheng, Y.; Hou, L.; Liu, M.; Gao, J.; Yin, G.; Li, X.; Deng, F.; Lin, X.; Jiang, X.; Chen, F.; et al. Diversity.; Abundance.; and Distribution of nirS-Harboring Denitrifiers in Intertidal Sediments of the Yangtze Estuary. Microb. Ecol. 2015, 70, 30–40. [Google Scholar] [CrossRef] [PubMed]
  75. Kuypers, M.M.M.; Marchant, H.K.; Kartal, B. The microbial nitrogen-cycling network. Nat. Rev. Microbiol. 2018, 16, 263–276. [Google Scholar] [CrossRef] [PubMed]
  76. Graf, D.R.H.; Zhao, M.; Jones, C.M.; Hallin, S. Soil type overrides plant effect on genetic and enzymatic N2O production potential in arable soils. Soil Biol. Biochem. 2016, 100, 125–128. [Google Scholar] [CrossRef]
Figure 1. Effect of algal growth on soil water content. (a) Variation in soil water content and infiltration in each group during the infiltration stage. (b) Variation in soil water content with time for each group during the evaporation stage. The letters represent the groups with different treatments; HZ is the experimental group with algae inoculated on the surface of the soil column and HB is the control group without algae.
Processes 12 01639 g001
Figure 2. The nutrient characteristics of soil in treatment and control group. Asterisk represents a significant difference, where * represents p < 0.05, *** represents p < 0.001, the black dots represent outliers.
Processes 12 01639 g002
Figure 3. The composition of microbial communities within soils at the phylum and genus level. (a) Chord diagram showing correspondence between grouping and species composition at the phylum level, taking the top 10 phyla of the microbial community, and (b) stacked histograms showing the community structure of species at the genus level.
Processes 12 01639 g003
Figure 4. Principal coordinates analysis (PCoA) of samples based on Bray–Cutis distance. (a) Analysis of different depths; (b) intergroup analysis of experimental and control groups; (c) pre- and post-experimental analysis.
Processes 12 01639 g004
Figure 5. Principal coordinates analysis (PCoA) of functional genes based on Bray–Cutis distance. (a) Analysis of soil layers at different depths; (b) intergroup analysis of experimental and control groups; (c) pre- and post-experimental analysis.
Processes 12 01639 g005
Figure 6. The influence of environmental factors on the bacterial communities. (a) Mantel test for correlations between the different environmental factors and the whole and subgroup microbial community, and functional gene. Where the size of the squares and the color shades represent the size of the correlation, the thickness of the line represents the Mantel correlation and the different colors represent significant differences. (b) Path analysis based on structural equation model shows direct and indirect effects between environmental variables and the keystone microorganisms. Where * represents p < 0.05. Blue for negative effects; red for positive effect; the number next to the path is the path coefficient (normalized regression weight), and the width of the line is directly proportional to the strength of the path coefficient. The model parameters are assumed as follows: Fisher’s C = 6.259, P = 0.181, AIC = 73.484.
Processes 12 01639 g006
Disclaimer/Publisher’s Note: The statements, opinions and data contained in all publications are solely those of the individual author(s) and contributor(s) and not of MDPI and/or the editor(s). MDPI and/or the editor(s) disclaim responsibility for any injury to people or property resulting from any ideas, methods, instructions or products referred to in the content.

