
Experimental Study on the Mechanical Properties of Cracked Limestone Reinforced by Modified Cement Grouting


Abstract
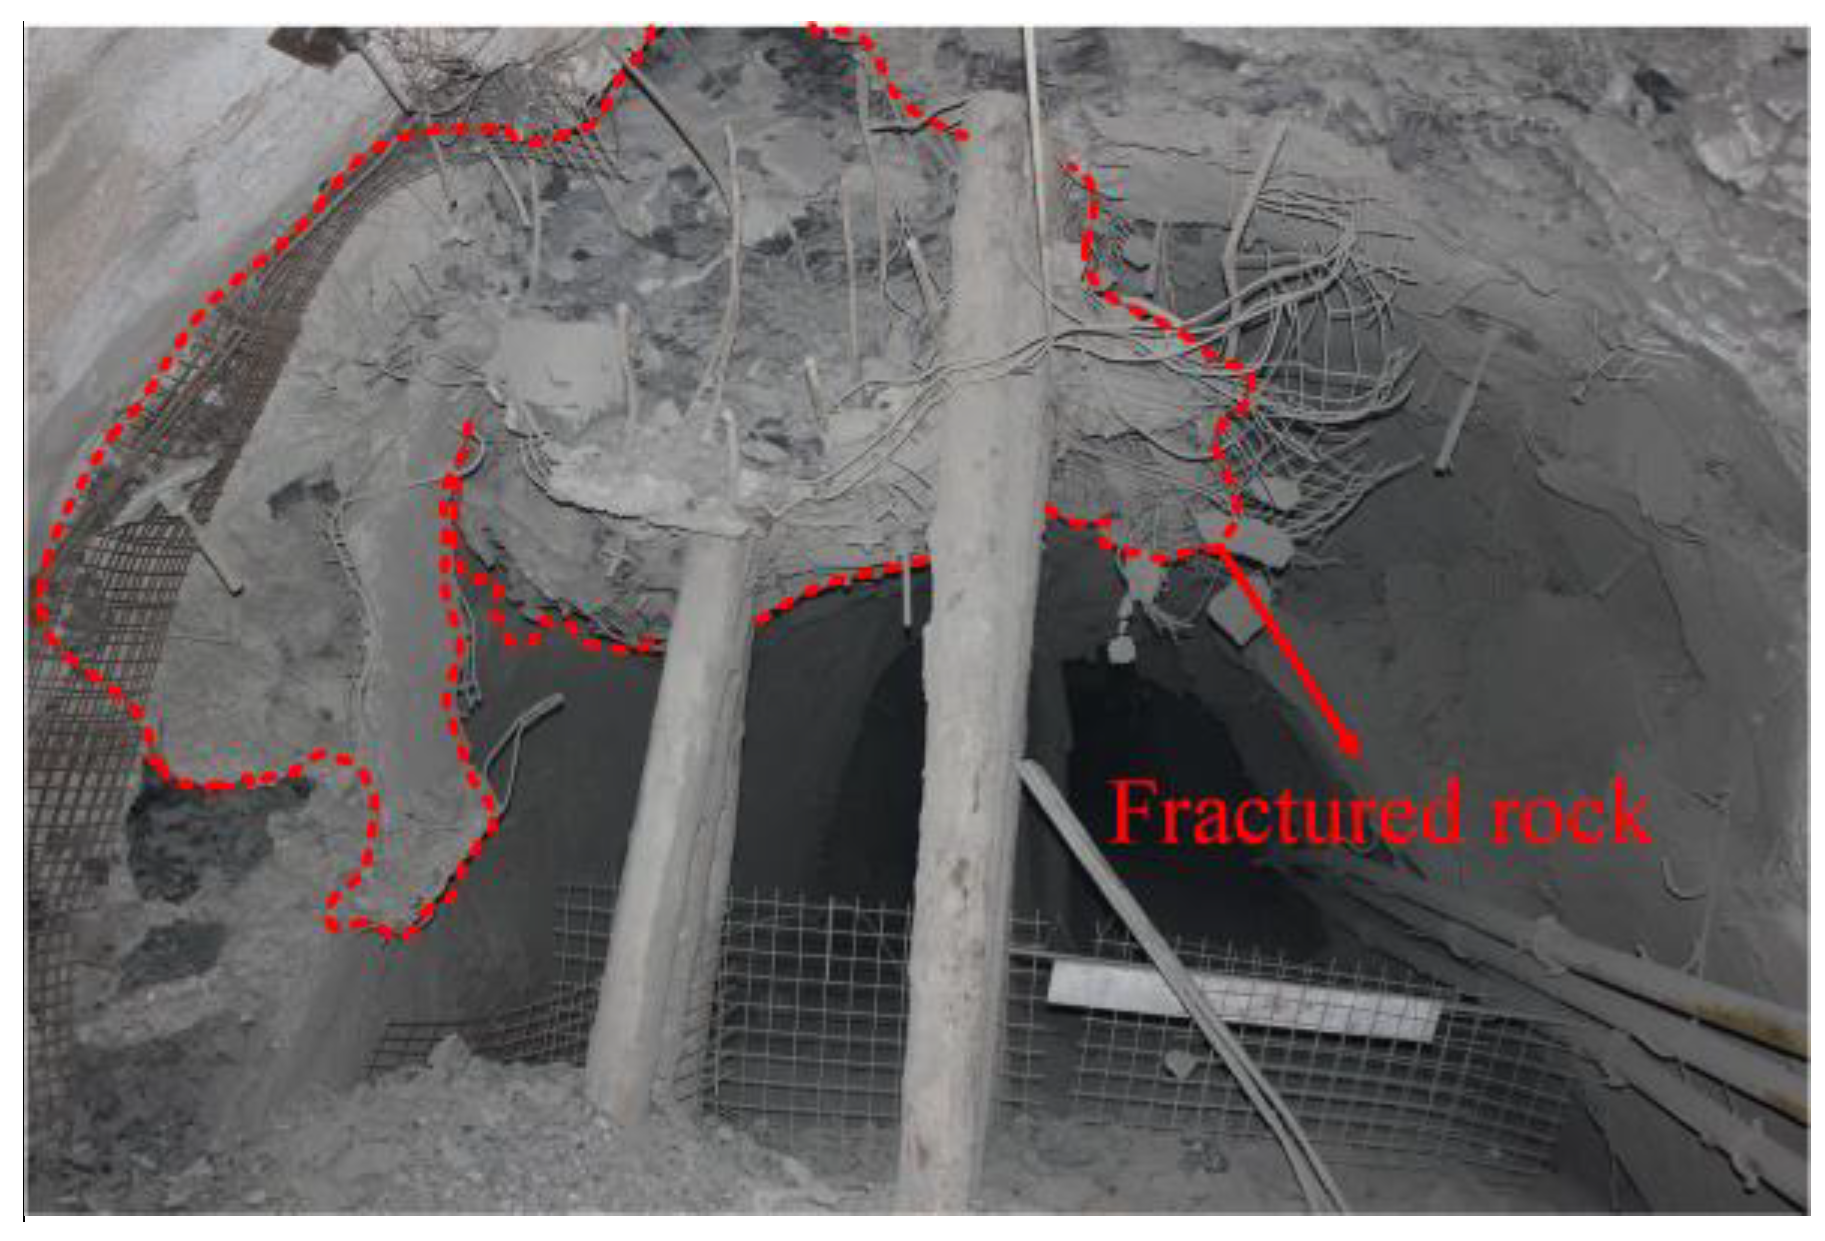
1. Introduction
2. Experimental Program Design
2.1. Specimen Selection and Preparation
2.2. Grouting Material Selection and Preparation
- (1)
- Performance breakthroughs:
- (2)
- Enhanced engineering applicability:
2.3. Experimental Flowchart and Specimen Parameters
2.4. Specimen Testing Equipment
3. Experimental Results
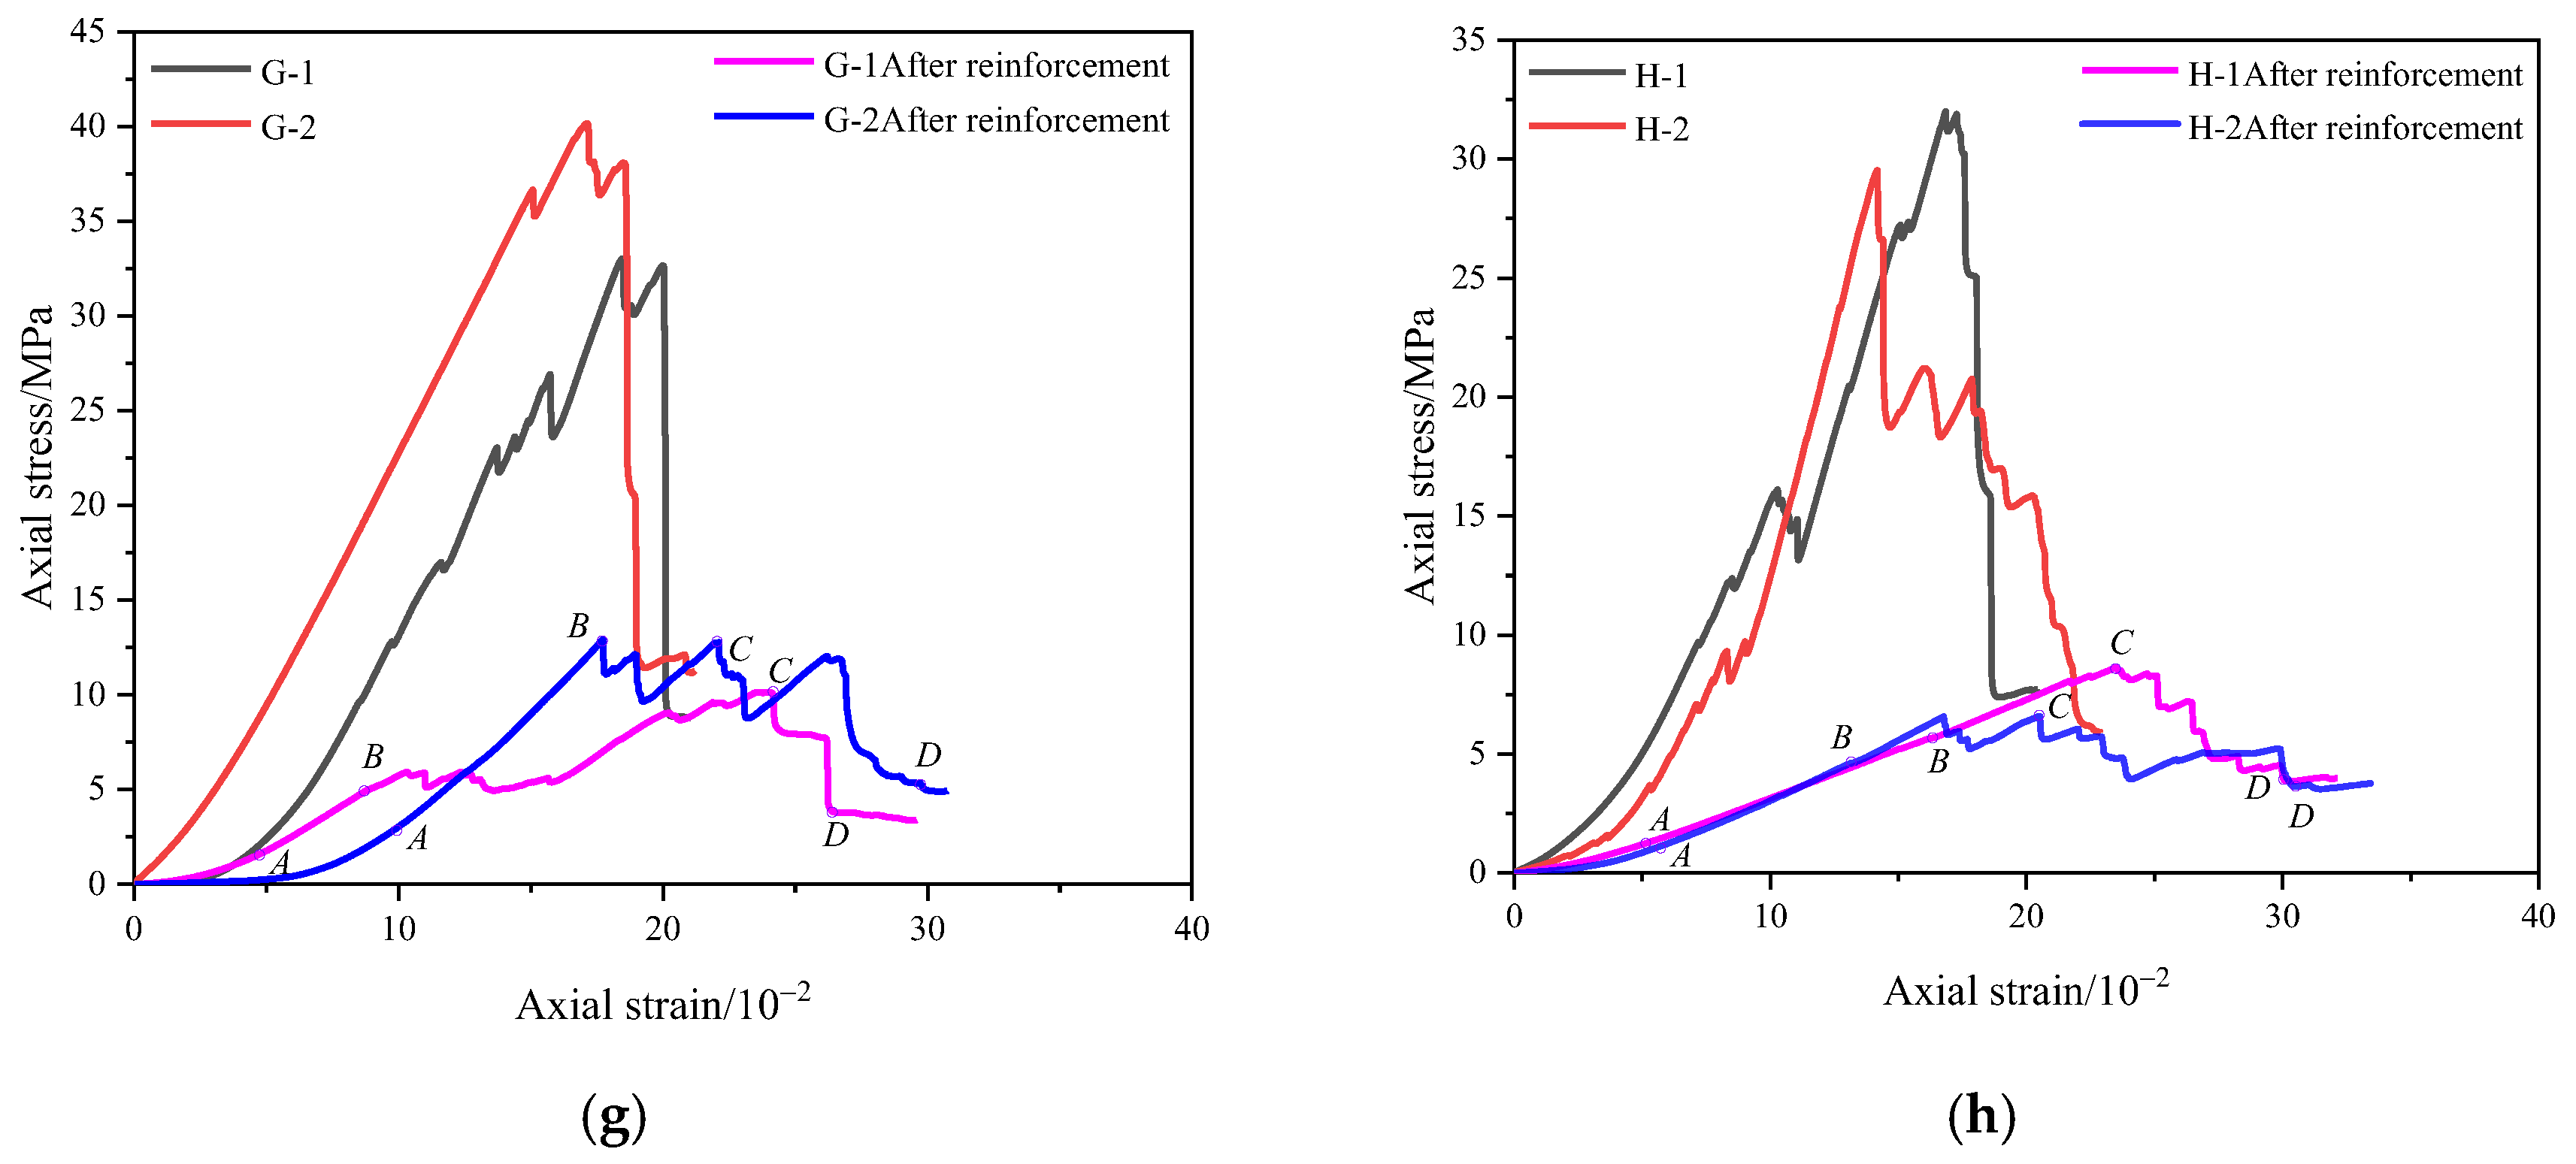
3.1. Stress–Strain Curves and Post-Peak Characteristics of Specimens
3.2. Variation Characteristics of the Basic Mechanical Parameters of Grouted Fractured Limestone Under Uniaxial Compression
3.3. Failure Modes of Grouted Fractured Limestone
- (1)
- Shear–Local Fracture Failure
- (2)
- Shear–Sliding Failure
- (3)
- Tensile–Bulging Failure
3.4. Engineering Application Analysis
- (1)
- Material ratio optimization: The systematic investigation of the effects of different reinforcing agent contents on the reinforcement performance of ordinary Portland cement-based grouting materials in fractured rock masses provides a scientific basis for the mix design and parameter optimization of grouting materials.
- (2)
- Innovation in experimental methods: Breaking through the limitations of traditional grouting studies on prefabricated fractures, this study adopted an experimental approach involving the uniaxial compression-induced damage of intact rock samples, followed by grouting reinforcement, which more realistically simulates the grouting conditions of fractured rock masses in engineering practice. The research results provide reliable technical support for the rapid evaluation and prediction of grouting reinforcement effects in fractured rock masses.
- (3)
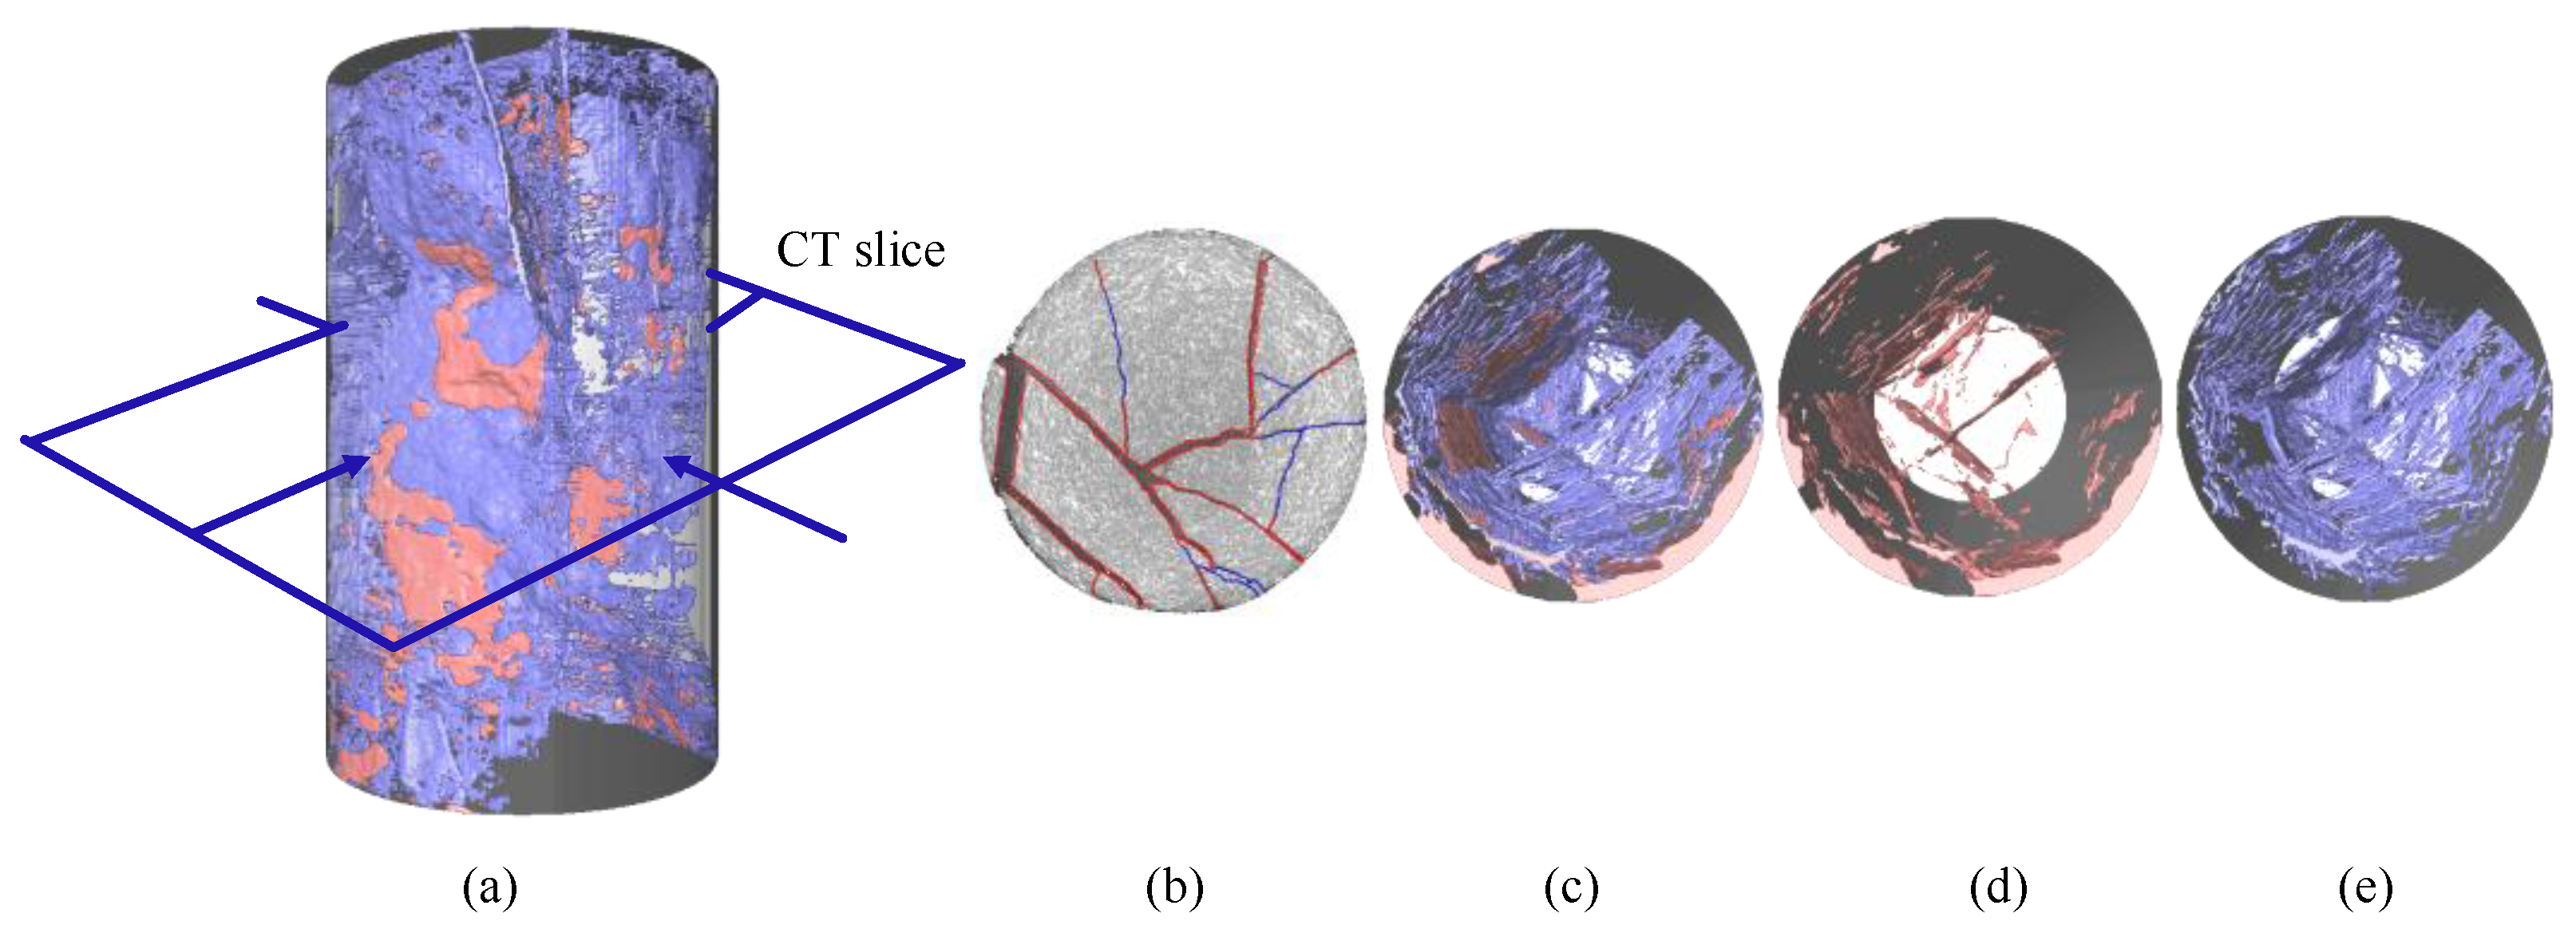
- Application of detection technology: The innovative application of CT scanning technology for the three-dimensional visual analysis of grouting reinforcement effects enables the precise identification and quantitative characterization of the spatial distribution characteristics of grout veins, offering new technical means for grouting quality assessment and parameter optimization.
4. Conclusions
- (1)
- Under uniaxial compression, the post-peak failure stage of the reinforced fractured limestone specimens exhibits strain-softening behavior. The stress–strain curve shows multiple “rise-and-fall” drops, demonstrating enhanced ductility and a certain level of residual strength. The enhancer content significantly influences the mechanical parameters of the specimens. When the enhancer content reaches 15 wt.%, the overall stability of the reinforced specimens is optimal, and all mechanical parameters achieve their maximum values: the UCS of the grouted specimen is equal to 22.24 MPa, and the increase rate reaches 18.10%.
- (2)
- As the enhancer content increases, the failure mode of the reinforced fractured limestone specimens under uniaxial compression gradually transitions from shear–local fracture failure to shear–sliding failure and tensile–bulging failure. The occurrence of these three mixed-failure modes is primarily influenced by the spatial structural morphology and mechanical parameters of the grout matrix, which are controlled by the enhancer content.
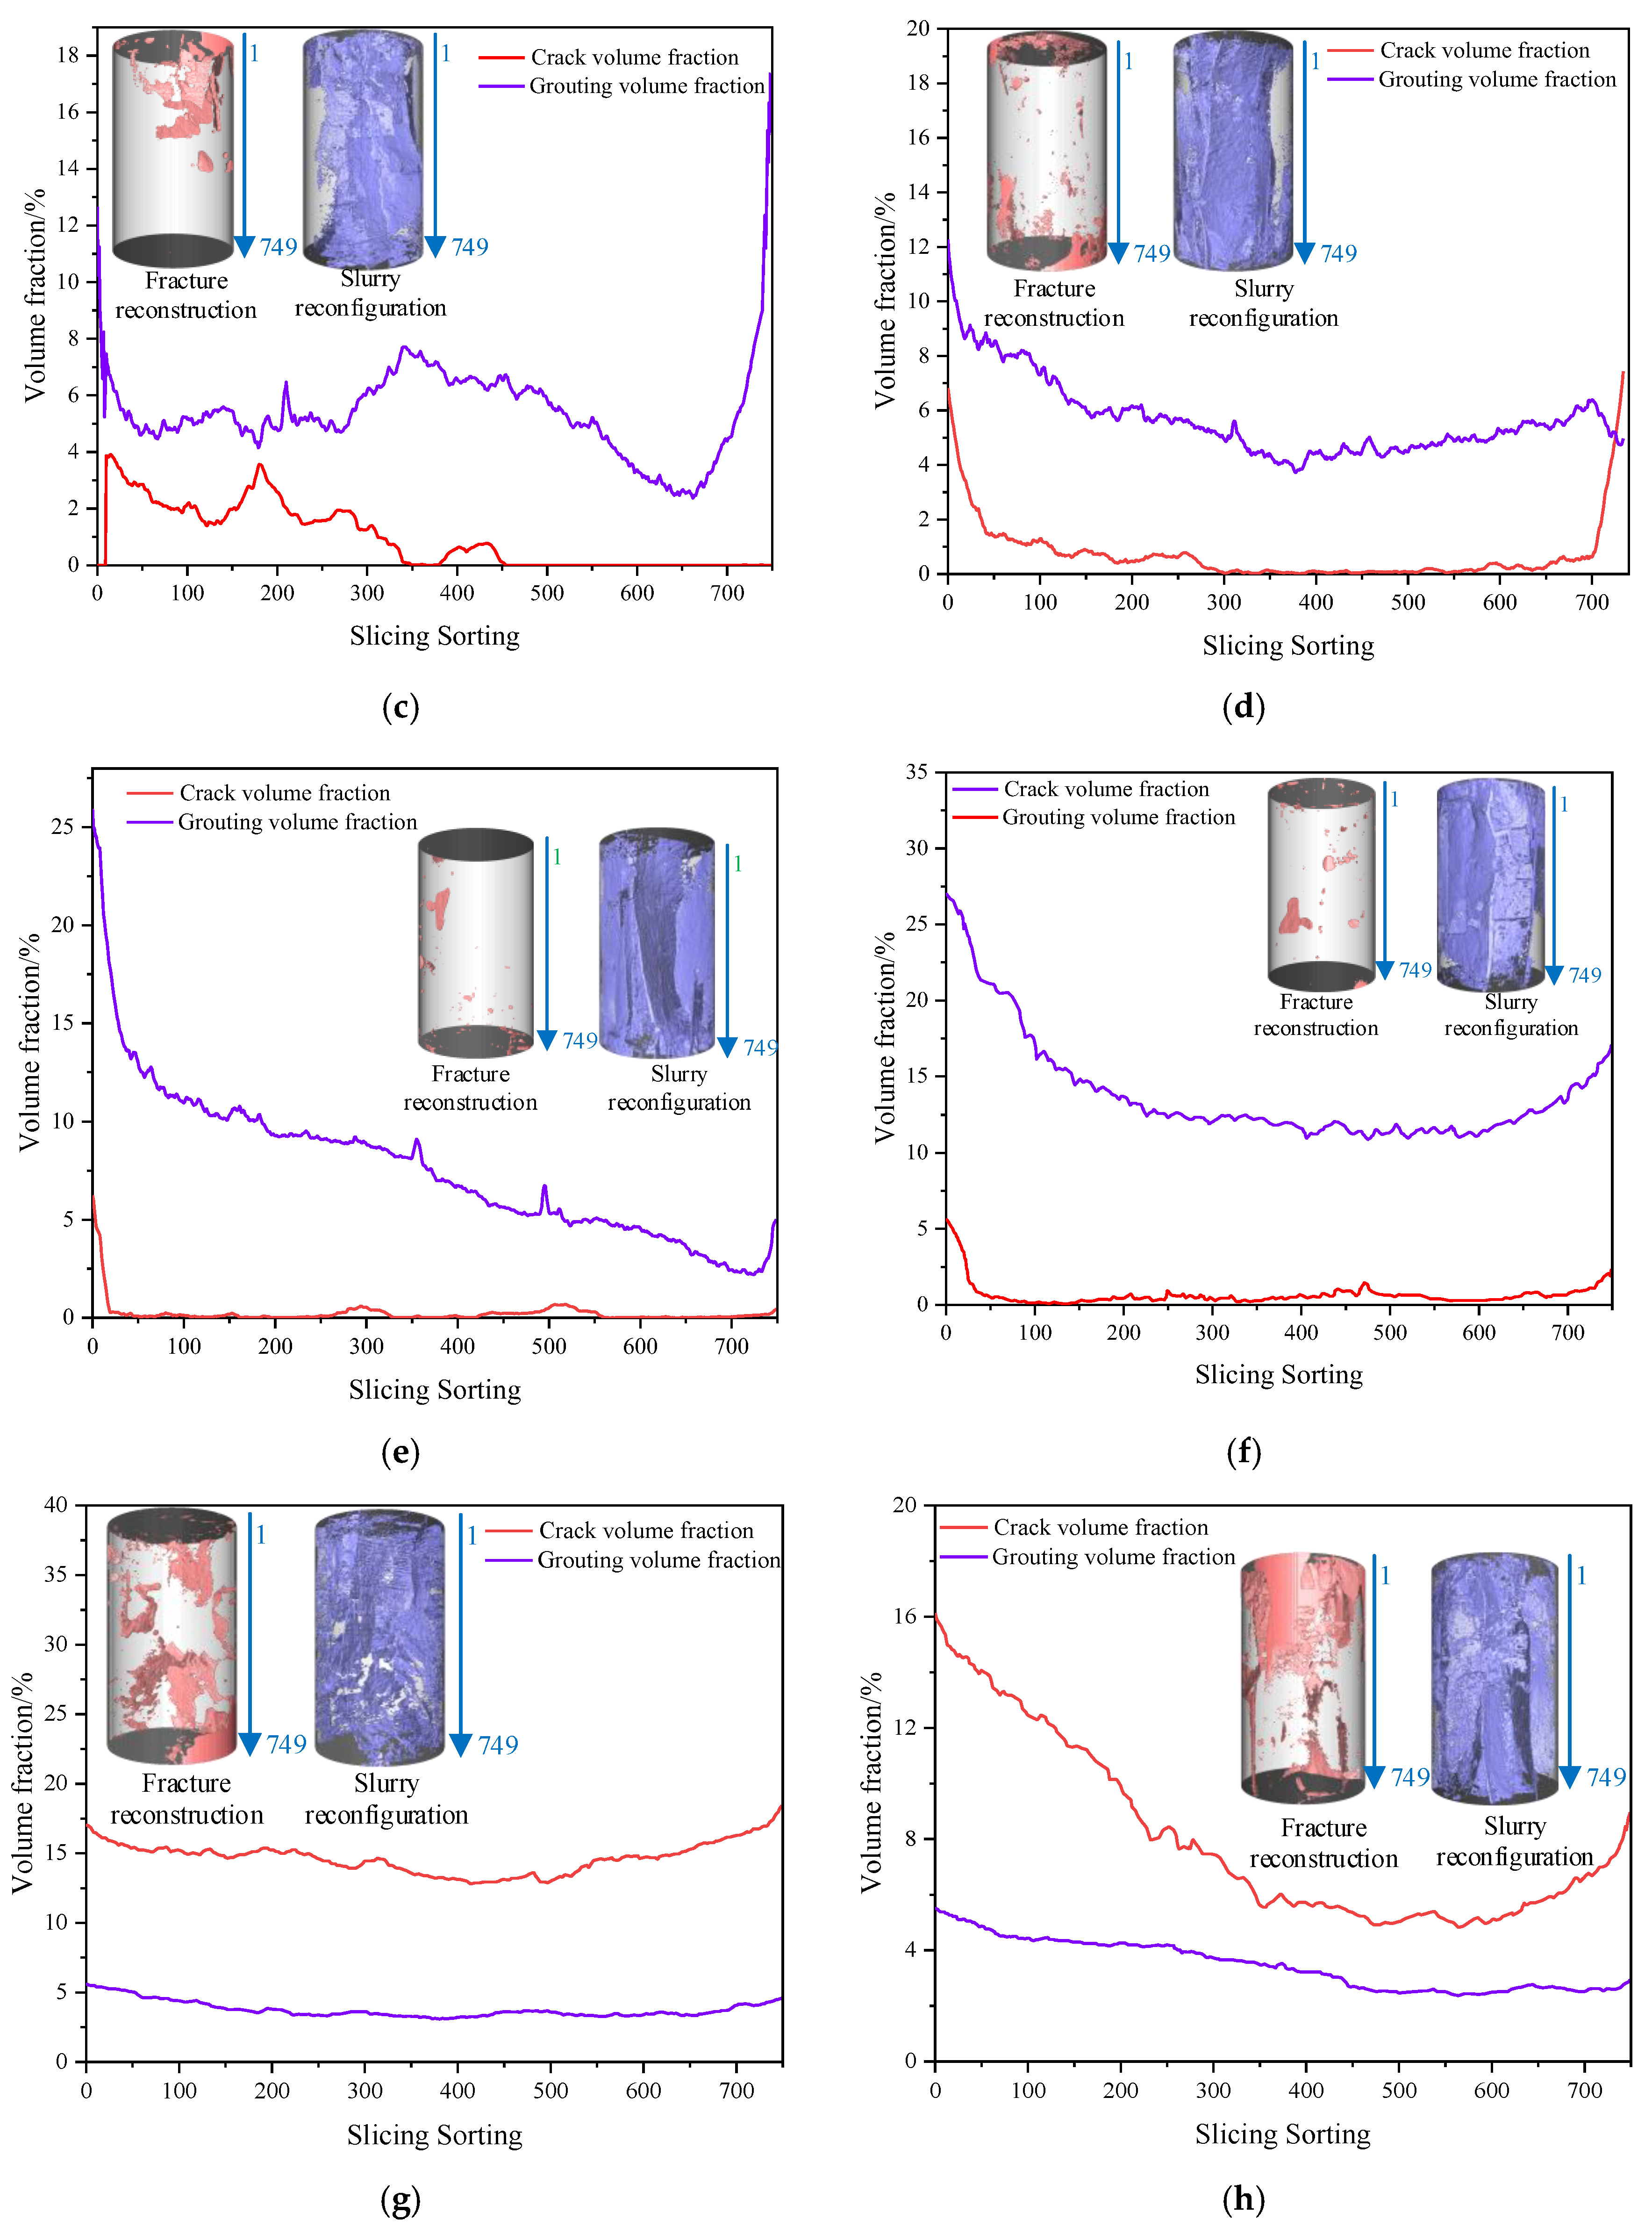
- (3)
- The three-dimensional CT scanning and reconstruction results indicate that when the enhancer content is low, the edge regions of the fractured limestone specimens exhibit a higher volume fraction of fractures and a lower volume fraction of the grout matrix. However, the overall volume fraction of the grout matrix is greater than that of the fractures. When the enhancer content is high, the grout matrix is mainly distributed in the fractures at the edges of the specimens. At the same time, the internal regions have a lower volume fraction of the grout matrix. In this case, the volume fraction of the grout matrix is significantly smaller than that of the fractures. When the mass fraction of the enhancer is 15.00 wt.%, the volume fraction of the grout matrix inside the specimen reaches its maximum (13.91%), with the volume fraction of fractures being only 0.66%.
- (4)
- In this paper, the influence of the content of the enhancer on the reinforcement effect of cement-based grouting materials is mainly studied and discussed. However, the action mechanism has not been thoroughly analyzed in this paper. In subsequent studies, the strengthening mechanism can be explored further from a microscopic perspective, utilizing X-ray diffraction, scanning electron microscopy, and molecular dynamics with numerical simulations.
Author Contributions
Funding
Data Availability Statement
Acknowledgments
Conflicts of Interest
References
- Nikbakhtan, B.; Osanloo, M. Effect of grout pressure and grout flow on soil physical and mechanical properties in jet grouting operations. Int. J. Rock Mech. Min. Sci. 2009, 46, 498–505. [Google Scholar] [CrossRef]
- Varol, A.; Dalgic, S. Grouting applications in the Istanbul metro, Turkey. Tunn. Undergr. Space Technol. 2006, 21, 602–612. [Google Scholar] [CrossRef]
- Utsuki, S.; Asakura, T.; Kikuchi, K. In-situ experimental studies on improvement of deformability of rock masses by grout treatment. In Harmonising Rock Engineering and the Environment, Proceedings of the 12th ISRM International Congress on Rock Mechanics, Beijing, China, 18–21 October 2011; CRC Press: Boca Raton, FL, USA, 2011. [Google Scholar]
- Liu, Q.; Lei, G.; Peng, X.; Lu, C.; Wei, L. Rheological Characteristics of Cement Grout and its Effect on Mechanical Properties of a Rock Fracture. Rock Mech. Rock Eng. 2018, 51, 613–625. [Google Scholar] [CrossRef]
- Feng, X.; Cao, X.; Li, L.; Li, Z.; Zhang, Q.; Sun, W.; Hou, B.; Liu, C.; Shi, Z. Study on Performance and Engineering Application of Novel Expansive Superfine Cement Slurry. Materials 2024, 17, 5597. [Google Scholar] [CrossRef]
- Zhu, K.; Wang, H.; Zhao, X.; Luo, G.; Dai, K.; Hu, Q.; Liu, Y.; Liu, B.; Miao, Y.; Liu, J.; et al. Effects of Superfine Cement on Fluidity, Strength, and Pore Structure of Superfine Tailings Cemented Paste Backfill. Minerals 2024, 15, 24. [Google Scholar] [CrossRef]
- Li, W.; Shaikh, F.; Wang, L.; Lu, Y.; Wang, B.; Jiang, C.; Su, Y. Experimental study on shear property and rheological characteristic of superfine cement grouts with nano-SiO2 addition. Constr. Build. Mater. 2019, 228, 117046. [Google Scholar] [CrossRef]
- Liu, Y.; Yang, P.; Ku, T.; Gao, S. Effect of different nanoparticles on the grouting performance of cement-based grouts in dynamic water condition. Constr. Build. Mater. 2020, 248, 118663. [Google Scholar] [CrossRef]
- Liu, W.; Sun, Y.; Meng, X.; Qin, Y. Experimental analysis of Nano-SiO2 modified waterborne epoxy resin on the properties and microstructure of cement-based grouting materials. Energy 2023, 268, 126669. [Google Scholar] [CrossRef]
- Liu, J.; Wang, Y.; Gao, N.; Liu, K.; Wen, J. Optimization of Mechanics and Rheology of Grouting Materials Based on Carbon Nanotubes. J. Test. Eval. 2025, 53, 157–170. [Google Scholar] [CrossRef]
- Zhang, Y.; Xia, W. Enhancing effect of carbon nanotubes on the performance of concrete containing surface-treated fly ash cenosphere. Constr. Build. Mater. 2023, 406, 133322. [Google Scholar] [CrossRef]
- Mu, W.; Li, L.; Liu, H.; Ren, B.; Chen, J.; Wang, X. An Experimental Study on Fracturing Response and Slurry Flow of High-Pressure Grouting in Fractured Rock. Rock Mech. Rock Eng. 2024, 57, 4533–4558. [Google Scholar] [CrossRef]
- Oppong, F.; Kolawole, O. Novel nanomagnetic-based slurry for grouting fractured rocks. Discov. Civ. Eng. 2025, 2, 1–19. [Google Scholar] [CrossRef]
- Zhang, J.; Li, K.; Li, Y.; Liu, C.; Xu, J.; He, J. Applying Novel Micro–Nano-Siliceous Grouting Material Improves Mechanical Behaviors of Fractured Rock Masses and Microscopic Characteristics of Slurry–Rock Interface: Experimental and Numerical Simulation Investigations. Rock Mech. Rock Eng. 2024, 57, 8297–8321. [Google Scholar] [CrossRef]
- Cui, W. Study on Application of Concrete Admixture Technology. Appl. Mech. Mater. 2013, 438–439, 54–57. [Google Scholar] [CrossRef]
- Huang, S.; Zhao, G.; Meng, X.; Cheng, X.; Gu, Q.; Liu, G.; Zhu, S. Development of Cement-Based Grouting Material for Reinforcing Narrow Coal Pillars and Engineering Applications. Processes 2022, 10, 2292. [Google Scholar] [CrossRef]
- Yu, X.; Liu, L.; Wang, Y.; Bai, G.; Zhang, Y. Effects of Foaming and Drainage Behavior on Structure and Properties of Polyurethane/Water Glass (PU/WG) Grouting Materials for Coal Mines. Adv. Civ. Eng. 2021, 2021, 5868654. [Google Scholar] [CrossRef]
- Liyanage, J.; Gamage, R. The Hydration and Volume Expansion Mechanisms of Modified Expansive Cements for Sustainable In-Situ Rock Fragmentation: A Review. Energies 2021, 14, 5965. [Google Scholar] [CrossRef]
- Ren, Q.; Luo, Y. Key Factors Affecting Characteristics of Cement-water Glass Grouting Materials Research. Coaltechnology 2017, 36, 209–210. [Google Scholar]
- Wang, P.; Li, S.; Li, Y. Experimental research on rheological and mechanical properties of nano silica sol grout. J. Sol.-Gel. Sci. Technol. 2019, 91, 178–188. [Google Scholar] [CrossRef]
- Funehag, J.; Gustafson, G. Design of grouting with silica sol in hard rock—Newmethods for calculation of penetration length, Part I. Tunn. Undergr. Space Technol. 2008, 23, 1–8. [Google Scholar] [CrossRef]
- Xiang, Z.; Zhang, N.; Pan, D.; Xie, Z.; Wang, P.; Liang, D. Macroscopic and microscopic characteristics of nanosilica sol-based composite grout in sealing fractured argillaceous rock: A comparative study with silica sol and cement slurry. J. Mater. Res. Technol. 2025, 34, 898–911. [Google Scholar] [CrossRef]
- Zhang, H.; Liu, Y.; Zhang, M.; Zhang, Q.; Pei, Y.; Li, X. Experimental and simulation study of magnesium phosphate cement two-liquid grouting materials. Phys. Fluids 2024, 36, 107137. [Google Scholar] [CrossRef]
- Chu, Y.; Song, X.; Zhao, H. Water-swellable, tough, and stretchable inorganic-organic sulfoaluminate cement/polyacrylamide double-network hydrogel composites. J. Appl. Polym. Sci. 2019, 136, 47905. [Google Scholar] [CrossRef]
- Wang, X.; Li, L.; Mu, W.; Yang, T.; An, J.; Du, Y. Diffusion mechanism of cement-based slurry in frozen and thawed fractured rock mass in alpine region. Constr. Build. Mater. 2023, 411, 134584. [Google Scholar] [CrossRef]
- Shan, P.; Lai, X. Influence of CT scanning parameters on rock and soil images. J. Vis. Commun. Image Represent. 2019, 58, 642–650. [Google Scholar] [CrossRef]
- Li, Z.; Wang, L.; Ding, R. Study on the Evolution of Rock Fracture under True Triaxial Intermediate Principal Stress. Int. J. Geomech. 2024, 24, 4023254. [Google Scholar] [CrossRef]
- Zhang, H.; Liu, T.; Cui, Y.; Wang, W.; Yang, X.; Huang, X. Strength deterioration and damage mechanism of grout-reinforced fractured sandstone under the coupled effects of acidic erosion and freeze-thaw cycles. Constr. Build. Mater. 2024, 443, 137761. [Google Scholar] [CrossRef]
- Zhang, H.; Wang, W.; Qiu, X.; Zheng, J.; Liu, T. Mechanical properties of fracture-grouted prefabricated sandstone after thermal-acid coupling treatment: An experimental study. Constr. Build. Mater. 2024, 411, 134552. [Google Scholar] [CrossRef]
- Yi, C.; Chen, J.; Han, W.; Li, Z.; Hai, H.; Suo, G. The Influence Law and Mechanism of CO2 Injection Pressure on Coal Rock Pore-Fracture Characteristics. Chem. Technol. Fuels Oils 2023, 56, 638–646. [Google Scholar] [CrossRef]
- Wei, X.; Wang, X.; Wu, G.; Liu, Q.; Zhang, Y. Research and Application of High-Energy Gas Fracturing Mechanism Based on CT Scanning Technology. Rock Mech. Rock Eng. 2023, 56, 7981–7996. [Google Scholar] [CrossRef]
- Zhang, G.; Xiao, M.; Zhang, Y.; Liu, H.; Zhuo, L.; Xie, H.; He, J. Experimental and Numerical Study on the Mechanical Properties of Compressively Precracked Sandstone Repaired by Grouting. Constr. Build. Mater. 2022, 350, 128816. [Google Scholar] [CrossRef]
- Wang, B.; Qian, Z.; Tan, C. Experimental study on fracture infiltration and slurry permeation reduction based on 3D printed visualization models. Environ. Earth Sci. 2024, 83, 406. [Google Scholar] [CrossRef]
- Li, T.; Yao, B.; Liu, Y.; Wang, D. Grouting Fractured Coal Permeability Evolution Based on Industrial CT Scanning. Geofluids 2021, 2021, 5564786. [Google Scholar]
- Gao, Y.; Yao, B.; Zhang, H.; Zhang, B.; Song, J.; Wang, Q.; Niu, J.; Li, J. Study on the test of coal mass fracture grouting sealing with coal-based materials and its application. Front. Earth Sci. 2022, 10, 1089248. [Google Scholar] [CrossRef]
- Fairhurst, C.E.; Hudson, J.A. Draft ISRM suggested method for the complete stress-strain curve for intact rock in uniaxial com-pression. Int. J. Rock Mech. Min. Sci. Geomech. Abstr. 1999, 36, 281–289. [Google Scholar]
- Kim, Y.J. Recent Advances in Ultra-high Performance Concrete. J. Korean Recycl. Constr. Resour. Inst. 2013, 1, 163–172. [Google Scholar] [CrossRef]
- Khaloo, A.; Mobini, M.H.; Hosseini, P. Influence of different types of nano-SiO2 particles on properties of high-performance concrete. Constr. Build. Mater. 2016, 113, 188–201. [Google Scholar] [CrossRef]
- Sobolev, K. The development of a new method for the proportioning of high-performance concrete mixtures. Cem. Concr. Compos. 2004, 26, 901–907. [Google Scholar] [CrossRef]
- Kjellsen, K.O.; Hallgren, M.; Wallevik, O.H. Fracture mechanical properties of high-performance concrete—Influence of silica fume. Mater. Struct. 2000, 33, 552–558. [Google Scholar] [CrossRef]
- Paredes, J.A.; Gálvez, J.C.; Enfedaque, A.; Alberti, M.G. Matrix Optimization of Ultra High Performance Concrete for Improving Strength and Durability. Materials 2021, 14, 14226944. [Google Scholar] [CrossRef]
- Meng, Y.F.; Tan, Y.Y.; Li, R. Strength Studies of High Performance Concrete with Fly-Ash and Gangue. Adv. Mater. Res. 2012, 446–449, 3544–3553. [Google Scholar] [CrossRef]
- Li, T.; Yue, Z.H.; Li, J.K.; Li, Q.H.; Li, Y.H.; Chen, G.B. Experimental study of improved cement silicate grouting material for broken surrounding rock. J. Build. Eng. 2023, 74, 106782. [Google Scholar] [CrossRef]
- Shaikh, F.; Supit, S.; Sarker, P. A study on the effect of nano silica on compressive strength of high volume fly ash mortars and concretes. Mater. Des. 2014, 60, 433–442. [Google Scholar] [CrossRef]
- Quercia, G.; Hüsken, G.; Brouwers, H. Water demand of amorphous nano silica and its impact on the workability of cement paste. Cem. Concr. Res. 2013, 42, 344–357. [Google Scholar] [CrossRef]
- Mahanta, B.; Ranjith, P.; Vishal, V.; Singh, T. Temperature-induced deformational responses and microstructural alteration of sandstone. J. Pet. Sci. Eng. 2020, 192, 107239. [Google Scholar] [CrossRef]
- Mahanta, B.; Vishal, V.; Ranjith, P.; Singh, T. An insight into pore-network models of high-temperature heat-treated sandstones using computed tomography. J. Pet. Sci. Eng. 2020, 77, 103227. [Google Scholar] [CrossRef]
- Isaka, B.; Ranjith, P.; Rathnaweera, T.; Perera, M.; DeSilva, V. Quantification of thermally-induced microcracks in granite using X-ray CT imaging and analysis. Geothermics 2019, 81, 152–167. [Google Scholar] [CrossRef]
- Wang, Y.; Hou, Z.; Hu, Y. In situ X-ray micro-CT for investigation of damage evolution in black shale under uniaxial compression. Environ. Earth Sci. 2018, 77, 717. [Google Scholar] [CrossRef]
- Wang, Y.; Li, C.; Hao, J.; Zhou, R. X-ray micro-tomography for investigation of meso-structural changes and crack evolution in Longmaxi formation shale during compressive deformation. J. Pet. Sci. Eng. 2018, 164, 278–288. [Google Scholar] [CrossRef]
- Zhang, Y.; Niu, S.; Du, Z.; Hao, J.; Yang, J. Dynamic fracture evolution of tight sandstone under uniaxial compression in high resolution 3D X-ray microscopy. J. Pet. Sci. Eng. 2020, 195, 107585. [Google Scholar] [CrossRef]
- Mahanta, B.; Vishal, V.; Sirdesal, N.; Ranjith, P.; Singh, T. Progressive deformation and pore network attributes of sandstone at in-situ stress states using computed tomography. Eng. Fract. Mech. 2021, 252, 107833. [Google Scholar] [CrossRef]
- Li, S.; Sha, F.; Liu, R.; Zhang, Q.; Li, Z. Investigation on fundamental properties of microfine cement and cement-slag grouts. Constr. Build. Mater. 2017, 153, 965–974. [Google Scholar] [CrossRef]
- Chen, J.; Kwan, A. Superfine cement for improving packing density, rheology and strength of cement paste. Cem. Concr. Compos. 2012, 34, 1–10. [Google Scholar] [CrossRef]
- Meng, Y.Y.; Yu, L.Y.; Yuan, L.; Hua, X.Z.; Ma, Y.K.; Zhuang, J.Z.; Jing, H.W.; Liu, X.W. Effects of bedding angle and confining pressure on the mechanical behavior, energy dissipation and micro damage evolution mechanism of layered rock mass under triaxial compression conditions. J. Mater. Res. Technol. 2025, 36, 1259–1272. [Google Scholar] [CrossRef]


| Specimen Number | Peak Strength/MPa | Peak Strain/10−2 | Residual Strength/MPa | Elastic Modulus/GPa | Water–Cement Ratio | Enhancer Content |
|---|---|---|---|---|---|---|
| A-1# | 32.63 | 18.70 | 12.38 | 3.13 | 0.8:1 | 2.50 wt.% |
| A-2# | 31.46 | 18.81 | 8.36 | 2.62 | ||
| B-1# | 32.87 | 14.28 | 19.16 | 2.81 | 5.00 wt.% | |
| B-2# | 30.01 | 13.79 | 18.49 | 3.55 | ||
| C-1# | 39.62 | 20.70 | 21.67 | 3.50 | 7.50 wt.% | |
| C-2# | 33.87 | 12.32 | 20.89 | 3.72 | ||
| D-1# | 33.50 | 22.78 | 21.76 | 2.65 | 10.00 wt.% | |
| D-2# | 41.60 | 22.67 | 20.43 | 3.61 | ||
| E-1# | 38.59 | 18.35 | 13.47 | 3.48 | 12.50 wt.% | |
| E-2# | 36.43 | 18.18 | 14.99 | 3.41 | ||
| F-1# | 36.10 | 20.00 | 19.64 | 2.83 | 15.00 wt.% | |
| F-2# | 29.48 | 19.36 | 18.03 | 2.97 | ||
| G-1# | 33.02 | 18.47 | 8.78 | 2.87 | 17.50 wt.% | |
| G-2# | 40.17 | 17.12 | 11.26 | 2.73 | ||
| H-1# | 32.01 | 16.85 | 7.71 | 3.19 | 20.00 wt.% | |
| H-2# | 29.52 | 14.18 | 5.89 | 2.88 |
| Specimen Number | A | B | C | D | E | F | G | H |
|---|---|---|---|---|---|---|---|---|
| Average Volume Fraction of Fractures (%) | 1.47 | 3.36 | 0.95 | 0.73 | 0.23 | 0.66 | 14.69 | 7.97 |
| Average Volume Fraction of Grout Matrix (%) | 6.86 | 5.57 | 5.42 | 5.69 | 7.72 | 13.91 | 3.77 | 3.46 |
| Peak Strength (MPa) | 11.29 | 20.64 | 23.41 | 23.52 | 16.27 | 22.24 | 11.53 | 7.62 |
| Residual Strength (MPa) | 4.27 | 6.26 | 9.11 | 10.26 | 10.30 | 14.41 | 4.16 | 3.88 |
Disclaimer/Publisher’s Note: The statements, opinions and data contained in all publications are solely those of the individual author(s) and contributor(s) and not of MDPI and/or the editor(s). MDPI and/or the editor(s) disclaim responsibility for any injury to people or property resulting from any ideas, methods, instructions or products referred to in the content. |
© 2025 by the authors. Licensee MDPI, Basel, Switzerland. This article is an open access article distributed under the terms and conditions of the Creative Commons Attribution (CC BY) license (https://creativecommons.org/licenses/by/4.0/).
Share and Cite
Zhu, D.; Zong, Y.; Chen, M.; Tao, X.; Yue, L. Experimental Study on the Mechanical Properties of Cracked Limestone Reinforced by Modified Cement Grouting. Processes 2025, 13, 1205. https://doi.org/10.3390/pr13041205
Zhu D, Zong Y, Chen M, Tao X, Yue L. Experimental Study on the Mechanical Properties of Cracked Limestone Reinforced by Modified Cement Grouting. Processes. 2025; 13(4):1205. https://doi.org/10.3390/pr13041205
Chicago/Turabian StyleZhu, Dong, Yijiang Zong, Min Chen, Xiangling Tao, and Liang Yue. 2025. "Experimental Study on the Mechanical Properties of Cracked Limestone Reinforced by Modified Cement Grouting" Processes 13, no. 4: 1205. https://doi.org/10.3390/pr13041205
APA StyleZhu, D., Zong, Y., Chen, M., Tao, X., & Yue, L. (2025). Experimental Study on the Mechanical Properties of Cracked Limestone Reinforced by Modified Cement Grouting. Processes, 13(4), 1205. https://doi.org/10.3390/pr13041205