Article

Morphology and Structure Controls of Single-Atom Fe–N–C Catalysts Synthesized Using FePc Powders as the Precursor

1
School of Chemical Engineering and Technology, Tianjin University, Tianjin 300072, China
2
Department of Applied Chemistry, College of Basic Science, Tianjin Agricultural University, Tianjin 300384, China
3
Forschungszentrum Jülich, IEK-9, 52425 Jülich, Germany
*
Author to whom correspondence should be addressed.
Processes 2021, 9(1), 109; https://doi.org/10.3390/pr9010109
Submission received: 7 December 2020 / Revised: 4 January 2021 / Accepted: 6 January 2021 / Published: 7 January 2021
(This article belongs to the Special Issue Recent Advances in Catalysis by Transition Metals)

Abstract

:
Understanding the origin of the high electrocatalytic activity of Fe–N–C electrocatalysts for oxygen reduction reaction is critical but still challenging for developing efficient sustainable nonprecious metal catalysts used in fuel cells. Although there are plenty of papers concerning the morphology on the surface Fe–N–C catalysts, there is very little work discussing how temperature and pressure control the growth of nanoparticles. In our lab, a unique organic vapor deposition technology was developed to investigate the effect of the temperature and pressure on catalysts. The results indicated that synthesized catalysts exhibited three kinds of morphology—nanorods, nanofibers, and nanogranules—corresponding to different synthesis processes. The growth of the crystal is the root cause of the difference in the surface morphology of the catalyst, which can reasonably explain the effect of the temperature and pressure. The oxygen reduction reaction current densities of the different catalysts at potential 0.88 V increased in the following order: FePc (1.04 mA/cm2) < Pt/C catalyst (1.54 mA/cm2) Fe–N–C-f catalyst (1.64 mA/cm2) < Fe–N–C-g catalyst (2.12 mA/cm2) < Fe–N–C-r catalyst (2.35 mA/cm2). By changing the morphology of the catalyst surface, this study proved that the higher performance of the catalysts can be obtained.

1. Introduction

The increasing global energy consumption and environmental issues are driving the research and development of sustainable and clean energy resources and technologies [1,2,3,4,5,6]. Specifically, fuel cells and metal–air batteries have attracted much attention due to their high theoretical energy density and commercial value in recent years. The core process, oxygen reduction reaction (ORR), that determines overall efficiency of fuel cells and metal–air batteries is slow, and thus precious metal catalysts including Pt have been widely used to promote this process [7,8,9,10,11,12]. However, the natural abundance of precious metals on earth is scarce, and their electrocatalytic stability for ORR is poor [13,14,15,16,17,18]. Therefore, it is of great significance to develop ORR catalysts with abundant reserves, low cost, and excellent durability.
Fe–N–C catalysts are considered a substitute for precious metal catalysts for their high catalytic activity for ORR in fuel cells and metal–air batteries [19,20,21,22,23,24,25]. The morphology of catalysts notably affects the electron transfer, diffusion, and adsorption at the interface of the electrodes and therefore the ORR electrocatalytic performance. On the other hand, the morphology is closely related to the synthesis process [26,27,28,29].
Although Fe–N–C catalysts have been extensively studied, the way in which to control the surface morphology of this type of catalyst is still a problem to be considered. In this work, a unique organic vapor deposition technology was developed in our lab to synthesize single-atom Fe–N–C catalysts through the modification of small molecular organics at atomic scale. It was found that the catalysts synthesized through different synthesis processes possessed very different morphologies, such as nanorod, nanofiber, and nanogranule, corresponding to different ORR performances. The effects of the pressure and temperature on the morphology and structure of synthesized catalysts are introduced here. This will help to showcase the close relationship between performance and morphology.

2. Materials and Methods

2.1. Preparation of Materials

(a)
An electrodeposition method was used to deposit Cu foils on the surface of a steel sheet. Then, the Cu foils were peeled off from the sheet and put into a tube furnace.
(b)
The monolayer graphene was synthesized on the surface of the Cu foil (noted as G/Cu) through a chemical vapor deposition (CVD) process in a mixture atmosphere of CH4 (12 sccm) and H2 (48 sccm) gases at 1000 °C [30].
(c)
FePc powders (the precursor) and G/Cu film were separately placed into another tube furnace with a distance of 300 mm (Figure 1). The synthetic strategy of Fe–N–C single-atom catalysts is described as follows: (i) FePc powder was put into the T1 (450 °C) temperature zone, G/Cu film was put in the T2 temperature zone. To investigate the effect of the temperature and pressure, we controlled the temperature T2 to be 110 °C and 70 °C, respectively. (ii) The pressure in the T2 temperature zones was 10 torr and 500 torr, respectively. Then, keeping the temperatures for 30 min with argon gas flowing through the tube furnace in the direction from FePc powders to G/Cu film, we synthesized the catalysts on the surface of the monolayer graphene and noted as Fe–N–C/G/Cu.
(d)
The copper layers in synthesized catalysts Fe–N–C/G/Cu were removed by floating the films on the surface of 0.1 M FeCl3 solution for more than 12 h. Then, the reserved film (noted as Fe–N–C) was washed with deionized water 3 times and dried at 60 °C.

2.2. Electrochemical Measurements

Electrochemical measurements were performed with a CHI660D electrochemical workstation (Shanghai Chenhua Instrument Co., Ltd., Shanghai, China) in a typical three-electrode system. The catalyst supported on a glassy carbon electrode (GCE) with a diameter of 5 mm was served as the working electrode, whereas ruthenium–titanium mesh and Hg/HgO (1 M KOH) electrode were used as the counter and reference electrodes, respectively. All the potentials given are relative to reversible hydrogen electrode (RHE): E(vs. RHE) = E(vs. Hg/HgO) + 0.098 + 0.059pH. The electrochemical measurements were carried out using a rotating disk electrode (RDE) device in an O2-saturated 0.1 M KOH solution at 25 ± 1 °C. The linear scan voltammetry (LSV) was conducted at a potential scan rate of 5 mV s−1.

2.3. Structural Characterization

The scanning electron microscopy (SEM) observations were performed with a field emission Hitachi s-4800, and SEM/energy-dispersive X-ray (EDX) spectroscopy mapping was undertaken on an Ametek EDAX at an acceleration voltage of 15 kV. Transmission electron microscopy (TEM) and high-resolution transmission electron microscopy (HRTEM) images were obtained on JEM-2100F operated at acceleration voltages of 80 kV and 200 kV, respectively. X-ray diffraction (XRD) analyses were performed on a Bruker D8-Focus system with Cu Kα radiation (λ = 1.5419 Å). XRD patterns were recorded at 40 kV in a 2θ range of 5° to 40°. X-ray photoelectron spectroscopy (XPS) analyses were performed using a PHI5000 Versa Probe. The energy calibration of the spectrometer was performed using C 1s peak at 284.5 eV. Thermogravimetric analysis (TGA) curve was performed on a TA Q500 thermal gravimetric analyzer under a N2 atmosphere condition at a heating rate of 5 °C/min. Raman spectrum was performed on a RENISHAW in via reflex with an incident ray source (λ = 532 nm).

3. Results

3.1. Analyses on the Morphology and Structure

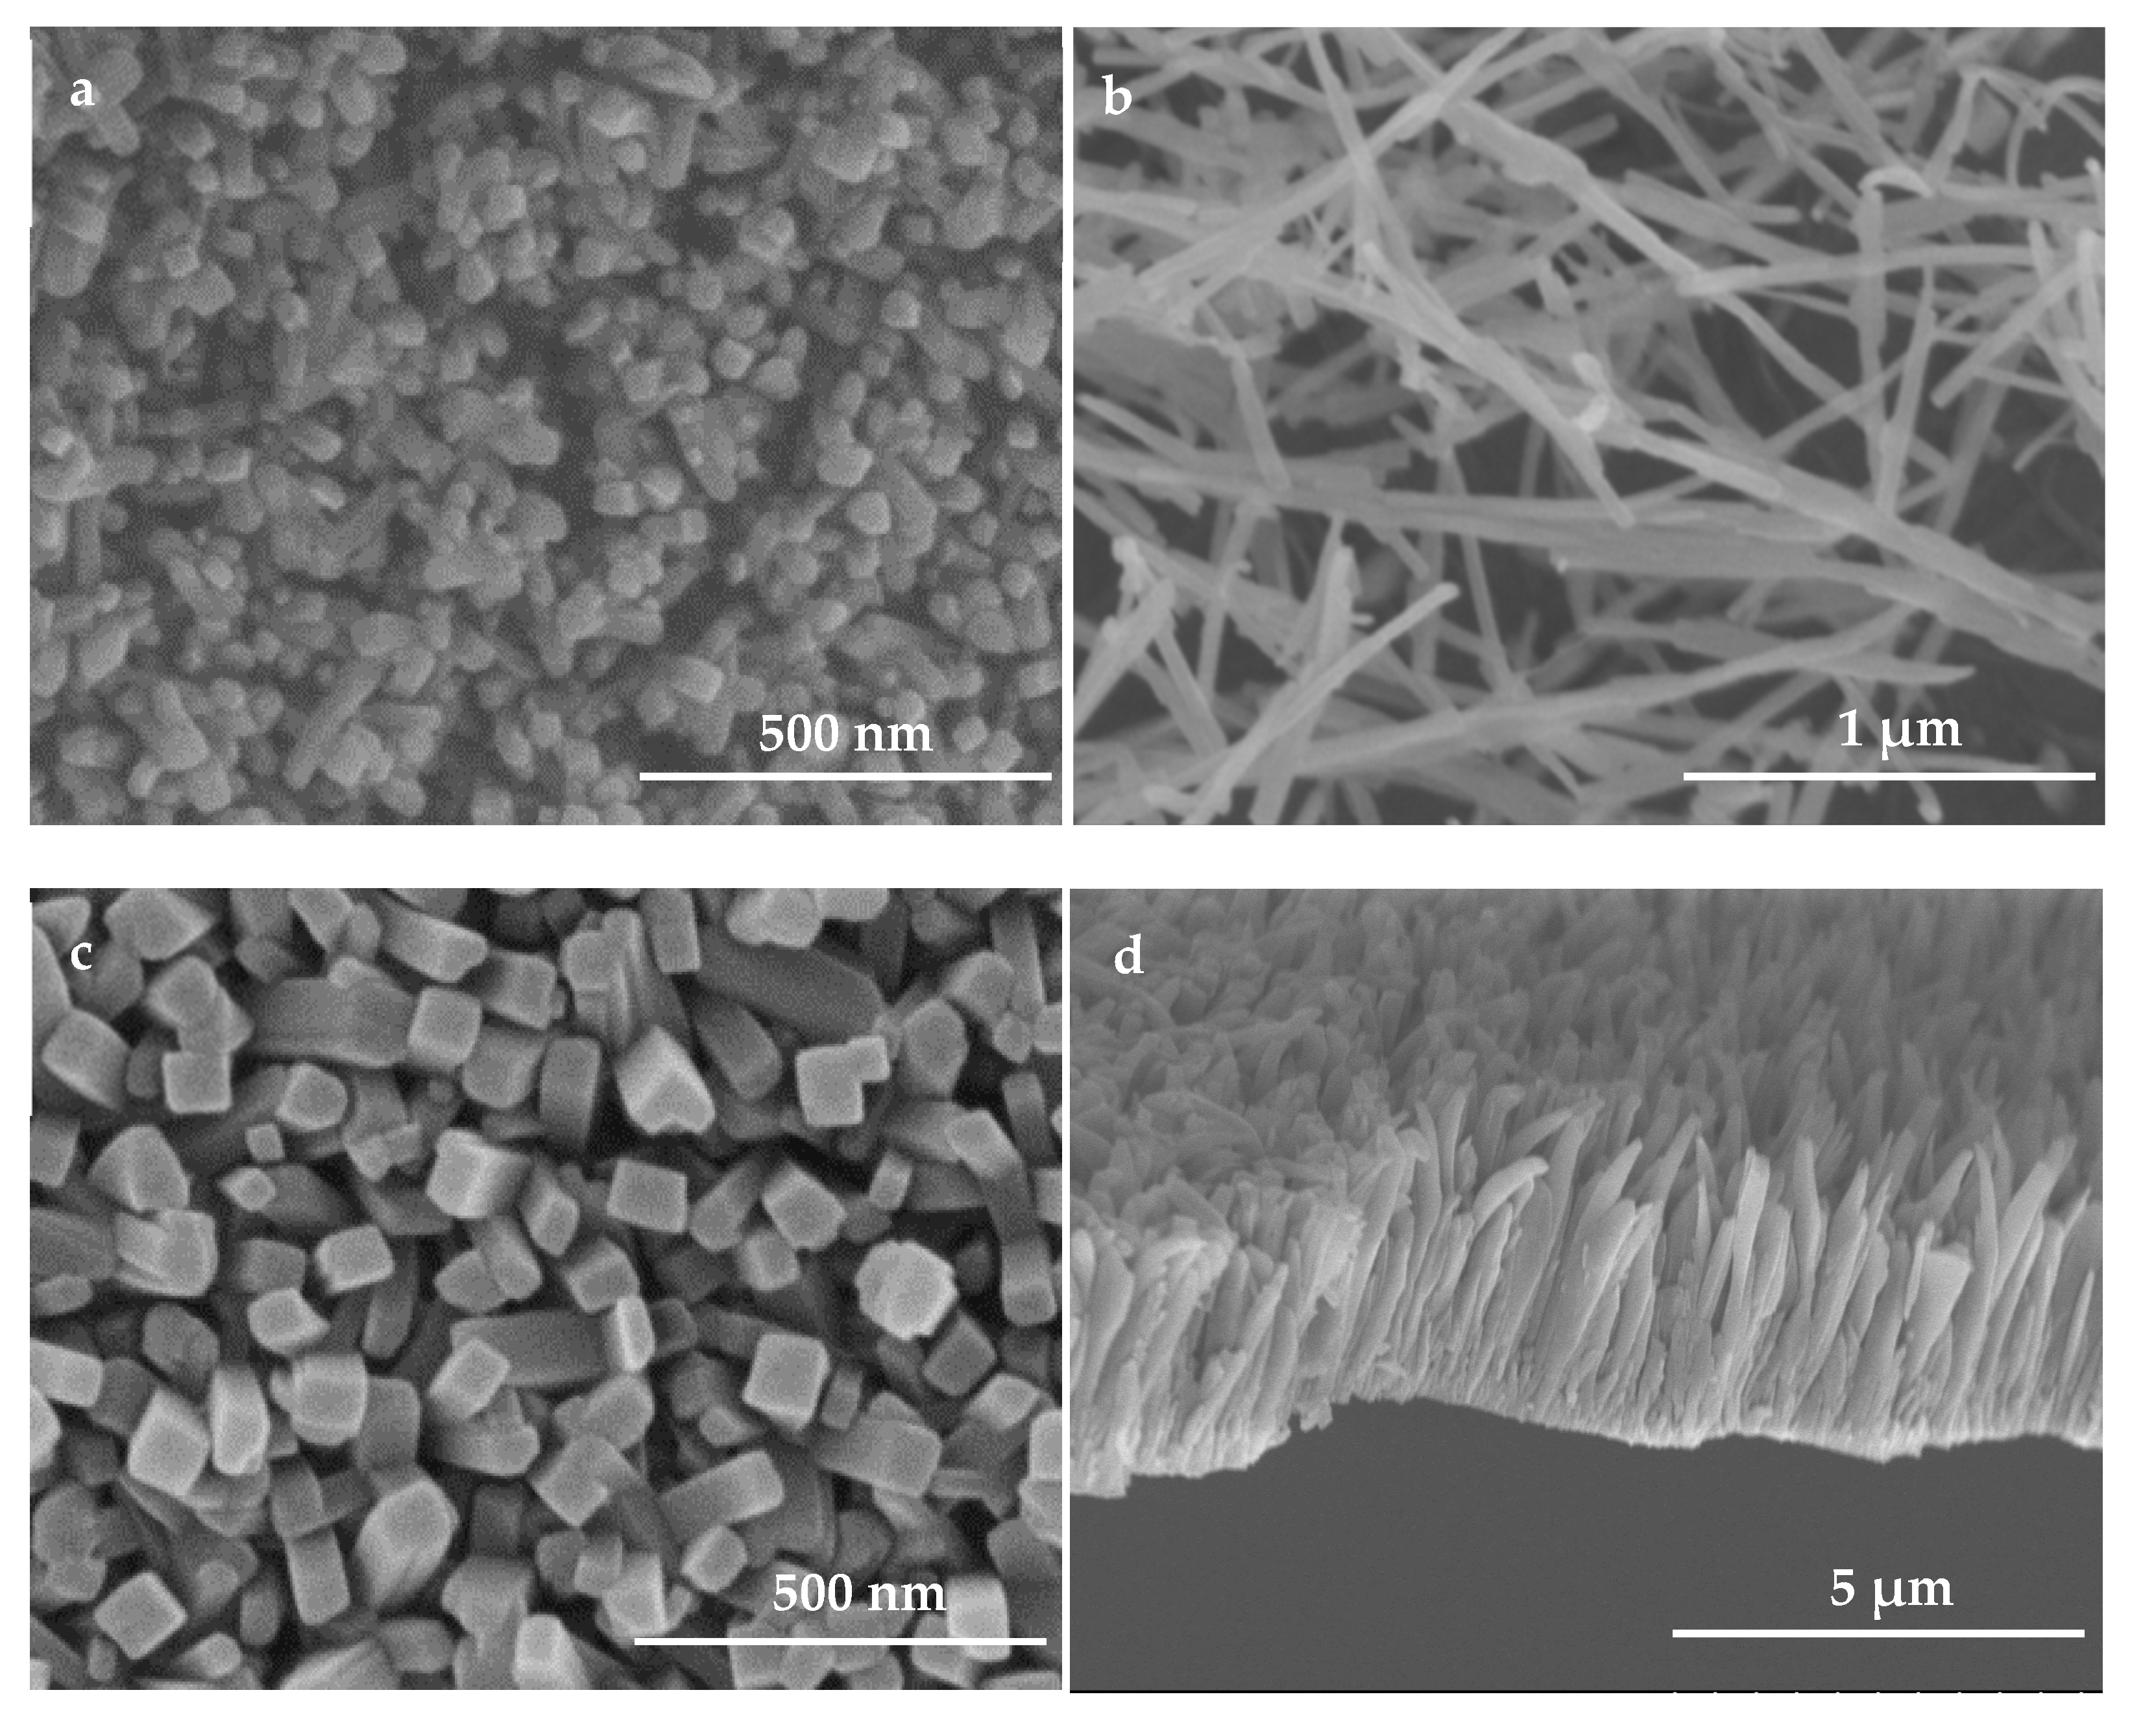
Figure 2 shows the SEM images of the catalysts synthesized under different temperature and pressure conditions. As shown in Figure 2a, the catalyst synthesized at 70 °C and 10 torr conditions exhibited a nanogranule morphology (noted as Fe–N–C-g) with an average diameter of 10 nm. The catalyst synthesized at 70 °C and 500 torr conditions showed a nanofiber morphology (noted as Fe–N–C-f) with an average diameter of 50 nm (Figure 2b). A nanorod catalyst (noted as Fe–N–C-r) was synthesized at 110 °C and 10 torr conditions (Figure 2c,d). The nanorods possessed an inerratic rectangular cross-section with an average side length of 30 nm. More SEM images are shown in the Supplementary Information section. The results above indicate that the catalysts with different morphologies can be synthesized through the unique organic vapor deposition technology developed in our lab.
Comparing the morphologies of the catalysts synthesized under low pressure (10 torr) conditions (Figure 2a,c), the higher temperature (110 °C) resulted in rod-shaped growth while granule-shaped growth occurred at a lower temperature (70 °C). Observing the morphologies of the catalysts synthesized under low temperature (70 °C) conditions (Figure 2a,b), we found that high pressure (500 torr) caused filiform growth but the numbers of the fibers were very limited. In contrast, low pressure (10 torr) led to a huge number of granules. The results indicate that the pressure altered the growing direction of the catalysts from the direction perpendicular to the surface of the substrate (low pressure) to along the surface of the substrate (high pressure). In addition, high pressure suppressed the nucleation of the catalysts. High temperature promoted the growth.
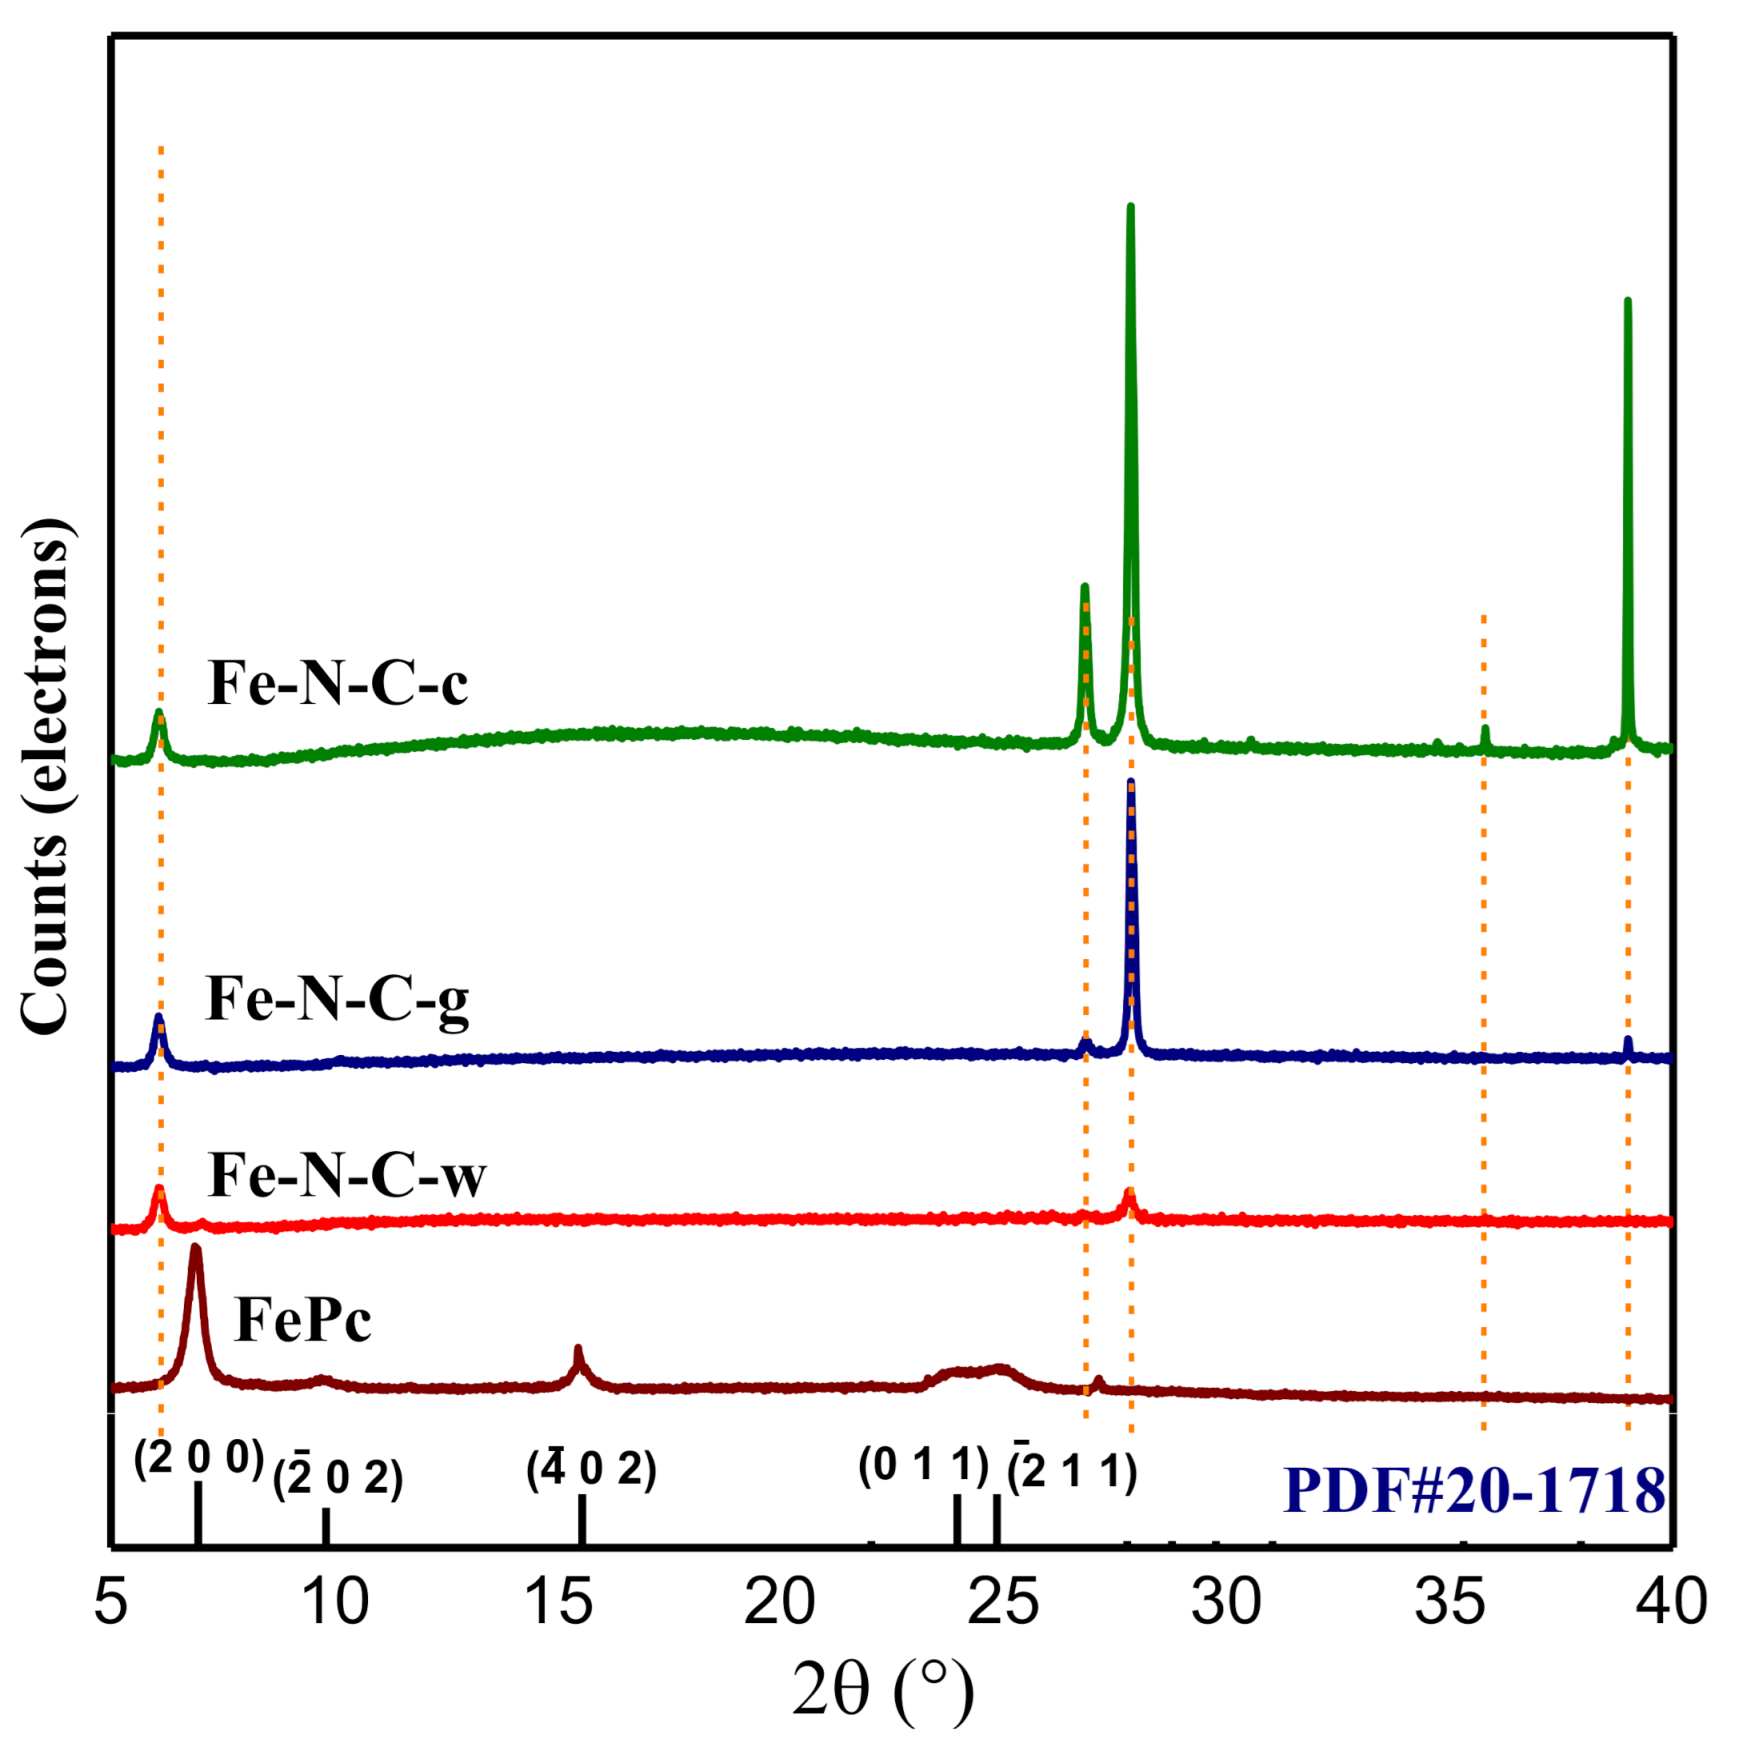
From the XRD result (Figure 3), patterns of FePc powder, Fe–N–C-r, Fe–N–C-f, and Fe–N–C-g catalysts can be seen, wherein the peak positions of the three catalysts were the same, although the peak strengths were different. The peak positions of the three catalysts differed greatly from that of FePc powder. The results revealed that the crystal structures of synthesized catalysts with three morphologies were the same, but totally different from that of FePc powders, the precursor. This means that new materials were synthesized through the unique organic vapor deposition technology. Comparing the strength of the peaks among the catalysts, we found that the Fe–N–C-r catalyst showed the best crystallinity while Fe–N–C-f catalyst showed the worst. Considering the difference in their synthesized conditions, we can conclude that high pressure prohibits the regular arrangement of the molecules while higher temperature is of benefit to form regular arranged crystal structure during the course of crystallization.
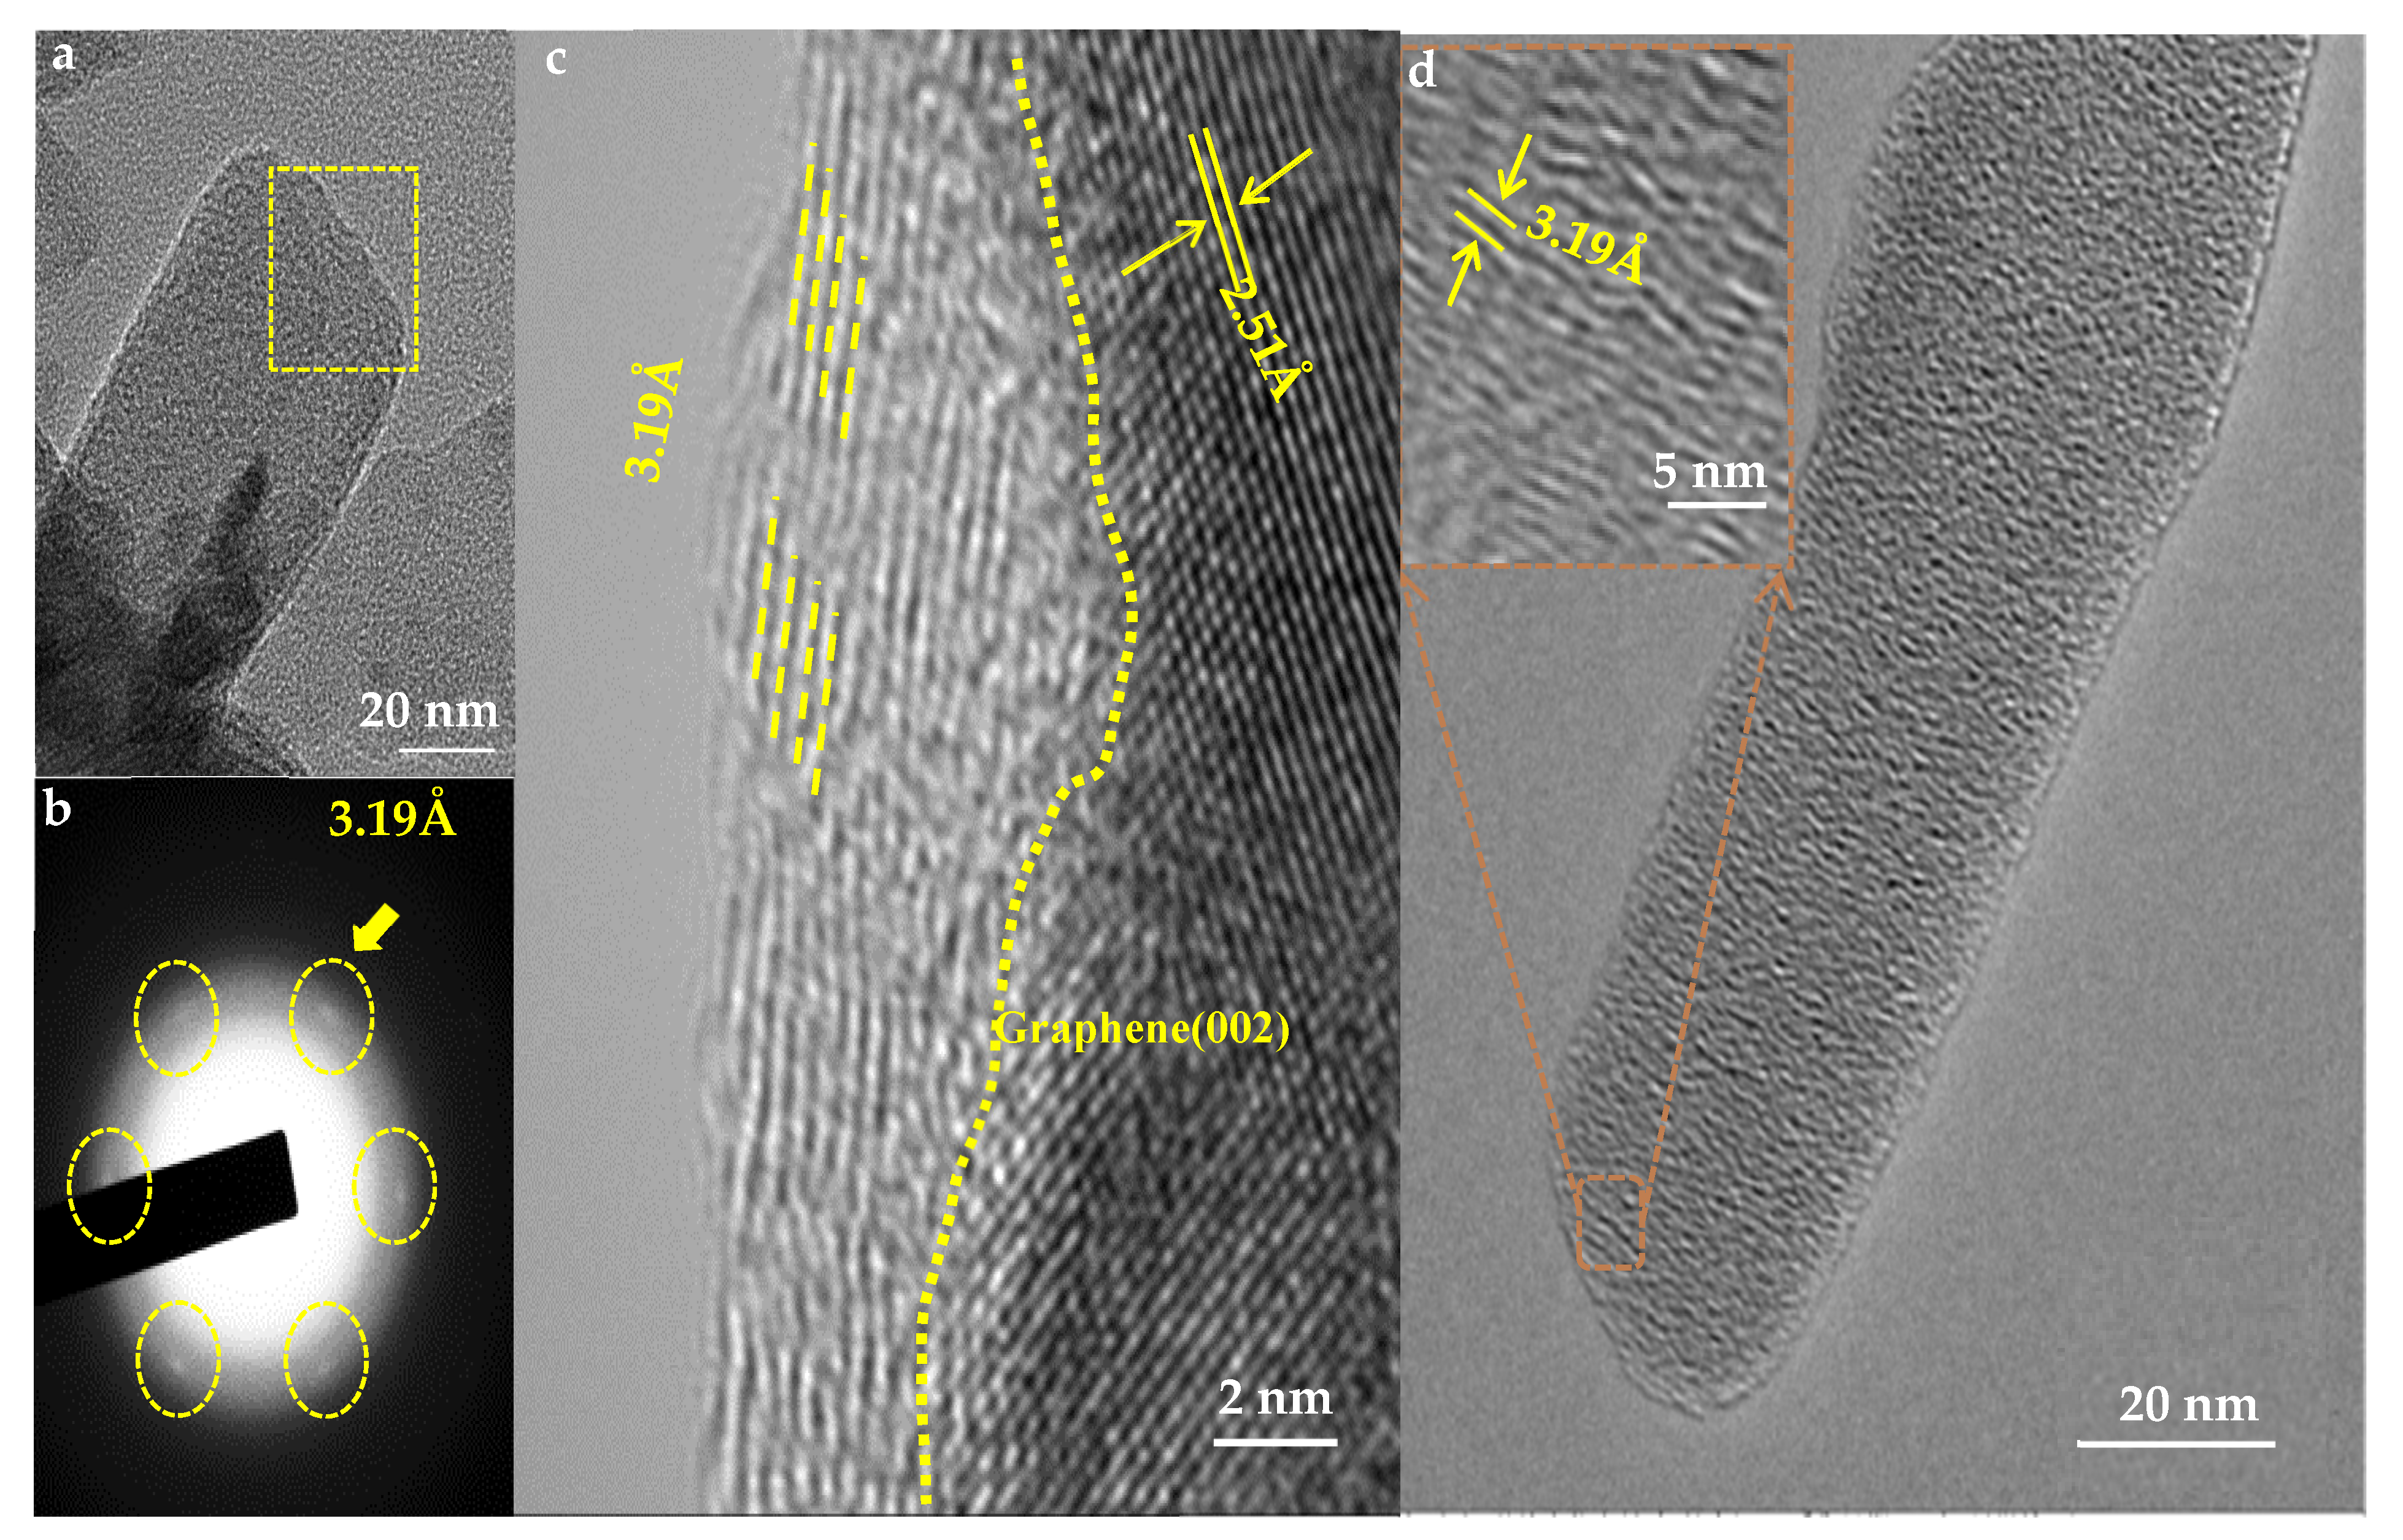
The TEM image of Fe–N–C-r catalyst (Figure 4a) exhibited the nanorod morphology. The SAED (selected area electron diffraction) pattern in the yellow zone in Figure 4a showed bright diffraction spots (Figure 4b) corresponding to the lattice plane (001) (d = 3.19 Å). Furthermore, the HRTEM image (Figure 4c) shows that the nanorod possessed layer structures, topologically stacking on the (002) plane of the monolayer graphene, the substrate. The HRTEM image of Fe–N–C-f catalysts also displayed a layer structure with an interlayer space of 3.19 Å (Figure 4d), which was the same as that in Fe–N–C-r catalyst.

3.2. Raman and XPS Analyses

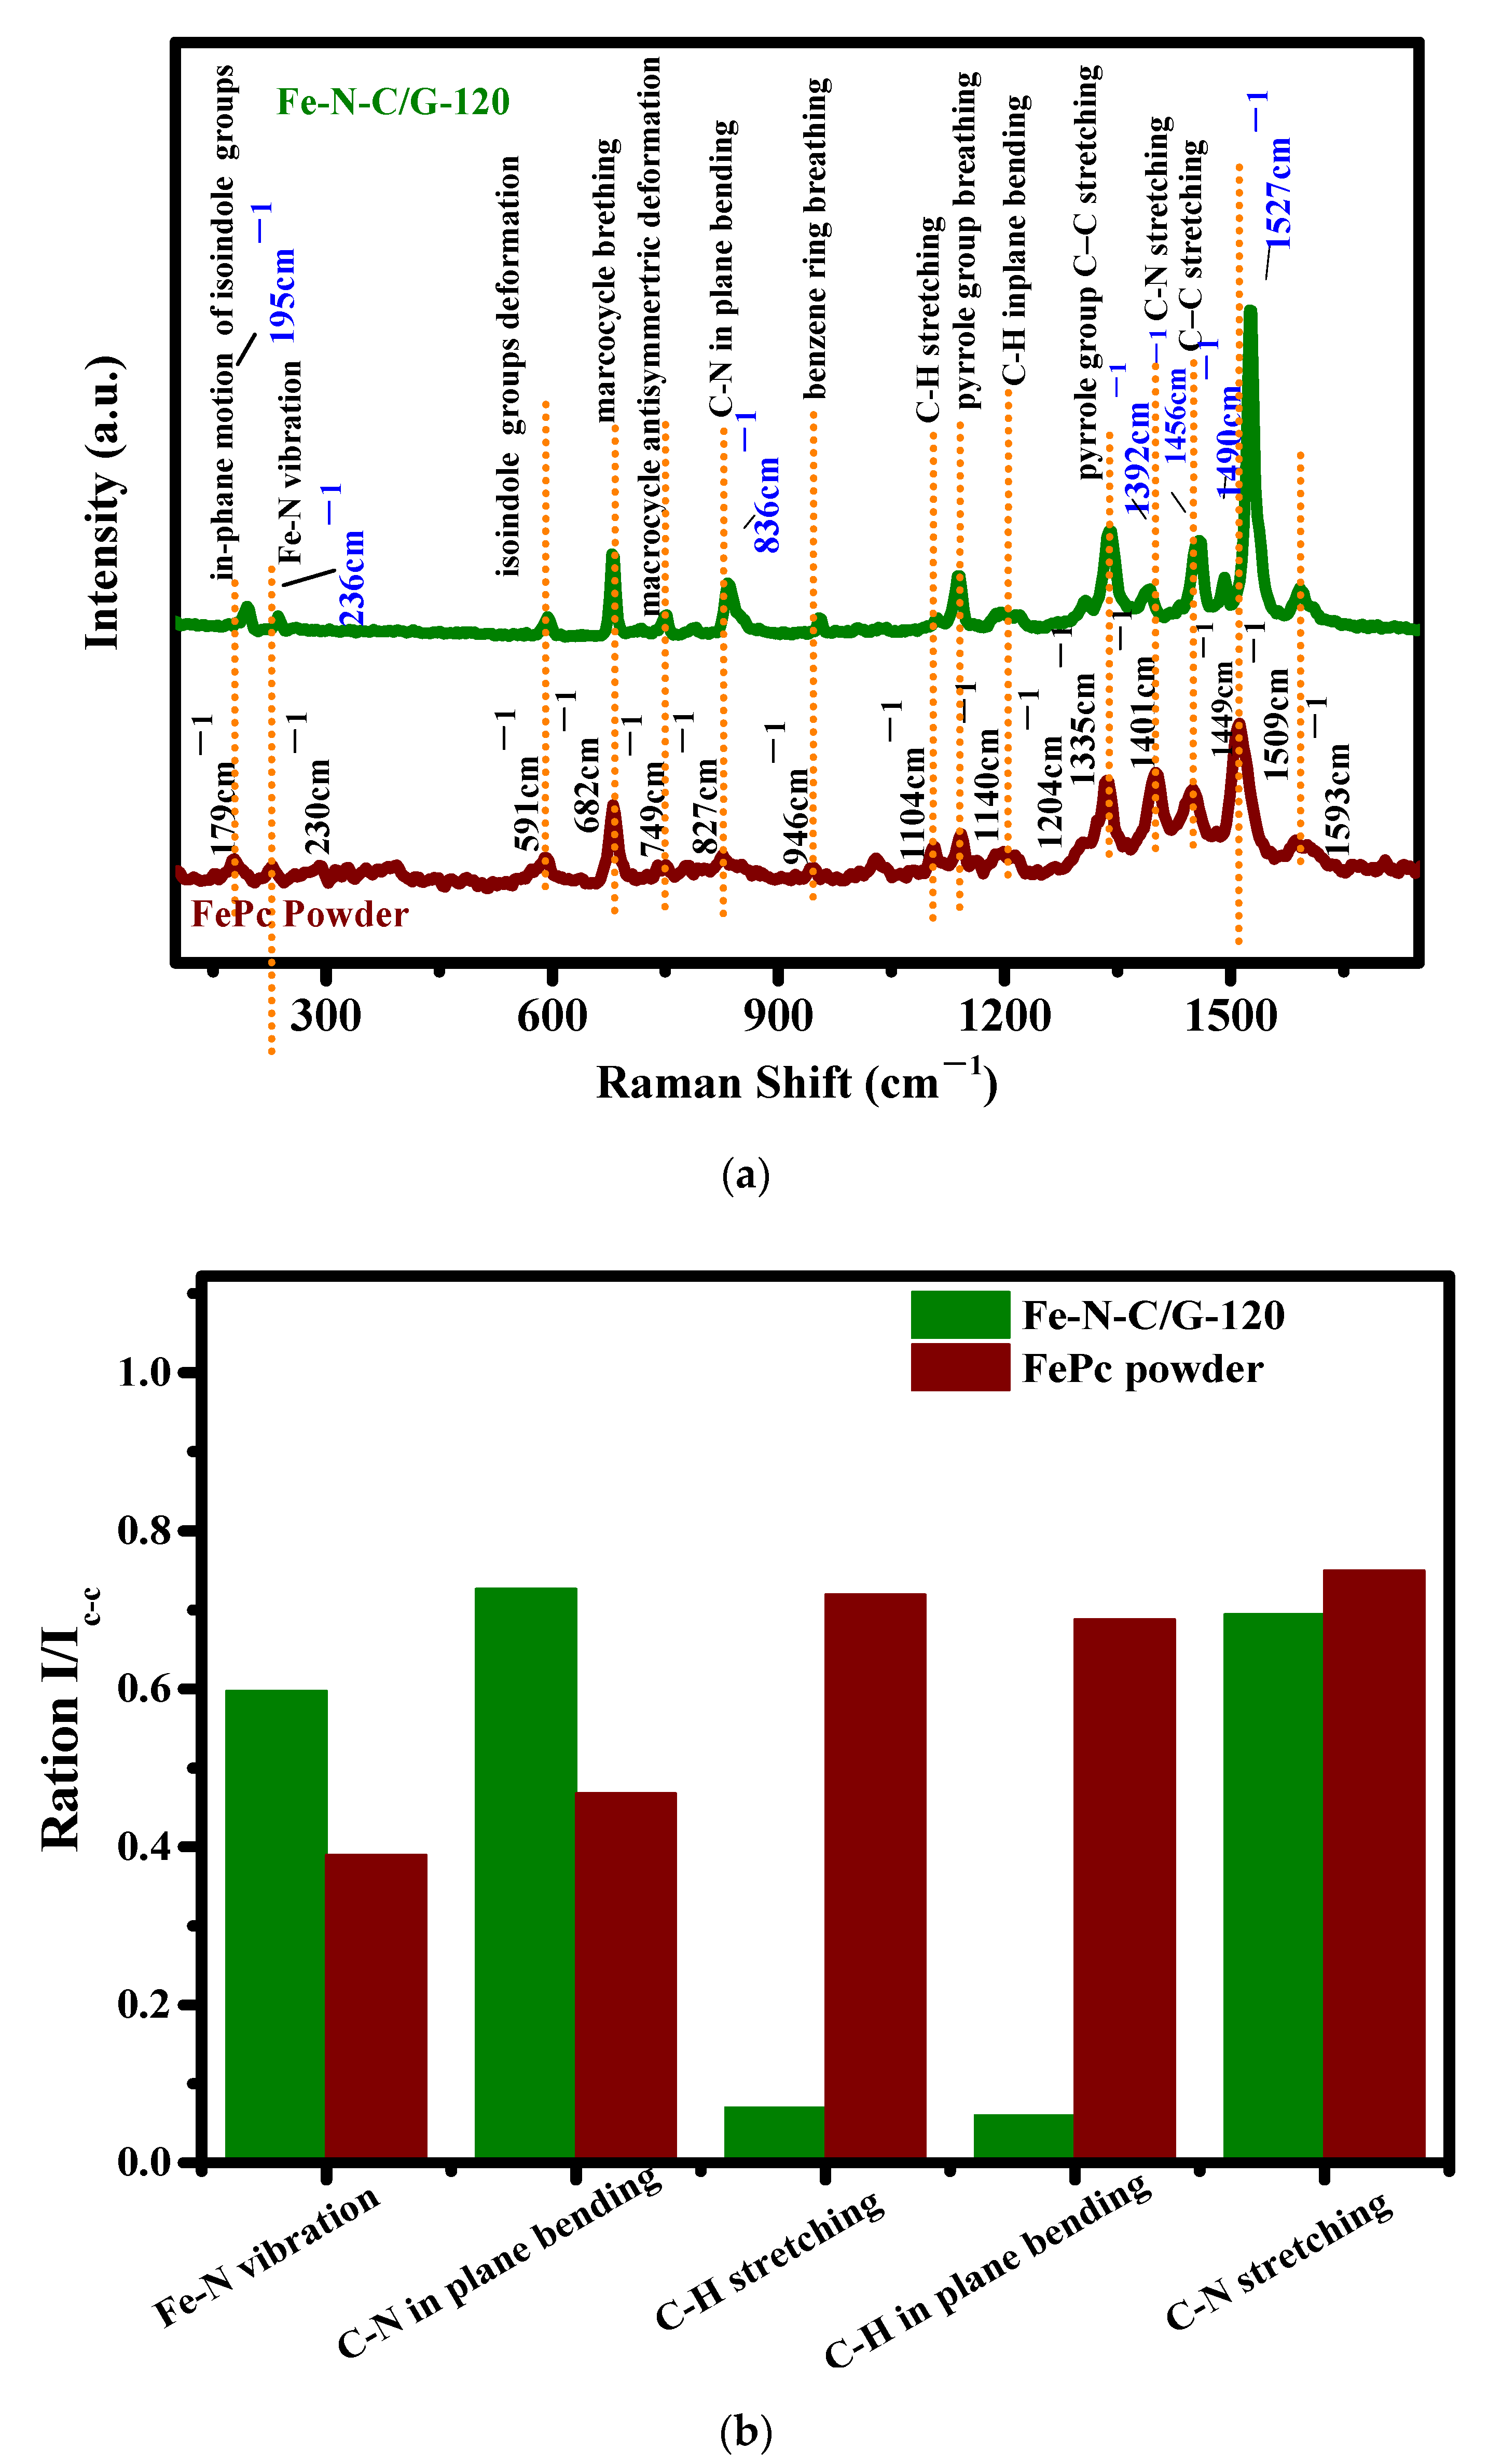
SEM, HRTEM, and XRD analyses indicated that the as-prepared catalysts possessed the same structure, although their morphologies were different; therefore, the following analyses were conducted for Fe–N–C-f catalyst. Figure 5a displays the Raman spectra of FePc powders and synthesized Fe–N–C-f catalyst. The peaks located at 1449 cm−1 and 1456 cm−1 were all caused by the vibration of C–C bonds in FePc powders and Fe–N–C-f catalyst, respectively [31]. Because the peak height of the C–C bonds essentially did not change, C–C bonds in FePc powders and Fe–N–C-f catalyst were thus stable during the synthetic process. To clearly understand the variation of the coordination structure, we calculated the peak intensity ratios I/IC-C, as shown in Figure 5b, where I represents the peak intensity in the Raman spectra and IC-C represents the peak intensity of C–C bonds in the Raman spectra. The peaks at 179, 230, 682, 827, and 1401 cm−1 for FePc powders, induced separately by the in-plane motion of the isoindole group; Fe–N stretching vibration; macrocycle breathing vibration; and the two types of C–N stretching vibration [32] also appeared in the synthesized Fe–N–C-f catalyst. The result indicates that the macrocyclic structure in FePc powders remained in synthesized Fe–N–C-f catalyst. For Fe–N–C-f catalyst, ratio IC-N/IC-C corresponding to C–N bond in plane-bending vibration (Figure 5b) became much higher compared with FePc powders, and the same variation also appeared for Fe–N vibration, implying that the numbers of C–N bonds and Fe–N bonds increased in Fe–N–C-f catalyst. An obvious peak shift from 230 cm−1 for FePc powders to 236 cm−1 for Fe–N–C-f catalyst can be observed for Fe–N stretching vibration. Moreover, the peak located at 1509 cm−1 for FePc powders, which represented the in-plane vibration of the bonds between Fe and pyrrole-like N atoms, blue shifted to 1527 cm−1 for Fe–N–C-f catalyst. The shift indicated that the chemical environment around Fe(II) in Fe–N–C-f catalyst was different from that in FePc powders. The ratios IC-H/IC-C for Fe–N–C-f catalyst, which separately corresponded to the stretching vibrations (at 1104 cm−1) and the in-plane bending vibrations (at 1204 cm−1) of C–H bonds, became lower than that of FePc powder, indicating that C–H bonds no longer existed in the synthesized Fe–N–C-f catalyst.
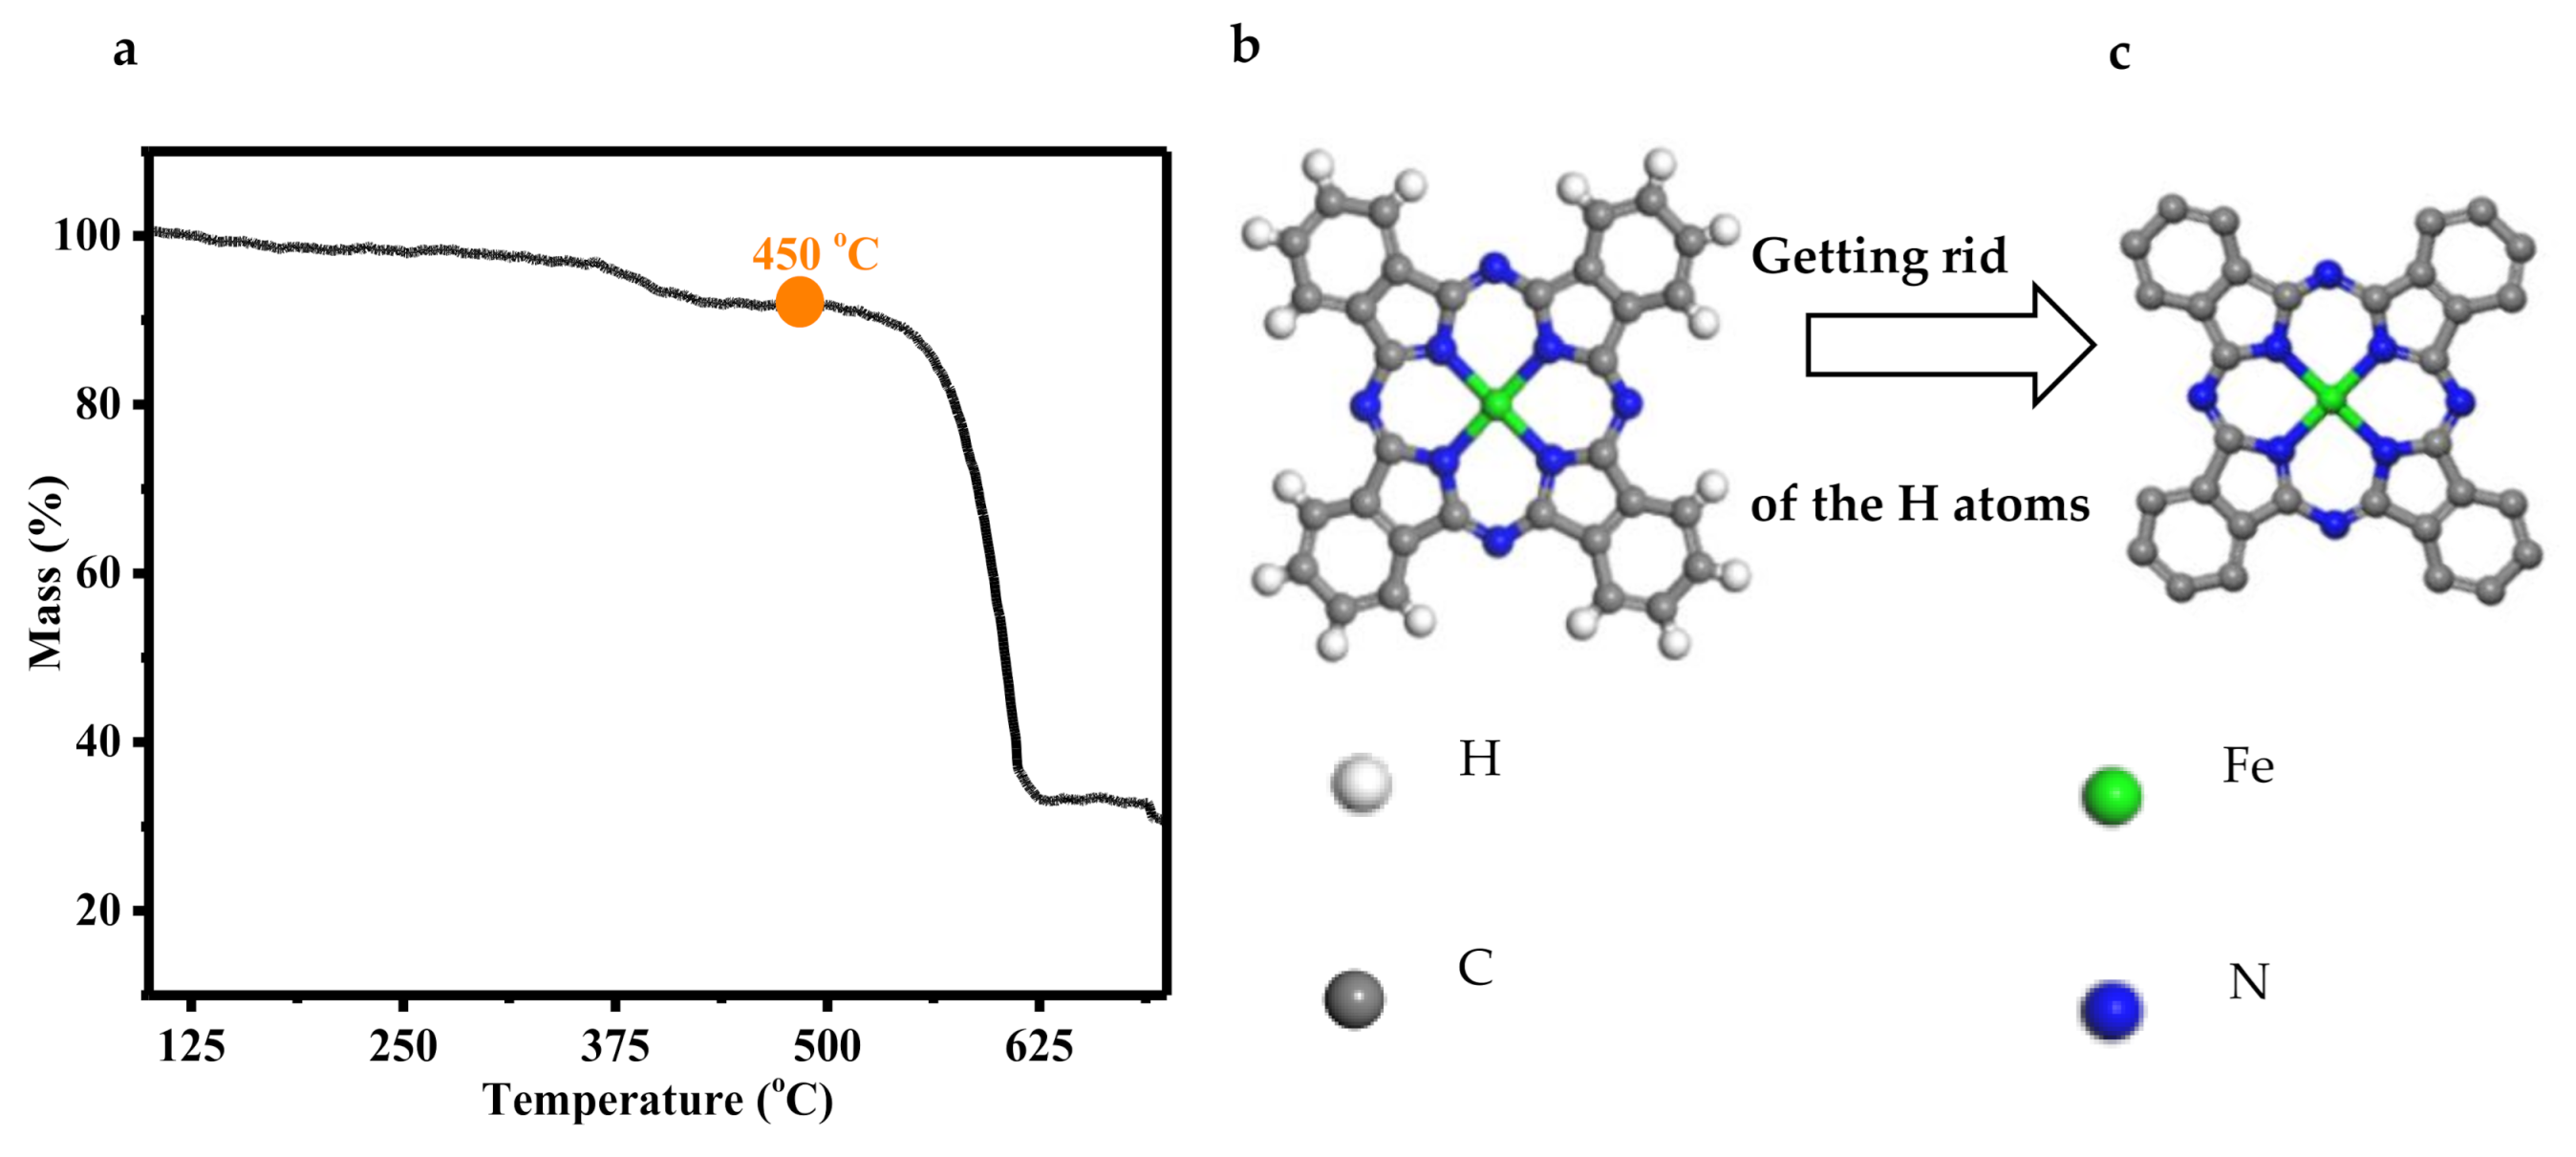
On the basis of the analyses above, we can conclude conclude that FePc molecules underwent a pyrolysis process to get rid of all the H atoms during the heating process at 450 °C in argon gas environment, while the macrocyclic structure in FePc molecules remained in synthesized Fe–N–C-f catalyst. For Fe–N–C-f catalyst, the numbers of C–N bonds and Fe–N bonds remarkably increased while C–H bonds disappeared in comparison with FePc powders.
X-ray photoelectron spectroscopy (XPS) analyses were conducted for FePc powders and Fe–N–C-f catalyst to explore the interaction in the structure. The XPS survey spectrum (Figure 6a) showed distinctive peaks of elements Fe, N, O, and C. The peak of O1s was considered to be from the inevitable surface oxidation and pollutant. The Fe 2p3/2 core level XPS spectra of FePc powder showed two peaks at 708.6 and 710.7 eV, corresponding to the Fe(II) in the bond Fe(II)–N and the satellite, respectively (Figure 6b) [33,34,35]. The corresponding Fe(II) peak for Fe–N–C-f catalyst blue shifted to 709.4 eV, indicating a decrease in the electron density around the Fe(II) in Fe(II)–N bonds compared with that in FePc powders. The N 1s spectrum (Figure 6c) of FePc powders can be deconvoluted into two peaks at 398.8 and 399.1 eV corresponding to the N atoms in graphitic N and pyrroline N bonds, respectively [35]. A new peak at 398.4 eV appeared in the N 1s spectrum of Fe–N–C-f catalyst, which can be assigned to the N atoms in pyridinic N. The new peak revealed that parts of the N atoms originally in the pyrroline–N in FePc molecules bonded with the Fe (II) to form new pyridinic N bonds in Fe–N–C-f catalyst. The negative shift in the bonding energy of the N atoms indicated that the electronic density around the N atom in the new pyrroline–N bonds increased in comparison with that in FePc power. The C1s spectrum of FePc powders (Figure 6d) can be deconvoluted into four peaks at 284.5, 285.3, 285.8, and 289.2 eV, which can be assigned to C–C=C, C–C(H)–C, C–N, and C–O, respectively [18]. The C–O peak is considered to be from the inevitable surface oxidation and pollutant. Compared with the C1s spectrum of FePc powders, the peak corresponding to C–C(H)–C disappeared while the other two peaks remained in the C1s spectrum of Fe–N–C-f catalyst, indicating that the H atoms in FePc molecules were removed during the synthesizing process. In addition, the area size enclosed by the peak corresponding to C–C=C bonds in Fe–N–C-f catalyst became much larger compared with that in PcFe powders, showing that the C atoms originally bonding with the H atoms in PcFe molecules bonded with the adjacent C atoms to form new C–C=C bonds in Fe–N–C-f catalyst. The results above indicate that the H atoms in PcFe molecules were removed during the synthesizing process. The Fe(II) in Fe–N–C-f catalyst bonded with an adjacent N atom in the adjacent layer and formed a new bond. The C atoms in Fe–N–C-f catalyst bonded with adjacent C atoms to form new C–C=C bonds.

3.3. Analyses on the Performance

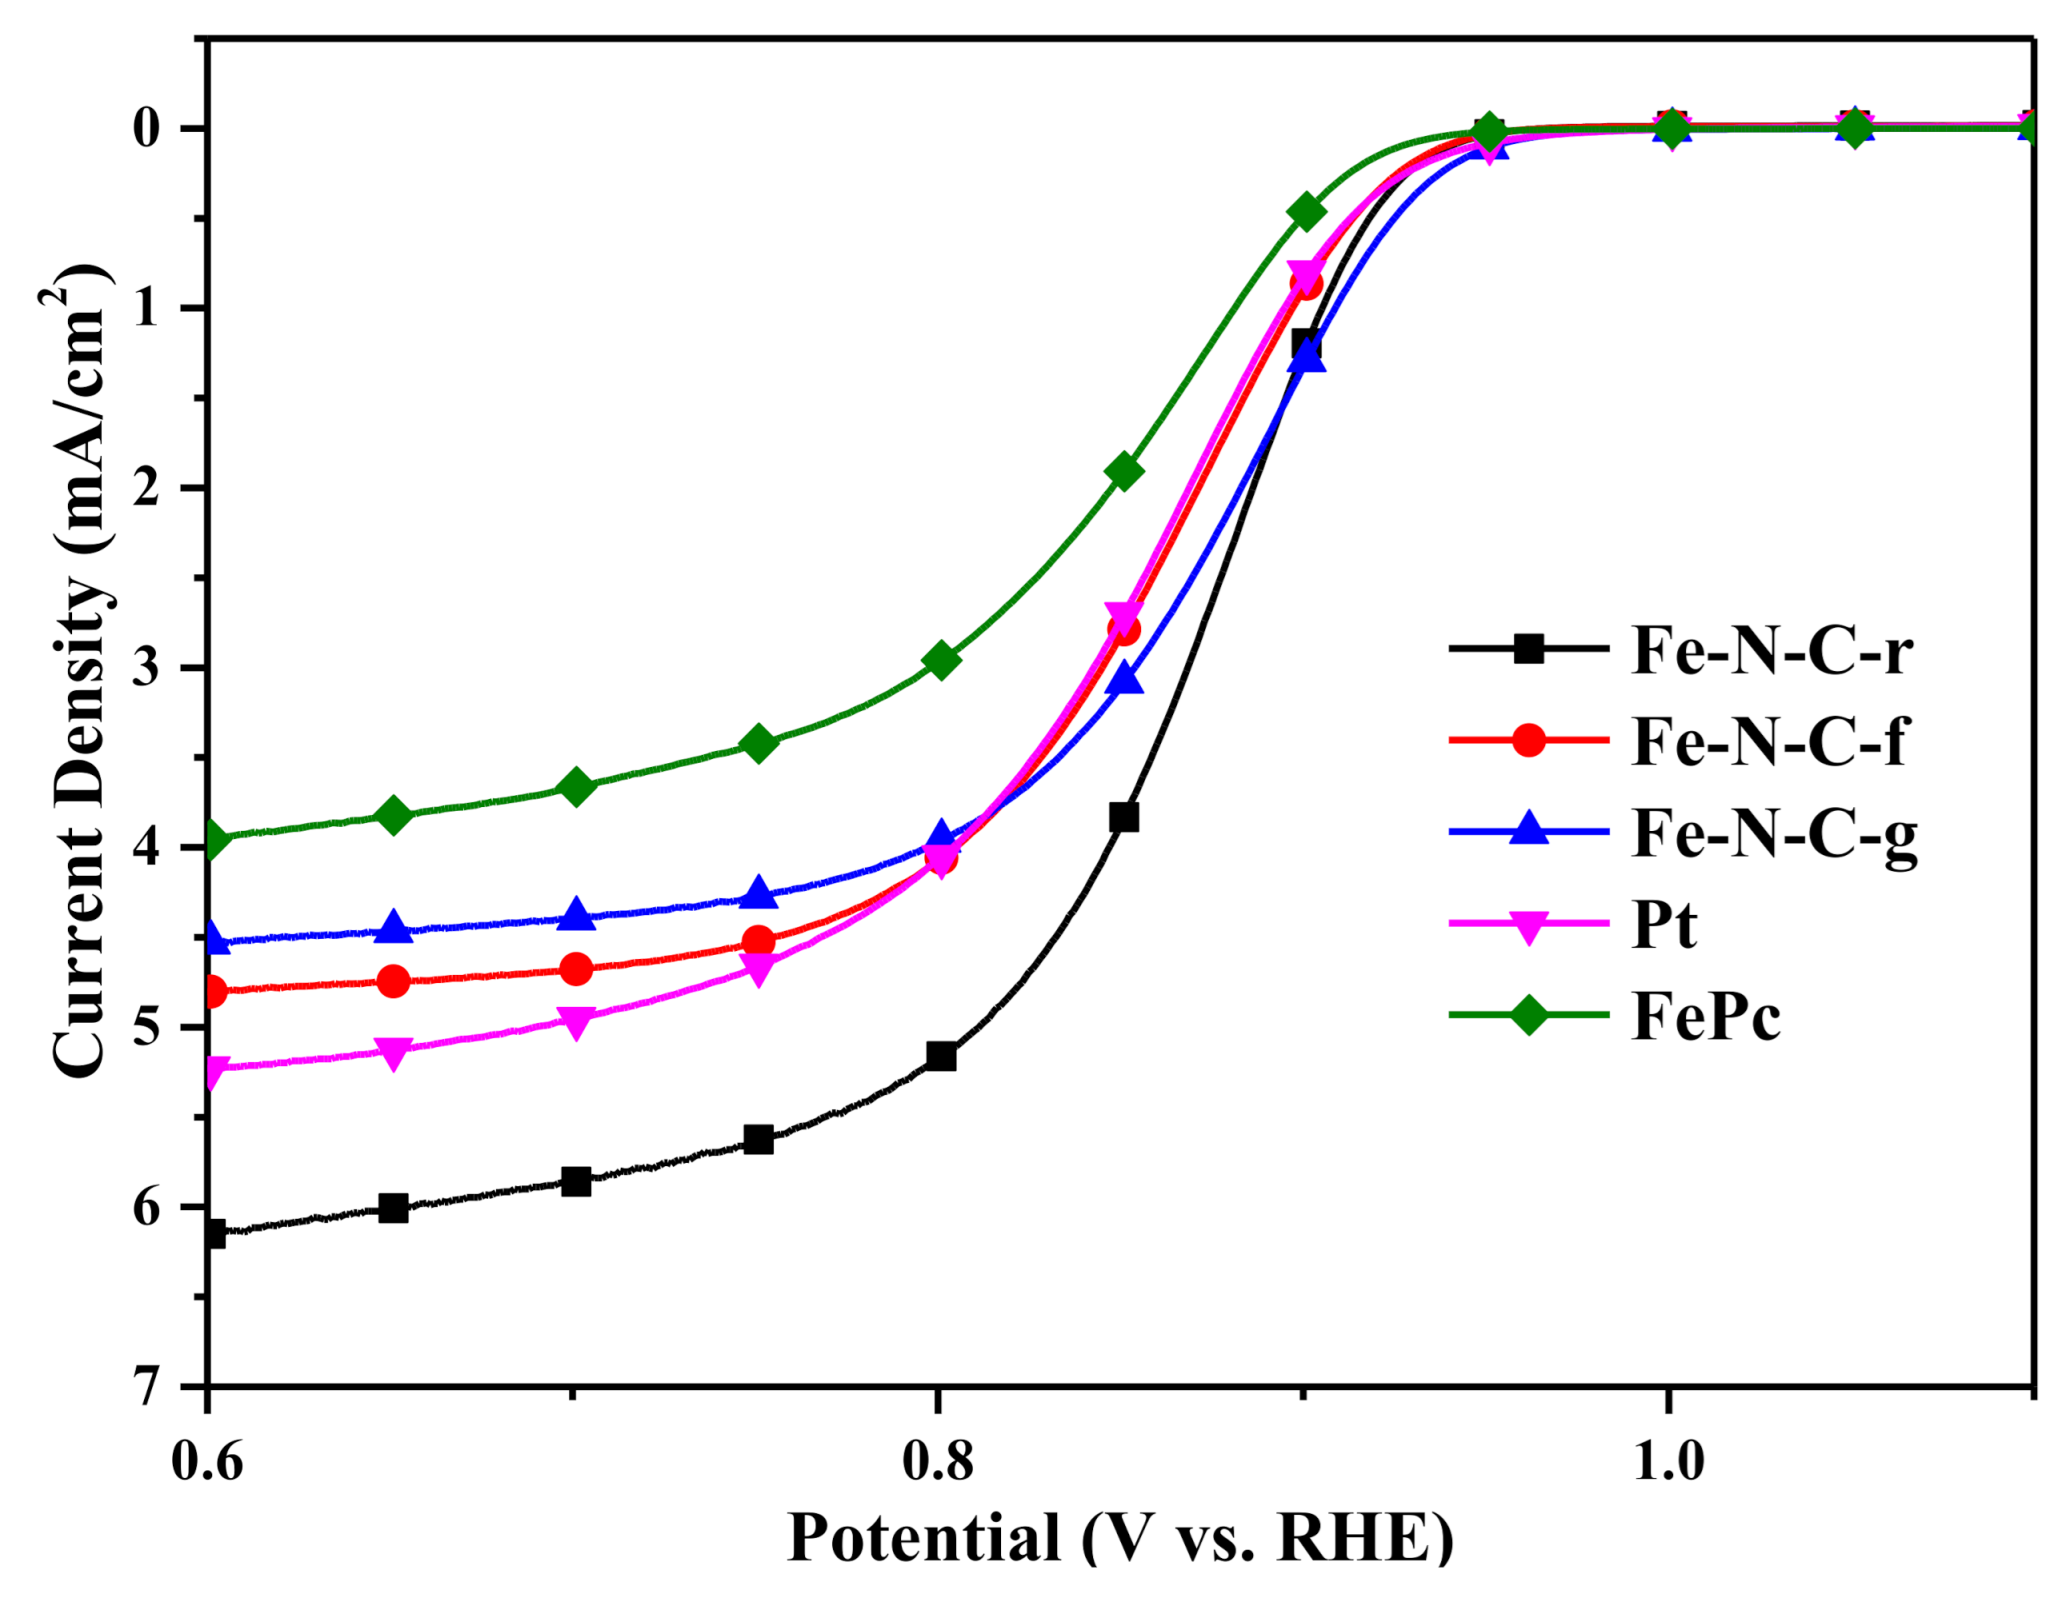
In order to explore the effects of the morphologies on the ORR performance, we measured LSV curves of synthesized catalysts, commercial Pt/C catalyst, and FePc powders in O2-saturated 0.1 M KOH solutions. The rotating speed of GCE was controlled to be 1600 rpm and the result is shown in Figure 7. The LSV curves of Fe–N–C-f catalyst and commercial Pt/C catalyst almost overlapped, meaning that their ORR electrocatalytic activities were similar. The ORR current of Fe–N–C-r and Fe–N–C-g catalysts was notably higher than that of Fe–N–C-f catalyst and commercial Pt/C catalyst, exhibiting excellent ORR electrocatalytic activity. The ORR current densities of the catalysts at potential 0.88 V increased in the following order: FePc (1.04 mA/cm2) < Pt/C catalyst (1.54 mA/cm2) Fe–N–C-f catalyst (1.64 mA/cm2) < Fe–N–C-g catalyst (2.12 mA/cm2) < Fe–N–C-r catalyst (2.35 mA/cm2). The onset potentials of Fe–N–C-r catalyst, Fe–N–C-f catalyst, and commercial Pt/C catalyst were the same (0.93 V), which was more negative than that of Fe–N–C-g (0.95 V). The performance comparison of other work is found in the Supplementary Information section. Among the three morphological catalysts, the ORR electrocatalytic activity of nanorod-shaped catalyst was the best, while that of nanofiber-shaped catalyst was the worst.

3.4. Thermogravimetric Analyses

The thermogravimetric curve (TGA) of FePc powders was measured, and it is shown in Figure 8a. The sublimation of FePc molecules (Figure 8b) occurred in the temperature range of 360–500 °C. On the basis of the Raman and XPS analyses showing that the H atoms in FePc molecules (Figure 8b) no longer existed while the macrocyclic structures in FePc molecules remained in synthesized catalyst, we can consider that FePc molecules got rid of all the H atoms through a pyrolysis process when heated at 450 °C. In other words, the sublimation and getting rid of all the H atoms took place at the same time when heated at 450 °C. It can be speculated that unstable segments (Figure 8c) were formed in the space around FePc powders during the synthesizing process. In order to reach a comparatively stable state, the unstable segments mutually self-assembled in the space to form self-assembly units. Subsequently, the self-assembly units fell on the substrate (G/Cu) by flowing Ar gas and crystallized on the surface of the monolayer graphene to form catalysts.

3.5. Proposed Forming Mechanism

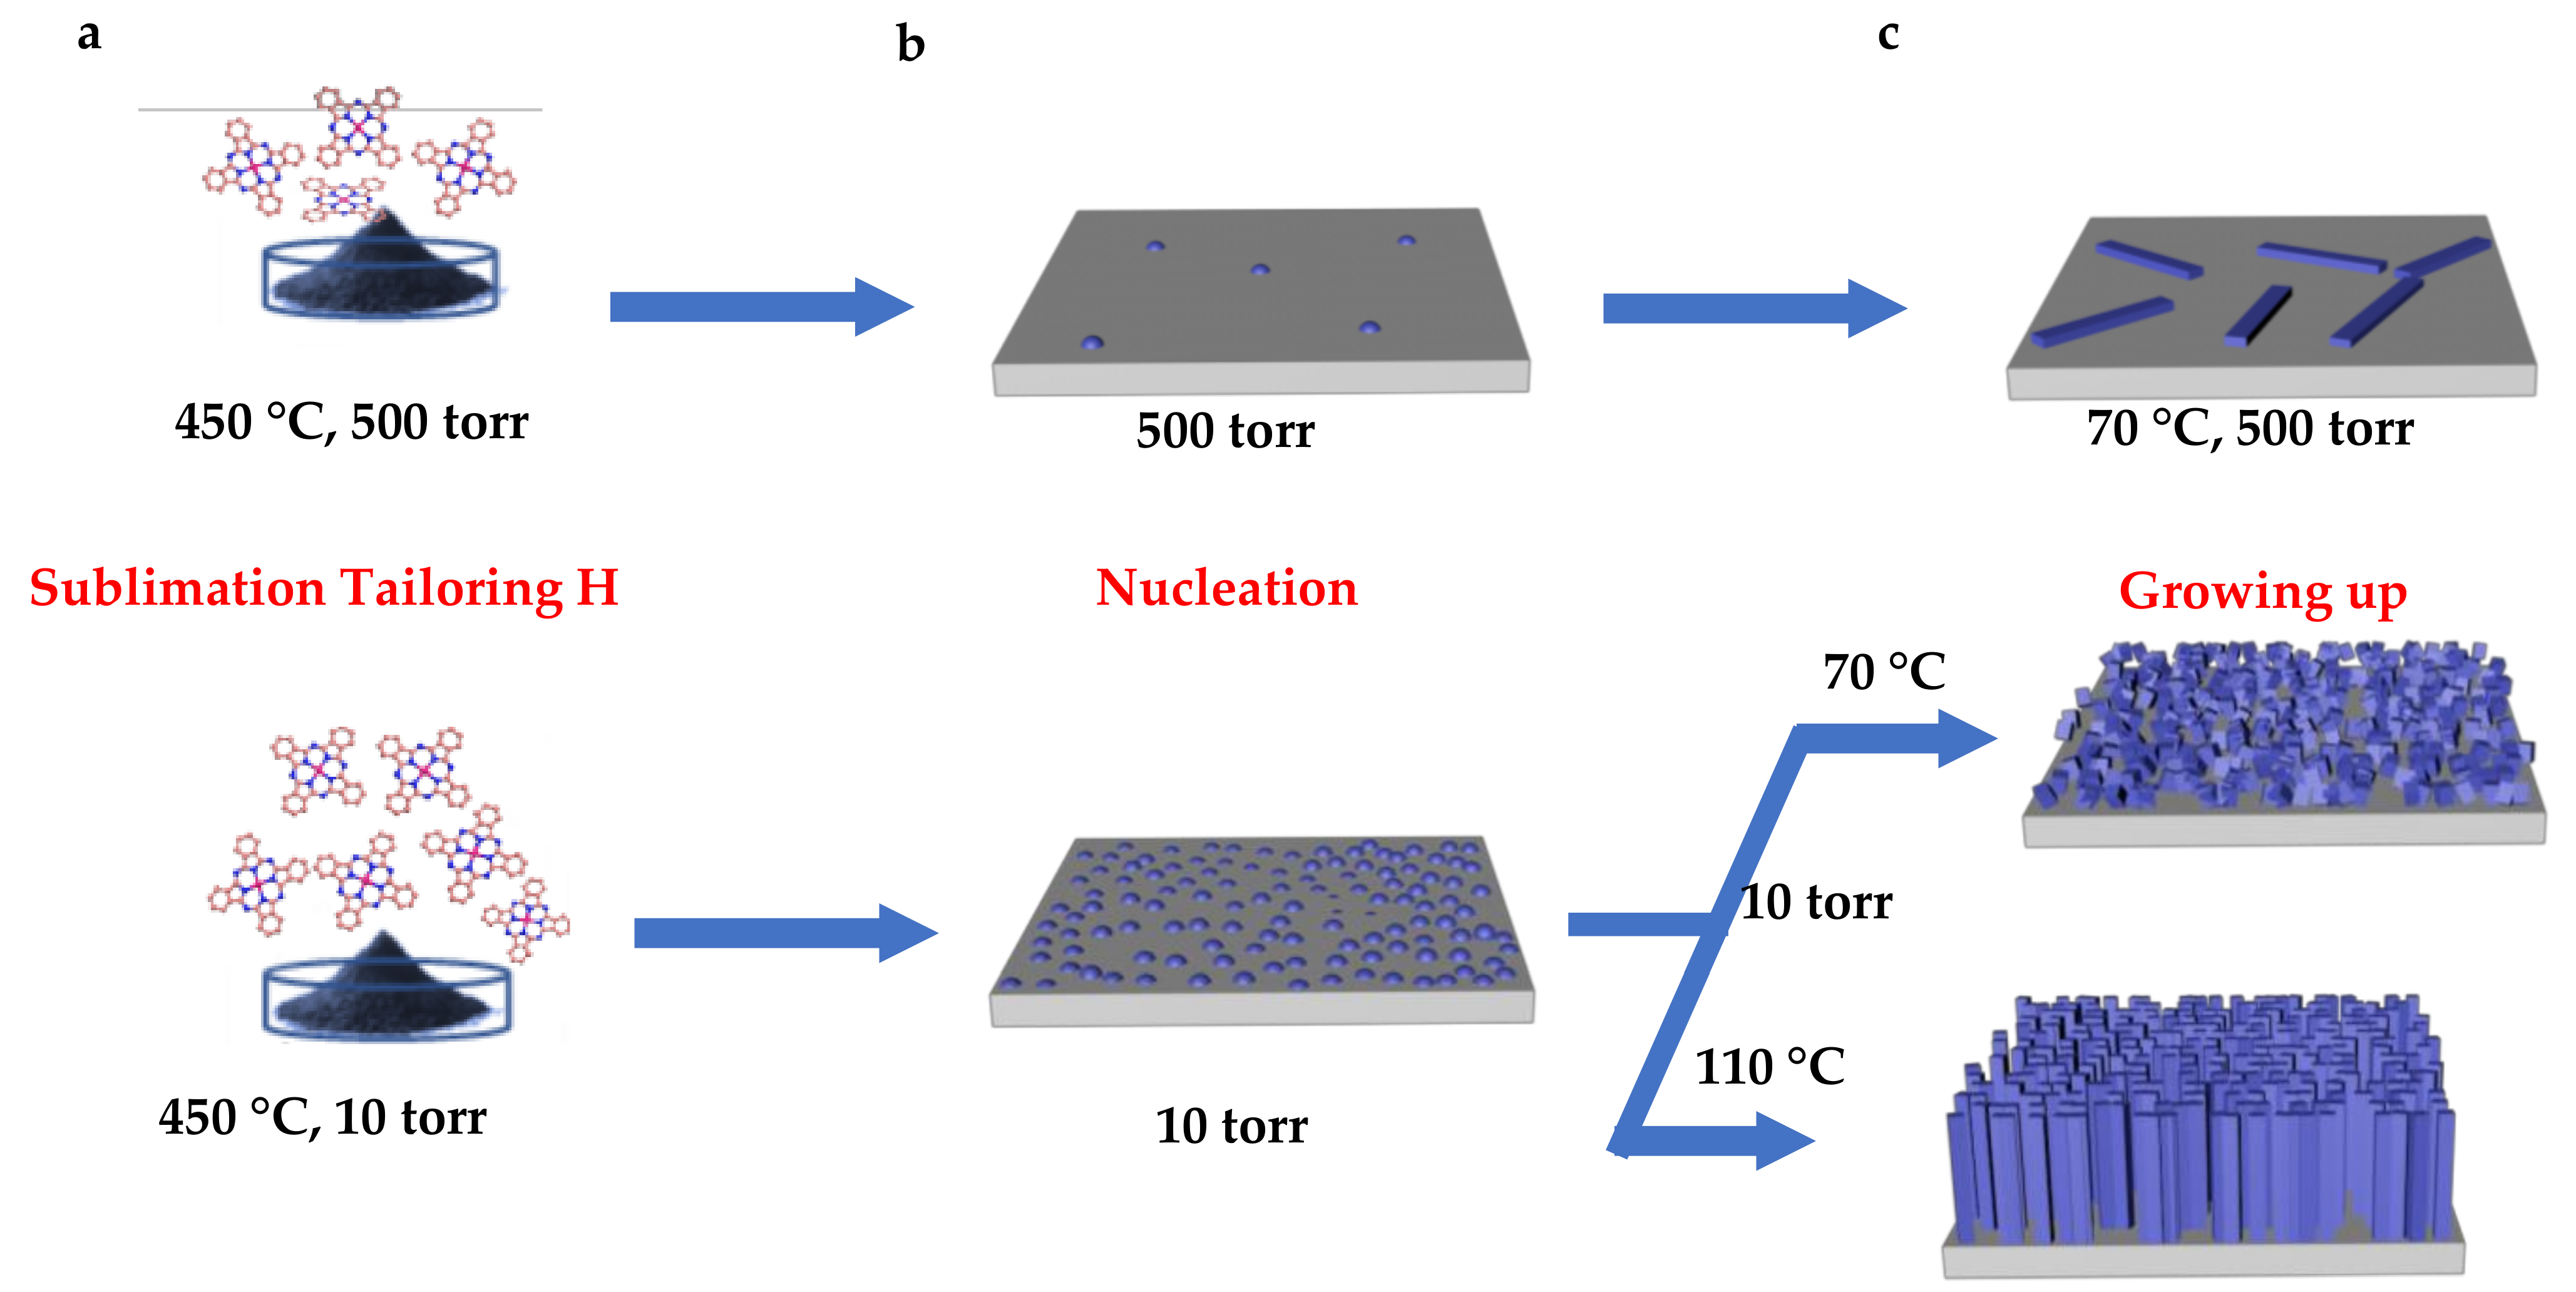
On the basis of the analyses of TGA curves, SEM, HRTEM, XRD, XPS, and Raman, we can reasonably explain the effect of the pressure and temperature on the morphology of the catalysts as follows (Figure 9). As shown in Figure 9a, the pressure in the tube furnace notably affected the sublimation of FePc molecules when heating FePc powders at 450 °C. Compared with low pressure (10 torr), high pressure (500 torr) seriously inhibited the sublimation process of FePc powders, resulting in a huge difference in the numbers of sublimated FePc molecules. The sublimated FePc molecules got rid of the H atoms in FePc molecules and unstable segments generated in the space around FePc powders. Subsequently the unstable segments were driven to the place where the G/Cu substrate was by flowing argon gas and nucleate on the surface of the monolayer graphene in G/Cu substrate. As shown in Figure 9b, the numbers of the crystal nucleus formed under pressure 500 torr condition were much less than that formed under pressure 10 torr condition, which was caused by the huge difference in the numbers of the unstable segments. As shown in Figure 9c, a large amount of crystal nucleus grew up to form the nanorods of the catalyst along the direction perpendicular to the surface of the substrate under the pressure 10 torr condition, producing Fe–N–C-r catalysts. On the contrary, the high pressure (500 torr) changed the growing direction of the crystal nucleus to the direction along the surface of the substrate, forming Fe–N–C-f catalyst. Figure 9c also exhibits that the key factor controlling the formation of nanorod-shaped or nanogranule-shaped catalyst at low pressure (10 torr) was the temperature of G/Cu substrate. At low pressure (10 torr), the existence of great amounts of unstable segments made the nucleation easy to process. High temperature (110 °C) made the unstable segments more energic to regularly array into the crystal structure, resulting in the crystal nucleus growing into nanorod with much better crystallinity. Low temperature (70° C) was not sufficient to support the crystal nucleus fully growing up, and therefore Fe–N–C-g catalyst formed. The low temperature (70 °C) and high pressure (500 torr) greatly restricted the mobility of the unstable segments, resulting in the worst crystallinity for Fe–N–C-f catalyst.

4. Conclusions

The catalysts with three kinds of morphology, nanorod (noted as Fe–N–C-r), nanofiber (noted as Fe–N–C-f), and nanogranule (noted as Fe–N–C-g), were synthesized through the unique organic vapor deposition technology developed in our lab. The high pressure notably inhibited the sublimation of FePc molecules and made the nucleation difficult, resulting in a filiform growth of the catalyst along the surface of the substrate and poor crystallinity. In contrary, the low pressure promoted the sublimation and followed nucleation, resulting in a rod-shaped growth of the catalyst along the direction vertical to the surface of the substrate and high crystallinity. The growth of the catalyst at low pressure depended on the temperature. Low temperature decreased the mobility of the molecules, making the growth unsustainable and forming granule-shaped catalyst. SEM, HRTEM, and XRD analyses demonstrated that the crystal structure of catalysts Fe–N–C-r, Fe–N–C-f, and Fe–N–C-g were the same, which was totally different from that of FePc powders, the precursor. Synthesized catalysts possessed a layer structure with two kinds of new bonds not existing in FePc structure, involving the bonds between Fe(II) and the N atom in the adjacent layer as well as the bonds between the C atoms originally bonding with the H atom in different FePc molecules. At the end of the article, the formation mechanisms of three types of catalysts were proposed, which can reasonably explain the effects of temperature and pressure. Such research can help the design of future catalysts.

Supplementary Materials

The following are available online at https://www.mdpi.com/2227-9717/9/1/109/s1, Figure S1: Surface morphology obtained by deposition at 10 torr with different temperatures for half an hour (a) 50 °C (b) 70 °C (c) 90 °C (d) 110 °C (e) 130 °C (f) 150 °C; Figure S2: Surface morphology obtained by deposition at 110 °C, 10 torr with different growth time (a) 1 min (b) 5 min (c) 15 min (d) 30 min (e) 45 min (f)60 min; are Figure S3: Surface morphology obtained by deposition at 70 °C for 30 min with different pressure (a) 10 torr (b) 50 torr (c) 350 torr (d) 500 torr; Figure S4: LSV curves of the catalysts in O2-saturated 0.1 M KOH solution and N2-saturated 0.1 M KOH solution; Table S1: Comparison of ORR performance between FePc catalysts and the reported FePc-based catalysts in literatures.

Author Contributions

N.Y.: Organize data, write papers, organize paper format, reply review comments; F.L.: Organize data; X.M.: Assist experiment; M.Q.: Assist experiment; G.Z.: Assist experiment; L.B.: Edit the paper; Z.L.: Edit the paper; W.W.: Provide idea, Edit the paper. All authors have read and agreed to the published version of the manuscript.

Funding

This research received no external funding.

Institutional Review Board Statement

Not applicable for studies not involving humans or animals.

Informed Consent Statement

Not applicable for studies not involving humans or animals.

Data Availability Statement

All data used to support the findings of this study are included within the article.

Conflicts of Interest

There is no conflict of interest to declare.

References

  1. Debe, M.K. Electrocatalyst approaches and challenges for automotive fuel cells. Nature 2012, 486, 43–51. [Google Scholar] [CrossRef]
  2. Slate, A.J.; Whitehead, K.A.; Brownson, D.A.C.; Banks, C.E. Microbial fuel cells: An overview of current technology. Renew. Sustain. Energy Rev. 2019, 101, 60–81. [Google Scholar] [CrossRef]
  3. Staffell, I.; Scamman, D.; Abad, A.V.; Balcombe, P.; Dodds, P.E.; Ekins, P.; Shah, N.; Ward, K.R. The role of hydrogen and fuel cells in the global energy system. Energy Environ. Sci. 2019, 12, 463–491. [Google Scholar] [CrossRef] [Green Version]
  4. Armaroli, N.; Balzani, V. The Future of Energy Supply: Challenges and Opportunities. Angew. Chem. Int. Ed. Engl. 2007, 46, 52–66. [Google Scholar] [CrossRef] [PubMed]
  5. Joya, K.S.; Joya, Y.F.; Ocakoglu, K.; van de Krol, R. Water-Splitting Catalysis and Solar Fuel Devices: Artificial Leaves on the Move. Angew. Chem. Int. Ed. Engl. 2013, 52, 10426–10437. [Google Scholar] [CrossRef] [PubMed]
  6. Zhu, Y.P.; Guo, C.; Zheng, Y.; Qiao, S.Z. Surface and Interface Engineering of Noble-Metal-Free Electrocatalysts for Efficient Energy Conversion Processes. Acc. Chem. Res. 2017, 50, 915–923. [Google Scholar] [CrossRef] [PubMed]
  7. Jiao, W.; Chen, C.; You, W.; Zhang, J.; Liu, J.; Che, R. Yolk–Shell Fe/Fe4N@Pd/C Magnetic Nanocomposite as an Efficient Recyclable ORR Electrocatalyst and SERS Substrate. Small 2019, 15, e1805032. [Google Scholar] [CrossRef]
  8. Guo, S.; Li, D.; Zhu, H.; Zhang, S.; Markovic, N.M.; Stamenkovic, V.R.; Sun, S. FePt and CoPt Nanowires as Efficient Catalysts for the Oxygen Reduction Reaction. Angew. Chem. Int. Ed. Engl. 2013, 52, 3465–3468. [Google Scholar] [CrossRef]
  9. Yang, Z.K.; Lin, L.; Xu, A.W. 2D Nanoporous Fe−N/C Nanosheets as Highly Effificient Non-Platinum Electrocatalysts for Oxygen Reduction Reaction in Zn-Air Battery. Small 2016, 12, 5710–5719. [Google Scholar] [CrossRef]
  10. Becknell, N.; Son, Y.; Kim, D.; Li, D.; Yu, Y.; Niu, Z.; Lei, T.; Sneed, B.T.; More, K.L.; Markovic, N.M.; et al. Control of Architecture in Rhombic Dodecahedral Pt-Ni Nanoframe Electrocatalysts. J. Am. Chem. Soc. 2017, 139, 11678–11681. [Google Scholar] [CrossRef] [Green Version]
  11. Li, S.; Tian, Z.Q.; Liu, Y.; Jang, Z.; Hasan, S.W.; Chen, X.; Tsiakaras, P.; Shen, P.K. Hierarchically skeletal multi-layered Pt-Ni nanocrystals for highly efficient oxygen reduction and methanol oxidation reactions. Chin. J. Catal. 2021, 42, 648–657. [Google Scholar] [CrossRef]
  12. Liu, J.; Yin, J.; Feng, B.; Xu, T.; Wang, F. Enhanced Electrocatalytic Activity and Stability toward the Oxygen Reduction Reaction with Unprotected Pt Nanoclusters. Nanomaterials 2018, 8, 955. [Google Scholar] [CrossRef] [PubMed] [Green Version]
  13. Beermann, V.; Gocyla, M.; Kuhl, S.; Padgett, E.; Schmies, H.; Goerlin, M.; Erini, N.; Shviro, M.; Heggen, M.; Dunin-Borkowski, R.E.; et al. Tuning the Electrocatalytic Oxygen Reduction Reaction Activity and Stability of Shape-Controlled Pt−Ni Nanoparticles by Thermal Annealing-Elucidating the Surface Atomic Structural and Compositional Changes. J. Am. Chem. Soc. 2017, 139, 16536–16547. [Google Scholar] [CrossRef] [PubMed]
  14. Seo, A.; Lee, J.; Han, K.; Kim, H. Performance and stability of Pt-based ternary alloy catalysts for PEMFC. Electrochim. Acta 2006, 52, 1603–1611. [Google Scholar] [CrossRef]
  15. Gutsche, C.; Moeller, C.J.; Knipper, M.; Borchert, H.; Parisi, J.; Plaggenborg, T. Synthesis, Structure, and Electrochemical Stability of Ir-Decorated RuO2 Nanoparticles and Pt Nanorods as Oxygen Catalysts. J. Phys. Chem. C 2016, 120, 1137–1146. [Google Scholar] [CrossRef]
  16. Muratsugu, S.; Miyamoto, S.; Sakamoto, K.; Ichihashi, K.; Kim, C.K.; Ishiguro, N.; Tada, M. Size Regulation and Stability Enhancement of Pt Nanoparticle Catalyst via Polypyrrole Functionalization of Carbon-Nanotube Supported Pt Tetranuclear Complex. Langmuir 2017, 33, 10271–10282. [Google Scholar] [CrossRef]
  17. Beermann, V.; Gocyla, M.; Willinger, E.; Rudi, S.; Heggen, M.; Dunin-Borkowski, R.E.; Willinger, M.G.; Strasser, P. Rh-Doped Pt–Ni Octahedral Nanoparticles: Understanding the Correlation between Elemental Distribution, Oxygen Reduction Reaction, and Shape Stability. Nano Lett. 2016, 16, 1719–1725. [Google Scholar] [CrossRef]
  18. Silva, G.C.; Fernandes, M.R.; Ticianelli, E.A. Activity and Stability of Pt/IrO2 Bifunctional Materials as Catalysts for the Oxygen Evolution/Reduction Reactions. ACS Catal. 2018, 8, 2081–2092. [Google Scholar] [CrossRef]
  19. Firouzjaie, H.A.; Mustain, W.E. Catalytic Advantages, Challenges, and Priorities in Alkaline Membrane Fuel Cells. ACS Catal. 2019, 10, 225–234. [Google Scholar] [CrossRef] [Green Version]
  20. Shi, W.; Wang, Y.-C.; Chen, C.; Yang, X.-D.; Zhou, Z.-Y.; Sun, S.-G. A mesoporous Fe/N/C ORR catalyst for polymer electrolyte membrane fuel cells. Chin. J. Catal. 2016, 37, 1103–1108. [Google Scholar] [CrossRef]
  21. He, F.; Chen, X.; Shen, Y.; Li, Y.; Liu, A.; Liu, S.; Mori, T.; Zhang, Y. Ionic liquid-derived Fe–N/C catalysts for highly efficient oxygen reduction reaction without any supports, templates, or multi-step pyrolysis. J. Mater. Chem. A 2016, 4, 6630–6638. [Google Scholar] [CrossRef] [Green Version]
  22. Serov, A.; Artyushkova, K.; Atanassov, P. Fe-N-C Oxygen Reduction Fuel Cell Catalyst Derived from Carbendazim: Synthesis, Structure, and Reactivity. Adv. Energy Mater. 2014, 4, 1301735. [Google Scholar] [CrossRef]
  23. Sgarbi, R.; Kumar, K.; Jaouen, F.; Zitolo, A.; Ticianelli, E.A.; Maillard, F. Oxygen reduction reaction mechanism and kinetics on M-NxCy and M@N-C active sites present in model M-N-C catalysts under alkaline and acidic conditions. J. Solid State Electrochem. 2019. [Google Scholar] [CrossRef]
  24. Li, J.; Ghoshal, S.; Liang, W.; Sougrati, M.; Jaouen, F.; Halevi, B.; McKinney, S.; McCool, G.; Ma, C.; Yuan, X.; et al. Structural and mechanistic basis for the high activity of Fe–N–C catalysts toward oxygen reduction. Energy Environ. Sci. 2016, 9, 2418–2432. [Google Scholar] [CrossRef]
  25. Kramm, U.I.; Herranz, J.; Larouche, N.; Arruda, T.M.; Lefevre, M.; Jaouen, F.; Bogdanoff, P.; Fiechter, S.; Abs-Wurmbach, I.; Mukerjee, S.; et al. Structure of the catalytic sites in Fe/N/C-catalysts for O2-reduction in PEM fuel cells. Phys. Chem. Chem. Phys. 2012, 14, 11673–11688. [Google Scholar] [CrossRef]
  26. Yang, D.S.; Song, M.Y.; Singh, K.P.; Yu, J.S. The role of iron in the preparation and oxygen reduction reaction activity of nitrogen-doped carbon. Chem. Commun. 2015, 51, 2450–2453. [Google Scholar] [CrossRef] [Green Version]
  27. Liu, Q.; Cao, S.; Qiu, Y. Effect of carbonization temperature on bimetallic FeCo-N/C nanofifiber electrocatalysts for oxygen reduction reaction in sulfuric acid solution. Int. J. Hydrog. Energy 2017, 42, 29274–29282. [Google Scholar] [CrossRef]
  28. Morozan, A.; Jegou, P.; Campidelli, S.; Palacin, S.; Jousselme, B. Relationship between polypyrrole morphology and electrochemical activity towards oxygen reduction reaction. Chem. Commun. 2012, 48, 4627–4629. [Google Scholar] [CrossRef]
  29. Kramm, U.I.; Lefevre, M.; Larouche, N.; Schmeisser, D.; Dodelet, J.P. Correlations between Mass Activity and Physicochemical Properties of Fe/N/C Catalysts for the ORR in PEM Fuel Cell via 57Fe Mossbauer Spectroscopy and Other Techniques. J. Am. Chem. Soc. 2014, 136, 978–985. [Google Scholar] [CrossRef]
  30. Li, X.S.; Cai, W.W.; An, J.H.; Kim, S.; Nah, J.; Yang, D.X.; Piner, R.; Velamakanni, A.; Jung, I.; Tutuc, E.; et al. Large-Area Synthesis of High-Quality and Uniform Graphene Films on Copper Foils. Science 2009, 324, 1312–1314. [Google Scholar] [CrossRef] [Green Version]
  31. Tatar, B.; Demiroğlu, D. Electrical properties of FePc organic semiconductor thin films obtained by CSP technique for photovoltaic applications. Mater. Sci. Semicond. Process. 2015, 31, 644–650. [Google Scholar] [CrossRef]
  32. Zhao, Q.; Hou, M.; Jiang, S.; Wang, S.; Ai, J.; Zheng, L.; Shao, Z. Investigation of a Fe–N–C catalyst for sulfur dioxide electrooxidation. RSC Adv. 2016, 6, 80024–80028. [Google Scholar] [CrossRef]
  33. Artyushkova, K.; Serov, A.; Rojas-Carbonell, S.; Atanassov, P. Chemistry of Multitudinous Active Sites for Oxygen Reduction Reaction in Transition Metal−Nitrogen−Carbon Electrocatalysts. J. Phys. Chem. C 2015, 119, 25917–25928. [Google Scholar] [CrossRef]
  34. Cai, W.; Zhou, J.; Li, G.; Zhang, K.; Liu, X.; Wang, C.; Zhou, H.; Zhu, Y.; Qian, Y. B, N-co-doped graphene supported sulfur for superior stable Li-S half cell and Ge-S full battery. ACS Appl. Mater. Interfaces 2016, 8, 27679–27687. [Google Scholar] [CrossRef]
  35. Jin, L.; Zhu, B.; Wang, X.; Zhang, L.; Song, D.; Guo, J.; Tao, H. Facile Synthesis of the Amorphous Carbon Coated Fe-N-C Nanocatalyst with Effiffifficient Activity for Oxygen Reduction Reaction in Acidic and Alkaline Media. Materials 2020, 13, 4551. [Google Scholar] [CrossRef]
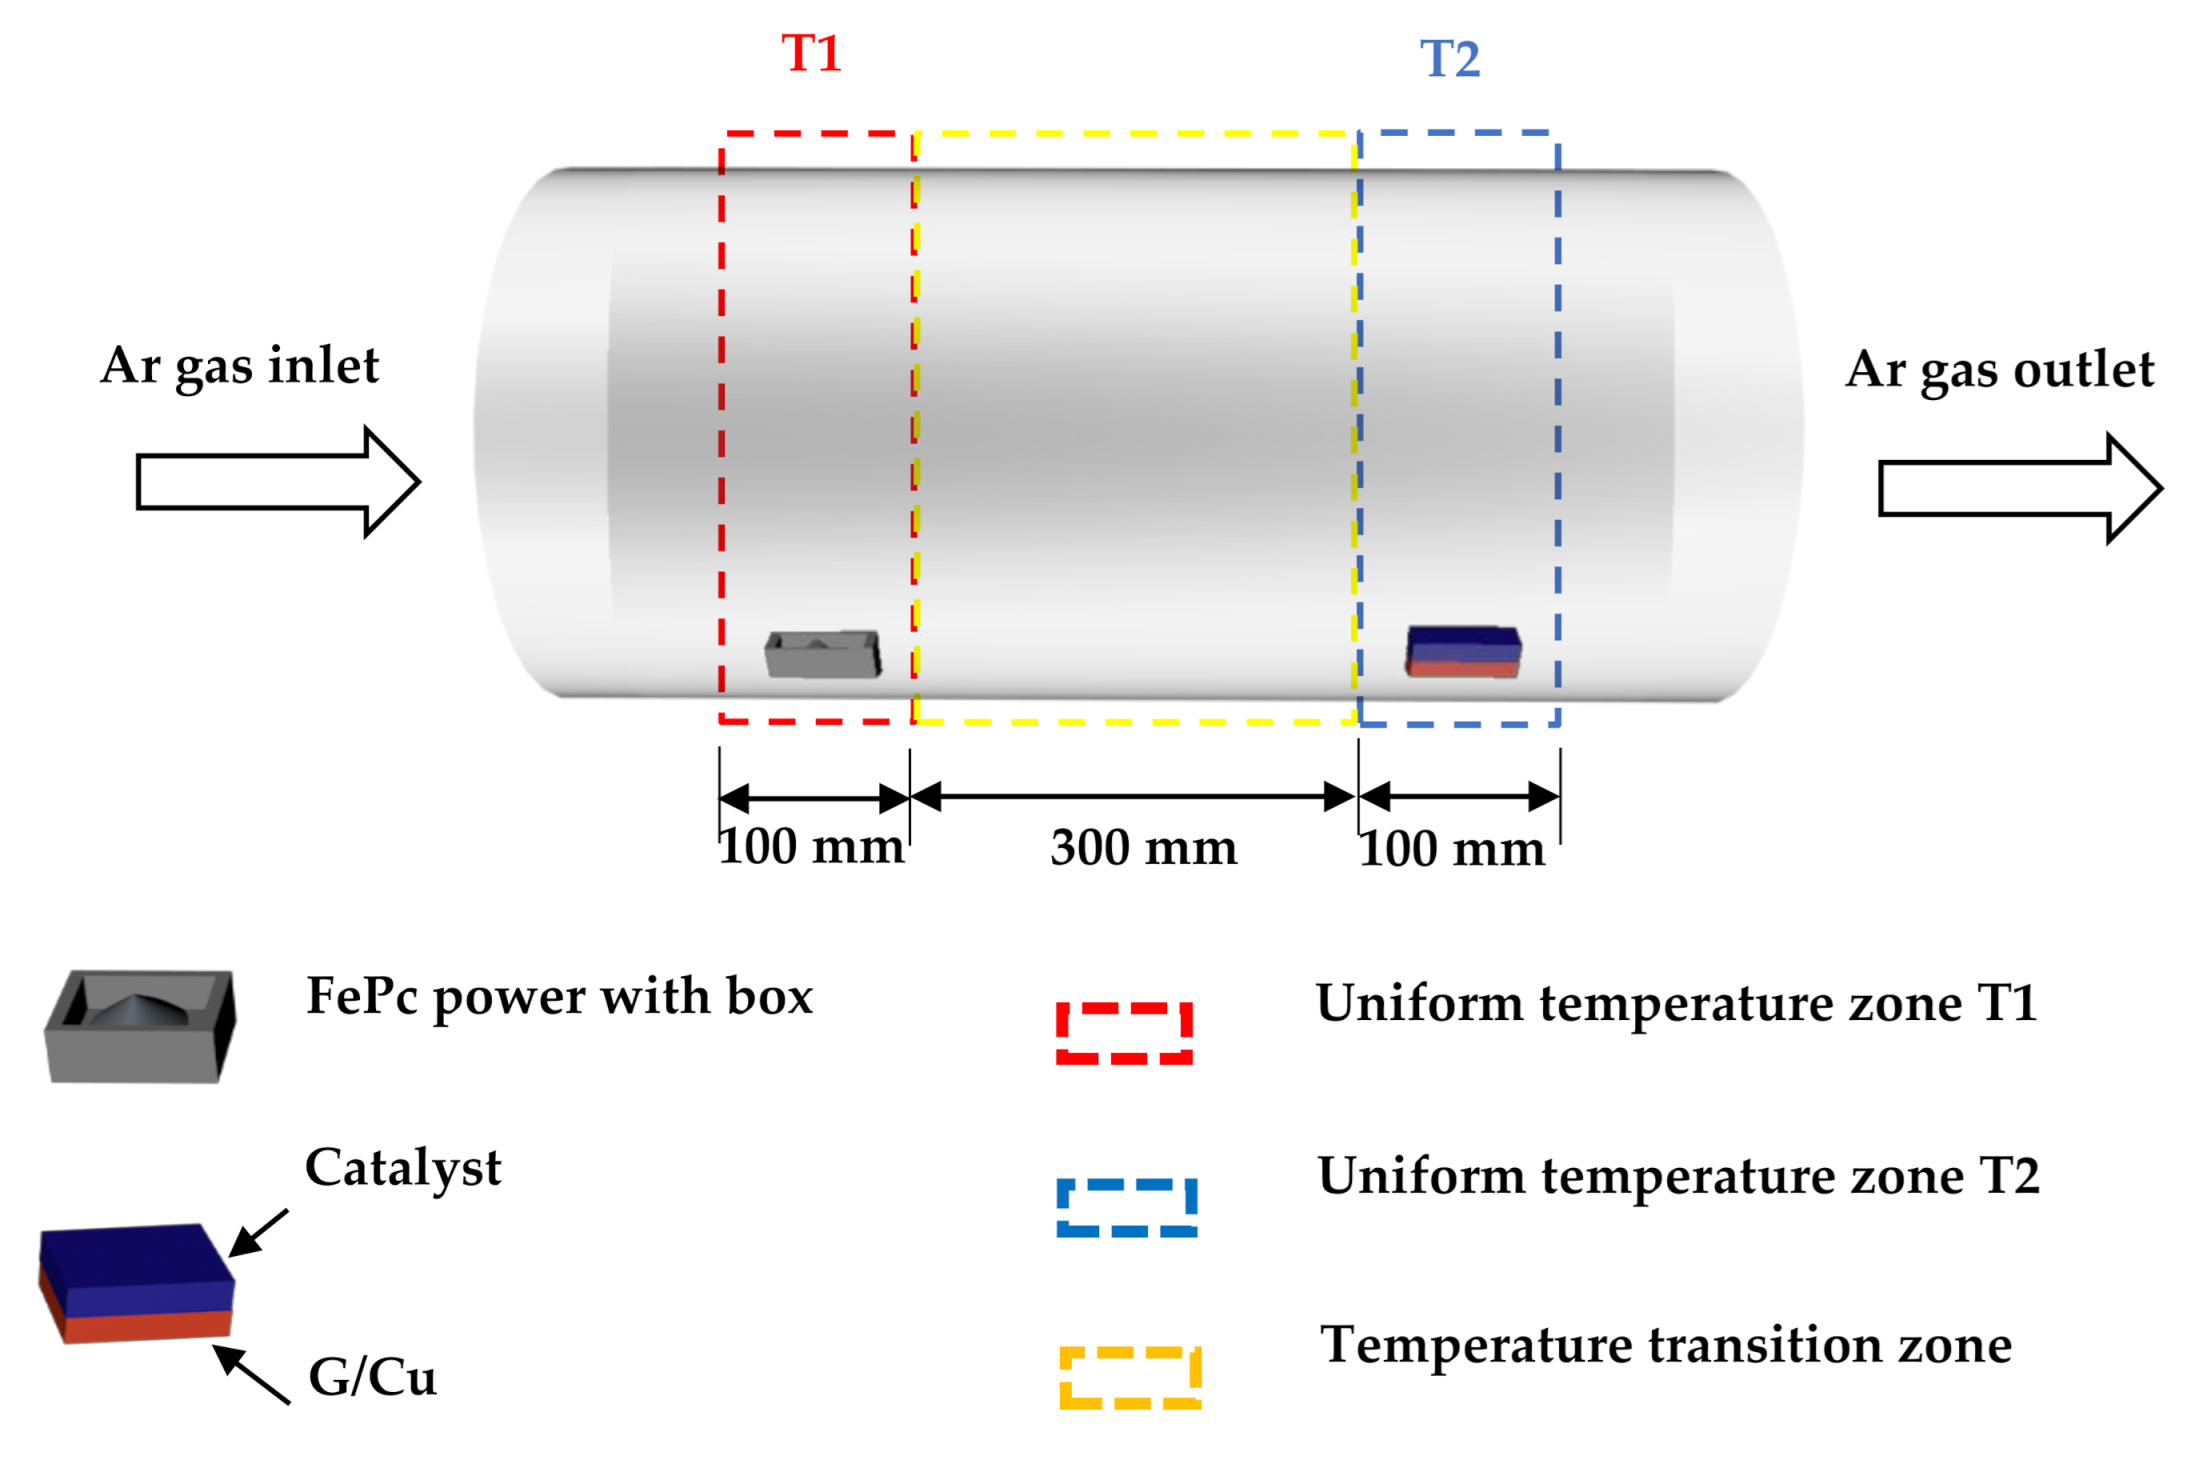
Figure 1. Schematic view of the tube furnace used to synthesize the catalysts.
Processes 09 00109 g001
Figure 2. SEM images of synthesized catalysts with different morphologies: (a) nanogranules; (b) nanofibers; the top (c) and side (d) views of the nanorods.
Processes 09 00109 g002
Figure 3. XRD patterns of FePc powder, as well as Fe–N–C-r, Fe–N–C-g, and Fe–N–C-f catalysts.
Processes 09 00109 g003
Figure 4. (a) TEM image and (b) SAED pattern of the yellow dashed region in (a) for Fe–N–C-r catalyst; (c) HRTEM image of Fe–N–C-r catalyst; (d) HRTEM images of Fe–N–C-f catalyst (the inset is the amplified view).
Processes 09 00109 g004
Figure 5. (a) Raman spectra of Fe–N–C-f catalyst and FePc powders; (b) peak intensity ratio I/I C-C calculated from the data in (a).
Processes 09 00109 g005
Figure 6. XPS spectra of FePc powder and Fe–N–C-f catalyst: (a) survey spectrum; (b) Fe 2p3/2; (c) N 1s; (d) C 1s.
Processes 09 00109 g006
Figure 7. Linear scan voltammetry (LSV) curves of the catalysts with different morphologies, commercial Pt/C catalyst, and FePc powders in O2-saturated 0.1 M KOH solutions.
Processes 09 00109 g007
Figure 8. (a) Thermogravimetric analysis (TGA) curve of FePc powder; (b) ball and stick model of FePc molecule; (c) ball and stick model after getting rid of the H atoms in FePc molecule.
Processes 09 00109 g008
Figure 9. Schematic view of the forming process for the catalysts under different temperature and pressure conditions.
Processes 09 00109 g009
Publisher’s Note: MDPI stays neutral with regard to jurisdictional claims in published maps and institutional affiliations.