Article

Growth and Metabolism of Lacticaseibacillus casei and Lactobacillus kefiri Isolated from Qymyz, a Traditional Fermented Central Asian Beverage

1
Faculty of Biology and Biotechnology, Al-Farabi Kazakh National University, 71 Al-Farabi Av., Almaty 050040, Kazakhstan
2
Qualisud, Univ Montpellier, Avignon Université, CIRAD, Institut Agro, IRD, Université de La Réunion, F-97490 Montpellier, France
3
Antigen Co. Ltd., Almaty Region, 4 Azerbayev Str., Almaty 040905, Kazakhstan
4
CIRAD, UMR Qualisud, F-34398 Montpellier, France
*
Author to whom correspondence should be addressed.
Fermentation 2022, 8(8), 367; https://doi.org/10.3390/fermentation8080367
Submission received: 11 July 2022 / Revised: 26 July 2022 / Accepted: 29 July 2022 / Published: 30 July 2022
(This article belongs to the Special Issue Trends in the Development and Use of Fermented Dairy Products)

Abstract

:
The growth characteristics of two strains of lactic acid bacteria (LAB), Lacticaseibacillus casei and Lactobacillus kefiri, isolated from qymyz, a traditional fermented mare milk beverage, were studied and modeled, including the effect of different carbohydrates, pH, and temperature. Along with population, substrates, and metabolites, lactic acid and ethanol were monitored by HPLC. Growth parameters were obtained from mono- and biphasic logistic growth models that fit the population evolution of L. casei and L. kefiri, respectively. The effect of temperature and pH on the growth rate was represented with the gamma concept model, while the effect of the limiting substrate was evaluated according to the Monod equation. Lastly, a simplified Luedeking and Piret equation was used to represent metabolite production. The optimum values of pH and temperature were 6.69 ± 0.20, 38.63 ± 0.32 °C, 5.93 ± 0.08, and 33.15 ± 0.53 °C, with growth rate values of 0.66 ± 0.01 h−1 and 0.29 ± 0.01 h−1 for L. casei and L. kefiri, respectively. L. casei had a homofermentative pathway, while L. kefiri was heterofermentative, with an ethanol production rate of 2.90 × 10⁻⁹ mg·CFU−1. The Monod model showed that L. casei had the lowest Ks value for lactose, while for L. kefiri, it was the highest among milk carbohydrates. These results show that the population of the two LAB strains and therefore the concentrations of acid and ethanol can be controlled by the fermentation conditions and that our model can help to significantly improve the production of qymyz.

1. Introduction

Fermentation is an ancient process of conservation of animal and plant raw materials in which microorganisms transform perishable foodstuffs into more stable fermented foods. Fermented milk products play an essential role by enhancing not only the stability but also the nutritional and sensorial properties of end-products [1]. In addition, the presence of living microorganisms in the final fermented product may have a positive effect on digestion comfort or nutrient assimilation [2]. Therefore, such products are increasingly demanded by consumers, as they are considered nonhazardous and multifunctional foods. In Central Asia, the growing number of horses and the higher availability of mare milk encourage the improvement of the quality of byproducts obtained from horses for their distribution to the wider population. Qymyz (also known as koumiss or kumis) is a lactic and alcoholic fermented mare milk consumed in Central Asian countries, the production of which includes several steps, such as inoculation, agitation, and incubation. In addition, since it is a traditional drink that has been consumed for centuries for its nutritional and medicinal properties, the production of qymyz helps to safeguard the draft horse breeds of the region.
Initially, and due to a lack of study, the fermentation of mare milk was the result of uncontrolled processes that did not guarantee the quality of the product, leading to sanitary or sensory defects [3]. Indeed, the composition of the microbiota of the initial mare milk is variable and can differ depending on the region and season of qymyz production. The studies available on qymyz revealed that the main microorganisms responsible for the fermentation were lactic acid bacteria (LAB) and yeasts [4]. The authors mainly focused on the identification of microorganisms [3,5,6]. Rakhmanova et al. [3] found 52 lactic acid bacteria and 20 yeasts. Wu et al. [5] stated that LAB played a major role in the sanitary quality of qymyz by decreasing the pH. Yeasts in qymyz produce ethanol and could contribute to production of its typical aroma [7,8]. Lastly, Yao et al. [6] showed that the main LAB of qymyz belonged to the Lactobacillus genus.
Works on qymyz microorganisms’ metabolism, particularly on their acid and alcohol production characteristics, which are important for the control of qymyz sensory quality, are scarce. To our knowledge, only Rakhmanova et al. [3] have studied the effect of fermentation conditions (time and temperature) in cow milk by qymyz strains on the ethanol content and sensory properties. They used an empirical experimental design approach that was useful to provide insights into the effect of fermentation conditions, but that could also be used as a reliable modeling tool to monitor the fermentation conditions. Predictive microbiology is a powerful approach that involves robust mathematical modeling of bacterial growth and metabolite production, and that has been approved as a useful tool for the prevention of food spoilage in Europe and in several non-European countries [9,10]. This approach is also being increasingly used for beneficial microorganisms such as LAB to represent the evolution of functional properties such as acidification power and other functional metabolites, as a function of fermentation conditions [11]. Furthermore, studies on the control of products co-fermented with a number of different microorganisms are still at an early stage, due to the complex interactions between species that influence their growth dynamic and metabolite productions [12,13]. The results of these works are controlled fermentation products that have higher quality and are safer for consumers. A modeling approach can be very useful in identifying the optimal conditions of the microbial growth rate. Models play an essential role in designing and developing strategies to optimize and control biological processes to ensure their economic viability [14]. In multiple culture fermentations, the main challenge is to establish and control the growth conditions so that the desired final ratio of populations of each culture and metabolites is achieved. The main monitored parameters in this regard are temperature, pH, and the inoculation ratio [15]. However, to achieve this goal, important experimental work is needed on the different strains of the product to identify the key fermentation control parameters and characterize their growth as a function of them.
The temperature effect on LAB in qymyz preparation is particularly relevant. Indeed, the usual season of qymyz preparation is summer. However, some farms can produce qymyz from late spring to late fall, by controlling foaling. Consequently, the continental climate of Eurasian countries leads to different temperature conditions, from ~5 °C to ~35 °C, in which qymyz is prepared. Additionally, pasture composition also depends on the seasons, which directly impacts the substrate contents in mare milk available for LAB. The temperature and substrates directly affect the growing rates of LAB and the production rate of their main metabolite, lactic acid, and minor constituents such as ethanol, which affects the quality of qymyz. This results in another puzzle of qymyz preparation according to the preference of consumers, as the main qymyz consumers are practicing Muslims, and a low ethanol level may be preferred. According to Kazakhstani standards, qymyz can be classified as weak, medium, and strong, according to the level of ethanol and lactic acid [16,17].
In this work, we propose the study of two strains of LAB isolated from qymyz. In addition to the description of the growth kinetic of each strain, complete modeling was carried out to capitalize on experimental data and to represent their behavior according to various conditions, with the objective of obtaining better control over qymyz quality.

2. Materials and Methods

2.1. Bacteria Identification

Ten cultures of bacteria isolated from local qymyz in the Almaty region of Kazakhstan were kindly provided by KazNU, Kazakhstan. Identification was performed at the RSE National Center for Biotechnology (Nur-Sultan, Kazakhstan) by sequencing the 16S RNA gene, with the subsequent determination of nucleotide identity. The sequences were deposited in the international GenBank database [18]. Bacteria were stored in MRS broth with 30% glycerol at −80 °C. API 50 CHL (Biomerieux, Marcy-l’Étoile, France) was used to analyze the properties of each strain.

2.2. Growth Medium Composition

All experiments were performed using De Man Rogosa and Sharpe (MRS) broth medium (Biomerieux, Marcy-l’Étoile, France). For experiments that required a change in the carbon source (lactose, galactose, or a different amount of glucose), the MRS composition was kept the same using the following reagents:
Bacto peptone—ThermoFisher, Waltham, MA, USA;
Glucose, galactose, yeast extract, magnesium sulphate, potassium phosphate dibasic, and ammonium citrate dibasic—Sigma-Aldrich, St. Louis, MO, USA;
Lactose, sodium acetate anhydrous, manganese sulphate 1-hydrate, and sodium di-Hydrogen phosphate—Panreac, Barcelona, Spain.

2.3. Growth Experiments

2.3.1. Effect of Temperature

Temperature effect experiments were conducted in Minifor Lambda fermenters (Czech Republic), with a working volume of 800 mL and using an IR radiator to control temperature. Bacteria were grown in temperatures ranging from 5 °C to 50 °C (5, 10, 15, 20, 27, 30, 35, 37, 40, 42, 45, 47, and 50 °C). Bacterial precultures grown overnight were prepared at 35 °C, and the initial population for both bacteria was set at approximately 106 CFU·mL−1. The pH was set to 6.8 and automatically adjusted using sterile 2 M sodium hydroxide for all temperatures. Agitation was set at 240 rpm. MRS broth was used as a medium for the growth of bacteria. Bacterial growth was monitored using an inline near-infrared turbidity sensor (Optek FC20-ASD19-N, Elscolab, Arcueil, France). Fermentations were carried out until reaching stationary phase.

2.3.2. Effect of Carbohydrate Source and pH

These experiments were conducted using Bioscreen C MBR (Labsystems, Helsinki, Finland), which is an automated system that analyzes high-throughput microbial growth curves in aqueous media.
Maximal growth rates at 30 °C at different pH, ranging from 3.5 to 10 (L. casei was grown in pH 4, 5, 6, 6.8, 8, 9, and 10, while L. kefiri in pH 3.5, 4.5, 5.5, 6.5, and 7.5), and with different limiting substrates (glucose, galactose, and lactose), the concentration of which ranged from 0.6 g·L−1 to 60 g·L−1 (0.6, 6, 15, 30, and 60 g·L−1), were calculated using the technique described by Augustin et al. [19].

2.3.3. Plate-Counting Methods for Calibration Curve

The ten-fold serial dilution of homogenized samples (0.1 mL) was prepared in sterile 9 g·L−1 NaCl water and plated on the surface of De Man Rogosa and Sharpe agar plates. The plates were incubated at 37 °C for 48 h. The colony-forming unit (CFU) counting was plotted against the turbidity values given by the fermenter sensor and the optical density at 600 nm (OD600) to obtain the proportionality coefficient.

2.4. Chemical Analyses

The carbohydrate contents and the production of lactic acid and ethanol were measured by HPLC with separation on an Aminex HPX-87H column (Biorad, Hemel Hempstead, UK). Detection was performed using a refractive index detector for the ethanol and carbohydrates, while an ultraviolet (UV) (210 nm) detector was used for lactic acid detection. Aliquots of 20 μL were injected and elution was performed at 30 °C with 5 mM sulfuric acid at a flow rate of 0.6 mL·min−1 [20]. Samples were filtered through a 0.45 µm pore size filter before injection.

2.5. Mathematical Modeling

2.5.1. Microorganism Growth

The logistic growth model [21] with modification to incorporate the second phase was chosen to describe microbial growth according to Equation (1):
ln N t = ln N 0 i f   t λ n 1 n ln N max n ln 1 + N max n N max n 1 1 e μ n t λ n i f   t > λ n
where n is the number of phases of bacterial growth; Nt and Nmax (CFU·mL−1) are the values of the microbial population at time t and at the end of the phase, respectively; µmax is the maximal growth rate (h−1); and λ is the lag time (h).
The gamma concept model [22] was used as a secondary model to describe the impact of temperature and pH on the maximum growth rate ( µ max ) according to Equation (2)
µ max =   µ opt ×   γ T × γ pH
with γ values ranging between 0 and 1.
The effect of the pH on µ max was expressed using the cardinal temperature and pH model (CTPM) proposed by [23], according to Equation (3):
C M n X = X X m i n ; 0 X X m i n n X X m a x X o p t X m i n n 1 X o p t X m i n X X o p t X X m a x n 1 X o p t + X m i n n X X X m a x ; 0
where X corresponds to environmental factors such as pH and temperature, and the n values are 1 for pH and 2 for temperature.

2.5.2. Limiting Substrate

The Monod equation [24] was chosen to relate the growth rates to different limiting substrates:
µ = µ max S Ks + S +   µ max 0
where μ is the specific growth rate, µ max is the maximum specific growth rate, µ max 0 is the maximum specific growth rate in the absence of the limiting substrate, S is the concentration of the limiting substrate for growth, and Ks is the “half-velocity constant”—the value of S when μ/ µ max = 0.5.

2.5.3. Metabolite Production Modeling

The kinetics of metabolite production were set to be directly proportional to bacterial growth, as shown in Equation (5), as a simplification of the Luedeking and Piret equation [20].
d metabolite dt = Y metabolite N × μ N  
where Y (metabolite)/N is the yield for lactic acid and ethanol production over N (the population), and µ is the growth rate.

2.5.4. Model Fitting and Estimation of Model Parameters

Model fitting and the estimation of model parameters were conducted by the least squares minimization technique, using the Solver add-in routine of Microsoft Excel. Standard deviations were calculated using the SolverAid macro of Microsoft Excel. Standard errors of regression lines were calculated using the Data Analysis add-in of Microsoft Excel.

3. Results and Discussion

3.1. Bacterial Identification and General Metabolism Features

The identification of the 10 bacteria isolated from qymyz showed that the majority belonged to the Lactobacillus genus, which is consistent with the findings of Yao et al. [6]. These strains consisted of six Lacticaseibacillus casei strains and one Lactobacillus kefiri strain. In addition, two bacteria were identified as Enterococcus faecium, which can be found in the gastrointestinal tract of humans and animals, and may also be pathogenic [25]. One bacterium was identified as Aneurinibacillus migulanus, which was first discovered in soil and has been found to produce an antibiotic against pathogenic Staphylococcus strains [26].
For further studies, L. casei strain B7 and L. kefiri strain B2 were chosen (Supplemental File). Figures S1 and S2 show locations of strains on phylogenetic tree, while Tables S1 and S2 provide their 16S RNA sequences. L. casei can be found in ripening Cheddar cheese and in Sicilian green olives [27], while L. kefiri is mainly found in beer, kefir drinks, and kefir grains [28]. Both LAB can be found in qymyz [29].
More specifically, L. casei has already been studied in fermented mare milk for its acidity and volatile organic compound production with a predominance of 2-methyl-1-propanol and 2-undecanol [30]. L. kefiri is also called Lentilactobacillus kefiri. The genus Lentilactobacillus is described as comprising species with a slow (lentus) growth rate [31]. The studies on this strain are scarce, and no literature is available about their metabolism. However, this strain is interesting for its ability to survive in gastrointestinal environments and to reduce cholesterol [32].
According to the API 50 CHL test, L. casei was able to consume a wide range of substrates, which included adonitol, galactose, glucose, fructose, mannose, sorbose, rhamnose, mannitol, sorbitol, N-acetyl glucosamine, arbutin, esculin, salicin, cellobiose, maltose, lactose, sucrose, trehalose, inulin, melezitose, B-gentiobiose, D-turanose, D-tagatose, and gluconate. On the other hand, L. kefiri was able to consume only L-arabinose, ribose, galactose, glucose, fructose, maltose, lactose, melibiose, and gluconate, which is consistent with the description of Kandler and Kunath [33].
To compare their growth kinetics, the first set of experiments was carried out on a glucose medium in controlled pH conditions.

3.2. Growth Characteristic of L. casei and L. kefiri

3.2.1. Microorganism Growth Modeling

The primary models fitted the experimental data for both L. casei and L. kefiri (Figure 1) well. L. casei exhibited monophasic growth, while L. kefiri experienced biphasic growth at 37 °C. However, L. kefiri growth could be assumed to be monophasic at temperatures below 15 °C. The specific growth rates were 0.68 h−1 for L. casei and 0.20 h−1 during the first phase and 0.35 h−1 during the second phase for L. kefiri at 37 °C.

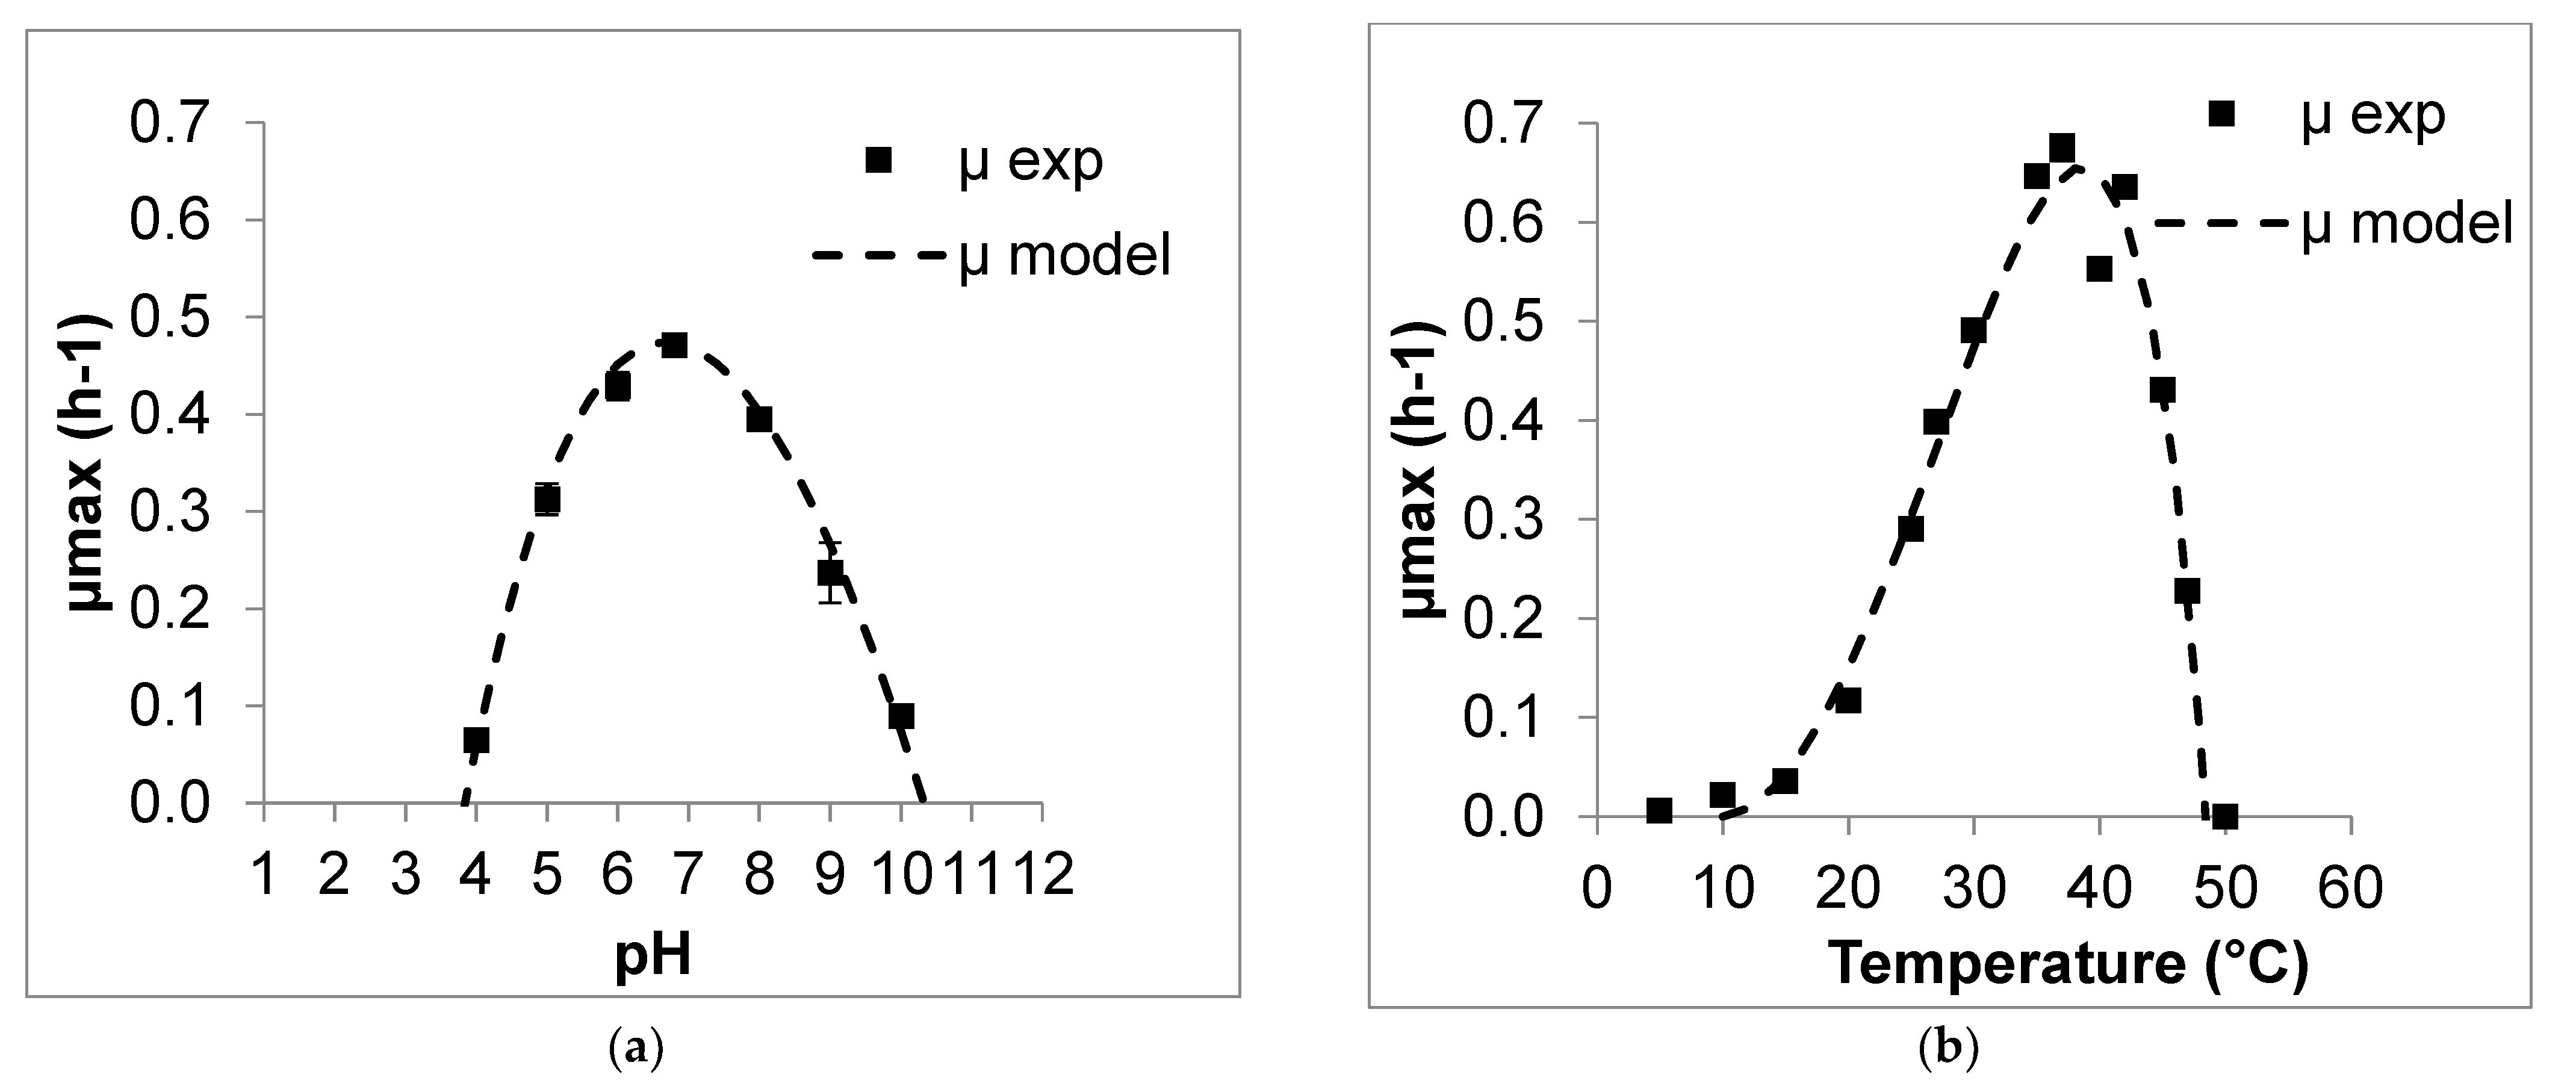
3.2.2. Modeling Effect of pH and Temperature for L. casei

The effect of pH and temperature on the growth rate is presented in Figure 2 for L. casei. The global trends of these effects on µmax are in accordance with the usual bell shape. The results show that the optimal pH and temperature for L. casei equaled 6.69 ± 0.20 and 38.63 ± 0.32 °C, respectively, with a µopt of 0.66 ± 0.01 h−1. The growth rate of L. casei was similar to reports in another study, where two strains of L. casei had a growth rate of 0.7 h−1 [34].

3.2.3. Modeling Effect of pH and Temperature for L. kefiri

L. kefiri had a slower growth rate, and its growth kinetics consisted of two phases (Figure 1). The biphasic growth of LAB could be explained by the ability to consume the end products of the metabolism of the main substrates that can be produced from the strain itself or by other microorganisms [35]. However, in our case, L. kefiri was grown in monoculture and in a medium containing one substrate, which indicates that biphasic growth had other causes.
In particular, the strains of the genus Lentilactobacillus, to which L. kefiri belongs, were reported to be able to consume lactate [31]. The parameters of each phase are given in Table 1. The second phases of the temperatures below 15 °C were not estimated as the differences were negligible. Even though each fermentation was started using ~106 bacteria, only 107 bacteria were detected by the sensor. No growth was observed at 45 °C.
From the table, we can see that the highest growth rate of the second growth phase occurs at 40 °C, while the highest growth rate for the first phase occurs at 30 °C. The change in phase cannot be totally explained by population since the second phase could begin from 3·× 108 to 7·× 108 CFU·mL−1. However, it can be noticed that the second phase began at lower populations in extreme conditions, below 20 °C or higher than 37 °C. For the same conditions, the final population after phase one was lower than that obtained from 27–35 °C. The ratio of µ2/µ1 is also presented in Table 1. The µ of the second phase increased, while the µ of the first phase decreased as a function of the fermentation temperature.
The high growth rate of the second phase at 40 °C was short, as after reaching ~2·× 109 CFU·mL−1 a coagulation of the media was observed, which hindered further detection of population change by the fermenter sensor. The microscopic analysis of the coagulated media revealed a shortening of rods, which, according to [33], is characteristic of L. kefiri, as it has the ability to form short rods (3 nm) or long filaments (15 nm). Morphological change could affect the metabolism of L. kefiri and explain its biphasic growth [36]. Rajoka et al. [37] found that L. kefiri is able to attach to the grain surface in Brazilian kefir and is important for the production of the kefiran polymer present in the kefir grain’s structure, which could explain the coagulation of the media.
Because of its ability to modulate its metabolism depending on the temperature, the growth pattern of L. kefiri can be unpredictable at high temperatures, as shown by the fact that patterns that had no first or second phases were observed in some trials. The parameters of 37 °C fermentation presented in Table 1 are taken from a period of fermentation that had clear first and second phases. Taking into consideration the specifics of morphology and growth in the second phase, pH and temperature effects were modeled only for the first phase of L. kefiri growth. In addition, during the fermentation of qymyz, it is highly probable that only the first phase may be expressed due to its global lower fermentation rate (Figure 1). The effect of pH and temperature on the first phase of L. kefiri can be seen in Figure 3.
The results show that the optimal pH and temperature for L. kefiri equaled 5.93 ± 0.08 and 33.15 ± 0.53 °C, respectively, with a µopt of 0.29 ± 0.01 h−1. No data on the growth rate of L. kefiri were found in the literature. However, all the results on LAB are consistent with the works of Rakhmanova et al. [3], who found that the optimal fermentation parameters for the maximum score of the sensory evaluation are a fermentation temperature of 36 °C, and a fermentation time of 16 h, which is consistent with Figure 1.

3.3. Metabolite Production

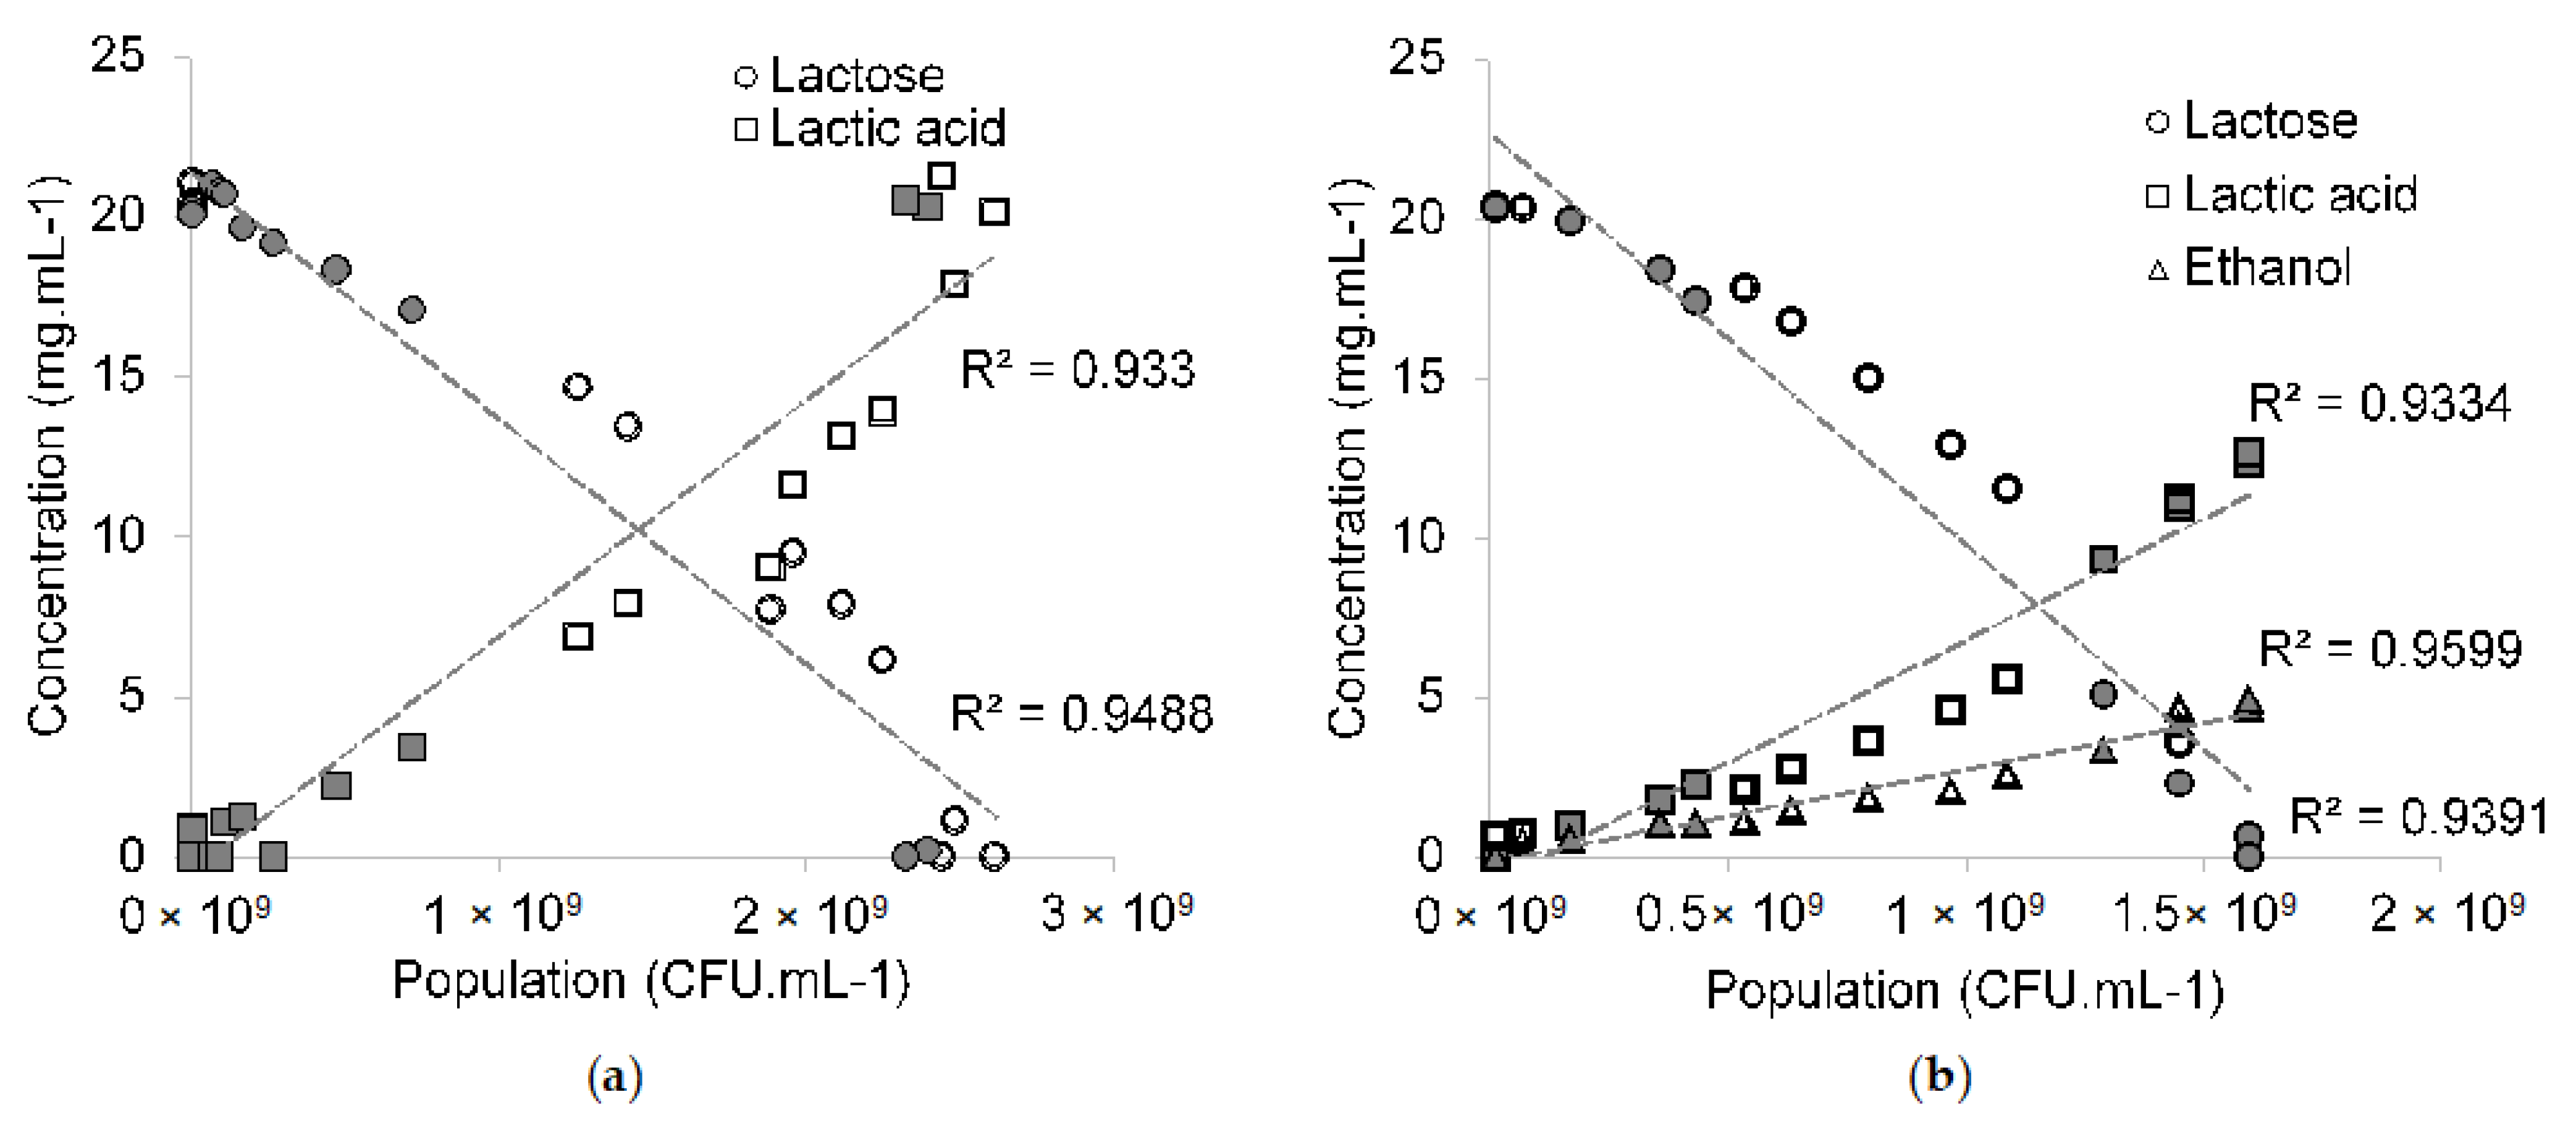
Lactic acid and ethanol were the main metabolites produced by L. casei and L. kefiri. Their production, monitored by HPLC, is plotted against population in Figure 4. Lactose was chosen as a carbon source because it is the main carbohydrate in milk. Our results show that L. casei and L. kefiri have opposite fermentation routes. L. casei has a homofermentative pathway, while L. kefiri has a heterofermentative pathway.
The lactic acid production rate was 7.36 ×·10−9 mg·CFU−1 for L. casei. For L. kefiri, the lactic production rate was 7.64·× 10−9 mg·CFU−1, while the ethanol production rate was 2.90·× 10−9 mg·CFU−1.

3.4. Resulting Parameters of Models

The model parameters of Lacticaseibacillus casei and Lactobacillus kefiri are given in Table 2.
The Monod model values were hard to obtain, as there was growth in the media that did not contain any milk carbohydrates. As can be seen from the table, L. casei has the highest growth rate and Ks values in glucose. L. kefiri, on the other hand, has similar growth rates in all media, but its Ks value is the highest for lactose. These results show that L. casei, after breaking down lactose, first consumes galactose and then glucose, while for L. kefiri there is not much preference between glucose and galactose.

4. Conclusions

Qymyz is a mare milk fermented with LAB and yeasts. LAB enable yeast metabolism as the main yeast in qymyz does not metabolize the lactose but glucose and galactose, produced thanks to the LAB beta galactosidases [38]. Towards the later stages of fermentation, when the acidity of qymyz becomes very high, only the most acid-tolerant bacteria and (most probably) yeasts can survive.
Our results showed that L. casei had, in general, a faster growth rate than L. kefiri. Temperature-wise, L. casei prefers higher temperatures of around 38 °C, while L. kefiri prefers different temperatures during its two phases, with 33 °C being the optimal temperature for the first phase. The rate of the second phase was negligible below 20 °C but increased significantly with temperature, surpassing that of the first phase to 37 °C, but only after ~35+ hours. Therefore, during qymyz production, it is more probable that L. kefiri only expresses its first growth phase. The optimal pH of L. kefiri was slightly lower than L. casei. They also had opposite fermentation pathways: L. casei had a homofermentative pathway, while L. kefiri was heterofermentative.
These results are helpful in identifying which conditions should be used when preparing qymyz. The differences between these species will help in the preparation of starters for different purposes. L. casei could be used to reduce the alcohol content of qymyz, while the slow growth rate of L. kefiri could be beneficial in slowing down the yeast fermentation and thus enabling a more balanced qymyz in terms of lactic acid and ethanol. However, after a long storage period, the final product could reach a higher ethanol content as both L. kefiri and yeast will increase the ethanol content. L. casei is a homofermentative bacteria, so only yeast will be responsible for an ethanol increase. The results show that it is more optimal for L. kefiri to be grown with lactose-fermenting yeasts as its growth rate will delay the growth of lactose nonfermenting yeasts. L. casei can compete with lactose-fermenting yeasts for lactose, so its growth with lactose non-fermenting yeasts could be optimal. Speaking of optimal conditions, it has to be noted that industrial production often requires suboptimal temperatures to reduce production costs. In which case, optimal balance should be found between fermentation temperature and fermentation duration to achieve the desired qymyz quality.
To conclude, by studying the growth and metabolism kinetics of two different LAB of qymyz, this paper provides insights into qymyz fermentation monitoring. Strategies to modulate the final qymyz quality rely not only on the choice of lactic acid bacteria, but also on yeast strains. Modeling both yeast and bacteria will facilitate understanding of the interaction between these microorganisms. For example, growth according to the model in a co-culture implies no interaction between microorganisms. In contrast, a decrease or increase in growth rate or metabolite production indicates inhibition or stimulation between microorganisms. As a result, this work is the first step in qymyz fermentation modeling. Additionally, the second phase of L. kefiri growth still requires further study. The effect of medium coagulation on qymyz quality in the long term is unknown.

Supplementary Materials

The following supporting information can be downloaded at: https://www.mdpi.com/article/10.3390/fermentation8080367/s1, Figure S1: B2 (2_antigen) location on phylogenetic tree; Figure S2: B7 (7_antigen) location on phylogenetic tree; Table S1: B2—16S RNA sequence and BLAST identification results; and Table S2: B7—16S RNA sequence and BLAST identification results.

Author Contributions

Conceptualization, G.K. and G.L.; methodology, G.L., J.G. and C.S.; validation, C.M., N.A. and G.K.; formal analysis, A.K., C.M. and N.A.; investigation, A.K., J.G. and M.M.; data curation, A.K., C.M., J.G. and N.A.; writing—original draft preparation, A.K.; writing—review and editing, G.K., G.L., C.S. and N.A.; supervision, G.K., C.S., G.L., C.M., J.G., S.A. and N.A. All authors have read and agreed to the published version of the manuscript.

Funding

This research received no external funding.

Informed Consent Statement

Not applicable.

Data Availability Statement

Not applicable.

Acknowledgments

The work was supported by the Abaï-Verne joint program of the Ministry of Education and Science of the Republic of Kazakhstan and the French Ministry for Europe and Foreign Affairs. We also thank A. Baubekova from KazNU, Almaty, for providing the bacterial strains.

Conflicts of Interest

The authors declare no conflict of interest.

References

  1. Rizzoli, R.; Biver, E. Effects of fermented milk products on bone. Calcif. Tissue Int. 2018, 102, 489–500. [Google Scholar] [CrossRef]
  2. Beena Divya, J.; Kulangara Varsha, K.; Madhavan Nampoothiri, K.; Ismail, B.; Pandey, A. Probiotic fermented foods for health benefits. Eng. Life Sci. 2012, 12, 377–390. [Google Scholar] [CrossRef]
  3. Rakhmanova, A.; Wang, T.; Xing, G.; Ma, L.; Hong, Y.; Lu, Y.; Xin, L.; Xin, W.; Zhu, Q.; Lü, X. Isolation and identification of microorganisms in Kazakhstan koumiss and their application in preparing cow-milk koumiss. J. Dairy Sci. 2021, 104, 151–166. [Google Scholar] [CrossRef] [PubMed]
  4. Ishii, S.; Hosino, B.; Komiyama, H.; Uehara, A.; Nurtazin, S. Study on Production and Properties of Kumiss of Herders in Mongolian Dry Steppe. J. Arid Land Stud. 2014, 24, 3. [Google Scholar]
  5. Wu, Y.; Li, Y.; Gesudu, Q.; Zhang, J.; Sun, Z.; Halatu, H.; Menghe, B.; Liu, W. Bacterial composition and function during fermentation of Mongolia koumiss. Food Sci. Nutr. 2021, 9, 4146–4155. [Google Scholar] [CrossRef] [PubMed]
  6. Yao, G.; Yu, J.; Hou, Q.; Hui, W.; Liu, W.; Kwok, L.-Y.; Menghe, B.; Sun, T.; Zhang, H.; Zhang, W. A Perspective Study of Koumiss Microbiome by Metagenomics Analysis Based on Single-Cell Amplification Technique. Front. Microbiol. 2017, 8, 165. [Google Scholar] [CrossRef] [PubMed] [Green Version]
  7. Dzialo, M.C.; Park, R.; Steensels, J.; Lievens, B.; Verstrepen, K.J. Physiology, ecology and industrial applications of aroma formation in yeast. FEMS Microbiol. Rev. 2017, 41, S95–S128. [Google Scholar] [CrossRef] [PubMed] [Green Version]
  8. Mu, Z.; Yang, X.; Yuan, H. Detection and identification of wild yeast in Koumiss. Food Microbiol. 2012, 31, 301–308. [Google Scholar] [CrossRef]
  9. Leporq, B.; Membré, J.-M.; Dervin, C.; Buche, P.; Guyonnet, J. The “Sym’Previus” software, a tool to support decisions to the foodstuff safety. Int. J. Food Microbiol. 2005, 100, 231–237. [Google Scholar] [CrossRef]
  10. Sumner, J.; Krist, K. The use of predictive microbiology by the Australian meat industry. Int. J. Food Microbiol. 2002, 73, 363–366. [Google Scholar] [CrossRef] [Green Version]
  11. Leroy, F.; Degeest, B.; De Vuyst, L. A novel area of predictive modelling: Describing the functionality of beneficial microorganisms in foods. Int. J. Food Microbiol. 2002, 73, 251–259. [Google Scholar] [CrossRef]
  12. Kouamé, C.; Loiseau, G.; Grabulos, J.; Boulanger, R.; Mestres, C. Development of a model for the alcoholic fermentation of cocoa beans by a Saccharomyces cerevisiae strain. Int. J. Food Microbiol. 2021, 337, 108917. [Google Scholar] [CrossRef]
  13. Mestres, C.; Munanga, B.d.J.C.; Grabulos, J.; Loiseau, G. Modeling mixed fermentation of gowé using selected Lactobacillus plantarum and Pichia kluyveri strains. Food Microbiol. 2019, 84, 103242. [Google Scholar] [CrossRef]
  14. Infantes, D.; del Campo, A.G.; Villaseñor, J.; Fernández, F. Kinetic model and study of the influence of pH, temperature and undissociated acids on acidogenic fermentation. Biochem. Eng. J. 2012, 66, 66–72. [Google Scholar] [CrossRef]
  15. Béal, C.; Spinnler, H.E.; Corrieu, G. Comparison of growth, acidification and productivity of pure and mixed cultures of Streptococcus salivarius subsp. thermophilus 404 and Lactobacillus delbrueckii subsp. bulgaricus 398. Appl. Microbiol. Biotechnol. 1994, 41, 95–98. [Google Scholar] [CrossRef]
  16. Committee for Standardization, Metrology and Certification of the Ministry of Energy, Industry and Trade of the Republic of Kazakhstan. ST RK 1004-98. In Natural koumiss. Specifications; SMCC: Almaty, Kazakhstan, 1999. [Google Scholar]
  17. Kondybayev, A.; Loiseau, G.; Achir, N.; Mestres, C.; Konuspayeva, G. Fermented mare milk product (Qymyz, Koumiss). Int. Dairy J. 2021, 119, 105065. [Google Scholar] [CrossRef]
  18. Clarridge, J.E., 3rd. Impact of 16S rRNA gene sequence analysis for identification of bacteria on clinical microbiology and infectious diseases. Clin. Microbiol. Rev. 2004, 17, 840–862. [Google Scholar] [CrossRef] [Green Version]
  19. Augustin, J.-C.; Rosso, L.; Carlier, V. Estimation of temperature dependent growth rate and lag time of Listeria monocytogenes by optical density measurements. J. Microbiol. Methods 1999, 38, 137–146. [Google Scholar] [CrossRef]
  20. Munanga, B.D.J.C.; Loiseau, G.; Grabulos, J.; Mestres, C. Modeling Lactic Fermentation of Gowé Using Lactobacillus Starter Culture. Microorganisms 2016, 4, 44. [Google Scholar] [CrossRef] [Green Version]
  21. Delhalle, L.; Daube, G.; Adolphe, Y.; Crevecoeur, S.; Clinquart, A. Les modèles de croissance en microbiologie prévisionnelle pour la maitrise de la sécurité des aliments (synthèse bibliographique). Biotechnol. Agron. Soc. Environ. 2012, 16, 13. [Google Scholar]
  22. Zwietering, M.H.; Wijtzes, T.; Rombouts, F.M.; Riet, K. A decision support system for prediction of microbial spoilage in foods. J. Ind. Microbiol. 1993, 12, 324–329. [Google Scholar] [CrossRef]
  23. Rosso, L.; Lobry, J.R.; Bajard, S.; Flandrois, J.P. Convenient Model to Describe the Combined Effects of Temperature and pH on Microbial Growth. Appl. Environ. Microbiol. 1995, 61, 610–616. [Google Scholar] [CrossRef] [Green Version]
  24. Monod, J. The growth of bacterial cultures. Annu. Rev. Microbiol. 1949, 3, 371–394. [Google Scholar] [CrossRef] [Green Version]
  25. Willems, R.J.; Top, J.; Marga van Santen, D.; Coque, T.M.; Baquero, F.; Grundmann, H.; Bonten, M.J. Global spread of vancomycin-resistant Enterococcus faecium from distinct nosocomial genetic complex. Emerg. Infect. Dis. 2005, 11, 821. [Google Scholar] [CrossRef] [PubMed]
  26. Berditsch, M.; Afonin, S.; Ulrich, A.S. The ability of Aneurinibacillus migulanus (Bacillus brevis) to produce the antibiotic gramicidin S is correlated with phenotype variation. Appl. Environ. Microbiol. 2007, 73, 6620–6628. [Google Scholar] [CrossRef] [PubMed] [Green Version]
  27. Lorenzo, J.M.; Munekata, P.E.; Dominguez, R.; Pateiro, M.; Saraiva, J.A.; Franco, D. Main Groups of Microorganisms of Relevance for Food Safety and Stability. In Innovative Technologies for Food Preservation; Elsevier: Amsterdam, The Netherlands, 2018; pp. 53–107. [Google Scholar]
  28. Ibrahim, S.A. Lactic Acid Bacteria: Lactobacillus spp.: Other Species. In Reference Module in Food Science; Elsevier: Amsterdam, The Netherlands, 2016. [Google Scholar]
  29. Alexandraki, V.; Kazou, M.; Angelopoulou, A.; Arena, M.P.; Capozzi, V.; Russo, P.; Fiocco, D.; Spano, G.; Papadimitriou, K.; Tsakalidou, E. Chapter 6—The Microbiota of Non-cow Milk and Products. In Non-Bovine Milk and Milk Products; Tsakalidou, E., Papadimitriou, K., Eds.; Academic Press: San Diego, CA, USA, 2016; pp. 117–159. [Google Scholar]
  30. Baubekova, A.; Akhmetsadykova, S.; Kondybayev, A.; Faye, B.; Konuspayeva, G. Volatile organic compounds profile of Lactobacillus casei and Streptococcus thermophilus in fermented mare milk of Kazakhstan. Int. J. Biol. Chem. 2018, 11, 28–35. [Google Scholar] [CrossRef]
  31. Zheng, J.; Wittouck, S.; Salvetti, E.; Franz, C.M.A.P.; Harris, H.M.B.; Mattarelli, P.; O’Toole, P.W.; Pot, B.; Vandamme, P.; Walter, J.; et al. A taxonomic note on the genus Lactobacillus: Description of 23 novel genera, emended description of the genus Lactobacillus Beijerinck 1901, and union of Lactobacillaceae and Leuconostocaceae. Int. J. Syst. Evol. Microbiol. 2020, 70, 2782–2858. [Google Scholar] [CrossRef]
  32. Kim, D.-H.; Jeong, D.; Kang, I.-B.; Kim, H.; Song, K.-Y.; Seo, K.-H. Dual function of Lactobacillus kefiri DH5 in preventing high-fat-diet-induced obesity: Direct reduction of cholesterol and upregulation of PPAR-α in adipose tissue. Mol. Nutr. Food Res. 2017, 61, 1700252. [Google Scholar] [CrossRef]
  33. Kandler, O.; Kunath, P. Lactobacillus kefir sp.nov., a component of the microflora of Kefir. Syst. Appl. Microbiol. 1983, 4, 286–294. [Google Scholar] [CrossRef]
  34. Alvarez, M.M.; Aguirre-Ezkauriatza, E.J.; Ramírez-Medrano, A.; Rodríguez-Sánchez, Á. Kinetic analysis and mathematical modeling of growth and lactic acid production of Lactobacillus casei var. rhamnosus in milk whey. J. Dairy Sci. 2010, 93, 5552–5560. [Google Scholar] [CrossRef]
  35. Møller, C.O.d.A.; Christensen, B.B.; Rattray, F.P. Modelling the biphasic growth of non-starter lactic acid bacteria on starter-lysate as a substrate. Int. J. Food Microbiol. 2021, 337, 108937. [Google Scholar] [CrossRef]
  36. Shen, J.-P.; Chou, C.-F. Morphological plasticity of bacteria—Open questions. Biomicrofluidics 2016, 10, 031501. [Google Scholar] [CrossRef] [Green Version]
  37. Rajoka, M.S.R.; Mehwish, H.M.; Fang, H.; Padhiar, A.A.; Zeng, X.; Khurshid, M.; He, Z.; Zhao, L. Characterization and anti-tumor activity of exopolysaccharide produced by Lactobacillus kefiri isolated from Chinese kefir grains. J. Funct. Foods 2019, 63, 103588. [Google Scholar] [CrossRef]
  38. Montanari, G.; Zambonelli, C.; Grazia, L.; Kamesheva, G.K.; Shigaeva, M.K. Saccharomyces unisporus as the principal alcoholic fermentation microorganism of traditional koumiss. J. Dairy Res. 1996, 63, 327. [Google Scholar] [CrossRef]
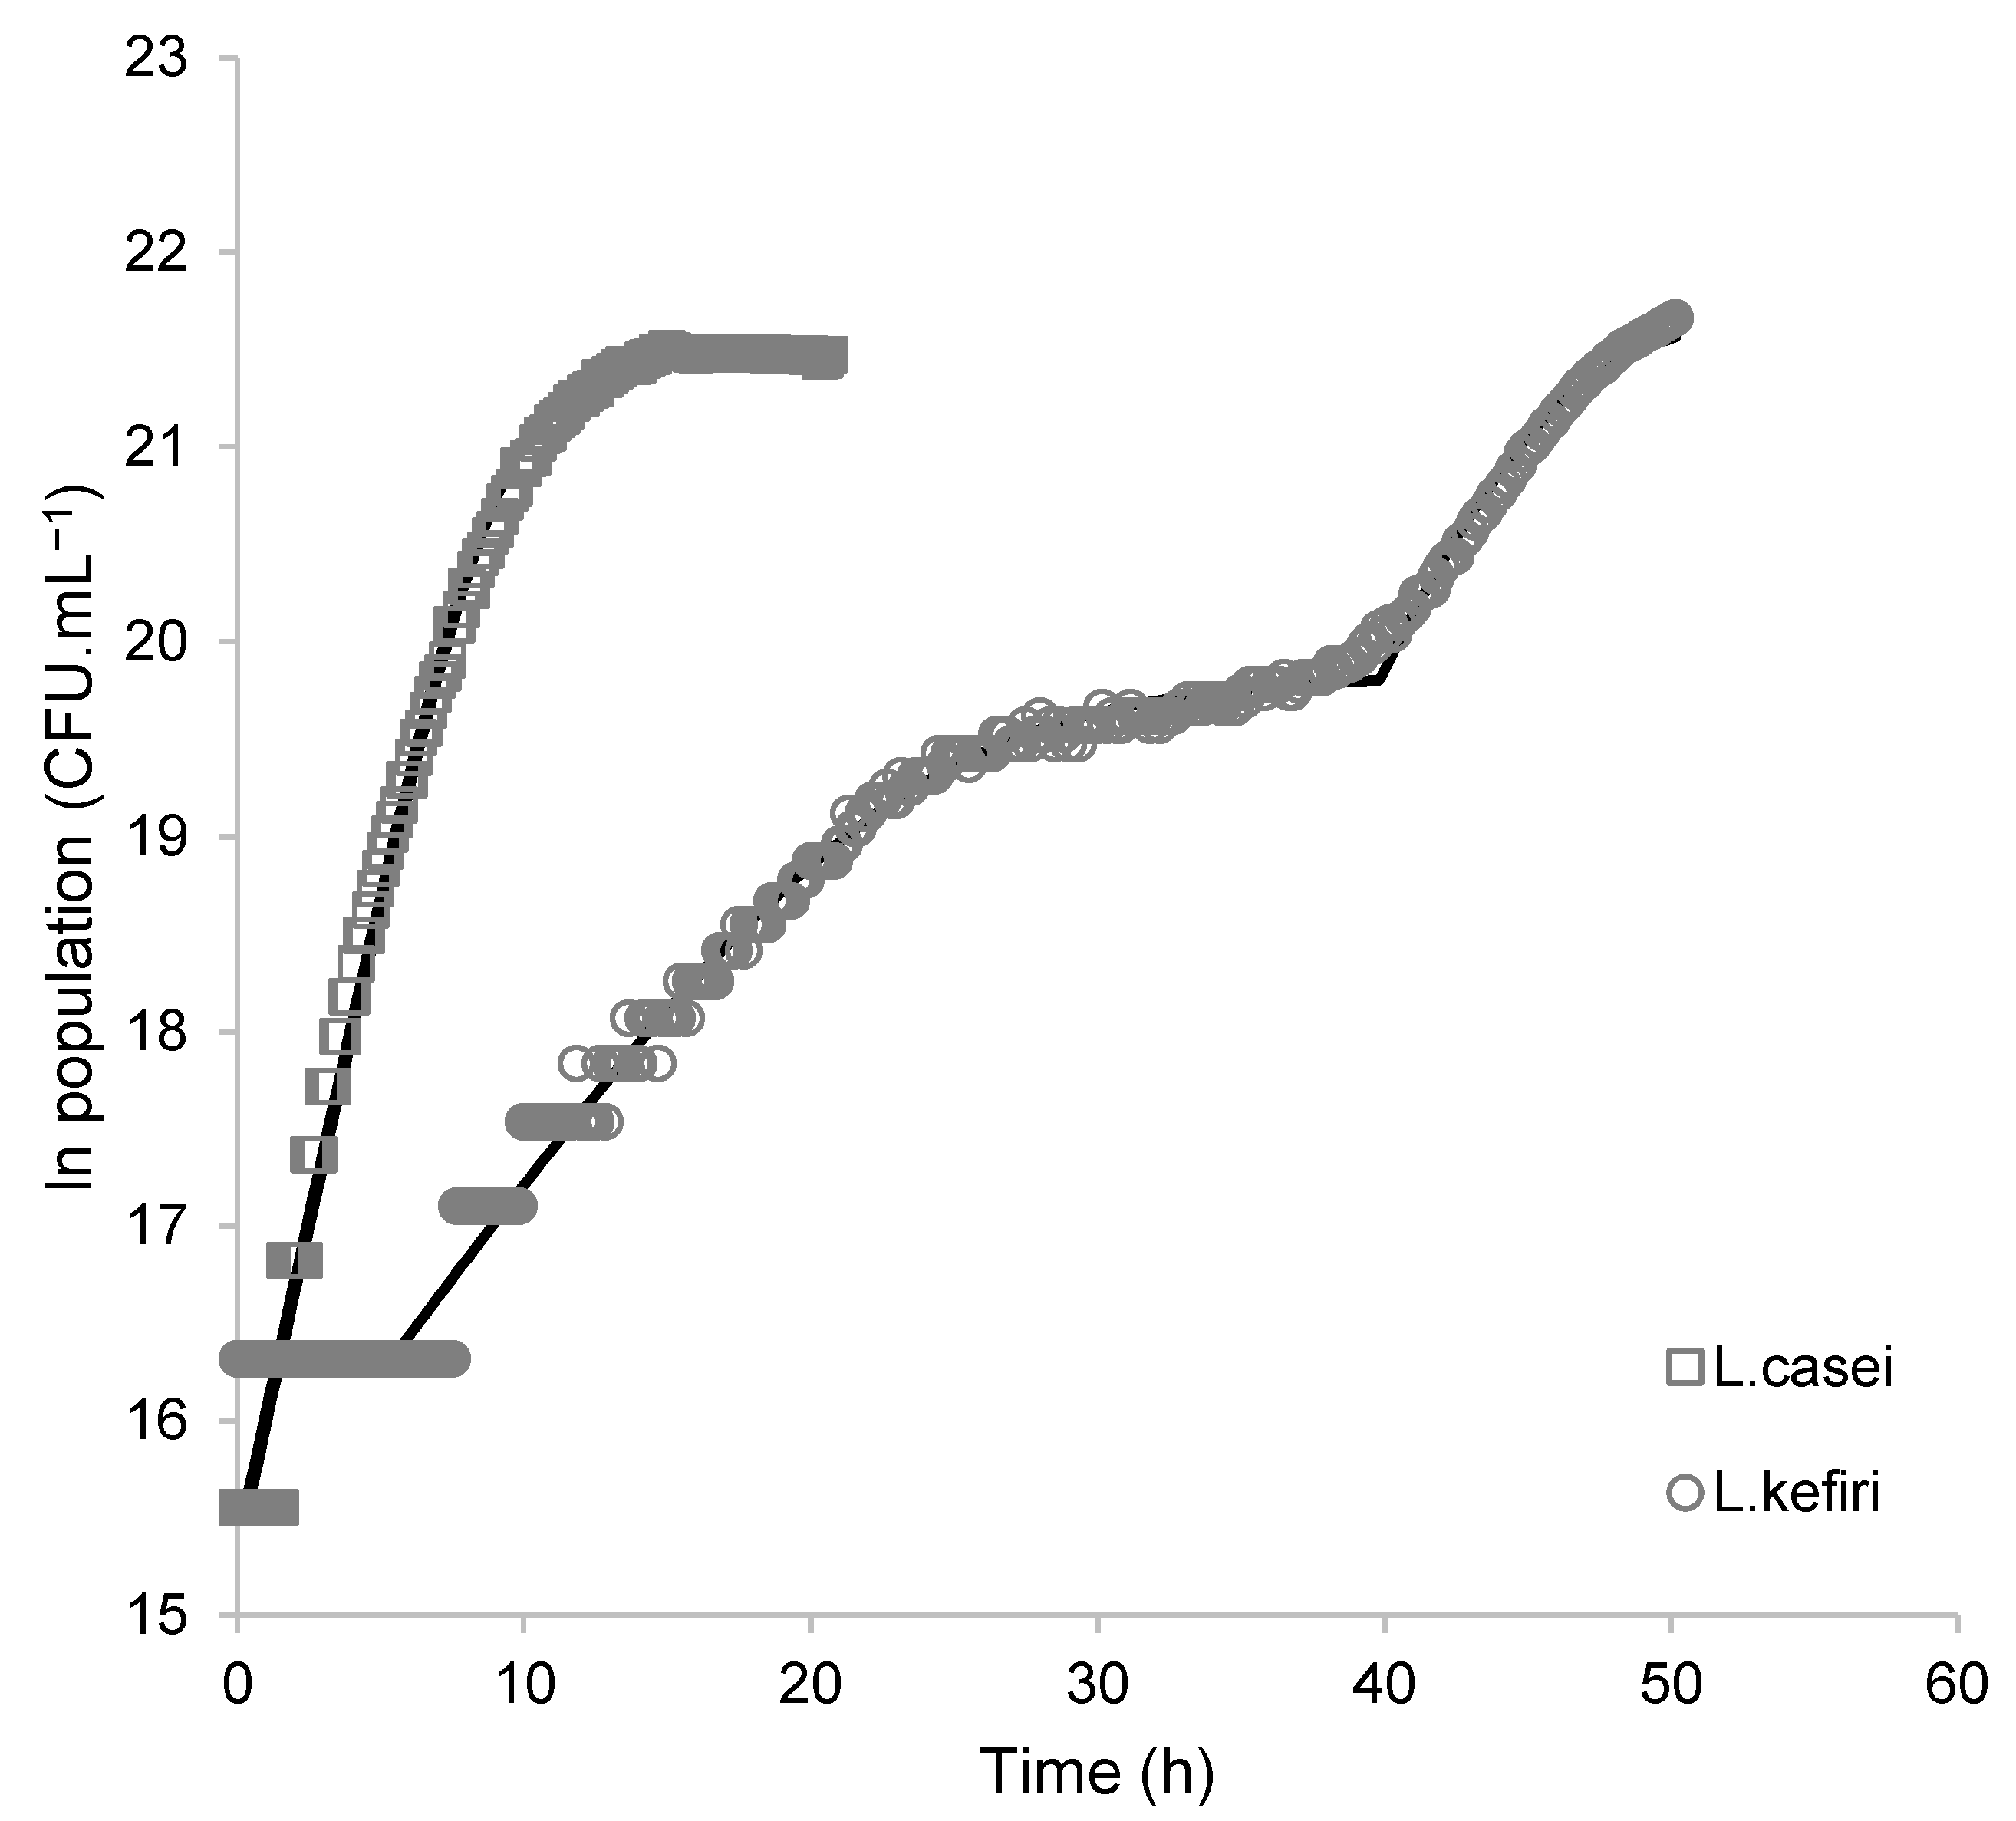
Figure 1. Growth of L. kefiri and L. casei in glucose MRS broth at 37 °C, pH 6.8. Experimental data (symbols) and predicted data (continuous lines).
Fermentation 08 00367 g001
Figure 2. Effect of environmental factors on growth rate of L. casei in glucose MRS broth. (a) pH at 30 °C and (b) temperature. Experimental data (symbols) and predicted data (dashed lines).
Fermentation 08 00367 g002
Figure 3. Effect of environmental factors on first-phase growth rate of L. kefiri in glucose MRS broth. (a) pH at 30 °C and (b) temperature. Experimental data (symbols) and predicted data (dashed lines).
Fermentation 08 00367 g003
Figure 4. Change in products during fermentation of (a) L. casei and (b) L. kefiri in lactose MRS broth at different temperatures. L. casei—25 °C; 37 °C (shaded symbols). L. kefiri—30 °C; 38 °C (shaded symbols).
Fermentation 08 00367 g004
Table 1. Parameters of two phases of L. kefiri growth at different temperatures.
Temperature
(°C)
Phase 1Phase 2µ2/µ1
λ (h)µmax (h−1)Nmax (CFU·mL−1)λ hµmax (h−1)Nmax (CFU·mL−1)
2026.30 ± 0.380.08 ± 0.013.83·× 10855.17 ± 0.010.02 ± 0.009·× 1080.28
2710.55 ± 0.090.20 ± 0.016.10·× 10844.33 ± 0.010.03 ± 0.001.32·× 1090.15
301.91 ± 0.080.25 ± 0.017.60·× 10828.66 ± 0.010.07 ± 0.011.32·× 1090.28
353.69 ± 0.090.23 ± 0.017.16·× 10835.83 ± 0.010.07 ± 0.011.60·× 1090.30
3711.57 ± 0.110.20 ± 0.014.10·× 10846.09 ± 0.100.35 ± 0.012.67·× 1091.75
400.00 ± 0.000.16 ± 0.013.28·× 10842.49 ± 0.470.64 ± 0.201.19·× 1094.00
Values are expressed as mean ± S.D. λ—lag phase duration; µmax (h−1)—growth rate.
Table 2. Model parameters according to growth model, Monod equation, and Luedeking–Piret equation.
ParametersLacticaseibacillus casei
(Value ± SD/SE)
1st Phase of Lactobacillus kefiri
(Value ± SD/SE)
pH min3.84 ± 0.123.35 ± 0.12
pH max10.33 ± 0.187.64 ± 0.05
pH opt6.69 ± 0.205.93 ± 0.08
T min (°C)9.66 ± 1.188.10 ± 1.27
T max (°C)48.48 ± 0.1344.94 ± 0.31
T opt (°C)38.63 ± 0.3233.15 ± 0.53
µopt (h−1)0.66 ± 0.010.29 ± 0.01
Glucose µopt (h−1)0.49 ± 0.010.26 ± 0.01
Glucose Ks (g L−1)0.43 ± 0.070.21 ± 0.03
Galactose µopt (h−1)0.47 ± 0.010.27 ± 0.01
Galactose Ks (g L−1)0.19 ± 0.050.18 ± 0.05
Lactose µopt (h−1)0.43 ± 0.010.24 ± 0.01
Lactose Ks (g L−1)0.12 ± 0.040.72 ± 0.57
Lactic Acid Production *
(10−9 mg·CFU−1)
7.36 ± 0.437.64 ± 0.54
Ethanol Production*
(10−9 mg·CFU−1)
0 2.90 ± 0.15
pH and temperature parameters were obtained in MRS broth containing glucose as carbon source. * Values are expressed as mean ± S.E.
Publisher’s Note: MDPI stays neutral with regard to jurisdictional claims in published maps and institutional affiliations.