
Seasonal Changes in Performance Metrics, Hormonal, Hematological, and Biochemical Markers Among Semi-Professional Soccer Players: Implications for Training and Recovery

 , ,
, ,
Abstract
:1. Introduction
2. Materials and Methods
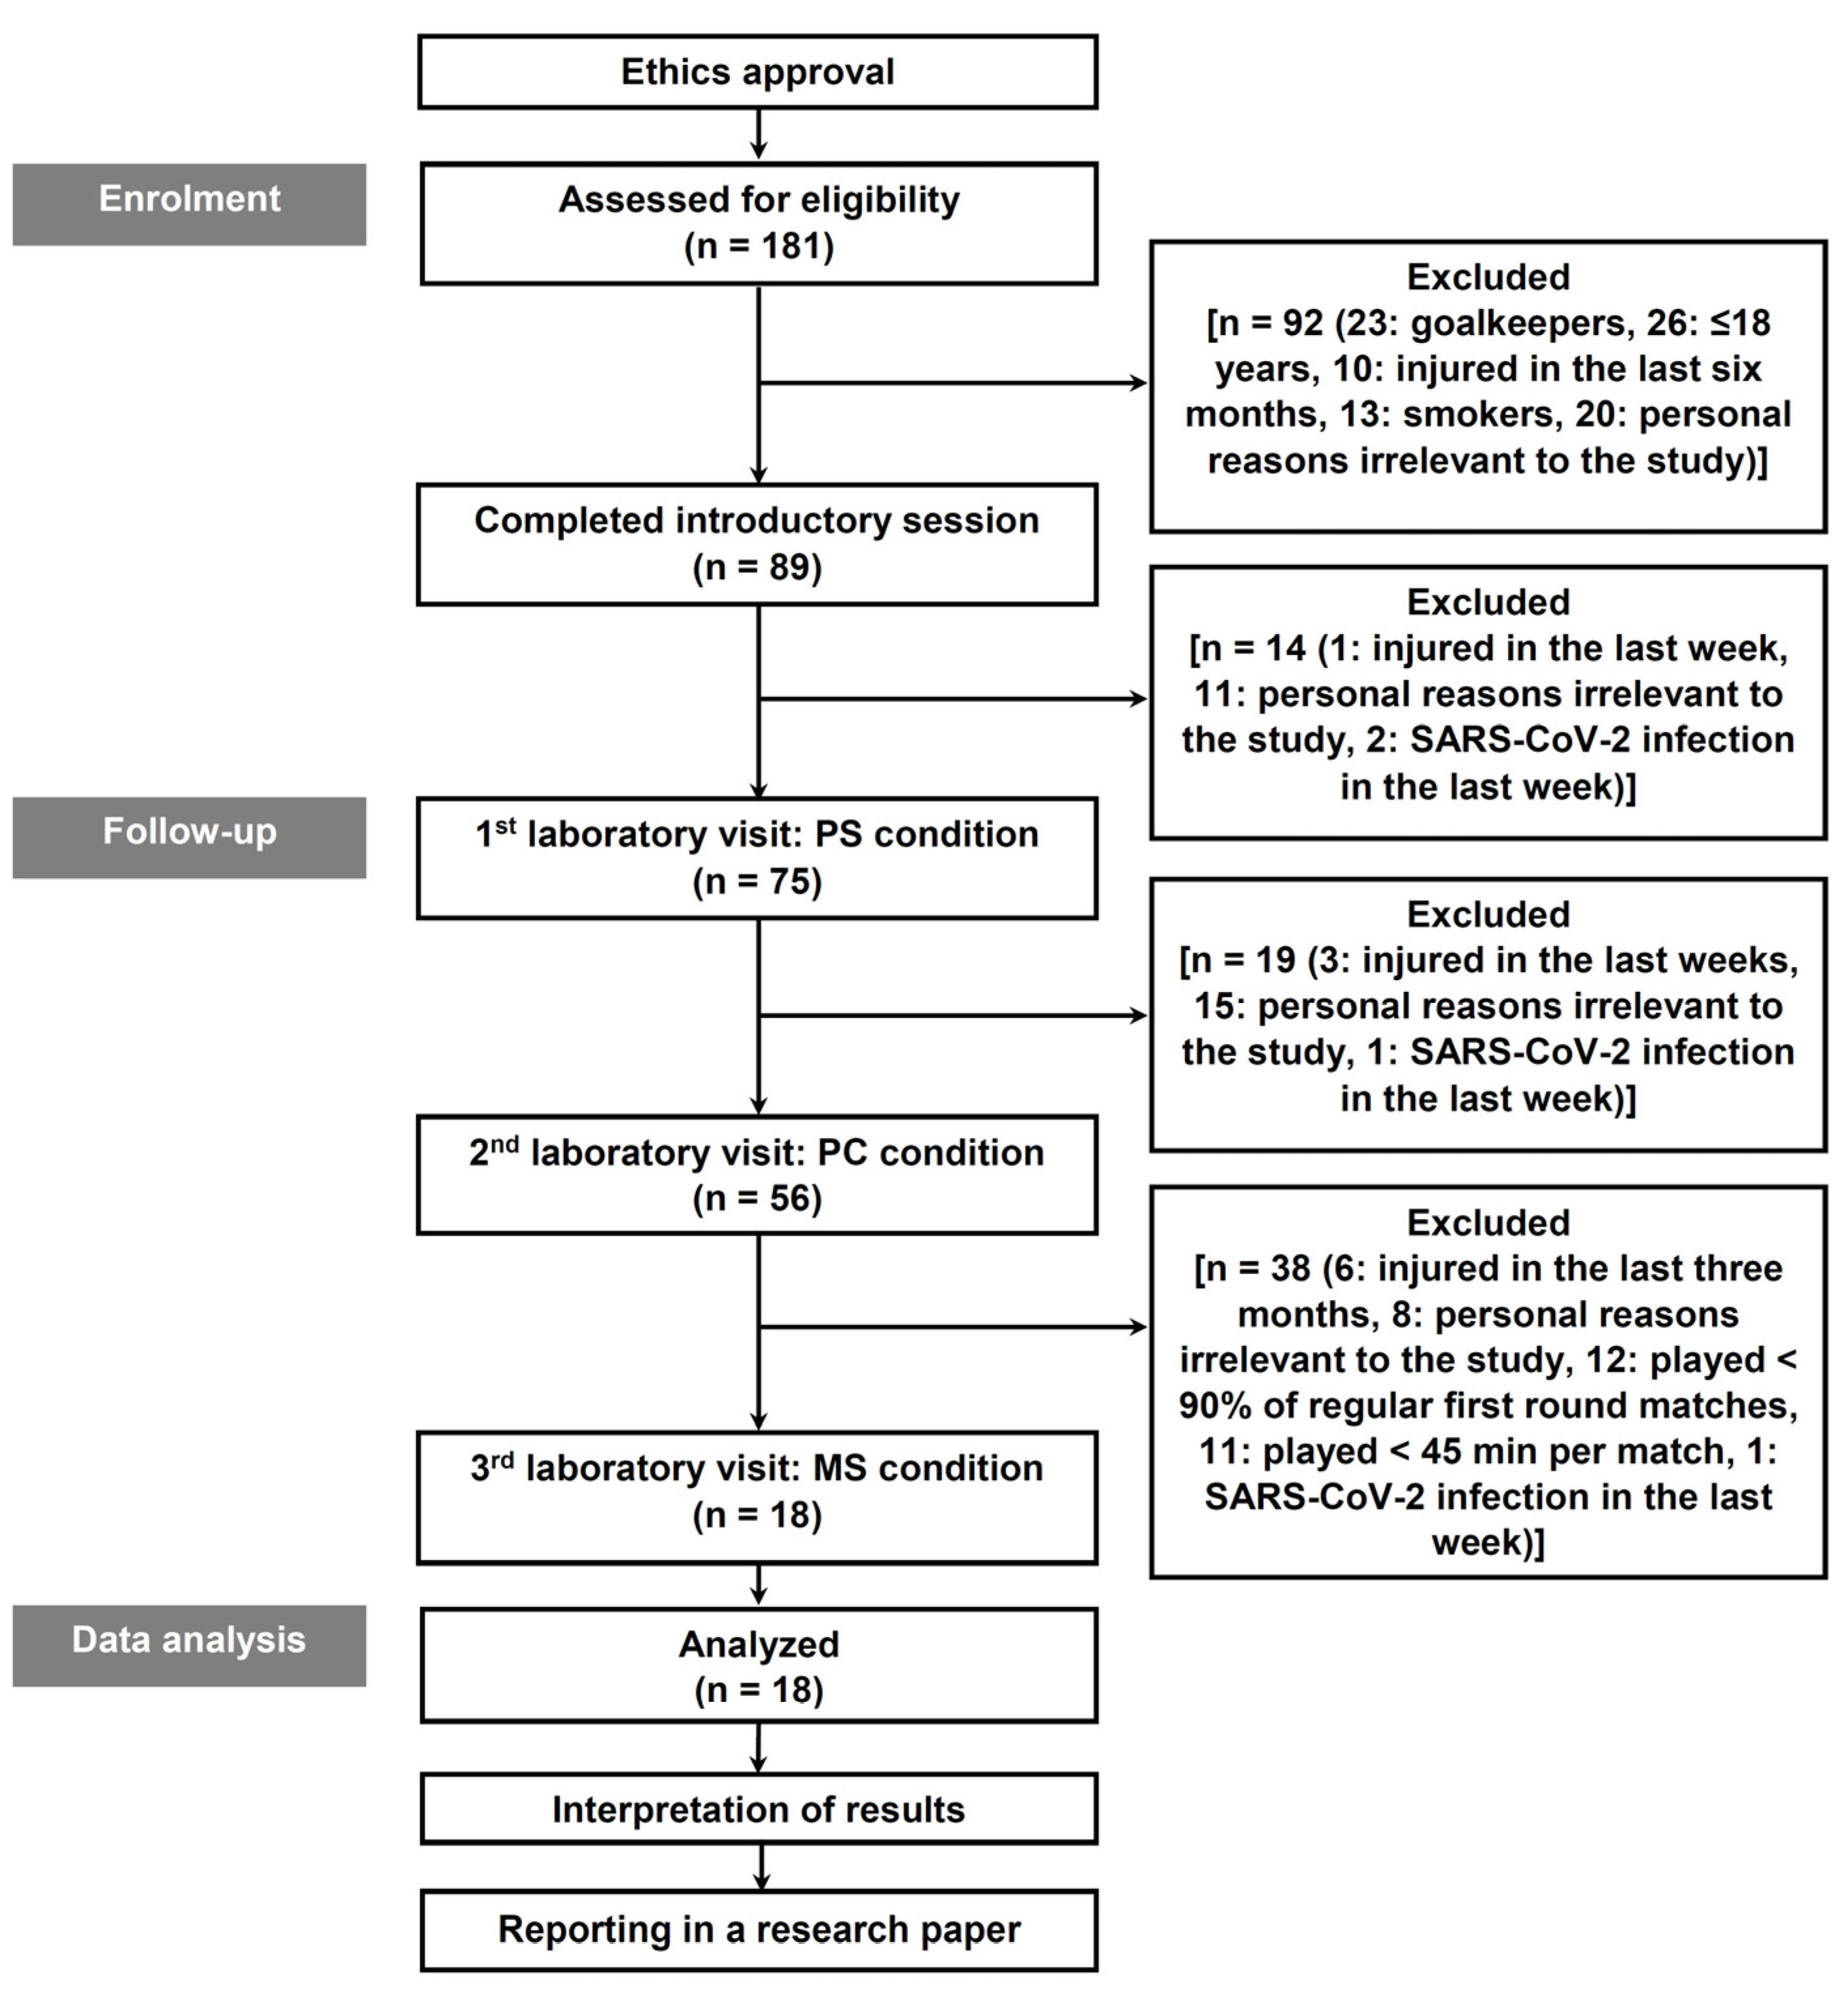
2.1. Participants
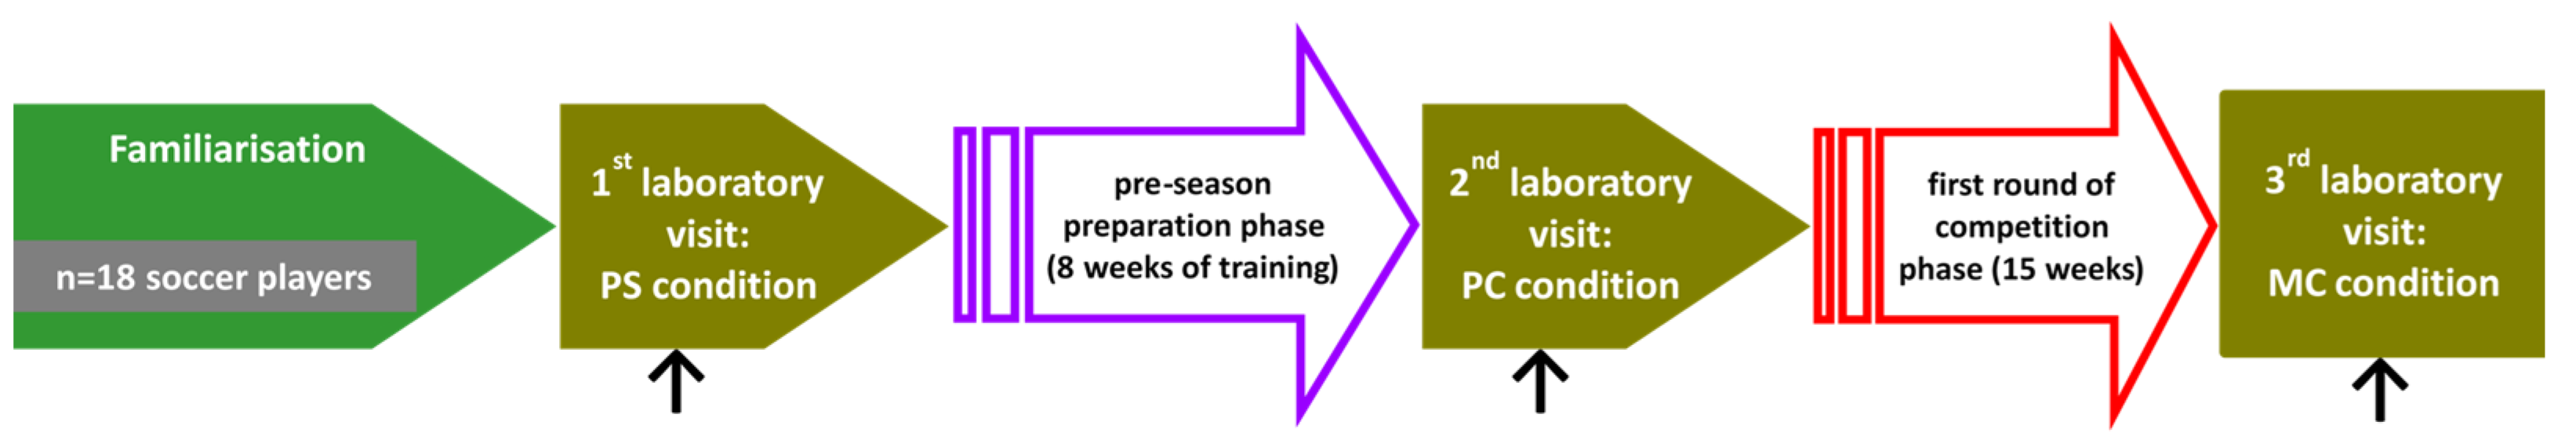
2.2. Procedures
2.3. Measurements
2.3.1. Anthropometrics
2.3.2. Blood Sampling and Assays
2.3.3. Flexibility of the Lower Back and Hamstrings
2.3.4. Lower Limb Power and Strength
2.3.5. Running-Based Anaerobic Sprint Test
2.3.6. Maximal Oxygen Uptake, Lactate Concentration, and Heart Rate
2.4. Statistical Analyses
3. Results
4. Discussion
Strengths, Limitations, and Future Research Directions
5. Conclusions
Supplementary Materials
Author Contributions
Funding
Institutional Review Board Statement
Informed Consent Statement
Data Availability Statement
Acknowledgments
Conflicts of Interest
References
- Reilly, T.; Drust, B.; Clarke, N. Muscle fatigue during football match-play. Sports Med. 2008, 38, 357–367. [Google Scholar] [CrossRef] [PubMed]
- Hoff, J.; Wisløff, U.; Engen, L.C.; Kemi, O.J.; Helgerud, J. Soccer specific aerobic endurance training. Br. J. Sports Med. 2002, 36, 218–221. [Google Scholar] [CrossRef]
- Haycraft, J.A.Z.; Kovalchik, S.; Pyne, D.B.; Robertson, S. Physical characteristics of players within the Australian Football League participation pathways: A systematic review. Sports Med.—Open 2017, 3, 46. [Google Scholar] [CrossRef] [PubMed]
- Milanović, Z.; Sporiš, G.; Trajković, N.; James, N.; Šamija, K. Effects of a 12 week SAQ training programme on agility with and without the ball among young soccer players. J. Sports Sci. Med. 2013, 12, 97–103. [Google Scholar]
- Sermaxhaj, S.; Telai, B. Influence of some anthropometric variables and the specific motoric on the success of the football players of first junior league of Kosovo. In Proceedings of the First International Scientific Conference—Research in Physical Education, Sport and Health, Ohrid, Kosovo, 30–31. May 2014; pp. 111–115. [Google Scholar]
- Mujika, I.; Santisteban, J.; Castagna, C. In-season effect of short-term sprint and power training programs on elite junior soccer players. J. Strength Cond. Res. 2009, 23, 2581–2587. [Google Scholar] [CrossRef] [PubMed]
- Chelly, M.S.; Ghenem, M.A.; Abid, K.; Hermassi, S.; Tabka, Z.; Shephard, R.J. Effects of in-season short-term plyometric training program on leg power, jump-and sprint performance of soccer players. J. Strength Cond. Res. 2010, 24, 2670–2676. [Google Scholar] [CrossRef]
- Crisp, A.H.; Verlengia, R.; Sindorf, M.A.G.; Germano, M.D.; de Castro Cesar, M.; Lopes, C.R. Time to exhaustion at VO2max velocity in basketball and soccer athletes. J. Exerc. Physiol. Online 2013, 16, 82–91. [Google Scholar]
- Joksimovic, A.; Jezdimirovic, M.; Stankovic, M.; Smajic, D.; Popovic, S.; Tomic, B. Biochemical Profile of Serbian Youth National Soccer Teams. Int. J. Morphol. 2015, 33, 483–490. [Google Scholar] [CrossRef]
- Djaoui, L.; Haddad, M.; Chamari, K.; Dellal, A. Monitoring training load and fatigue in soccer players with physiological markers. Physiol. Behav. 2017, 181, 86–94. [Google Scholar] [CrossRef]
- Aziz, A.R.; Newton, M.J.; Tan, F.H.Y.; Teh, K.C. Variation in fitness attributes of players during a competitive season in an Asian professional soccer league: A field-based investigation. Asian J. Exerc. Sports Sci. 2006, 3, 40–45. [Google Scholar]
- Buchheit, M.; Cholley, Y.; Lambert, P. Psychometric and physiological responses to a preseason competitive camp in the heat with a 6-hour time difference in elite soccer players. Int. J. Sports Physiol. Perform. 2016, 11, 176–181. [Google Scholar] [CrossRef] [PubMed]
- Selmi, O.; Gonçalves, B.; Ouergui, I.; Sampaio, J.; Bouassida, A. Influence of well-being variables and recovery state in physical enjoyment of professional soccer players during small-sided games. Res. Sports Med. 2018, 26, 199–210. [Google Scholar] [CrossRef] [PubMed]
- Williams, A.M.; Ford, P.R.; Drust, B. Science and Soccer: Developing Elite Performers, 4th ed.; Williams, A.M., Ford, P.R., Drust, B., Eds.; Routledge: New York, NY, USA, 2023; ISBN 978-1-032-46030-7. [Google Scholar]
- Souglis, A.; Bourdas, D.I.; Gioldasis, A.; Ispirlidis, I.; Philippou, A.; Zacharakis, E.; Apostoldis, A.; Efthymiou, G.; Travlos, A.K. Time Course of Performance Indexes, Oxidative Stress, Inflammation, and Muscle Damage Markers after a Female Futsal Match. Sports 2023, 11, 127. [Google Scholar] [CrossRef] [PubMed]
- Zacharakis, E.; Souglis, A.; Bourdas, D.; Gioldasis, A.; Apostolidis, N.; Kostopoulos, N. The relationship between physical and technical performance characteristics of young soccer and basketball players: A comparison between two sports. Gazz. Medica Ital. Arch. Sci. Mediche 2021, 180, 653–664. [Google Scholar] [CrossRef]
- Souglis, A.; Bogdanis, G.C.; Chryssanthopoulos, C.; Apostolidis, N.; Geladas, N.D. Time course of oxidative stress, inflammation, and muscle damage markers for 5 days after a soccer match: Effects of sex and playing position. J. Strength Cond. Res. 2018, 32, 2045–2054. [Google Scholar] [CrossRef]
- Bekris, E.; Bourdas, D.I.; Mylonis, E.; Ispirlidis, I.; Zacharakis, E.D.; Katis, A. Effect of 3 vs. 3 Soccer Small-Sided Game on Various Performance, Inflammatory, Muscle Damage and Hormonal Indicators in Semi-Professional Players. Sports 2022, 10, 102. [Google Scholar] [CrossRef]
- Mitrotasios, M.; Karampas, P.; Samios, A.; Christofilakis, O.; Mylonis, E.; Ispyrlidis, I.; Kyranoudis, A. The physiological parameters fluctuation of third national league players. In Proceedings of the Proceedings of the the 27th International Congress of Physical Education & Sport, Komotini, Greece, 10–12 May 2019; Douda, H., Smilios, I., Eds.; ICPESS: Komotini, Greece, 2019; p. 296. (In Greek). [Google Scholar]
- Bekris, E.; Mylonis, E.; Gissis, I.; Katis, A.; Metaxas, T.; Komsis, S.; Kompodieta, N. Variation of aerobic performance indices of professional elite soccer players during the annual macrocycle. J. Sports Med. Phys. Fit. 2019, 59, 1628–1634. [Google Scholar] [CrossRef]
- Metaxas, T.; Sendelides, T.; Koutlianos, N.; Mandroukas, K. Seasonal variation of aerobic performance in soccer players according to positional role. J. Sports Med. Phys. Fit. 2006, 46, 520–525. [Google Scholar]
- McMillan, K.; Helgerud, J.; Grant, S.J.; Newell, J.; Wilson, J.; Macdonald, R.; Hoff, J. Lactate threshold responses to a season of professional British youth soccer. Br. J. Sports Med. 2005, 39, 432–436. [Google Scholar] [CrossRef]
- Schwesig, R.; Schulze, S.; Reinhardt, L.; Laudner, K.G.; Delank, K.S.; Hermassi, S. Differences in player position running velocity at lactate thresholds among male professional German soccer players. Front. Physiol. 2019, 10, 886. [Google Scholar] [CrossRef]
- Śliwowski, R.; Andrzejewski, M.; Wieczorek, A.; Barinow-Wojewódzki, A.; Jadczak, L.; Adrian, S.; Pietrzak, M.; Wieczorek, S. Changes in the anaerobic threshold in an annual cycle of sport training of young soccer players. Biol. Sport 2013, 30, 137–143. [Google Scholar] [CrossRef] [PubMed]
- Milanese, C.; Cavedon, V.; Corradini, G.; De Vita, F.; Zancanaro, C. Seasonal DXA-measured body composition changes in professional male soccer players. J. Sports Sci. 2015, 33, 1219–1228. [Google Scholar] [CrossRef] [PubMed]
- Matos, V.A.F.; de Carvalho, C.S.; Fayh, A.P.T. Seasonal changes in body composition and cardiometabolic health biomarkers in professional soccer players: A longitudinal study. Sport Sci. Health 2020, 16, 419–424. [Google Scholar] [CrossRef]
- Bunc, V.; Hráský, P.; Skalská, M. Changes in Body Composition, During the Season, in Highly Trained Soccer Players. Open Sports Sci. J. 2015, 8, 18–24. [Google Scholar] [CrossRef]
- Devlin, B.L.; Kingsley, M.; Leveritt, M.D.; Belski, R. Seasonal Changes in Soccer Players’ Body Composition and Dietary Intake Practices. J. Strength Cond. Res. 2017, 31, 3319–3326. [Google Scholar] [CrossRef]
- Saidi, K.; Zouhal, H.; Rhibi, F.; Tijani, J.M.; Boullosa, D.; Chebbi, A.; Hackney, A.C.; Granacher, U.; Bideau, B.; Abderrahman, A. Ben Effects of a six-week period of congested match play on plasma volume variations, hematological parameters, training workload and physical fitness in elite soccer players. PLoS ONE 2019, 14, e0219692. [Google Scholar] [CrossRef]
- Casajüs, J.A. Seasonal variation in fitness variables in professional soccer players. J. Sports Med. Phys. Fit. 2001, 41, 463–469. [Google Scholar]
- Daneshjoo, A.; Rahnama, N.; Mokhtar, A.H.; Yusof, A. Bilateral and unilateral asymmetries of isokinetic strength and flexibility in male young professional soccer players. J. Hum. Kinet. 2013, 36, 45–53. [Google Scholar] [CrossRef]
- Eniseler, N.; Şahan, Ç.; Vurgun, H.; Mavi, H. Isokinetic strength responses to season-long training and competition in Turkish elite soccer players. J. Hum. Kinet. 2012, 31, 159–168. [Google Scholar] [CrossRef]
- Silva, J.R.; Rebelo, A.; Marques, F.; Pereira, L.; Seabra, A.; Ascensão, A.; Magalhães, J. Biochemical impact of soccer: An analysis of hormonal, muscle damage, and redox markers during the season. Appl. Physiol. Nutr. Metab. 2014, 39, 432–438. [Google Scholar] [CrossRef]
- Dragijsky, M.; Maly, T.; Zahalka, F.; Kunzmann, E.; Hank, M. Seasonal variation of agility, speed and endurance performance in young elite soccer players. Sports 2017, 5, 12. [Google Scholar] [CrossRef]
- Meckel, Y.; Doron, O.; Eliakim, E.; Eliakim, A. Seasonal variations in physical fitness and performance indices of elite soccer players. Sports 2018, 6, 14. [Google Scholar] [CrossRef]
- Mitrousis, I.; Bourdas, D.I.; Kounalakis, S.; Bekris, E.; Mitrotasios, M.; Kostopoulos, Ν.; Ktistakis, I.E.; Zacharakis, E. The Effect of a Balance Training Program on the Balance and Technical Skills of Adolescent Soccer Players. J. Sports Sci. Med. 2023, 22, 645–657. [Google Scholar] [CrossRef]
- Nobari, H.; Alves, A.R.; Haghighi, H.; Clemente, F.M.; Carlos-Vivas, J.; Pérez-Gómez, J.; Ardigò, L.P. Association between training load and well-being measures in young soccer players during a season. Int. J. Environ. Res. Public Health 2021, 18, 4451. [Google Scholar] [CrossRef]
- Peart, A.N.; Nicks, C.R.; Mangum, M.; Tyo, B.M. Evaluation of Seasonal Changes in Fitness, Anthropometrics, and Body Composition in Collegiate Division II Female Soccer Players. J. Strength Cond. Res. 2018, 32, 2010–2017. [Google Scholar] [CrossRef] [PubMed]
- Purdom, T.M.; Levers, K.S.; McPherson, C.S.; Giles, J.; Brown, L. A Longitudinal Prospective Study: The Effect of Annual Seasonal Transition and Coaching Influence on Aerobic Capacity and Body Composition in Division I Female Soccer Players. Sports 2020, 8, 107. [Google Scholar] [CrossRef] [PubMed]
- Kalapotharakos, V.I.; Ziogas, G.; Tokmakidis, S.P. Seasonal aerobic performance variations in elite soccer players. J. Strength Cond. Res. 2011, 25, 1502–1507. [Google Scholar] [CrossRef] [PubMed]
- Clemente, F.M.; Nikolaidis, P.T.; Rosemann, T.; Knechtle, B. Dose-response relationship between external load variables, body composition, and fitness variables in professional soccer players. Front. Physiol. 2019, 10, 443. [Google Scholar] [CrossRef]
- Andersson, H.; Randers, M.; Heiner-Møller, A.; Krustrup, P.; Mohr, M. Elite female soccer players perform more high-intensity running when playing in international games compared with domestic league games. J. Strength Cond. Res. 2010, 24, 912–919. [Google Scholar] [CrossRef]
- Ascensão, A.; Rebelo, A.; Oliveira, E.; Marques, F.; Pereira, L.; Magalhães, J. Biochemical impact of a soccer match—Analysis of oxidative stress and muscle damage markers throughout recovery. Clin. Biochem. 2008, 41, 841–851. [Google Scholar] [CrossRef]
- Ispirlidis, I.; Fatouros, I.G.; Jamurtas, A.Z.; Nikolaidis, M.G.; Michailidis, I.; Douroudos, I.; Margonis, K.; Chatzinikolaou, A.; Kalistratos, E.; Katrabasas, I.; et al. Time-course of changes in inflammatory and performance responses following a soccer game. Clin. J. Sport Med. 2008, 18, 423–431. [Google Scholar] [CrossRef] [PubMed]
- Kostrzewa-Nowak, D.; Nowak, R.; Chamera, T.; Buryta, R.; Moska, W.; Cięszczyk, P. Post-effort chances in C-reactive protein level among soccer players at the end of the training season. J. Strength Cond. Res. 2015, 29, 1399–1405. [Google Scholar] [CrossRef]
- Coelho, D.B.; Pimenta, E.M.; da Paixão, R.C.; Morandi, R.F.; Becker, L.K.; Ferreira Júnior, J.B.; Coelho, L.G.M.; Silami-Garcia, E. Analysis of chronic physiological demand of an annual soccer season. Rev. Bras. Cineantropometria E Desempenho Hum. 2015, 17, 400–408. [Google Scholar] [CrossRef]
- Anđelković, M.; Baralić, I.; Đorđević, B.; Kotur Stevuljević, J.; Radivojević, N.; Dikić, N.; Radojević Skodrić, S.; Stojković, M. Hematological and Biochemical Parameters in Elite Soccer Players During a Competitive Half Season. J. Med. Biochem. 2015, 34, 460–466. [Google Scholar] [CrossRef]
- Bekris, E.; Gioldasis, A.; Gissis, I.; Anagnostakos, K.; Eleftherios, M. From Preparation to Competitive Period in Soccer: Hematological Changes. Sport Sci. Rev. 2015, 24, 103–114. [Google Scholar] [CrossRef]
- Brito Souza, D.; López-Del Campo, R.; Blanco-Pita, H.; Resta, R.; Del Coso, J. A new paradigm to understand success in professional football: Analysis of match statistics in LaLiga for 8 complete seasons. Int. J. Perform. Anal. Sport 2019, 19, 543–555. [Google Scholar] [CrossRef]
- Jajtner, A.R.; Hoffman, J.R.; Scanlon, T.C.; Wells, A.J.; Townsend, J.R.; Beyer, K.S.; Mangine, G.T.; McCormack, W.P.; Bohner, J.D.; Fragala, M.S.; et al. Performance and muscle architecture comparisons between starters and nonstarters in National Collegiate Athletic Association Division I women’s soccer. J. Strength Cond. Res. 2013, 27, 2355–2365. [Google Scholar] [CrossRef] [PubMed]
- Bourdas, D.I.; Zacharakis, E.D. Impact of COVID-19 Lockdown on Physical Activity in a Sample of Greek Adults. Sports 2020, 8, 139. [Google Scholar] [CrossRef] [PubMed]
- Bourdas, D.I.; Zacharakis, E.D. Evolution of changes in physical activity over lockdown time: Physical activity datasets of four independent adult sample groups corresponding to each of the last four of the six COVID-19 lockdown weeks in Greece. Data Br. 2020, 32, 106301. [Google Scholar] [CrossRef]
- Warburton, D.; Jamnik, V.; Bredin, S.; Gledhill, N. The 2018 Physical Activity Readiness Questionnaire for Everyone (PAR-Q+) and electronic Physical Activity Readiness Medical Examination (ePARmed-X+): 2018 PAR-Q+. Health Fit. J. Can. 2011, 11, 31–34. [Google Scholar] [CrossRef]
- Bourdas, D.I.; Zacharakis, E.D.; Travlos, A.K.; Souglis, A.; Georgali, T.I.; Gofas, D.C.; Ktistakis, I.E.; Deltsidou, A. Impact of lockdown on smoking and sleeping in the early COVID-19 presence: Datasets of Greek Adults sample. Data Br. 2021, 39, 107480. [Google Scholar] [CrossRef] [PubMed]
- U.S. Department of Health and Human Services; Healthier.gov. Physical Activity Guidelines for Americans; US Department of Health and Human Services: Rockville, MD, USA, 2008.
- World Medical Association. World Medical Association Declaration of Helsinki, Ethical Principles for Scientific Requirements and Research Protocols. Bull. World Health Organ. 2013, 79, 373. [Google Scholar]
- McKay, A.K.A.; Stellingwerff, T.; Smith, E.S.; Martin, D.T.; Mujika, I.; Goosey-Tolfrey, V.L.; Sheppard, J.; Burke, L.M. Defining Training and Performance Caliber: A Participant Classification Framework. Int. J. Sports Physiol. Perform. 2022, 17, 317–331. [Google Scholar] [CrossRef]
- Cadegiani, F.A.; Kater, C.E. Novel insights of overtraining syndrome discovered from the EROS study. BMJ Open Sport Exerc. Med. 2019, 5, e000542. [Google Scholar] [CrossRef] [PubMed]
- Bourdas, D.I.; Souglis, A.; Zacharakis, E.D.; Geladas, N.D.; Travlos, A.K. Meta-Analysis of Carbohydrate Solution Intake during Prolonged Exercise in Adults: From the Last 45+ Years’ Perspective. Nutrients 2021, 13, 4223. [Google Scholar] [CrossRef]
- Deltsidou, A.; Zarikas, V.; Mastrogiannis, D.; Kapreli, E.; Bourdas, D.; Raftopoulos, V.; Noula, M.; Lykeridou, K. Data on advanced glycation end-products concentrations and haemodynamic parameters following caffeine and nicotine consumption in nursing students. Data Br. 2020, 32, 106063. [Google Scholar] [CrossRef]
- Havenetidis, K.; Bourdas, D. Creatine supplementation: Effects on urinary excretion and anaerobic performance. J. Sports Med. Phys. Fit. 2003, 43, 347–355. [Google Scholar]
- Bourdas, D.I.; Travlos, A.K.; Souglis, A.; Stavropoulou, G.; Zacharakis, E.; Gofas, D.C.; Bakirtzoglou, P. Effects of a Singular Dose of Mangiferin—Quercetin Supplementation on Basketball Performance: A Double-Blind Crossover Study of High-Level Male Players. Nutrients 2024, 16, 170. [Google Scholar] [CrossRef]
- Durnin, J.V.G.; Womersley, J. Body fat assessed from total body density and its estimation from skinfold thickness: Measurements on 481 men and women aged from 16 to 72 years. Br. J. Nutr. 1974, 32, 77–97. [Google Scholar] [CrossRef]
- Sebastiá-Rico, J.; Soriano, J.M.; González-Gálvez, N.; Martínez-Sanz, J.M. Body Composition of Male Professional Soccer Players Using Different Measurement Methods: A Systematic Review and Meta-Analysis. Nutrients 2023, 15, 1160. [Google Scholar] [CrossRef]
- Van Der Horst, N.; Priesterbach, A.; Backx, F.; Smits, D.W. Hamstring-and-lower-back flexibility in male amateur soccer players. Clin. J. Sport Med. 2017, 27, 20–25. [Google Scholar] [CrossRef]
- Nes, B.M.; Janszky, I.; Wisløff, U.; Støylen, A.; Karlsen, T. Age-predicted maximal heart rate in healthy subjects: The HUNT Fitness Study. Scand. J. Med. Sci. Sports 2013, 23, 697–704. [Google Scholar] [CrossRef] [PubMed]
- Bosco, C.; Luhtanen, P.; Komi, P.V. A simple method for measurement of mechanical power in jumping. Eur. J. Appl. Physiol. Occup. Physiol. 1983, 50, 273–282. [Google Scholar] [CrossRef] [PubMed]
- Luhtanen, P.; Komi, P.V. Segmental contribution to forces in vertical jump. Eur. J. Appl. Physiol. Occup. Physiol. 1978, 38, 181–188. [Google Scholar] [CrossRef] [PubMed]
- Zacharogiannis, E.; Paradisis, G.; Tziortzis, S. An Evaluation of Tests of Anaerobic Power and Capacity. Med. Sci. Sports Exerc. 2004, 36, S116. [Google Scholar]
- Zagatto, A.M.; Beck, W.R.; Gobatto, C.A. Validity of the running anaerobic sprint test for assessing anaerobic power and predicting short-distance performances. J. Strength Cond. Res. 2009, 23, 1820–1827. [Google Scholar] [CrossRef]
- American College of Sports Medicine. ACSM’s Guidelines for Exercise Testing and Prescription, 10th ed.; Riebe, D., Ed.; Wolters Kluwer Health: Philadelphia, PA, USA, 2018; ISBN 9781496339065. [Google Scholar]
- Cerezuela-Espejo, V.; Courel-Ibáñez, J.; Morán-Navarro, R.; Martínez-Cava, A.; Pallarés, J.G. The relationship between lactate and ventilatory thresholds in runners: Validity and reliability of exercise test performance parameters. Front. Physiol. 2018, 9, 1320. [Google Scholar] [CrossRef]
- Cohen, J. Statistical Power Analysis for the Behavioral Sciences, 2nd ed.; Lawrence Erlbaum Associates: Hillsdale, NJ, USA, 1988; ISBN 0805802835. [Google Scholar]
- Lakens, D. Calculating and reporting effect sizes to facilitate cumulative science: A practical primer for t-tests and ANOVAs. Front. Psychol. 2013, 4, 863. [Google Scholar] [CrossRef]
- Meyers, L.S.; Gamst, G.; Guarino, A.J. Applied Multivariate Research Design and Interpretation, 3rd ed.; SAGE Publications Inc.: Newbury Park, CA, USA, 2016; ISBN 978-1506329765. [Google Scholar]
- Silva, J.R.; Brito, J.; Akenhead, R.; Nassis, G.P. The Transition Period in Soccer: A Window of Opportunity. Sports Med. 2016, 46, 305–313. [Google Scholar] [CrossRef]
- Clemente, F.M.; Silva, R.; Arslan, E.; Aquino, R.; Castillo, D.; Mendes, B. The effects of congested fixture periods on distance-based workload indices: A full-season study in professional soccer players. Biol. Sport 2021, 38, 37–44. [Google Scholar] [CrossRef]
- Jeong, T.S.; Reilly, T.; Morton, J.; Bae, S.W.; Drust, B. Quantification of the physiological loading of one week of “pre-season” and one week of “in-season” training in professional soccer players. J. Sports Sci. 2011, 29, 1161–1166. [Google Scholar] [CrossRef] [PubMed]
- Oliveira, R.S.; Leicht, A.S.; Bishop, D.; Barbero-Álvarez, J.C.; Nakamura, F.Y. Seasonal changes in physical performance and heart rate variability in high level futsal players. Int. J. Sports Med. 2013, 34, 424–430. [Google Scholar] [CrossRef]
- Fessi, M.S.; Zarrouk, N.; Filetti, C.; Rebai, H.; Elloumi, M.; Moalla, W. Physical and anthropometric changes during pre-and in-season in professional soccer players. J. Sports Med. Phys. Fit. 2016, 56, 1163–1170. [Google Scholar]
- Loturco, I.; Ugrinowitsch, C.; Tricoli, V.; Pivetti, B.; Roschel, H. Different loading schemes in power training during the preseason promote similar performance improvements in Brazilian elite soccer players. J. Strength Cond. Res. 2013, 27, 1791–1797. [Google Scholar] [CrossRef]
- Murphy, D.F.; Connolly, D.A.J.; Beynnon, B.D. Risk factors for lower extremity injury: A review of the literature. Br. J. Sports Med. 2003, 37, 13–29. [Google Scholar] [CrossRef] [PubMed]
- Croisier, J.L.; Ganteaume, S.; Binet, J.; Genty, M.; Ferret, J.M. Strength imbalances and prevention of hamstring injury in professional soccer players: A prospective study. Am. J. Sports Med. 2008, 36, 1469–1475. [Google Scholar] [CrossRef]
- Young, W.B.; James, R.; Montgomery, I. Is muscle power related to running speed with changes of direction? J. Sports Med. Phys. Fit. 2002, 42, 282–288. [Google Scholar]
- Boone, J.; Vaeyens, R.; Steyaert, A.; Vanden Bossche, L.; Bourgois, J. Physical fitness of elite Belgian soccer players by player position. J. Strength Cond. Res. 2012, 26, 2051–2057. [Google Scholar] [CrossRef]
- Perroni, F.; Fittipaldi, S.; Falcioni, L.; Ghizzoni, L.; Borrione, P.; Vetrano, M.; Del Vescovo, R.; Migliaccio, S.; Guidetti, L.; Baldari, C. Effect of pre-season training phase on anthropometric, hormonal and fitness parameters in young soccer players. PLoS ONE 2019, 14, e0225471. [Google Scholar] [CrossRef]
- Clemente, F.M.; Clark, C.; Castillo, D.; Sarmento, H.; Nikolaidis, P.T.; Rosemann, T.; Knechtle, B. Variations of training load, monotony, and strain and dose-response relationships with maximal aerobic speed, maximal oxygen uptake, and isokinetic strength in professional soccer players. PLoS ONE 2019, 14, e0225522. [Google Scholar] [CrossRef]
- Bizati, O. Physical and physiological characteristics of an Elite soccer team’s players according to playing positions. Anthropologist 2016, 26, 175–180. [Google Scholar] [CrossRef]
- Silva, R.; Lima, R.; Camões, M.; Leão, C.; Matos, S.; Pereira, J.; Bezerra, P.; Clemente, F.M. Physical fitness changes among amateur soccer players: Effects of the pre-season period. Biomed. Hum. Kinet. 2021, 13, 63–72. [Google Scholar] [CrossRef]
- Peres, R.A.S.; Barbosa, I.M.; Arouca, I.R.; Paiva, K.V.; Coutinho, T.B.; Tadeu, V.C.; Morales, A.P.; Ribeiro, B.G.; Feitosa, N.M.; De Barros, C.M.; et al. Kidney functions adaptations of professional soccer players in response to an entire game season. An. Acad. Bras. Cienc. 2022, 94, e20211536. [Google Scholar] [CrossRef]
- Manna, I.; Khanna, G.L.; Dhara, P.C. Effect of Training on Physiological and Biochemical Variables of Soccer Players of Different Age Groups. Asian J. Sports Med. 2010, 1, 5–22. [Google Scholar] [CrossRef] [PubMed]
- Fathi, R.S.; Majid, A.A.A. Effect reciprocal training in transaminase enzymes and the anaerobic lactic functional ability in performance 1500-m runners. Swed. J. Sci. Res. 2015, 2, 7–9. [Google Scholar]
- Özen, G.; Atar, Ö.; Yurdakul, H.; Pehlivan, B.; Koç, H. The effect of pre-season football training on hematological parameters of well-trained young male football players. Pedagog. Phys. Cult. Sports 2020, 24, 303–309. [Google Scholar] [CrossRef]
- Filipovic, A.; Bizjak, D.; Tomschi, F.; Bloch, W.; Grau, M. Influence of whole-body electrostimulation on the deformability of density-separated red blood cells in soccer players. Front. Physiol. 2019, 10, 548. [Google Scholar] [CrossRef]
- Saddam, A.; Ali, B.; Abdelatif, O. Analysis of the Evolution of Some Hematological Parameters During the First Preparatory Period on Young Algerian Soccer Players (U17). Eur. J. Phys. Educ. Sport Sci. 2017, 3, 128–134. [Google Scholar] [CrossRef]
- da Rocha, A.L.; Pinto, A.P.; Kohama, E.B.; Pauli, J.R.; de Moura, L.P.; Cintra, D.E.; Ropelle, E.R.; da Silva, A.S.R. The proinflammatory effects of chronic excessive exercise. Cytokine 2019, 119, 57–61. [Google Scholar] [CrossRef]
- İbiş, S.; Hazar, S. Aerobik ve anaerobik egzersizlerin hematolojik parametrelere akut etkisi * Acute effect of hematological parameters on aerobic and anaerobic exercise. Uluslararası İnsan Bilim. Derg. [Bağlantıda] 2010, 7, 70–82. [Google Scholar]
- Saidi, K.; Ben Abderrahman, A.; Laher, I.; Hackney, A.C.; El Hage, R.; Saeidi, A.; Bideau, B.; Granacher, U.; Zouhal, H. Immune inflammation markers and physical fitness during a congested match play period in elite male soccer players. Sci. Rep. 2024, 14, 30312. [Google Scholar] [CrossRef] [PubMed]
- Matonti, L.; Blasetti, A.; Chiarelli, F. Nutrition and growth in children. Minerva Pediatr. 2020, 72, 462–471. [Google Scholar] [CrossRef] [PubMed]
- Selmi, O.; Levitt, D.E.; Ouergui, I.; Aydi, B.; Bouassida, A.; Weiss, K.; Knechtle, B. Effect of Intensified Training Camp on Psychometric Status, Mood State, and Hematological Markers in Youth Soccer Players. Children 2022, 9, 1996. [Google Scholar] [CrossRef] [PubMed]
- Margeli, A.; Skenderi, K.; Tsironi, M.; Hantzi, E.; Matalas, A.L.; Vrettou, C.; Kanavakis, E.; Chrousos, G.; Papassotiriou, I. Dramatic elevations of interleukin-6 and acute-phase reactants in athletes participating in the ultradistance foot race Spartathlon: Severe systemic inflammation and lipid and lipoprotein changes in protracted exercise. J. Clin. Endocrinol. Metab. 2005, 90, 3914–3918. [Google Scholar] [CrossRef]
- Mohr, M.; Draganidis, D.; Chatzinikolaou, A.; Barbero-Álvarez, J.C.; Castagna, C.; Douroudos, I.; Avloniti, A.; Margeli, A.; Papassotiriou, I.; Flouris, A.D.; et al. Muscle damage, inflammatory, immune and performance responses to three football games in 1 week in competitive male players. Eur. J. Appl. Physiol. 2016, 116, 179–193. [Google Scholar] [CrossRef]
- Vilamitjana, J.; Vaccari, J.C.; Toedtli, M.; Navone, D.; Rodriguez-Buteler, J.M.; Verde, P.E.; Calleja-González, J. Monitorización de biomarcadores sanguíneos en jugadores profesionales de fútbol durante la fase preparatoria y competitiva. [Monitoring biochemical markers in professional soccer players during the season and preseason preparation phase]. Rev. Int. Cienc. Deporte 2017, 13, 211–224. [Google Scholar] [CrossRef]
- Walker, A.J.; McFadden, B.A.; Sanders, D.J.; Rabideau, M.M.; Hofacker, M.L.; Arent, S.M. Biomarker Response to a Competitive Season in Division I Female Soccer Players. J. Strength Cond. Res. 2019, 33, 2622–2628. [Google Scholar] [CrossRef]
- Buchheit, M.; Voss, S.C.; Nybo, L.; Mohr, M.; Racinais, S. Physiological and performance adaptations to an in-season soccer camp in the heat: Associations with heart rate and heart rate variability. Scand. J. Med. Sci. Sports 2011, 21, e477–e485. [Google Scholar] [CrossRef]
- Celenk, C.; Akil, M.; Kara, E. The level of damage caused by football matches on players. Life Sci. J. 2013, 10, 2836–2839. [Google Scholar]
- Casto, K.V.; Edwards, D.A. Testosterone, cortisol, and human competition. Horm. Behav. 2016, 82, 21–37. [Google Scholar] [CrossRef]
- Muscella, A.; Vetrugno, C.; Spedicato, M.; Stefàno, E.; Marsigliante, S. The effects of training on hormonal concentrations in young soccer players. J. Cell. Physiol. 2019, 234, 20685–20693. [Google Scholar] [CrossRef] [PubMed]
- Pedroso, L.C.; Bedore, G.C.; da Cruz, J.P.; Sousa, F.A.B.; Scariot, P.P.M.; Dos Reis, I.G.M.; Silva, Á.A.R.; Porcari, A.M.; Messias, L.H.D. Metabolomics analyses and physical interventions in soccer: A systematic review. Metabolomics 2024, 21, 7. [Google Scholar] [CrossRef] [PubMed]
- Saidi, K.; Ben Abderrahman, A.; Hackney, A.C.; Bideau, B.; Zouita, S.; Granacher, U.; Zouhal, H. Hematology, Hormones, Inflammation, and Muscle Damage in Elite and Professional Soccer Players: A Systematic Review with Implications for Exercise. Sports Med. 2021, 51, 2607–2627. [Google Scholar] [CrossRef] [PubMed]


| Variables | PS | PC | MS |
|---|---|---|---|
| Body mass (kg) | 78.51 ± 5.25 [76.08–80.94] | 76.82 ± 4.75 [74.63–79.01] | 77.06 ± 4.93 [74.78–79.34] |
| †‡ Body fat (%) | 10.50 ± 1.67 [9.73–11.27] | 9.15 ± 1.35 [8.53–9.77] | 9.20 ± 1.51 [8.50–9.90] |
| Variables | PS | PC | MS |
|---|---|---|---|
| Glucose (mg·dL−1) | 95.30 ± 20.48 [85.84–104.76] | 87.94 ± 6.07 [85.14–90.74] | 88.22 ± 7.01 [84.98–91.46] |
| ‡§ Cholesterol (mg·dL−1) | 190.80 ± 44.40 [170.29–211.31] | 182.30 ± 36.99 [165.21–199.39] | 150.00 ± 32.03 [135.20–164.80] |
| Τriglycerides (mg·dL−1) | 91.44 ± 33.22 [76.09–106.79] | 84.27 ± 37.92 [66.75–101.79] | 76.38 ± 30.05 [62.50–90.26] |
| Serum glutamic-oxaloacetic transaminase (U·L−1) | 26.38 ± 5.34 [23.91–28.85] | 33.22 ± 12.14 [27.61–38.83] | 29.77 ± 7.28 [26.41–33.13] |
| Serum glutamic-pyruvic transaminase (U·L−1) | 23.33 ± 7.19 [20.01–26.65] | 26.83 ± 10.54 [21.96–31.70] | 23.72 ± 8.62 [19.74–27.70] |
| †‡§ Creatine kinase (U·L−1) | 211.61 ± 75.80 [176.59–246.63] | 599.88 ± 98.80 [554.24–645.52] | 521.00 ± 85.20 [481.64–560.36] |
| †‡§ Myoglobin (mg·L−1) | 50.00 ± 20.13 [40.70–59.30] | 61.55 ± 9.97 [56.94–66.16] | 79.55 ± 19.17 [70.69–88.41] |
| †‡ Iron (μg·dL−1) | 114.38 ± 28.28 [101.32–127.44] | 89.33 ± 26.03 [77.30–101.36] | 81.61 ± 19.24 [72.72–90.50] |
| Ferritin (mg·L−1) | 71.45 ± 34.55 [55.49–87.41] | 73.03 ± 39.01 [55.01–91.05] | 62.08 ± 29.70 [48.36–75.80] |
| C-reactive protein (mg·L−1) | 0.44 ± 0.46 [0.23–0.65] | 0.37 ± 0.10 [0.32–0.42] | 0.37 ± 0.10 [0.32–0.42] |
| †‡ Interleukin-6 (mg·L−1) | 8.16 ± 2.41 [7.05–9.27] | 11.12 ± 3.39 [9.55–12.69] | 11.92 ± 3.42 [10.34–13.50] |
| ‡ Testosterone (ng·mL−1) | 5.94 ± 1.11 [5.43–6.45] | 6.51 ± 1.44 [5.84–7.18] | 6.99 ± 1.17 [6.45–7.53] |
| † Cortisol (μg·dL−1) | 18.91 ± 1.69 [18.13–19.69] | 15.78 ± 3.17 [14.32–17.24] | 17.72 ± 3.06 [16.31–19.13] |
| Variables | PS | PC | MS |
|---|---|---|---|
| †‡ Red blood cells count (1012RBC·L−1) | 6.73 ± 0.93 [6.30–7.16] | 6.10 ± 1.13 [5.58–6.62] | 5.75 ± 0.94 [5.32–6.18] |
| †‡§ Hemoglobin (g·dL−1) | 15.56 ± 0.72 [15.23–15.89] | 14.80 ± 0.88 [14.39–15.21] | 14.06 ± 0.84 [13.67–14.45] |
| †‡ Hematocrit (%) | 45.95 ± 2.05 [45.00–46.90] | 43.46 ± 2.46 [42.32–44.60] | 43.58 ± 1.88 [42.71–44.45] |
| †‡§ White blood cell count (109WBC·L−1) | 5.32 ± 0.22 [5.22–5.42] | 5.09 ± 0.31 [4.95–5.23] | 4.68 ± 0.35 [4.52–4.84] |
| Platelet count (109PLT·L−1) | 227.70 ± 29.58 [214.03–241.37] | 228.61 ± 26.59 [216.33–240.89] | 228.05 ± 26.54 [215.79–240.31] |
| Variables | PS | PC | MS |
|---|---|---|---|
| ‡ Countermovement jump height (cm) | 39.23 ± 4.12 [37.33–41.13] | 41.84 ± 3.82 [40.08–43.60] | 43.35 ± 3.36 [41.80–44.90] |
| Power of knee extensors, dominant leg (watt) | 240.60 ± 29.92 [226.78–254.42] | 246.20 ± 31.28 [231.75–260.65] | 248.90 ± 26.37 [236.72–261.08] |
| Power of knee extensors, non-dominant leg (watt) | 252.70 ± 28.92 [239.34–266.06] | 258.00 ± 29.91 [244.18–271.82] | 258.80 ± 27.68 [246.01–271.59] |
| Power of knee flexors, dominant leg (watt) | 164.80 ± 21.26 [154.98–174.62] | 176.50 ± 19.50 [167.49–185.51] | 173.38 ± 16.53 [165.74–181.02] |
| Power of knee flexors, non-dominant leg (watt) | 160.60 ± 28.48 [147.44–173.76] | 172.30 ± 27.04 [159.81–184.79] | 172.44 ± 23.17 [161.74–183.14] |
| Average 35 m running time during RAST (s) | 4.74 ± 0.15 [4.67–4.81] | 4.78 ± 0.15 [4.71–4.85] | 4.79 ± 0.14 [4.73–4.85] |
| †‡ Speed drop rate during RAST (%) | 13.70 ± 3.74 [11.97–15.43] | 8.50 ± 3.01 [7.11–9.89] | 9.70 ± 3.34 [8.16–11.24] |
| Hamstring and lower back flexibility (cm) | 24.00 ± 6.63 [20.94–27.06] | 24.77 ± 6.62 [21.71–27.83] | 25.27 ± 6.04 [22.48–28.06] |
| Variables | PS | PC | MS |
|---|---|---|---|
| †‡ V̇O2max (mL·kg−1·min−1) | 56.18 ± 3.37 [54.62–57.74] | 58.67 ± 2.79 [57.38–59.96] | 58.75 ± 2.67 [57.52–59.98] |
| †‡ vV̇O2max (km·h−1) | 16.91 ± 0.78 [16.55–17.27] | 18.40 ± 0.82 [18.02–18.78] | 18.73 ± 0.67 [18.42–19.04] |
| †‡ vVT2 (km·h−1) | 13.29 ± 0.74 [12.95–13.63] | 14.40 ± 0.69 [14.08–14.72] | 14.47 ± 0.69 [14.15–14.79] |
| †‡ HRmax (b·min−1) | 197.00 ± 11.36 [191.75–202.25] | 190.00 ± 11.76 [184.57–195.43] | 190.00 ± 11.06 [184.89–195.11] |
| ‡ HR at VT2 (b·min−1) | 168.00 ± 9.99 [163.38–172.62] | 163.00 ± 10.39 [158.2–167.80] | 162.00 ± 9.74 [157.50–166.50] |
| Lactate at V̇O2max (mmol·L−1) | 11.78 ± 1.68 [11.00–12.56] | 12.68 ± 1.53 [11.97–13.39] | 11.98 ± 1.54 [11.27–12.69] |
Disclaimer/Publisher’s Note: The statements, opinions and data contained in all publications are solely those of the individual author(s) and contributor(s) and not of MDPI and/or the editor(s). MDPI and/or the editor(s) disclaim responsibility for any injury to people or property resulting from any ideas, methods, instructions or products referred to in the content. |
© 2025 by the authors. Licensee MDPI, Basel, Switzerland. This article is an open access article distributed under the terms and conditions of the Creative Commons Attribution (CC BY) license (https://creativecommons.org/licenses/by/4.0/).
Share and Cite
Mylonis, E.; Bourdas, D.I.; Kompodieta, N.; Tegousis, A.; Bakirtzoglou, P.; Souglis, A.; Bekris, E. Seasonal Changes in Performance Metrics, Hormonal, Hematological, and Biochemical Markers Among Semi-Professional Soccer Players: Implications for Training and Recovery. J. Funct. Morphol. Kinesiol. 2025, 10, 147. https://doi.org/10.3390/jfmk10020147
Mylonis E, Bourdas DI, Kompodieta N, Tegousis A, Bakirtzoglou P, Souglis A, Bekris E. Seasonal Changes in Performance Metrics, Hormonal, Hematological, and Biochemical Markers Among Semi-Professional Soccer Players: Implications for Training and Recovery. Journal of Functional Morphology and Kinesiology. 2025; 10(2):147. https://doi.org/10.3390/jfmk10020147
Chicago/Turabian StyleMylonis, Eleftherios, Dimitrios I. Bourdas, Natalia Kompodieta, Athanasios Tegousis, Panteleimon Bakirtzoglou, Athanasios Souglis, and Evangelos Bekris. 2025. "Seasonal Changes in Performance Metrics, Hormonal, Hematological, and Biochemical Markers Among Semi-Professional Soccer Players: Implications for Training and Recovery" Journal of Functional Morphology and Kinesiology 10, no. 2: 147. https://doi.org/10.3390/jfmk10020147
APA StyleMylonis, E., Bourdas, D. I., Kompodieta, N., Tegousis, A., Bakirtzoglou, P., Souglis, A., & Bekris, E. (2025). Seasonal Changes in Performance Metrics, Hormonal, Hematological, and Biochemical Markers Among Semi-Professional Soccer Players: Implications for Training and Recovery. Journal of Functional Morphology and Kinesiology, 10(2), 147. https://doi.org/10.3390/jfmk10020147