Article

A Novel Loss Model to Include the Disruption Phase in the Quantification of Resilience to Natural Hazards

by
Davide Forcellini
1,*,
Julian Thamboo
2 and
Mathavanayakam Sathurshan
3
1
Faculty of Civil and Environmental Engineering, University of San Marino, Via Consiglio dei 60, n. 99, 47899 Serravalle, San Marino
2
Department of Civil Engineering, South Eastern University of Sri Lanka, Oluvil 32360, Sri Lanka
3
Department of Civil Engineering, Faculty of Engineering, SLTC Research University, Padukka 10500, Sri Lanka
*
Author to whom correspondence should be addressed.
Infrastructures 2024, 9(3), 38; https://doi.org/10.3390/infrastructures9030038
Submission received: 7 January 2024 / Revised: 19 February 2024 / Accepted: 21 February 2024 / Published: 22 February 2024

Abstract

:
Resilience of systems to natural hazards has become an interesting concept in civil engineering and it is based on the determination of the losses due to the impacts of natural hazards. In the last decades, many contributions have focused on the assessment of losses that may occur at the time of the event, as generally assumed for earthquakes. However, this assumption may be incorrect when the interval between the time of occurrence and the time when the system functionality reaches the minimum value needs to be considered. This paper aims to propose a novel method to quantify this interval, which is called disruption time, by proposing a novel formulation of the loss model based on infrastructure redundancy. The proposed method was herein applied to a case study that considers landslides in Sri Lanka. The main goal of the paper is to propose a formulation that can be implemented in a more comprehensive framework to calculate more realistically the resilience of systems to natural hazards.

1. Introduction

Modern societies are based on the interdependency of different civil systems that are particularly vulnerable to the impacts of natural disasters. The assessment of resilience to natural hazards has been developed in the last decades. In particular, the definition of loss models is one of the key points in the assessment of resilience to natural hazards. Some methodologies have been proposed to assess the direct costs and the indirect losses, such as in Brookshire et al. [1]. In Adey et al. [2], direct costs are considered as the losses that the owners sustain to recover the infrastructure, such as the costs of materials and labor necessary for the recovering process. On the other hand, indirect costs may be defined as the losses that affect the users of the infrastructure, because of failure or closure (e.g., time delays, interruptions of goods and services) [3]. In particular, Cimellaro [4] considered that indirect losses may be estimated by expert judgments in order to consider the socio-economic consequences on the infrastructures. Several papers considered indirect losses by focusing on bridges, such as [5,6,7,8]. In other studies [9,10,11,12], the role of indirect losses for bridge configurations has been considered in detail. Ranjbar and Naderpour [13] proposed two sources of indirect losses: economic costs and losses due to casualties.
Following this background, the reduction of the pre-event functionality due to the natural event is commonly considered to occur at the time of occurrence of the event. In other words, the disruption phase (the interval between the time of occurrence and the time when the system functionality reaches the minimum value [14]) has not been considered in previous methodologies. This assumption may be considered realistic only for earthquakes but not for the other natural disasters. In order to cover this gap, the presented paper aims to propose a loss model to quantify the disruption phase that needs to be considered for many natural hazards (e.g., volcanic eruptions, hurricanes, landslides). The loss model assumes that the level of infrastructure interdependency may be used to quantify the disruption phase due to natural hazards, such as hurricanes, floods, etc. In particular, the herein disruption has been assumed to depend on the level of redundancy between interdependent systems that share their functions and operations. For example, when a disruption or a failure in the main system occurs, it may compromise the delivery and the transportation of products, services and people on the other interconnected systems. Moreover, because of the level of interconnectivity, the functionality of the linked system may reduce and be degraded. This may cause problems to the whole community in terms of indirect losses (loss of connectivity and prolongation of time, as discussed in [3]).
This paper is organized into seven sections. In Section 2, the traditional definition of resilience is discussed in order to define the original formulation developed in Section 3. The role of redundancy is considered with the aim to propose a parameter to define several levels of disruption phase. In Section 4, the proposed loss model has been applied to a case study of landslides in Sri Lanka. The results are presented in Section 5 and discussed in Section 6, followed by the conclusions.

2. Definition of Resilience

Resilience of systems may be defined by various dimensions, as described in Elms [15]. The author considers resilience as the ability to maintain or restore the flows between surroundings. There are several components of the mentioned flows: (a) the source, (b) the destination and (c) the channel and different strategies to maintain a certain level of resilience:
(1)
Maintaining the integrity of the source (e.g., the natural or artificial resources, such as water or electricity);
(2)
Reducing the damage to the channels (e.g., by building robust infrastructures and buildings);
(3)
Reducing the impacts (e.g., by building countermeasures and defensive systems, such as seawalls for tsunamis, as studied in [16]);
(4)
Performing recovery procedures (e.g., the introduction of buffers to maintain the flow for a limited time when a channel is damaged or destroyed [15]).
Moreover, the management of several typologies of resources such as economic, human, social and technological need to be considered together with the way in which these resources interact. For example, economic resources are fundamental in order to maintain the level of employment, possibilities of purchasing goods and supporting services that may significantly affect the level of resilience of civil systems subjected to natural hazards. In [17], a methodology to quantify resilience was proposed and the authors considered two models: the loss model and the recovery model. The first model represents the reduction of the functionality of the system due to occurrence of a natural event. The authors considered that the losses occur at the time of the event, as generally assumed for earthquakes. However, this assumption may be incorrect for natural hazards that require the definition of a disruption phase and, thus, there is the necessity to define a more representative loss model. In particular, [17] calculated the resilience of civil systems as:
R = t 0 E t 0 E + T Q ( t ) T d t
where
t0E is the time of occurrence of the event E,
T is the time frame (or recovery time) necessary to restore the functionality of the health infrastructure.
RT is the repair time due to system for the recovery process.
Q(t) represents the recovery process to reach a new level of functionality.
In particular, resilience represents the area below the curve Q(t), while the recovery model describes the recovery process until the moment when the system has recovered to a suitable level of functionality (not necessarily the original one). In this regard, an innovative approach to assess the seismic resilience for structures was proposed in Forcellini [18]. The loss model quantifies the reduction of Q at the time of occurrence and is represented by the vertical line in Figure 1. This line shows the difference between the initial functionality Q and the reduced functionality Q0. It is worth noting that such a definition was developed for earthquakes for which the absence of the disruption phase may be reasonable [14]. However, for other natural hazards, the damage may be not considered instantaneous and thus more realistic definitions of the loss model that consider the disruption phase are necessary.

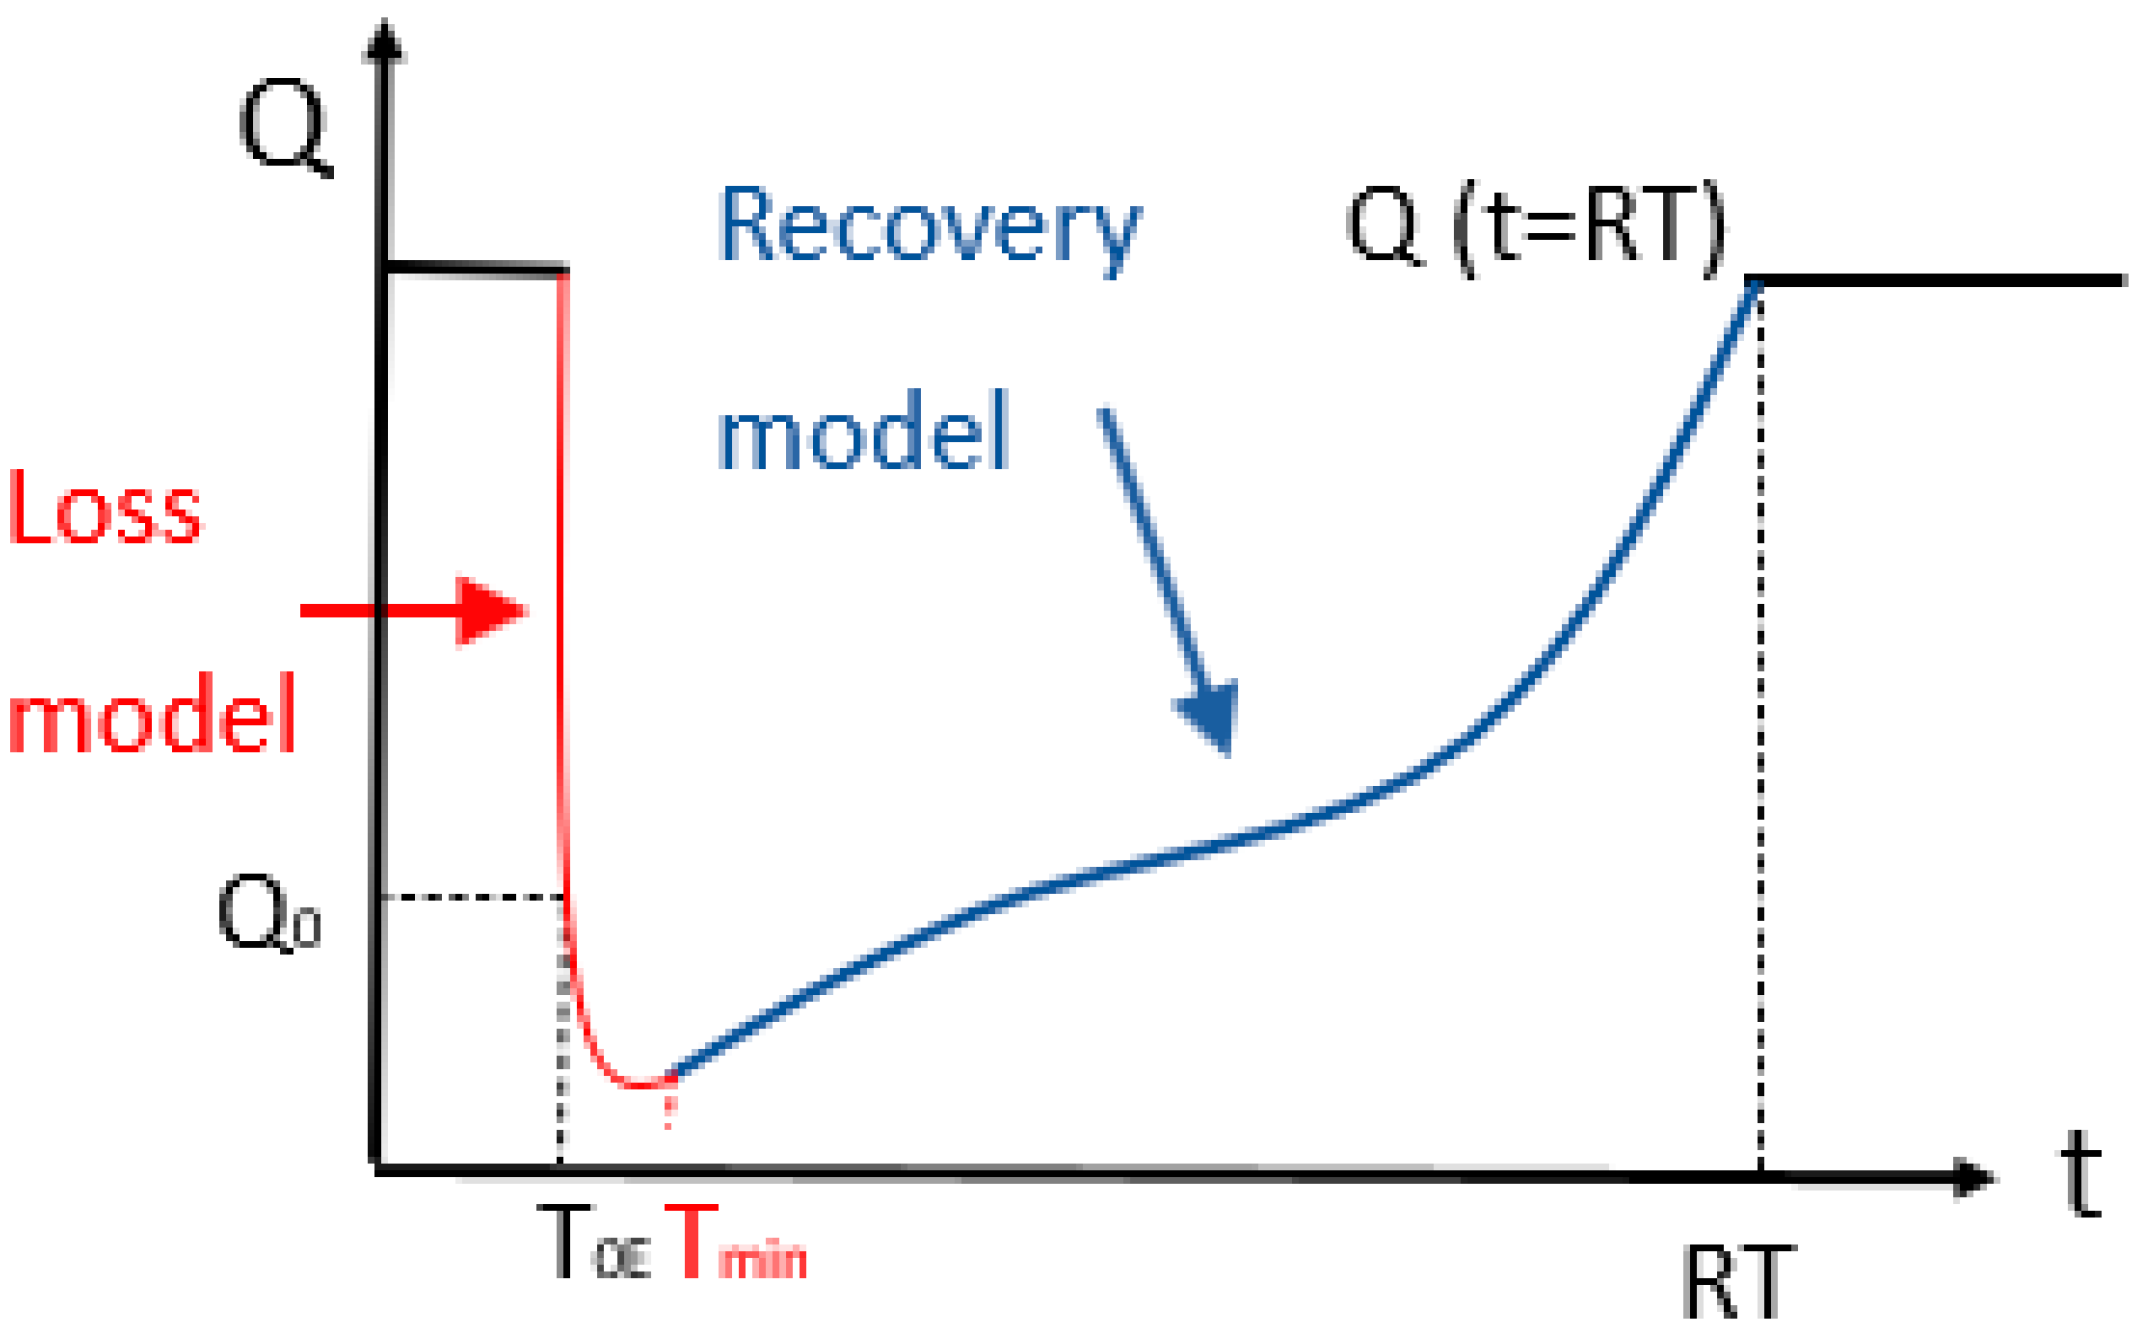
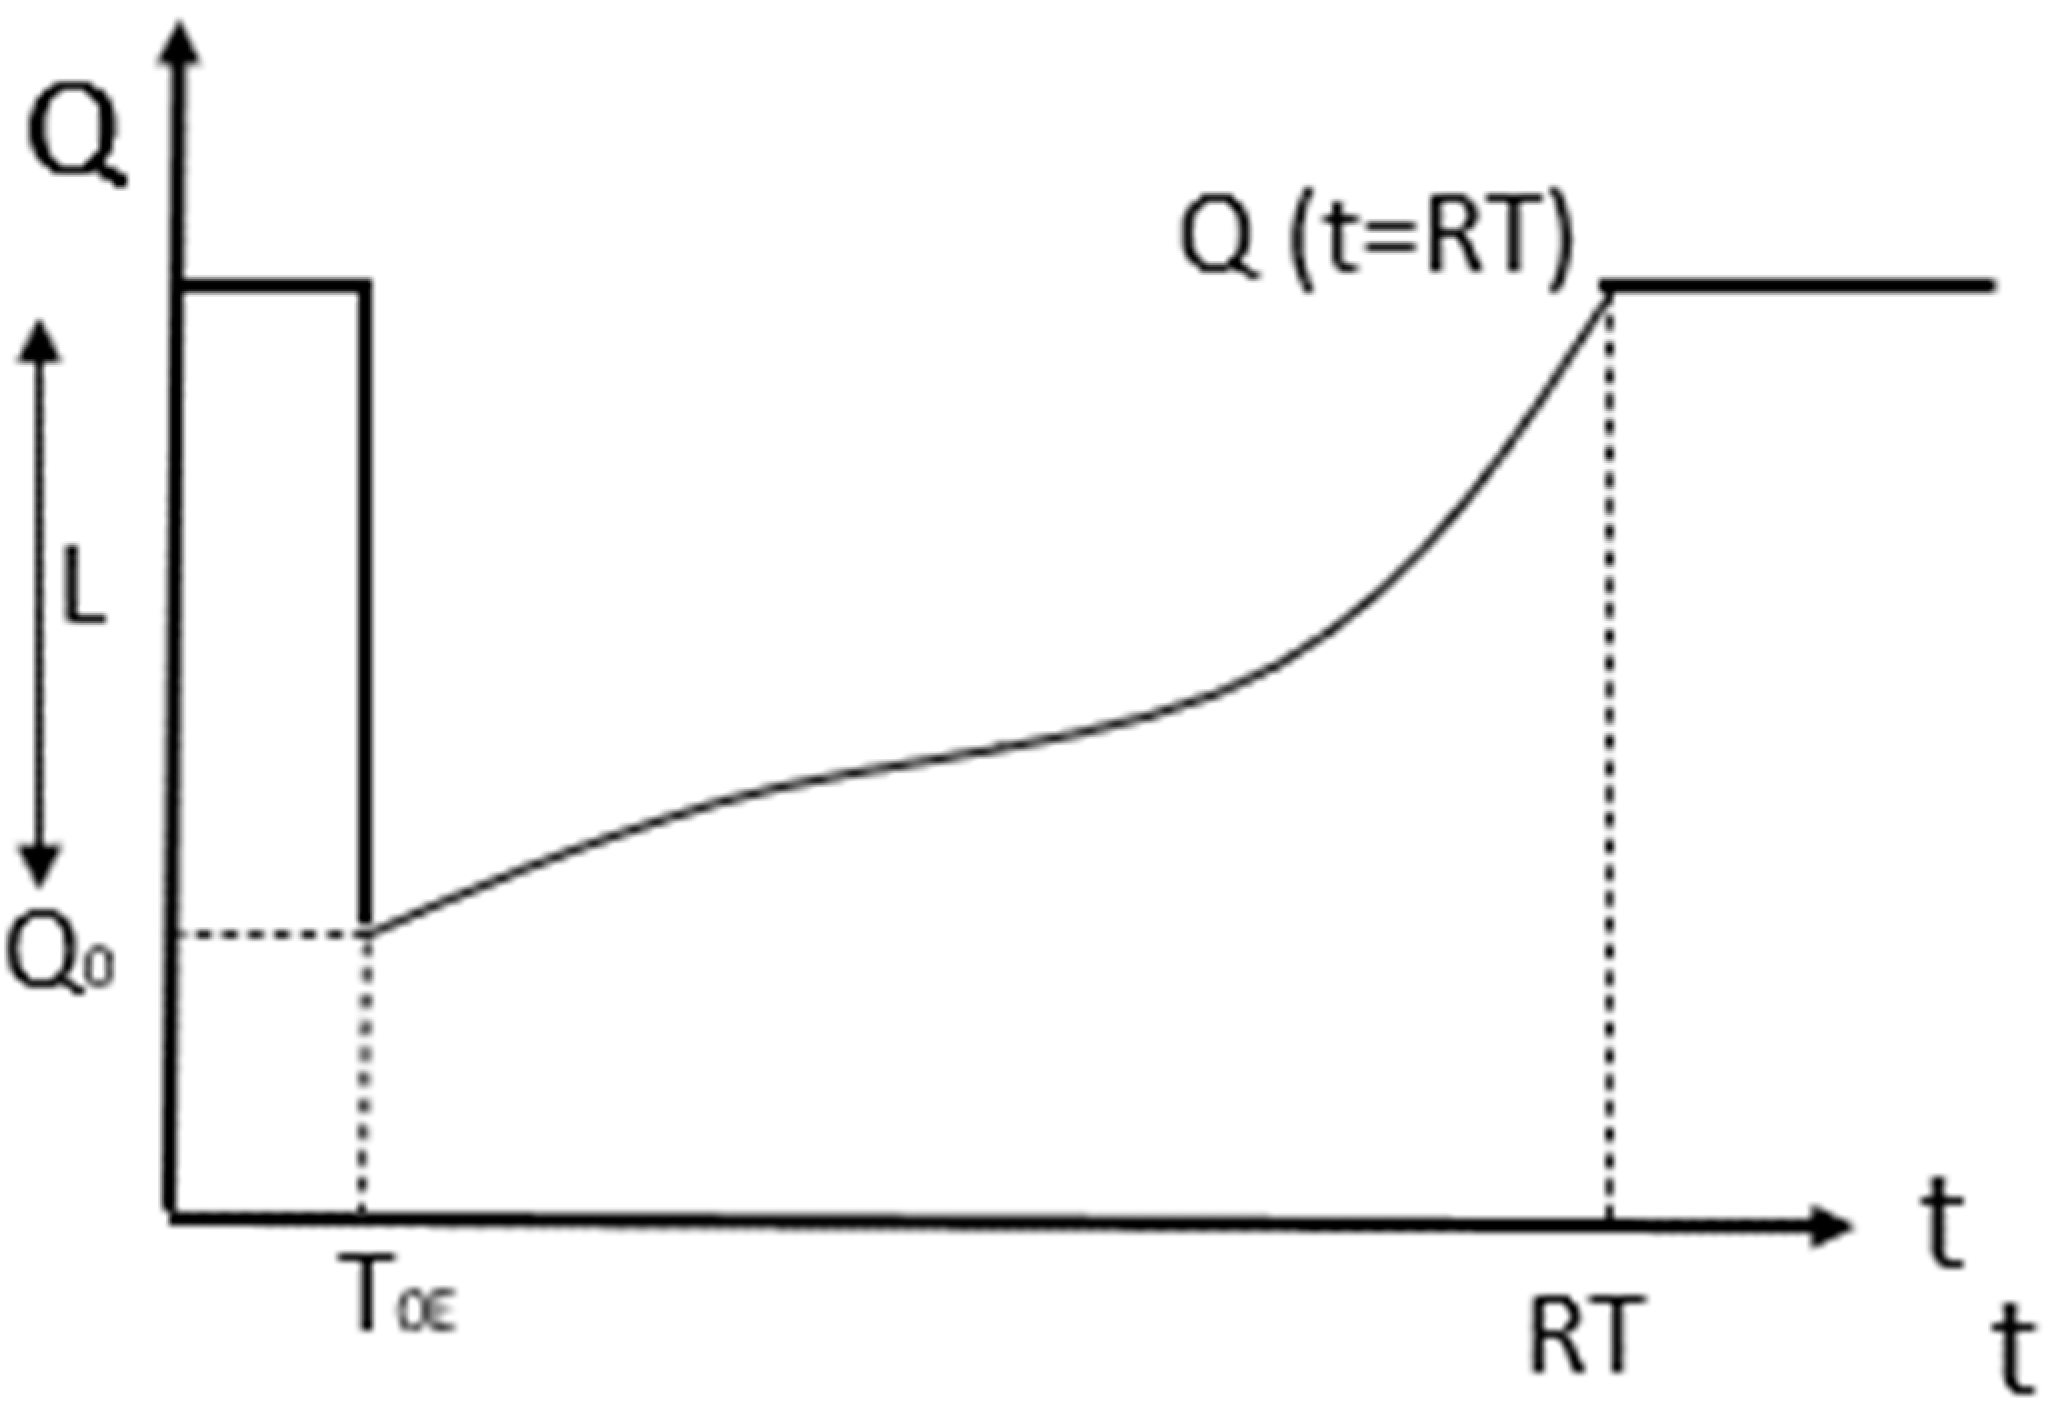
3. A Novel Loss Model

This paper aims to present a novel calculation of losses that considers the disruption phase in the assessment of the resilience of systems. In this regard, it is worth considering that resilience is affected by the level of interdependency between infrastructures, their geographical proximity, and the sharing of their functions and operations [3,15]. Therefore, the assessment of the level of redundancy is fundamental in the evaluation of the resilience of civil systems. For example, when a disruption or a failure in the main system occurs, it may compromise the delivery and the transportation of products, services, and people on the other interconnected systems. Moreover, because of the level of interconnectivity, the functionality of the linked infrastructure may reduce and be degraded. This may cause problems to the whole system in terms of indirect losses (loss of connectivity, prolongation of time, etc.). The level of redundancy is particularly important in the case of road networks (for example, integrated systems in urban regions, such as metro and bus service network, intermodal transport network, etc.). In this regard, redundancy is the parameter that measures the level of interconnection between intermodal transportation since the traffic demand may be transferred from different transportation modes in case congestion or disruption occurs in one mode of the network. On the contrary, complexity of the network may be caused by high interdependence among different systems or modal systems, leading to management problems during damage or failure (e.g., cascading effects). Several other challenges in assessing the resilience of systems consist of non-measurable aspects, as discussed in Norris et al. [19]. In [20], the assessment of resilience was considered by implementing public participation to balance the multiple conflicting tensions. In the literature, several contributions have proposed considering a trapezoidal scheme of resilience [21,22,23,24]. In particular, ref. [23] named “degradation” the disruption phase and considered a linear trend for power systems. In addition, ref. [24] described the disruption as the phase where corrective actions are taken with the aim to mitigate the impact of the external shock, and initiate the process of recovery. Such methods were implemented for energy systems. Other researchers applied similar definitions of the disruption phase to infrastructures [25,26]. Podesta et al. [27] studied the relationship between inundation with hazard impacts by considering the restoration time for the community to return to the previous functionality after hurricane Harvey in Houston, Texas. Other contributions [28,29,30,31] considered vulnerability and recoverability as the two primary dimensions of resilience. In particular, ref. [30] considered the restoration of interdependent infrastructures by considering socio-economic and demographic information to describe how natural disasters may affect the community. Jönsson et al. [31] considered that the disruption phase depends on the vulnerability of the system since it is due to “the magnitude of damage in network performance”. In particular, the existing literature [32,33,34,35,36] depicts the lack of models and provides a good insight about the proposed framework.
The main benefit of the proposed modified formulation is to propose a quantitative approach that may integrate the existing methodologies to calculate the resilience to natural hazards. It is based on the assumption that interconnections between the systems is a key parameter for defining the disruption phase. In particular, within the five phases (described by Øien et al. [37]) the so-called absorb/withstand phase corresponds to the loss model that is herein proposed in Table 1 and shown in Figure 2 (red line). In particular, the disruption phase is described with this formula:
Q ( t ) = Q 0                                                       t = T 0 E Q 0 ( t T 0 E ) r ,                                         T 0 E < t < T m i n ,     Q ( t ) ,                                               t T m i n        
It is worth noting that the disruption phase ( T 0 E < t < T m i n ) is defined by the coefficient r that describes the shape of the curve. This coefficient needs to be calibrated on the level of infrastructure redundancy performed during previous events. In this paper, three levels of redundancy are considered to model different degrees of interconnections between the various infrastructures.

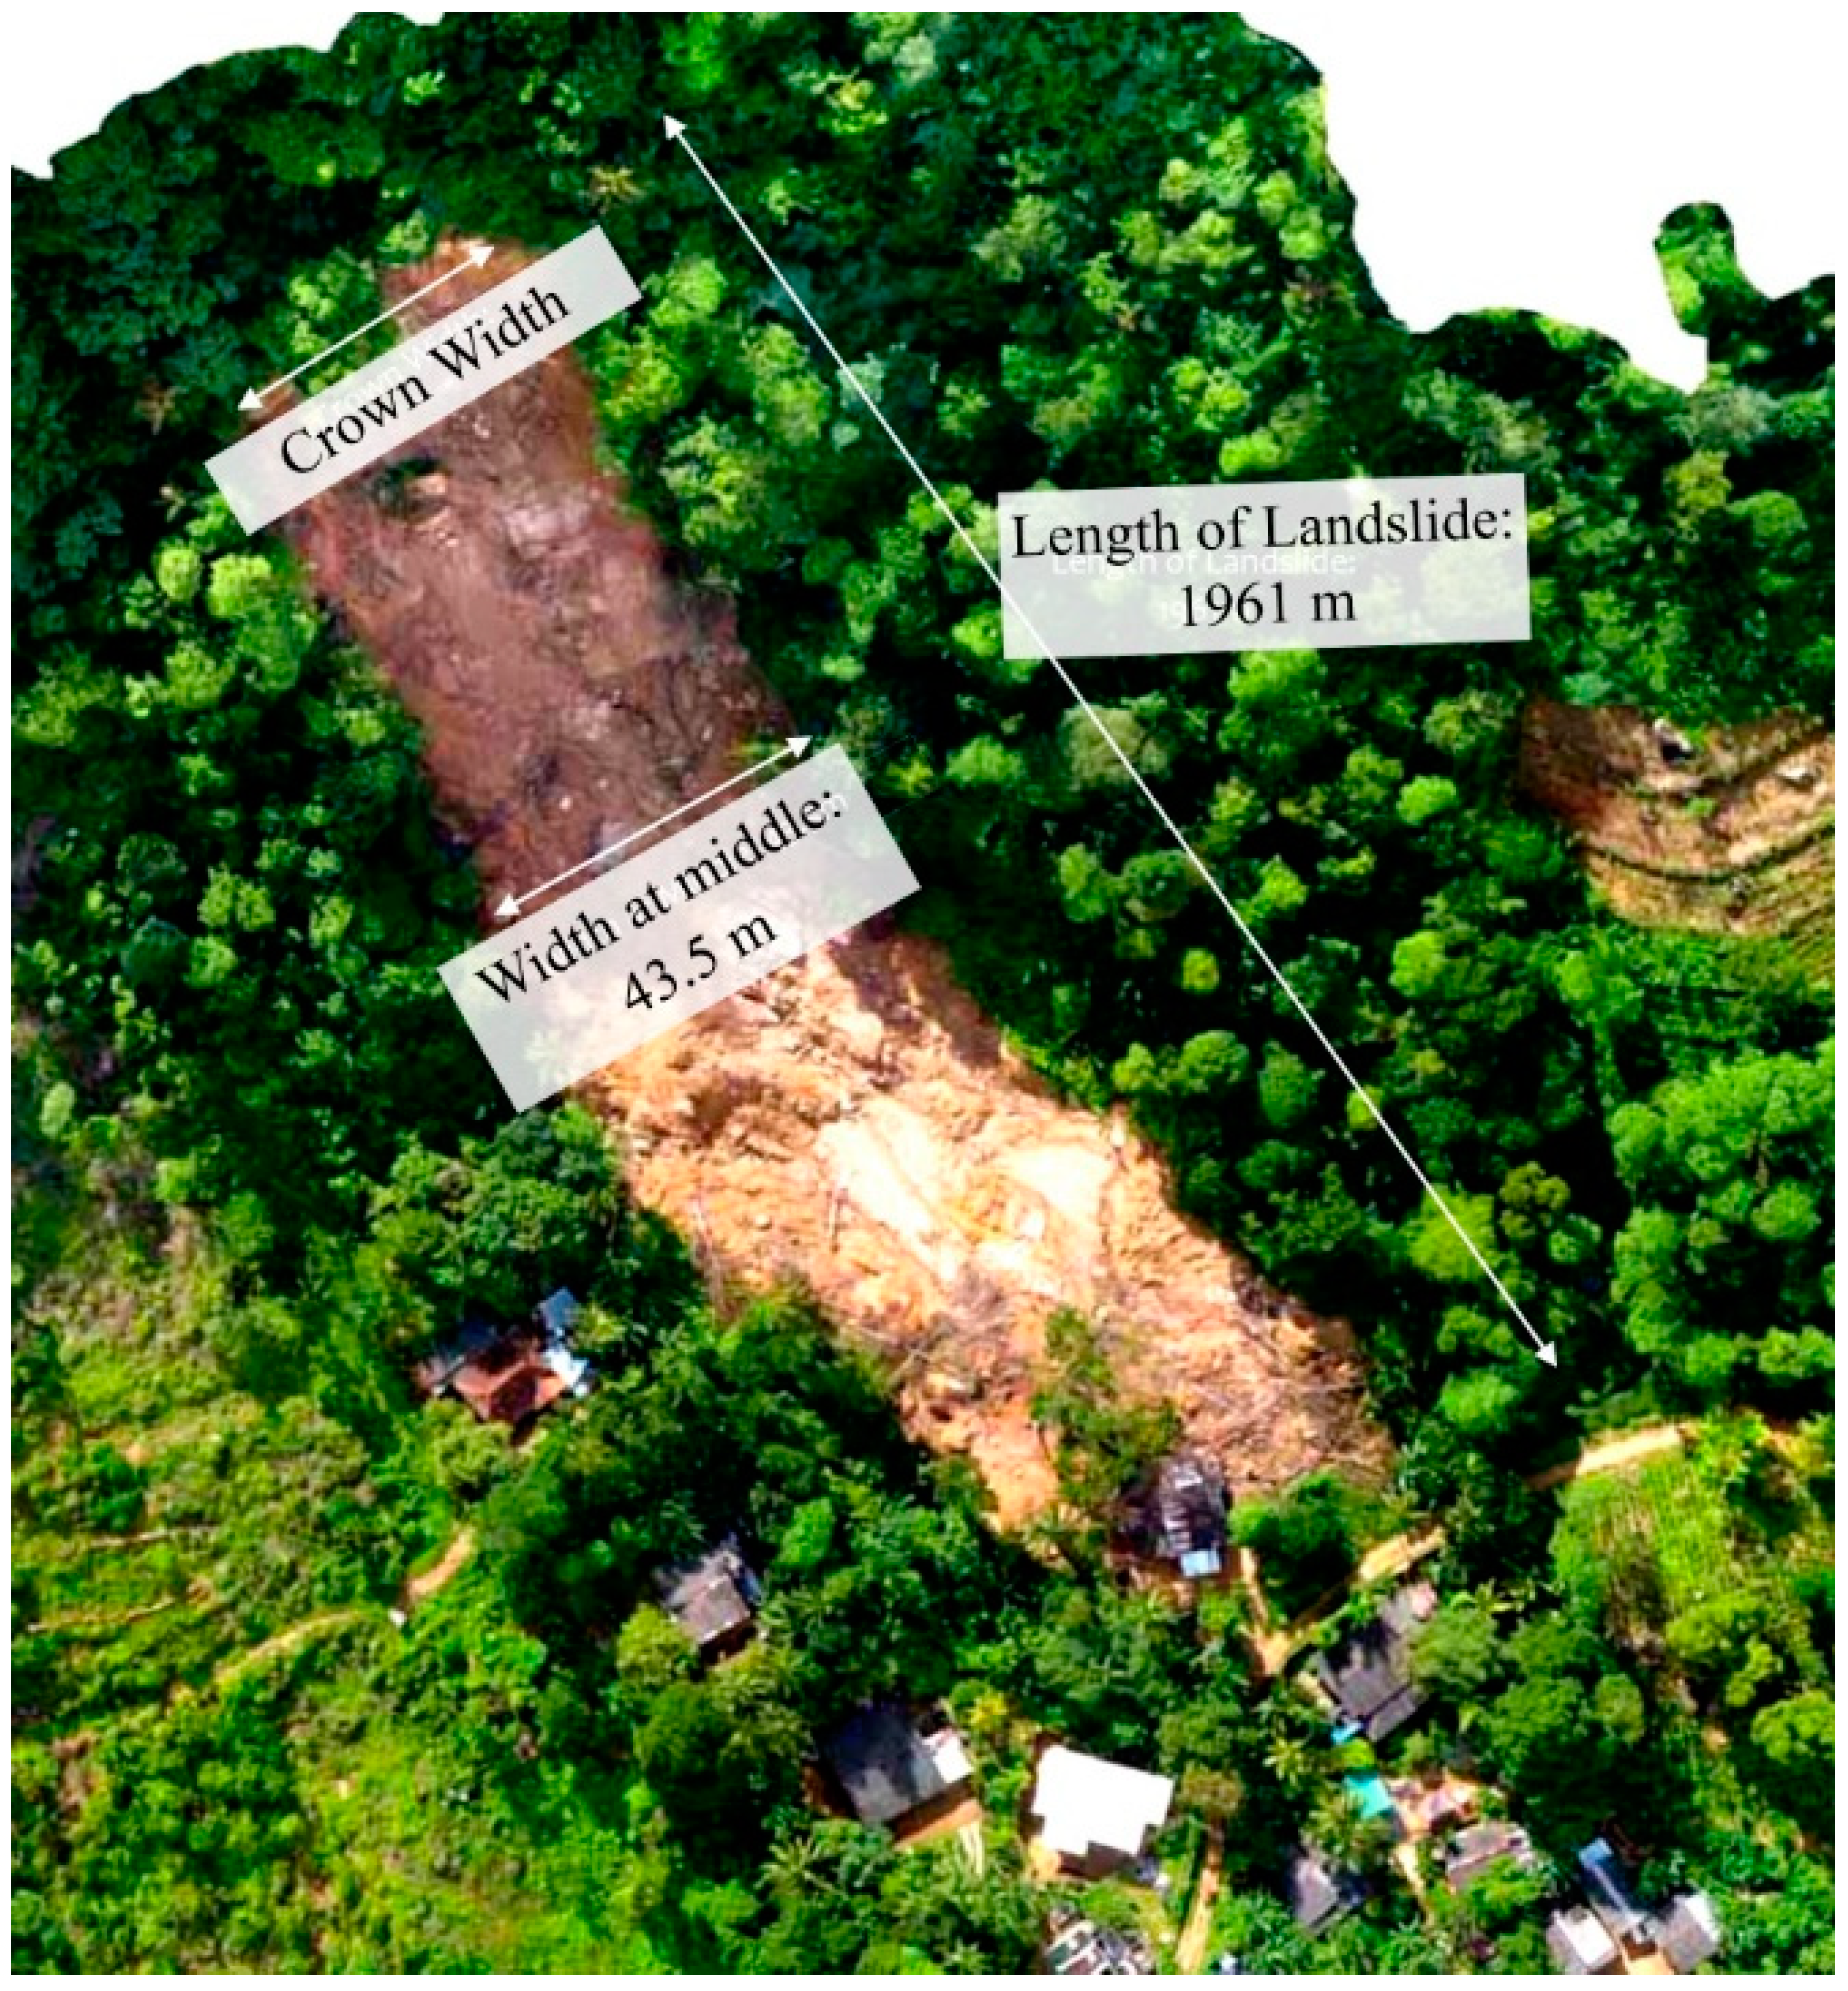
4. Landslides in Sri Lanka

This section aims to apply the proposed loss model to a case study to demonstrate the importance of the disruption phase in the assessment of resilience. The landslide damage data available in Sri Lanka were used to adopt the proposed model for the loss model. Therefore, a brief outline of the landslides in Sri Lanka is provided for the sake of completeness. Sri Lanka is an island nation with 65,610 km2 land area, out of which one-third of the land mass is identified as prone to landslides. The landsides in Sri Lanka are induced by heavy rainfall, causing substantial acute losses during the monsoon season (May to September) [38]. Figure 3 (a: hazard zonation and b: contour map) shows the landslide hazard map developed by the NBRO [39]. It is worth noting that in Sri Lanka, most of the mountainous districts are predisposed to landslides during the monsoon seasons. The hazard map was updated with a topological contour map of the country. The contour interval was selected as 150 mm, to reduce the congestion on the map. It can be noted that the topologies and landslide hazards have strong correlations: extreme hazard concentrates in correspondence with higher variations in elevation.
In Sri Lanka, the risk of landslide is ranked second to that of floods, in terms of economic and human losses. Landslides caused 242 deaths between 2008 to 2018 [40] and caused economic loss estimated as the 0.2% of the total GDP [41]. However, the assessment of the exact loss estimates (direct and indirect) is extremely challenging and the actual economic loss could be significantly bigger that what is determined [42]. Even if recurrent landslides occur, about 45% of the total population live in the landslide-prone zones. Some of the residential buildings damaged due to landslides are shown in Figure 4. The level of the damage depends on the intensity and exposure conditions. This implies the need for systematic landslide adaptation, mitigation and resilience studies in the country. Also, the frequency of landslides has increased over the years and recently the Global Climate Risk Index agency [43] considered Sri Lanka the second most vulnerable country to weather-related loss events (after Perù).

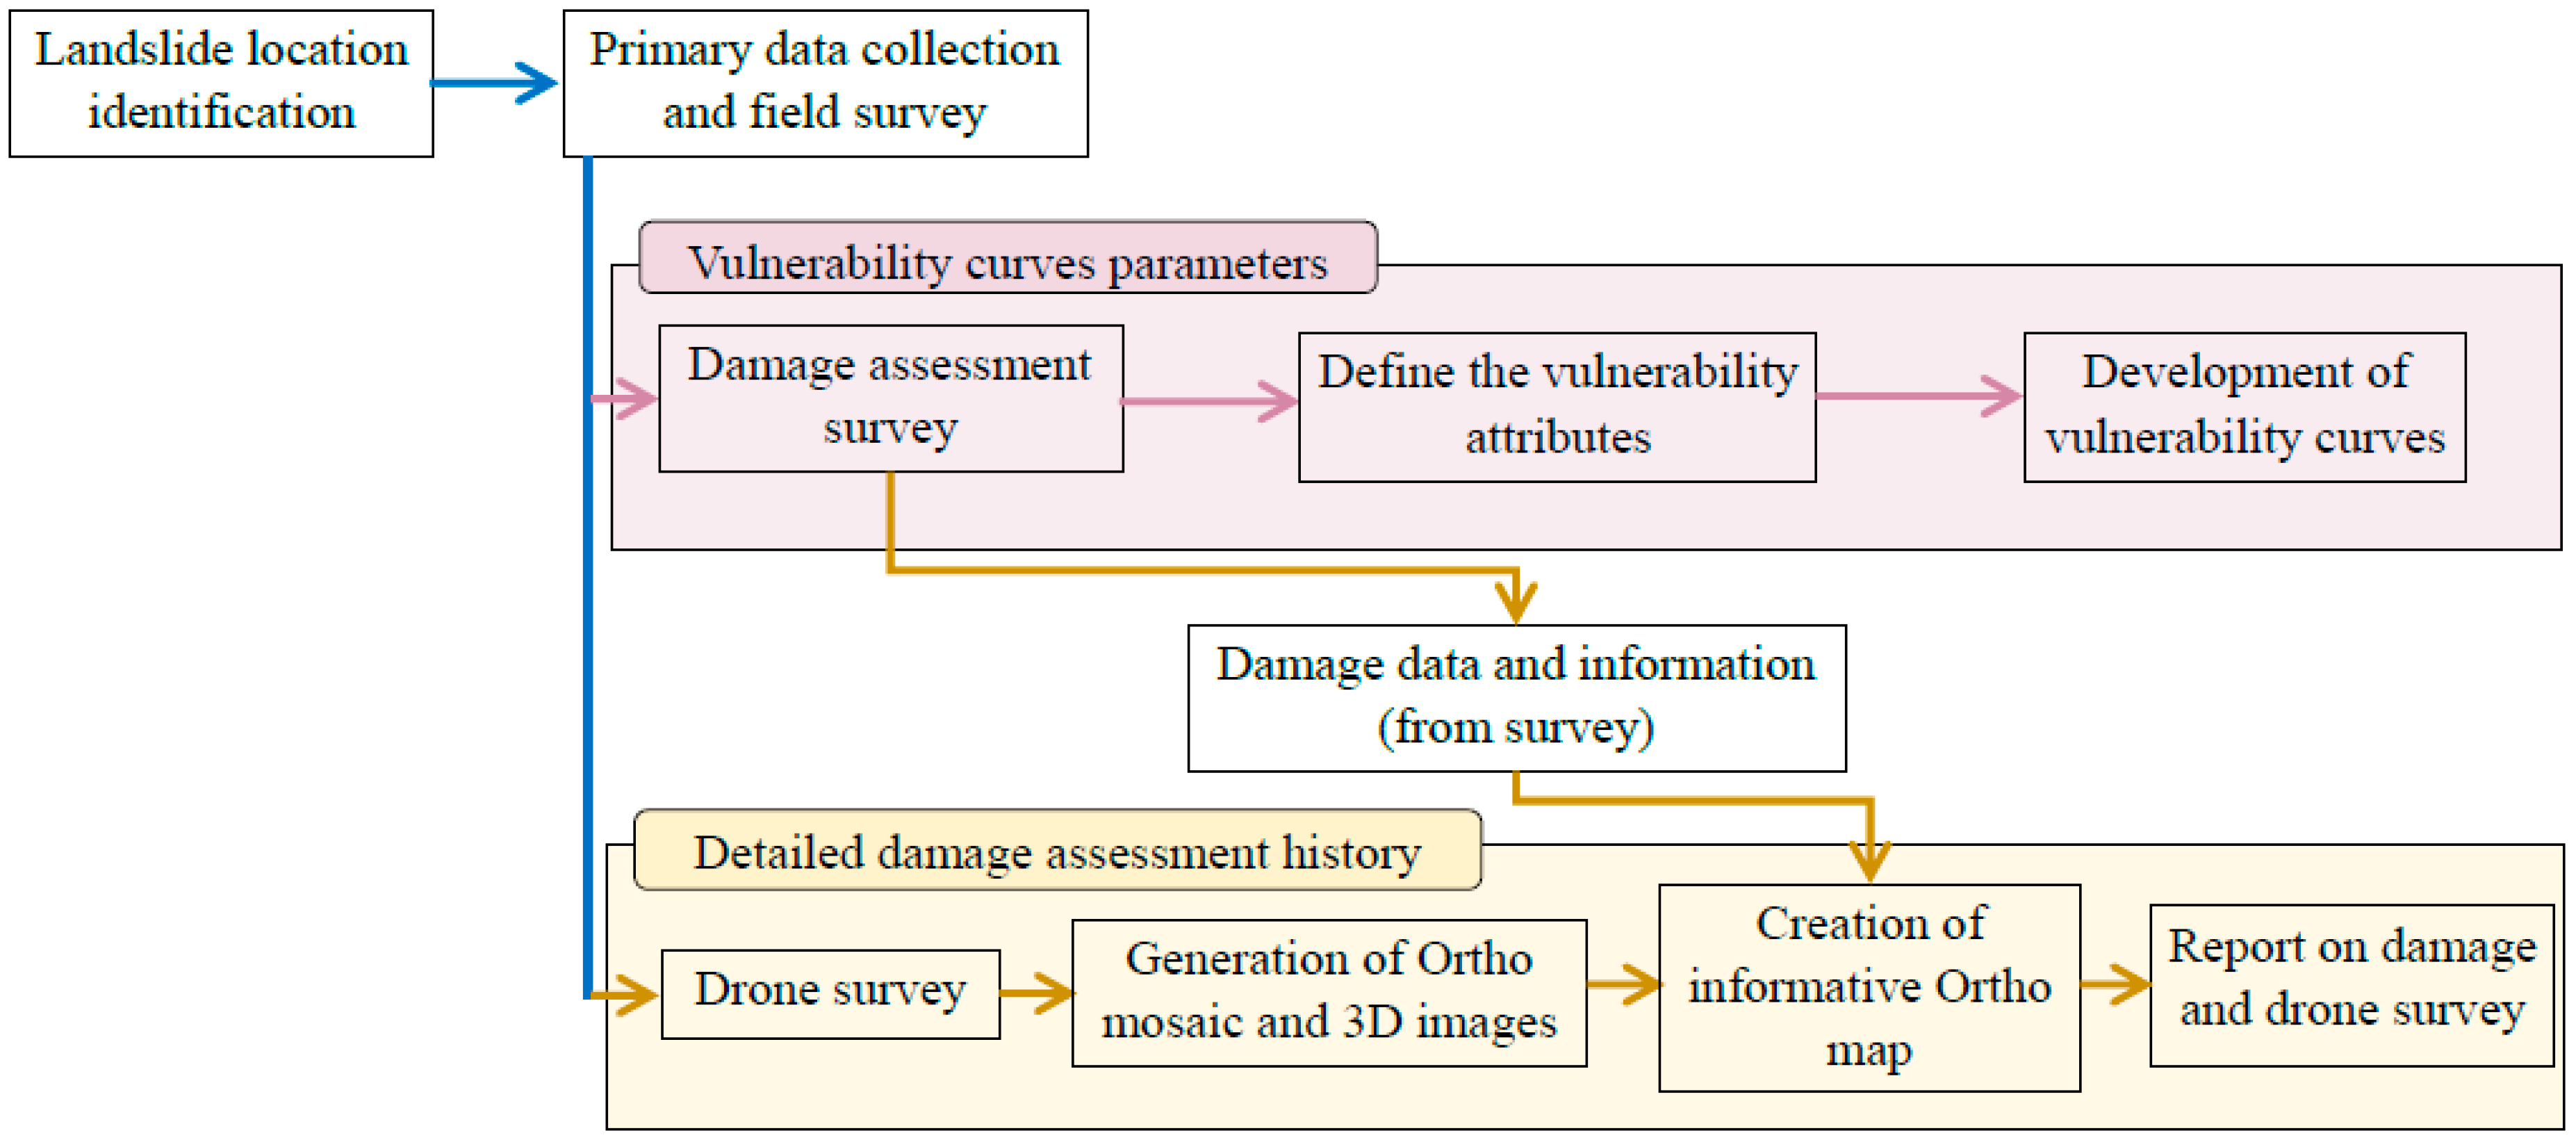
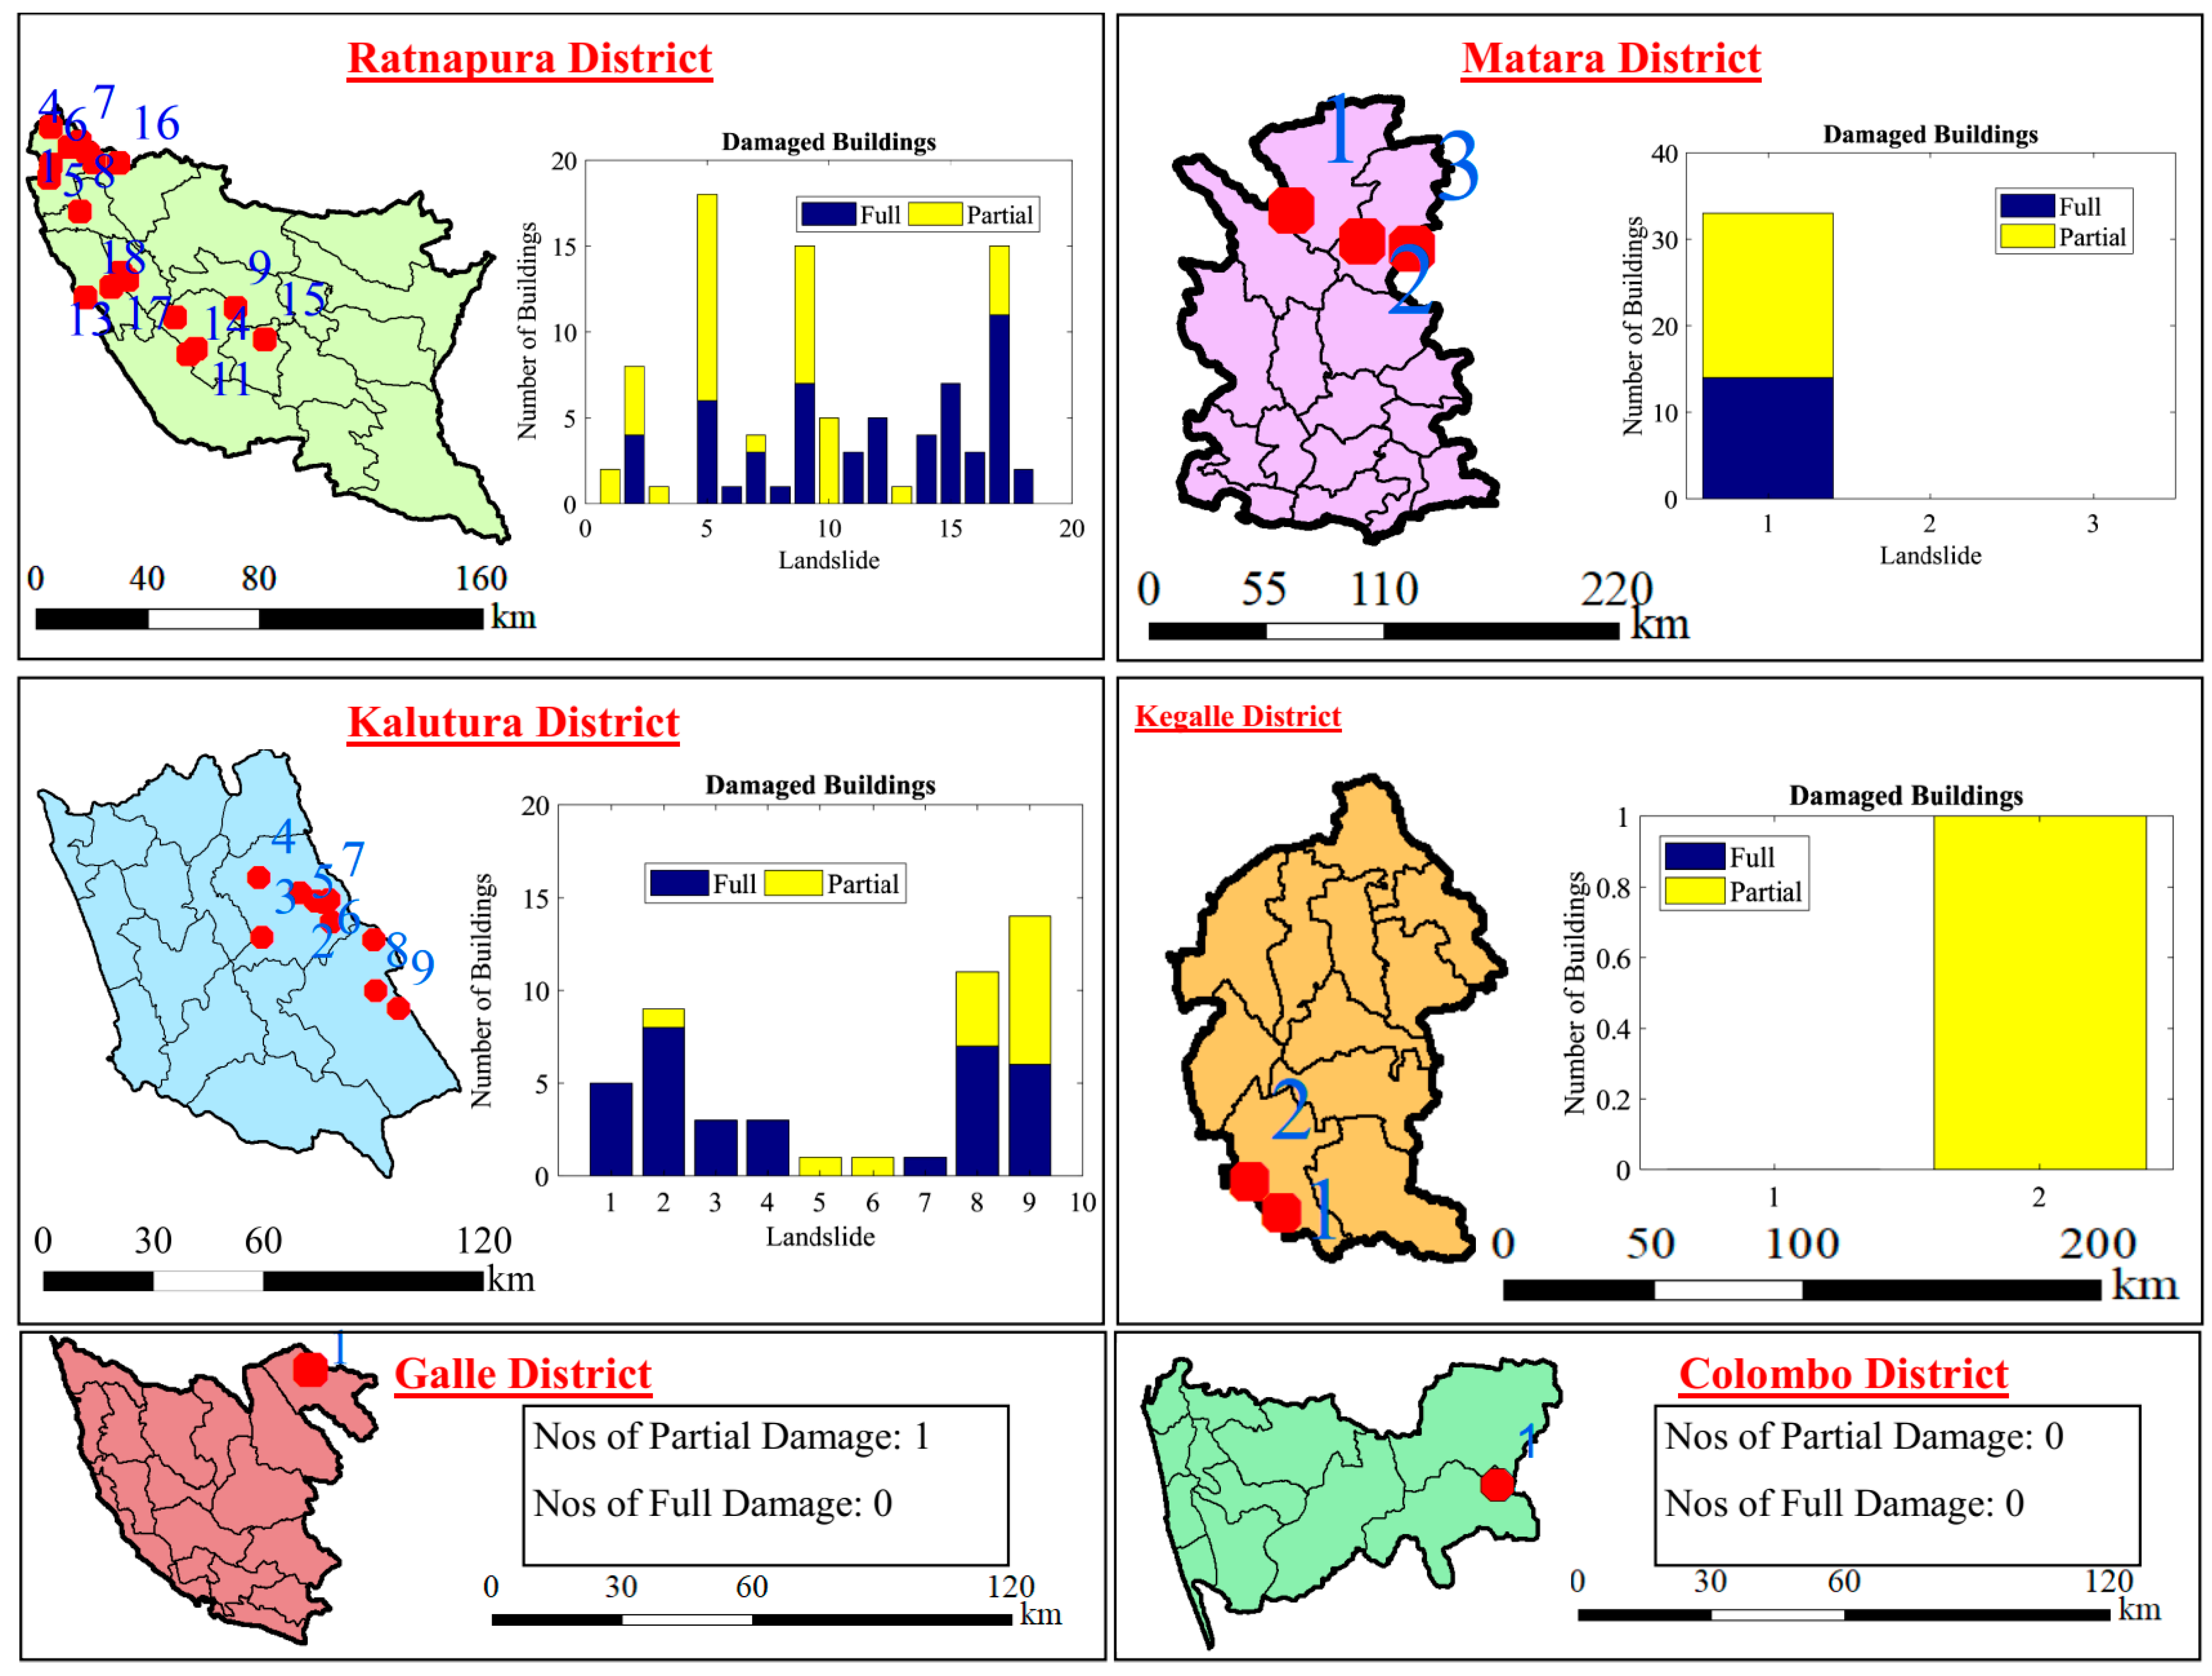
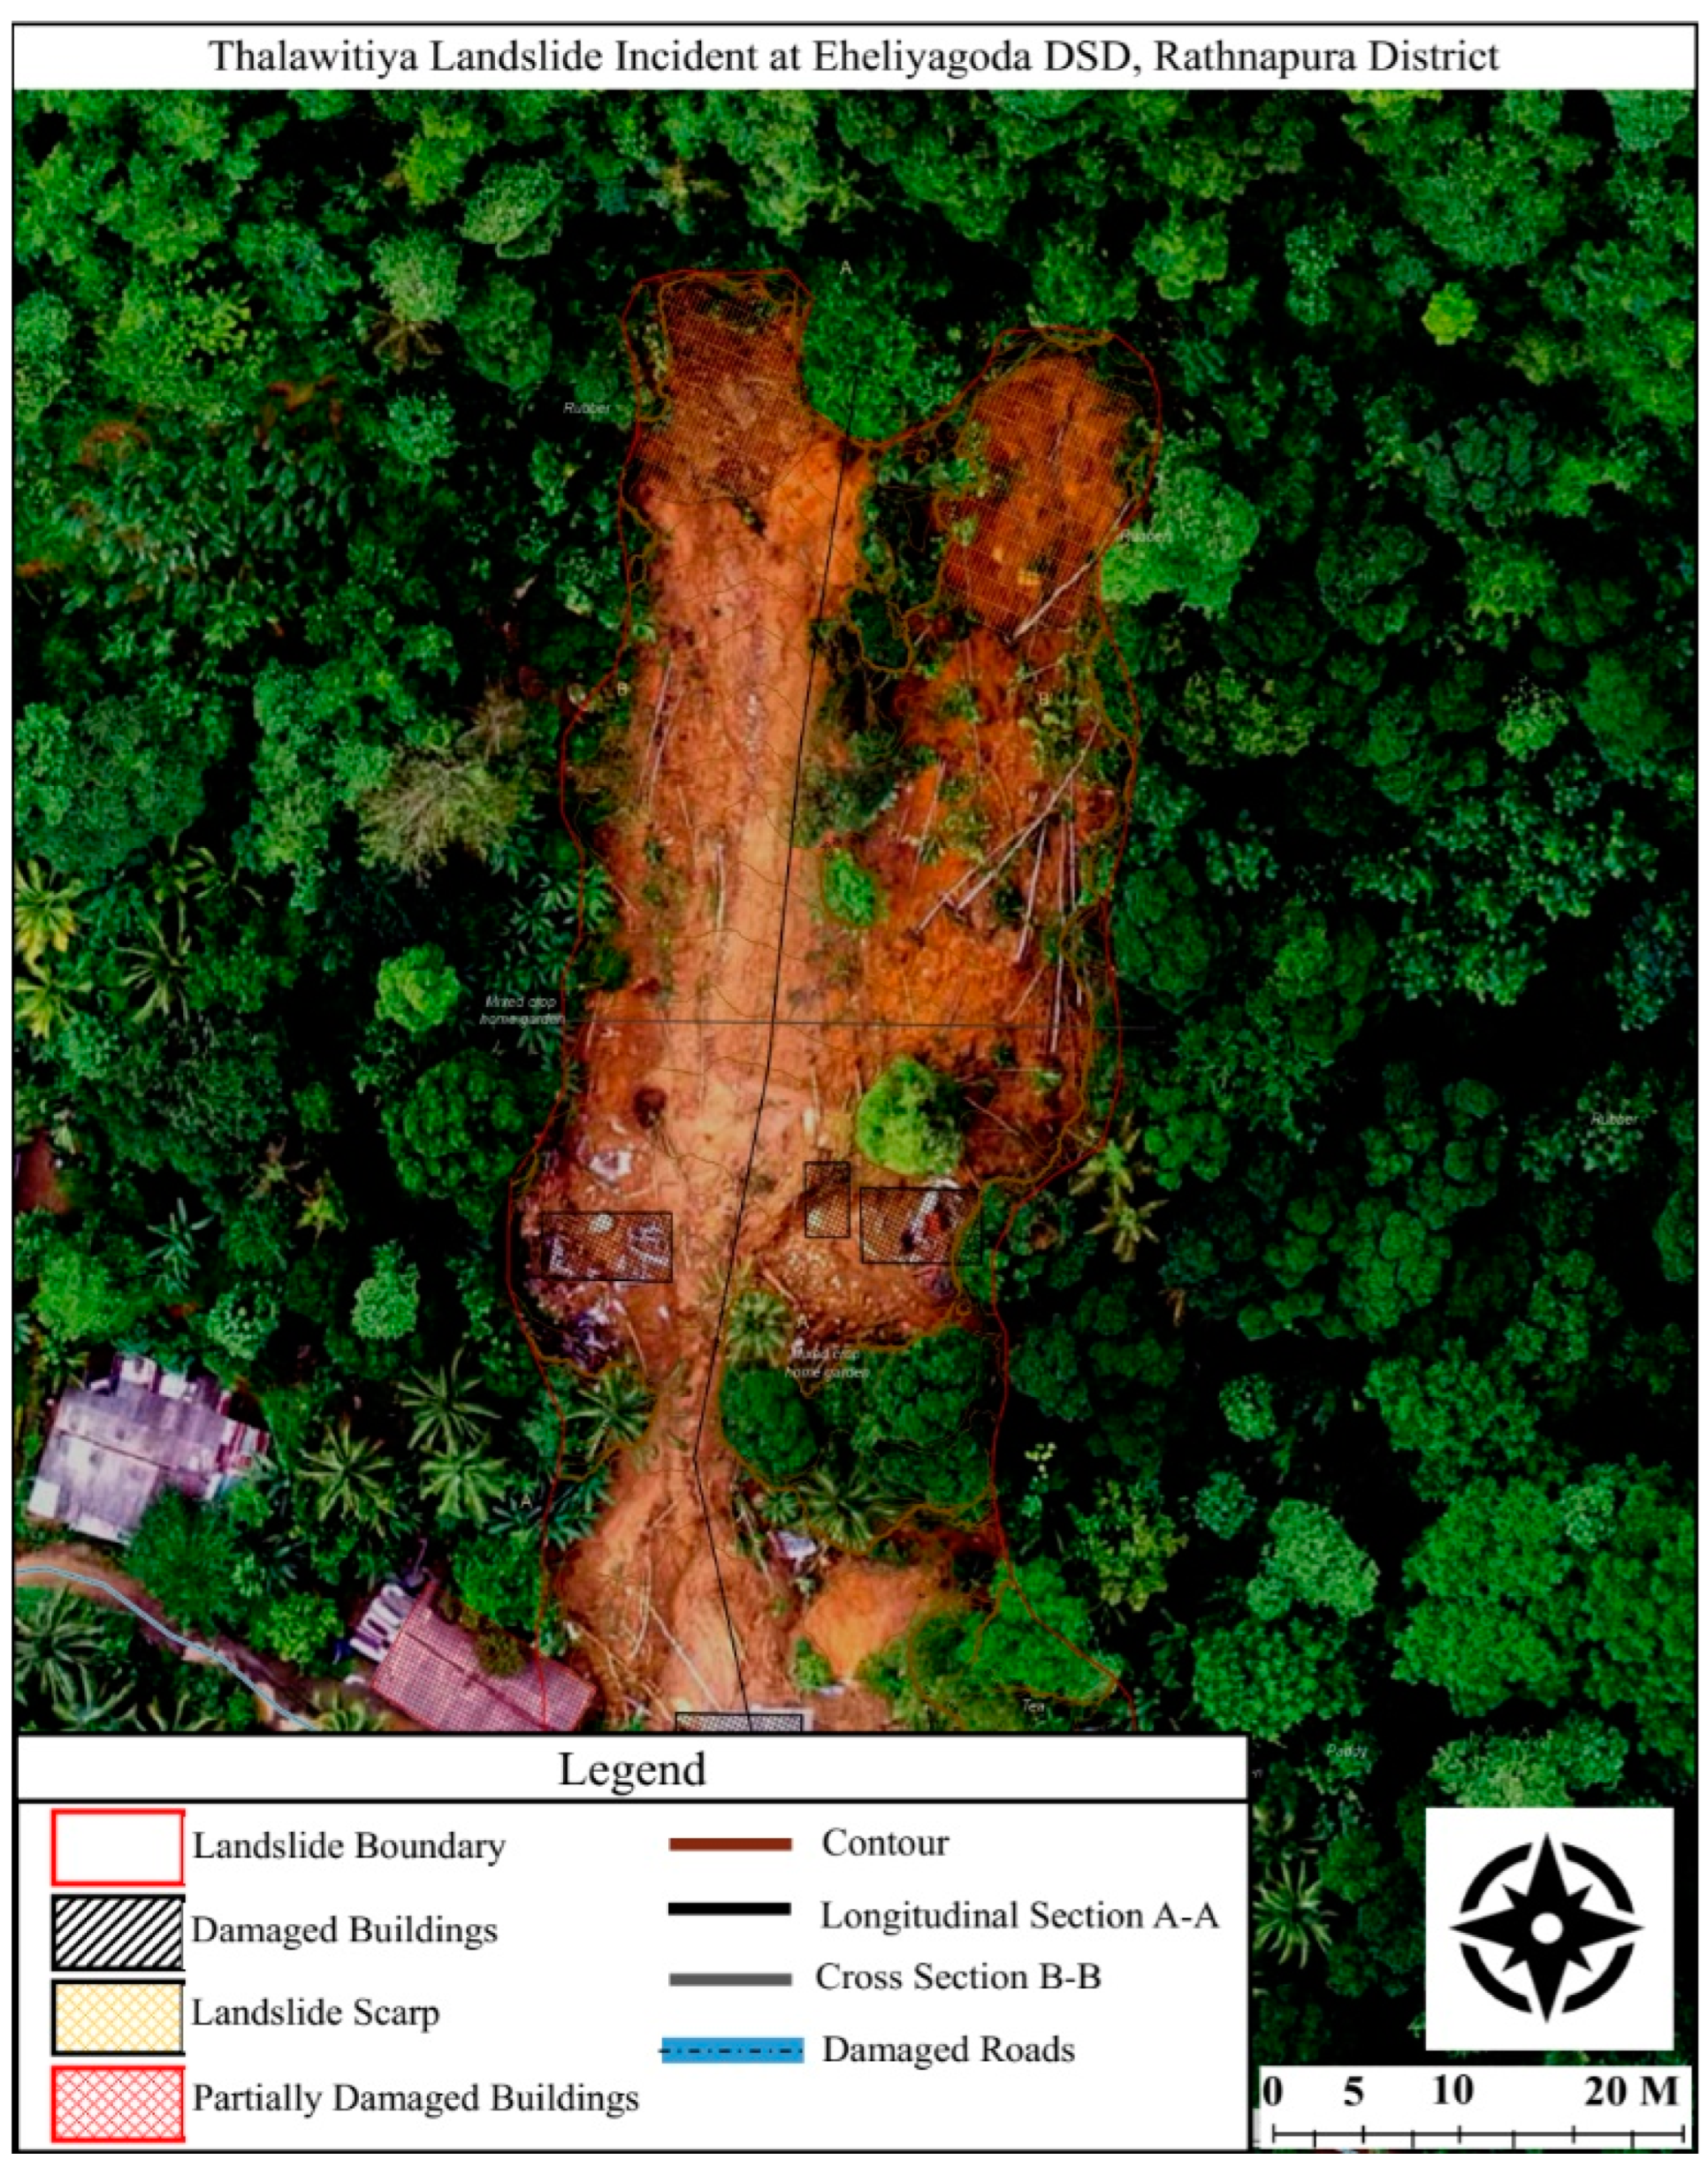
Landslide Damage Data

The Southwest monsoon season (May to September) is the wettest period in Sri Lanka and the majority of landslides occur during this season inside the hazard zone highlighted in Figure 1. The National Building Research Organisation (NBRO) is mandated to monitor and assess the landslide risks in the Country. The damage and loss data used in this study to assess the LR were the objects of a study carried out by NBRO. The data include the extent of the landslides measured through unmanned aerial vehicles (UAVs). The methodology used by NBRO to record the landslide losses is shown in Figure 5. Initially, the landslide location was identified, and field reconnaissance work was carried out via UAV. Then, using the UAV details, landslide orthomosaic images were generated and 29 landslide events were recorded, as shown in Table 2. The details retrieved from the database are the geo-locations, crown width, crown height and length of the landslides. In addition, the data contained the details of the number of fully and partially damaged buildings with the extent of percentage of losses from the total buildings which existed prior to the landslide.
Figure 6 shows a sample aerial image of a landslide, where the geo-physical features of the landslide are marked. The crown (width and height) is defined as the un-displaced portion of the land, at the top of the main scrap of the landslide. The intensity of the landslide was calculated as the product of the volume of the land mass movement from the crown width and the length of the landslide. The intensity was then considered related to the landslide damage of the buildings. In this study, the intensity of the landslide was considered as the volume of the landmass movement by calculating the crown width and length. Other parameters that may affect the intensity (such as the kinematics of the landslides and their mechanics) are particularly challenging to be assessed since they are not available in post-disaster measurements. Therefore, in this paper these parameters were not applied in the calculation of the LR. Most of the single dwelling residential buildings in Sri Lanka are built with masonry assemblages. Due to the low tensile and lateral deformation capacities, those buildings were damaged (partially or fully) under landslide movement.
Moreover, the degrees of the landslide damages and losses were determined by comparing the locations before and after the landslides using orthomosaic images. Figure 7 shows the image of the landslide and the damage which occurred to various systems, mainly the residential buildings. The highlighted region in red and black shows the extent of the damage. Table 2 shows the details of the completely and partially damaged buildings and the percentage of losses (%) with reference to the pre-existing buildings (computed as the ratio between the net area of the damage and the total area of the building). When more than 50% of a building was damaged due to landslide, it was assumed that those buildings had to be demolished (Figure 8). Subsequently, using these landslide characteristics and the damage data, the resilience against the landslide was evaluated.

5. Loss Model for Landslide in Sri Lanka

The loss model needs to be assumed to describe the reduction of functionality due to the impact of natural hazards, in particular for landslides. The assessment of resilience requires two important sources of losses, i.e., the direct losses and indirect losses, which in the case of landslides may be considered as the losses associated with the consequences on the civil environment, such as the relocation of people who tend to leave the damaged area temporarily or permanently. In this regard, the assumption here is that indirect losses may be connected with the level of redundancy since the functionality of modern societies is based on interdependency of several systems. Therefore, the success of regions may be significantly eroded by the failure of strategic systems and lifelines. It is fundamental to consider the various contributions of communities, such as the reserves, the redundancy of internal components and the interconnections with external communities. The calculation of the losses may be defined on the basis of several methodologies [44,45,46,47] or by considering empirical databases. For example, in [45] a probabilistic approach to assess the losses to landslides based on the road damage was proposed. The authors classified five level of damage (integrity, slight, moderate, severe damage and failure) by introducing a parameter L. A semiempirical approach was adopted by [44] that produced a risk map by considering the flood susceptible areas with the aim to assess the vulnerability of the highways in the state of Santa Catarina (Brazil).
In the present paper, the losses are computed on the basis of the percentage of the residential buildings that have been damaged inside the region affected by the landslide. This is an important issue with consequences for the community since the affected people needed to be temporarily housed or moved to other regions. The last three columns of Table 3 show the computation of losses for all the considered sites and for different values of r. These values have been used to assess the minimum of functionality (Qmin) as the complement to the losses. The loss model has been calculated with Formula (2) by considering several values of the parameter r on the basis of Table 2. In particular, the original functionality Q0 has been assumed to be 1 (100%). For a low redundancy scenario, three values of r were considered herein: 3, 6, 10. The last three columns show the values of the area below the loss curve, demonstrating the role of redundancy in decreasing the contribution of the losses. In particular, if the cases of percentage of losses at 100% are considered, the contributions of the losses decrease from 0.167, 0.067 and 0.019, respectively, for r = 3, 6 and 10.

6. Discussion

The results presented in the previous section demonstrate the importance of assessing the disruption phase in the calculation of resilience to landslides. The proposed methodology is based on the definition of one parameter that represents the redundancy of the infrastructures and that may be performed to analyze the consequences for the communities due to non-instantaneous or gradual losses. The presented outcomes consist of the post-event losses calculated as the percentage of the residential buildings damaged after the landslide occurred on 26 May, at Thalagahahena (Sri Lanka). The results show that the level of redundancy may significantly modify the resilience of the areas affected by landslides. The proposed loss model is more realistic than the approaches that neglect the disruption phase. In particular, the presented methodology considers resilience as the reference parameter to implement decision-making procedures, to develop parametric pre-event case studies, and to investigate possible emergency scenarios. In addition, resilience may be applied in easy-to-read assessments that can be useful for several stakeholders, to promote better preparedness and to assist government policies to select the optimal investments and approaches.

7. Conclusions

This paper developed a novel loss model that considers the role of the disruption phase by applying three levels of redundancy. A close formulation that quantifies the losses was proposed as a first attempt that may be included in a more comprehensive framework. The proposed formulation was applied to a case study of landslides in Sri Lanka, demonstrating the importance of considering the disruption phase in the definition of the losses. The methodology has several limitations, such as the definition of redundancy that may include different parameters such as the various locations, the level of interconnections, and availability of technologies. The other limitation is the way the damage has been quantified in cases where there is no availability of data. However, the potential of such methodology is wide, since it may be applied to pre-event assessments and/or post-event investigations to define the best investments and priorities for resilience strategies. Future work will focus on the potentialities of the methodology in reproducing historical case studies for which there is availability of data. These case studies will be important to validate the methodology and to calibrate the parameters on which it is based.

Author Contributions

Conceptualization, D.F. and J.T.; methodology, D.F.; software, M.S.; validation, J.T., M.S. and D.F.; formal analysis, M.S.; investigation, D.F.; resources, J.T.; data curation, M.S.; writing—original draft preparation, J.T.; writing—review and editing, D.F.; visualization, M.S.; supervision, D.F.; project administration, J.T.; funding acquisition, J.T. All authors have read and agreed to the published version of the manuscript.

Funding

This research was funded by the National Building Research Organisation (NBRO), Sri Lanka for providing valuable landslide damage and loss data for the study.

Data Availability Statement

Data is contained within the article.

Acknowledgments

The technical support given by the Department of Civil Engineering, South Eastern University of Sri Lanka are greatly acknowledged.

Conflicts of Interest

The authors declare no conflicts of interest.

References

  1. Brookshire, D.S.; Chang, S.E.; Cochrane, H.; Olson, R.A.; Rose, A.; Steenson, J. Direct and indirect economic losses from earthquake damage. Earthq. Spectra 1997, 14, 683–701. [Google Scholar] [CrossRef]
  2. Adey, B.; Hajdin, R.; Brudwile, E. Effect of common cause failures on indirect costs. J. Bridge Eng. 2004, 9, 200–208. [Google Scholar] [CrossRef]
  3. Zelaschi, C.; De Angelis, G.; Giardi, F.; Forcellini, D.; Monteiro, R.; Papadrakakis, M. Performance based earthquake engineering approach applied to bridges in a road network. In Proceedings of the 5th International Conference on Computational Methods in Structural Dynamics and Earthquake Engineering Methods in Structural Dynamics and Earthquake Engineering (ECCOMAS), Crete Island, Greece, 25–27 May 2015; pp. 900–910. [Google Scholar]
  4. Cimellaro, G.P. Urban Resilience for Emergency Response and Recovery. Fundamental Concepts and Applications; Geotechnical, Geological and Earthquake Engineering; Springer International Publishing: Berlin/Heidelberg, Germany, 2016; Volume 41, ISBN 978-3-319-30656-8. [Google Scholar]
  5. Venkittaraman, A.; Banerjee, S. Enhancing resilience of highway bridges through seismic retrofit. Earthq. Eng. Struct. Dyn. 2014, 43, 1173–1191. [Google Scholar]
  6. Argyroudis, S.A.; Nasiopoulos, G.; Mantadakis, N.; Mitoulis, S.A. Cost-based resilience assessment of bridges subjected to earthquakes. Int. J. Disaster Resil. Built Environ. 2021, 12, 209–222. [Google Scholar] [CrossRef]
  7. Forcellini, D. Seismic resilience of bridges isolated with traditional and geotechnical seismic isolation (GSI). Bull. Earthq. Eng. 2023, 21, 3521–3535. [Google Scholar] [CrossRef]
  8. Forcellini, D. 3D Numerical simulations of elastomeric bearings for bridges. Innov. Infrastruct. Solut. 2016, 1, 45. [Google Scholar] [CrossRef]
  9. Anitori, G.; Casas, J.R.; Ghosn, M. Redundancy and robustness in the design and evaluation of bridges: European and North American perspectives. J. Bridge Eng. 2013, 18, 1241–1251. [Google Scholar] [CrossRef]
  10. Ghosn, M.; Yang, J.; Beal, D.; Sivakumar, B. Bridge System Safety and Redundancy; Transportation Research Board: Washington, DC, USA, 2014. [Google Scholar]
  11. Bontempi, F. Elementary concepts of structural robustness of bridges and viaducts. J. Civ. Struct. Health Monit. 2019, 9, 703–717. [Google Scholar] [CrossRef]
  12. Fiorillo, G.; Ghosn, M. Structural Redundancy, Robustness, and Disproportionate Collapse Analysis of Highway Bridge Superstructures. J. Struct. Eng. 2022, 148, 04022075. [Google Scholar] [CrossRef]
  13. Ranjbar, P.R.; Naderpour, H. Probabilistic evaluation of seismic resilience for typical vital buildings in terms of vulnerability curves. Structures 2020, 23, 314–323. [Google Scholar] [CrossRef]
  14. Zhou, Y.; Wang, J.; Yang, H. Resilience of transportation systems: Concepts and comprehensive review. IEEE Trans. Intell. Transp. Syst. 2019, 20, 4262–4276. [Google Scholar] [CrossRef]
  15. Elms, D. Improving community resilience to natural events. Civ. Eng. Environ. Syst. 2015, 32, 77–89. [Google Scholar] [CrossRef]
  16. Wachter, R.F.; Forcellini, D.; McManus Warnell, J.; Walsh, K.Q. Relationship between Coastal Hazard Countermeasures and Community Resilience in the Tohoku Region of Japan following the 2011 Tsunami. Nat. Hazards Rev. 2023, 24, 04023017. [Google Scholar] [CrossRef]
  17. Cimellaro, G.P.; Reinhorn, A.M.; Bruneau, M. Framework for analytical quantification of disaster resilience. Eng. Struct. 2010, 32, 3639–3649. [Google Scholar] [CrossRef]
  18. Forcellini, D. An expeditious framework for assessing the seismic resilience (SR) of structural configurations. Structures 2023, 56, 105015. [Google Scholar] [CrossRef]
  19. Norris, F.H.; Stevens, S.P.; Pfefferbaum, B.; Wyche, K.F.; Pfefferbaum, R.L. Community resilience as a metaphor, theory, set of capacities, and strategy for disaster readiness. Am. J. Community Psychol. 2008, 41, 127–150. [Google Scholar] [CrossRef] [PubMed]
  20. Miles, S.B. Participatory disaster recovery simulation modeling for community resilience planning. Int. J. Disaster Risk Sci. 2018, 9, 519–529. [Google Scholar] [CrossRef]
  21. Das, L.; Munikoti, S.; Natarajan, B.; Srinivasan, B. Measuring smart grid resilience: Methods, challenges and opportunities. Renew. Sustain. Energy Rev. 2020, 130, 109918. [Google Scholar] [CrossRef]
  22. Panteli, M.; Trakas, D.N.; Mancarella, P.; Hatziargyriou, N.D. Power Systems Resilience Assessment: Hardening and Smart Operational Enhancement Strategies. Proc. IEEE 2017, 105, 1202–1213. [Google Scholar] [CrossRef]
  23. Soualah, H.; Jodin, G.; LeGoff Latimier, R.; Ben Ahmed, H. Energy Not Exchanged: A Metric to Quantify Energy Resilience in Smart Grids. Sustainability 2023, 15, 2596. [Google Scholar] [CrossRef]
  24. Umunnakwe, A.; Huang, H.; Oikonomou, K.; Davi, K.R. Quantitative analysis of power systems resilience: Standardization, categorizations, and challenges. Renew. Sustain. Energy Rev. 2021, 149, 111252. [Google Scholar] [CrossRef]
  25. Nan, C.; Sansavini, G. Multilayer hybrid modeling framework for the performance assessment of interdependent critical infrastructures. Int. J. Crit. Infrastruct. Prot. 2015, 10, 18–33. [Google Scholar] [CrossRef]
  26. Sarker, P.; Lester, H.D. Post-Disaster Recovery Associations of Power Systems Dependent Critical Infrastructures. Infrastructures 2019, 4, 30. [Google Scholar] [CrossRef]
  27. Podesta, C.; Coleman, N.; Esmalian, A.; Yuan, F.; Mostafavi, A. Quantifying community resilience based on fluctuations in visits to points-of-interest derived from digital trace data. J. R. Soc. Interface 2021, 18, 20210158. [Google Scholar] [CrossRef] [PubMed]
  28. Henry, D.; Ramirez-Marquez, J.E. Generic metrics and quantitative approaches for system resilience as a function of time. Reliab. Eng. Syst. Saf. 2012, 99, 114–122. [Google Scholar] [CrossRef]
  29. Barker, K.; Ramirez-Marquez, J.E.; Rocco, C.M. Resilience-based network component importance measures. Reliab. Eng. Syst. Saf. 2013, 117, 89–97. [Google Scholar] [CrossRef]
  30. Karakoca, D.B.; Alomoghathawib, Y.; Barkera, K.; Gonzaleza, A.D.; Mohebbia, S. Community resilience-driven restoration model for interdependent infrastructure networks. Int. J. Disaster Risk Reduct. 2019, 38, 101228. [Google Scholar] [CrossRef]
  31. Jönsson, H.; Johansson, J.; Johansson, H. Identifying critical components in technical infrastructure networks. J. Risk Reliab. 2008, 222, 235–243. [Google Scholar] [CrossRef]
  32. Rachunok, B.; Nateghi, R. The sensitivity of electric power infrastructure resilience to the spatial distribution of disaster impacts. Reliab. Eng. Syst. Saf. 2020, 193, 106658. [Google Scholar] [CrossRef]
  33. Moradi, S.; Vasandani, V.; Student, B.S.; Nejat, A. A review of resilience variables in the context of disasters. J. Emerg. Manag. 2019, 17, 403–432. [Google Scholar] [CrossRef] [PubMed]
  34. Rouhanizadeh, B.; Kermanshachi, S.; Dhamangaonkar, V.S. Reconstruction of critical and interdependent infrastructure due to catastrophic natural disasters: Lessons learned. In Construction Research Congress 2020; American Society of Civil Engineers: Reston, VA, USA, 2020; pp. 895–904. [Google Scholar]
  35. Nazarnia, H.; Sarmasti, H.; Wills, W.O. Application of household disruption data to delineate critical infrastructure resilience characteristics in the aftermath of disaster: A case study of Bhaktapur, Nepal. Saf. Sci. 2020, 121, 573–579. [Google Scholar] [CrossRef]
  36. Chester, M.; El Asmar, M.; Hayes, S.; Desha, C. Post-disaster infrastructure delivery for resilience. Sustainability 2021, 13, 3458. [Google Scholar] [CrossRef]
  37. Øien, K.; Bosberg, L.; Jovanovic, A. Resilience Assessment of Smart Critical Infrastructures Based on Indicators Safety and Reliability—Safe Societies in a Changing World; Haugen, Ed.; Taylor & Francis Group: London, UK, 2018; ISBN 978-0-8153-8682-7. [Google Scholar]
  38. Dang, K.; Sassa, K.; Konagai, K.; Karunawardena, A.; Bandara, R.M.S.; Hirota, K.; Tan, Q.; Ha, N.D. Recent rainfall-induced rapid and long-traveling landslide on 17 May 2016 in Aranayaka, Kagelle District, Sri Lanka. Landslides 2019, 16, 155–164. [Google Scholar] [CrossRef]
  39. NBRO. Hazard Resilient Housing Construction Manual—Resilient Construction Series No. 1, Sri Lanka. 2015. Available online: www.nbro.gov.lk (accessed on 1 January 2024).
  40. Kalubowila, P.; Lokupitiya, E.; Halwatura, D.; Jayathissa, G. Threshold rainfall ranges for landslide occurrence in Matara district of Sri Lanka and findings on community emergency preparedness. Int. J. Disaster Risk Reduct. 2021, 52, 101944. [Google Scholar] [CrossRef]
  41. Subasinghe, C.N.; Kawasaki, A. Assessment of physical vulnerability of buildings and socio-economic vulnerability of residents to rainfall induced cut slope failures: A case study in central highlands, Sri Lanka. Int. J. Disaster Risk Reduct. 2021, 65, 102550. [Google Scholar] [CrossRef]
  42. Mohleji, S.; Pielke, R. Reconciliation of Trends in Global and Regional Economic Losses from Weather Events: 1980–2008. Nat. Hazards Rev. 2014, 15, 04014009. [Google Scholar] [CrossRef]
  43. Eckstein, D.; Hutfils, M.L.; Winges, M. Global Climate Risk Index 2019, Who Suffers Most from Extreme Weather Events? Weather-Related Loss Events in 2017 and 1998 to 2017. 2018. Available online: https://www.germanwatch.org/en/16046 (accessed on 17 November 2022).
  44. Santos, L.B.; Jorge, A.A.; Londe, L.R.; Reani, R.T.; Bacelar, R.B.; Sokolov, I.M. Vulnerability analysis in Complex Networks under a Flood Risk Reduction point of view. Nat. Hazards Earth Syst. Sci. 2019, 2019, 1–8. [Google Scholar] [CrossRef]
  45. Liu, Q.; Tang, A.; Huang, D.; Huang, Z.; Zhang, B.; Xu, X. Total probabilistic measure for the potential risk of regional roads exposed to landslides. Reliab. Eng. Syst. Saf. 2022, 228, 108822. [Google Scholar] [CrossRef]
  46. Liu, Q.; Zhang, B.; Tang, A. Landslide risk of regional roads: Consider the road mileage of expected losses. Transp. Res. Part D 2023, 120, 103771. [Google Scholar] [CrossRef]
  47. Sathurshan, M.; Saja, A.; Thamboo, J.; Haraguchi, M.; Navaratnam, S. Resilience of Critical Infrastructure Systems: A Systematic Literature Review of Measurement Frameworks. Infrastructures 2022, 7, 67. [Google Scholar] [CrossRef]
Figure 1. Definition of resilience of systems (RT = repair time; Q = functionality; T0E = time of occurrence of the natural hazard).
Infrastructures 09 00038 g001
Figure 2. Development of the definition of resilience of systems (Tmin = time when the system functionality reaches the minimum value).
Infrastructures 09 00038 g002
Figure 3. The map of the (a) landslide hazard zonation and (b) contour map (map available in [39]).
Infrastructures 09 00038 g003
Figure 4. Damages to residential buildings due to landslides in Sri Lanka: (a) partial damage, (b) complete cover and (c) complete damage.
Infrastructures 09 00038 g004
Figure 5. Methodology followed to assess the extent and damage caused by landslides [39].
Infrastructures 09 00038 g005
Figure 6. Aerial view of a landslide at Thalagahahena on 26 May 2017 at 08:30 a.m. [39].
Infrastructures 09 00038 g006
Figure 7. Damage to the buildings and location used to assess the LR of the buildings.
Infrastructures 09 00038 g007
Figure 8. Extent of the damage and losses assessed via Google maps, of the occurred landslide at Thalagahahena on 26 May 2017 at 08:30 a.m. [39].
Infrastructures 09 00038 g008
Table 1. Level of redundancy.
Level of RedundancyDescriptionr
R01High redundancyr > 50
R02Redundancy10 < r < 50
R03Low redundancy2 < r < 10
Table 2. Summary of the data used to assess the LR of the buildings [39], compare with Figure 3b.
NoDistrictGPS NGPS ECrown Width (m)Crown Height (m)Length of Slide (m)Fully Damaged BuildingsPartially Damaged BuildingsPercentage of Loss (%)
1Rathnapura6°53′46.86″80°12′51.13″44264090250.0
2Rathnapura6°50′25.38″80°17′3.53″33301034475.0
3Rathnapura6°51′16.39″80°16′29.24″5518.21960150.0
4Rathnapura6°51′52.28″80°14′40.10″2823790-0.0
5Rathnapura6°48′54.68″80°12′43.44″471216861266.7
6Rathnapura6°50′11.09″80°12′51.64″221217110100.0
7Rathnapura6°52′23.37″80°15′39.10″42413433187.5
8Rathnapura6°45′39.78″80°15′39.23″395.78710100.0
9Rathnapura6°36′22.81″80°30′42.06″150255807873.3
10Rathnapura6°35′26.59″80°24′50.83″90253000550.0
11Rathnapura6°32′25.04″80°26′52.09″1103030030100.0
12Rathnapura6°39′46.64″80°19′38.11″12347482.550100.0
13Rathnapura6°39′3.69″80°20′13.76″35.513140.50150.0
14Rathnapura6°31′53.44″80°26′09.52″963036340100.0
15Rathnapura6°33′19.68″80°33′33.65″414010570100.0
16Rathnapura6°50′22.29″80°19′22.46″963036330100.0
17Rathnapura6°38′23.23″80°18′41.45″221217311486.6
18Rathnapura6°37′22.96″80°16′11.32″125.45356520100.0
19Kegalle6°53′1.05″80°16′58.14″4218195000.0
20Kegalle6°55′16.25″80°14′35.02″12.15.452.50150.0
21Matara6°16′34.53″80°30′10.09″481142085141971.2
22Matara6°14′35.11″80°34′48.15″14.3868000.0
23Matara6°14′7.20″80°37′59.89″2731286000.0
24Kaluthara6°39′24.84″80°11′37.55″1225669550100.0
25Kaluthara6°38′50.82″80°12′47.49″42544928194.4
26Kaluthara6°36′19.49″80° 8′56.12″18939430100.0
27Kaluthara6°40′29.25″80° 8′44.17″502229230100.0
28Kalutara6°37′20.22″80°13′50.82″9111060150.0
29Kalutara6°38′45.09″80°13′20.46″1215950150.0
30Kalutara6°38′56.68″80°13′40.48″415738810100.0
31Kalutara6°32′34.07″80°17′0.97″55814257481.8
32Kalutara6°31′6.56″80°18′35.54″300356306871.4
33Kalutara6°36′7.22″80°16′53.23″1514106000.0
34Colombo6°51′48.73″80° 9′57.19″4340186.2000.0
35Galle6°23′28.08″80°23′35.32″44131160450.0
Table 3. Summary of loss calculation of the landslide locations considered.
Ref. No.LocationPercentage of Loss (%)Qminr = 3r = 6r = 10
1Bogodakanda50.00.500.3330.1330.037
2Thalawitiya75.00.250.2500.1000.028
3Thalagahahena50.00.500.3330.1330.037
4Karandana66.70.330.2770.1110.031
5Koshena100.00.000.1670.0670.019
6Bopeththa87.50.120.2070.0830.023
7Kodithuwakkukanda100.00.000.1670.0670.019
8Wanniwatta73.30.270.2570.1030.029
9Udakaravita50.00.500.3330.1330.037
10Neluwankanda100.00.000.1670.0670.019
11Alupathgala100.00.000.1670.0670.019
12Giripagama50.00.500.3330.1330.037
13Wewelkandura100.00.000.1670.0670.019
14Bungirikanda100.00.000.1670.0670.019
15Diddeniya Pahala100.00.000.1670.0670.019
16Ayagama Town86.60.130.2100.0840.023
17Muniheenkanda100.00.000.1670.0670.019
18Welangalle50.00.500.3330.1330.037
19Morawakkanda71.20.290.2630.1050.029
20Thibbotukanda100.00.000.1670.0670.019
21Jayalathgoda94.40.060.1870.0750.021
22Bogahawatthe100.00.000.1670.0670.019
23Kobewela100.00.000.1670.0670.019
24Paragoda West50.00.500.3330.1330.037
25Niggaha50.00.500.3330.1330.037
26Demapatapitiya100.00.000.1670.0670.019
27Athwalthota81.80.180.2270.0910.025
28Diganna71.40.280.2600.1040.029
29Kosmulla50.00.500.3330.1330.037
Disclaimer/Publisher’s Note: The statements, opinions and data contained in all publications are solely those of the individual author(s) and contributor(s) and not of MDPI and/or the editor(s). MDPI and/or the editor(s) disclaim responsibility for any injury to people or property resulting from any ideas, methods, instructions or products referred to in the content.

