Abstract
In recent years, the increased use of heavy commercial vehicles with higher axle weights has required the development of innovative technologies to improve the mechanical properties of asphalt concrete conglomerates, such as fatigue resistance and rutting. This study offers a comprehensive comparative analysis of different types of asphalt concrete tested in four trial sections (S1, S2, S3, S4) of the SP3 Ardeatina rural road in Rome, under actual traffic and operational conditions. More precisely, the pavement technologies applied include modified asphalt concrete with graphene and recycled hard plastics for S1, asphalt concrete modified with styrene–butadiene–styrene (SBS) for S2, asphalt concrete with a standard polymeric compound for S3, and traditional asphalt concrete for S4. The evaluation approach involved visual inspections in order to calculate the pavement condition index (PCI) and falling weight deflectometer (FWD) tests. In addition, back-calculation analyses were performed using ELMOD software to assess the mechanical properties. The laboratory tests revealed superior properties of M1 in terms of its resistance to permanent deformations (+13%, +15%, and +19.5% compared to M2, M3, and M4, respectively) and stiffness (10,758 MPa for M1 vs. 9259 MPa, 7643 MPa, and 7289 MPa for M2, M3, and M4, respectively). These findings were further corroborated by the PCI values (PCIS1 = 65; PCIS2 = 17; PCIS3 = 28; PCIS4 = 29) as well as the FWD test results after 5 years of investigation, which suggests greater durability and resistance than the other sections.
1. Introduction
Today, flexible pavements are used in both low- and high-traffic-volume road infrastructures [1]. However, in recent decades there has been an increase in the dimensions of heavy commercial vehicles [2,3], as well as a rise in the frequency of their passages over pavements [4,5,6,7]. With this in mind, the development of innovative technologies has aimed at improving the mechanical properties of asphalt concrete (AC) in terms of fatigue and rutting resistance [8,9]. Over the past 50 years, bitumen has been modified with various modifying agents to fulfill this trend [10]. Styrene–butadiene rubber (SBR) [11] and polyphosphoric acid (PPA) were among the first polymers to be used as modifying agents for ACs [12]. However, the most widely adopted AC polymers on the market today are Styrene-Butadiene-Styrenes (SBSs). Their popularity is derived from their compatibility with bitumen, ensuring effective dispersion, and high tensile strength [12], while maintaining acceptable costs [13]. Currently, the focus of researchers is shifting towards the use of recycled polymers such as low-density polyethylene (LDPE) and high-density polyethylene (HDPE) [14,15], polyethylene terephthalate (PET) [16], and polystyrene (PS) [17]. At the same time, attempts are being made to give new life to materials typically destined for landfill or waste-to-energy processes, such as crumb rubber obtained from end-of-life tires [18,19,20,21].
The polymer modification of an AC can be carried out using two different methods, namely the dry and wet methods [22]. Specifically, the wet method involves adding the modifier to the bitumen before its mixing with aggregates, although the dry method involves incorporating the modifying agent directly into the mixture during the mixing process [17,23,24]. Modified ACs produced using the former method are commonly known as polymer-modified bitumens (PMBs), while those resulting from the latter technique are referred to as polymer-modified asphalts (PMAs) [25].
The use of PMBs has several advantages over the use of unmodified ACs, also depending on the type of polymer used [26]. In particular, they allow the improvement of various properties of an AC, including increased resistance to permanent deformation, higher cracking resistance at low temperatures, and enhanced fatigue resistance [13].
PMBs are currently the most widely used. However, PMAs are gaining in importance due to several factors. These include the fact that they are easy to produce without requiring sophisticated equipment or major modifications to existing asphalt plants [27], and a lower environmental impact than PMBs [28]. The increased ability to utilize co-products, such as recycled plastics, is another aspect that highlights the growing impact of PMAs [16,29]. Specifically, plastics can be introduced into ACs either as a partial substitute for bitumen, as a partial substitute for aggregates, or simply as an additive [17]. When using recycled plastics with a melting point lower than the production temperature of the mixture, these plastics fuse with the aggregates and improve the properties of the mixture by forming a thin protective layer around the aggregates [27,30]. In addition, the size of the modifiers has a significant effect on the properties of the mixture, as the use of smaller polymers allows for more effective dispersion in the AC and ensures better mechanical performance [31]. Another aspect concerns the use of reclaimed asphalt pavement (RAP) in ACs. In particular, as the use of RAP increases, there is a corresponding decrease in the demand for raw bitumen, but this is dependent on the use of a rejuvenator [32,33,34]. Consequently, the total amount of polymer that could be introduced into the material through wet techniques (using the new bitumen) decreases as the polymer present in the RAP is degraded and has lost its effectiveness [35]. Instead, in the dry method, the modification is made within the mixture itself, without the need for new bitumen. This allows greater quantities of RAP to be used by restoring the polymer content of the ACs before recycling.
Today, the attention of the scientific community is increasingly turning to sustainable and high-performance materials [36]. In this regard, there have been numerous studies of PMAs produced with several types of additives [37,38,39,40,41,42]. Among them, worthy of mention are the PMAs produced with unmodified bitumen and compounds made of graphene and selected recycled hard plastics [43,44,45]. In particular, these compounds generally improve the mechanical performance of the material and increase its durability [43,46]. At the same time, they significantly reduce the environmental impact [47].
This comparative study presents the results of experimentation considering 1 km of the SP3 Ardeatina rural road to the south of Rome. It was possible to identify different sections distinguished in terms of pavement technologies. Specifically, the ACs used were:
- a modified AC with graphene and selected recycled hard plastics compound;
- a hard-modified AC with styrene–butadiene–styrene (SBS) polymer;
- a soft-modified AC with a polymeric compound;
- an unmodified AC.
Visual surveys were carried out on different sections and then the pavement condition index (PCI) was calculated. In addition, falling weight deflectometer (FWD) tests were performed (after 6 months and after 1, 2, 4, and 5 years). These tests, linked with subsequent back-calculation, allowed an estimation of the stiffness modules of the materials. These analyses made it possible to comparatively evaluate the performance over time of different mixtures under the same traffic, temperature, and layer depth conditions.
This article is organized as follows: Section 2 details the asphalt mixture characteristics and performances considered in the case study; Section 3 presents the laboratory and in situ test results in order to compare the performances of GPC-added AC with the other AC mixtures. The article concludes with a brief summary and discussions in Section 4.
2. Materials and Methods
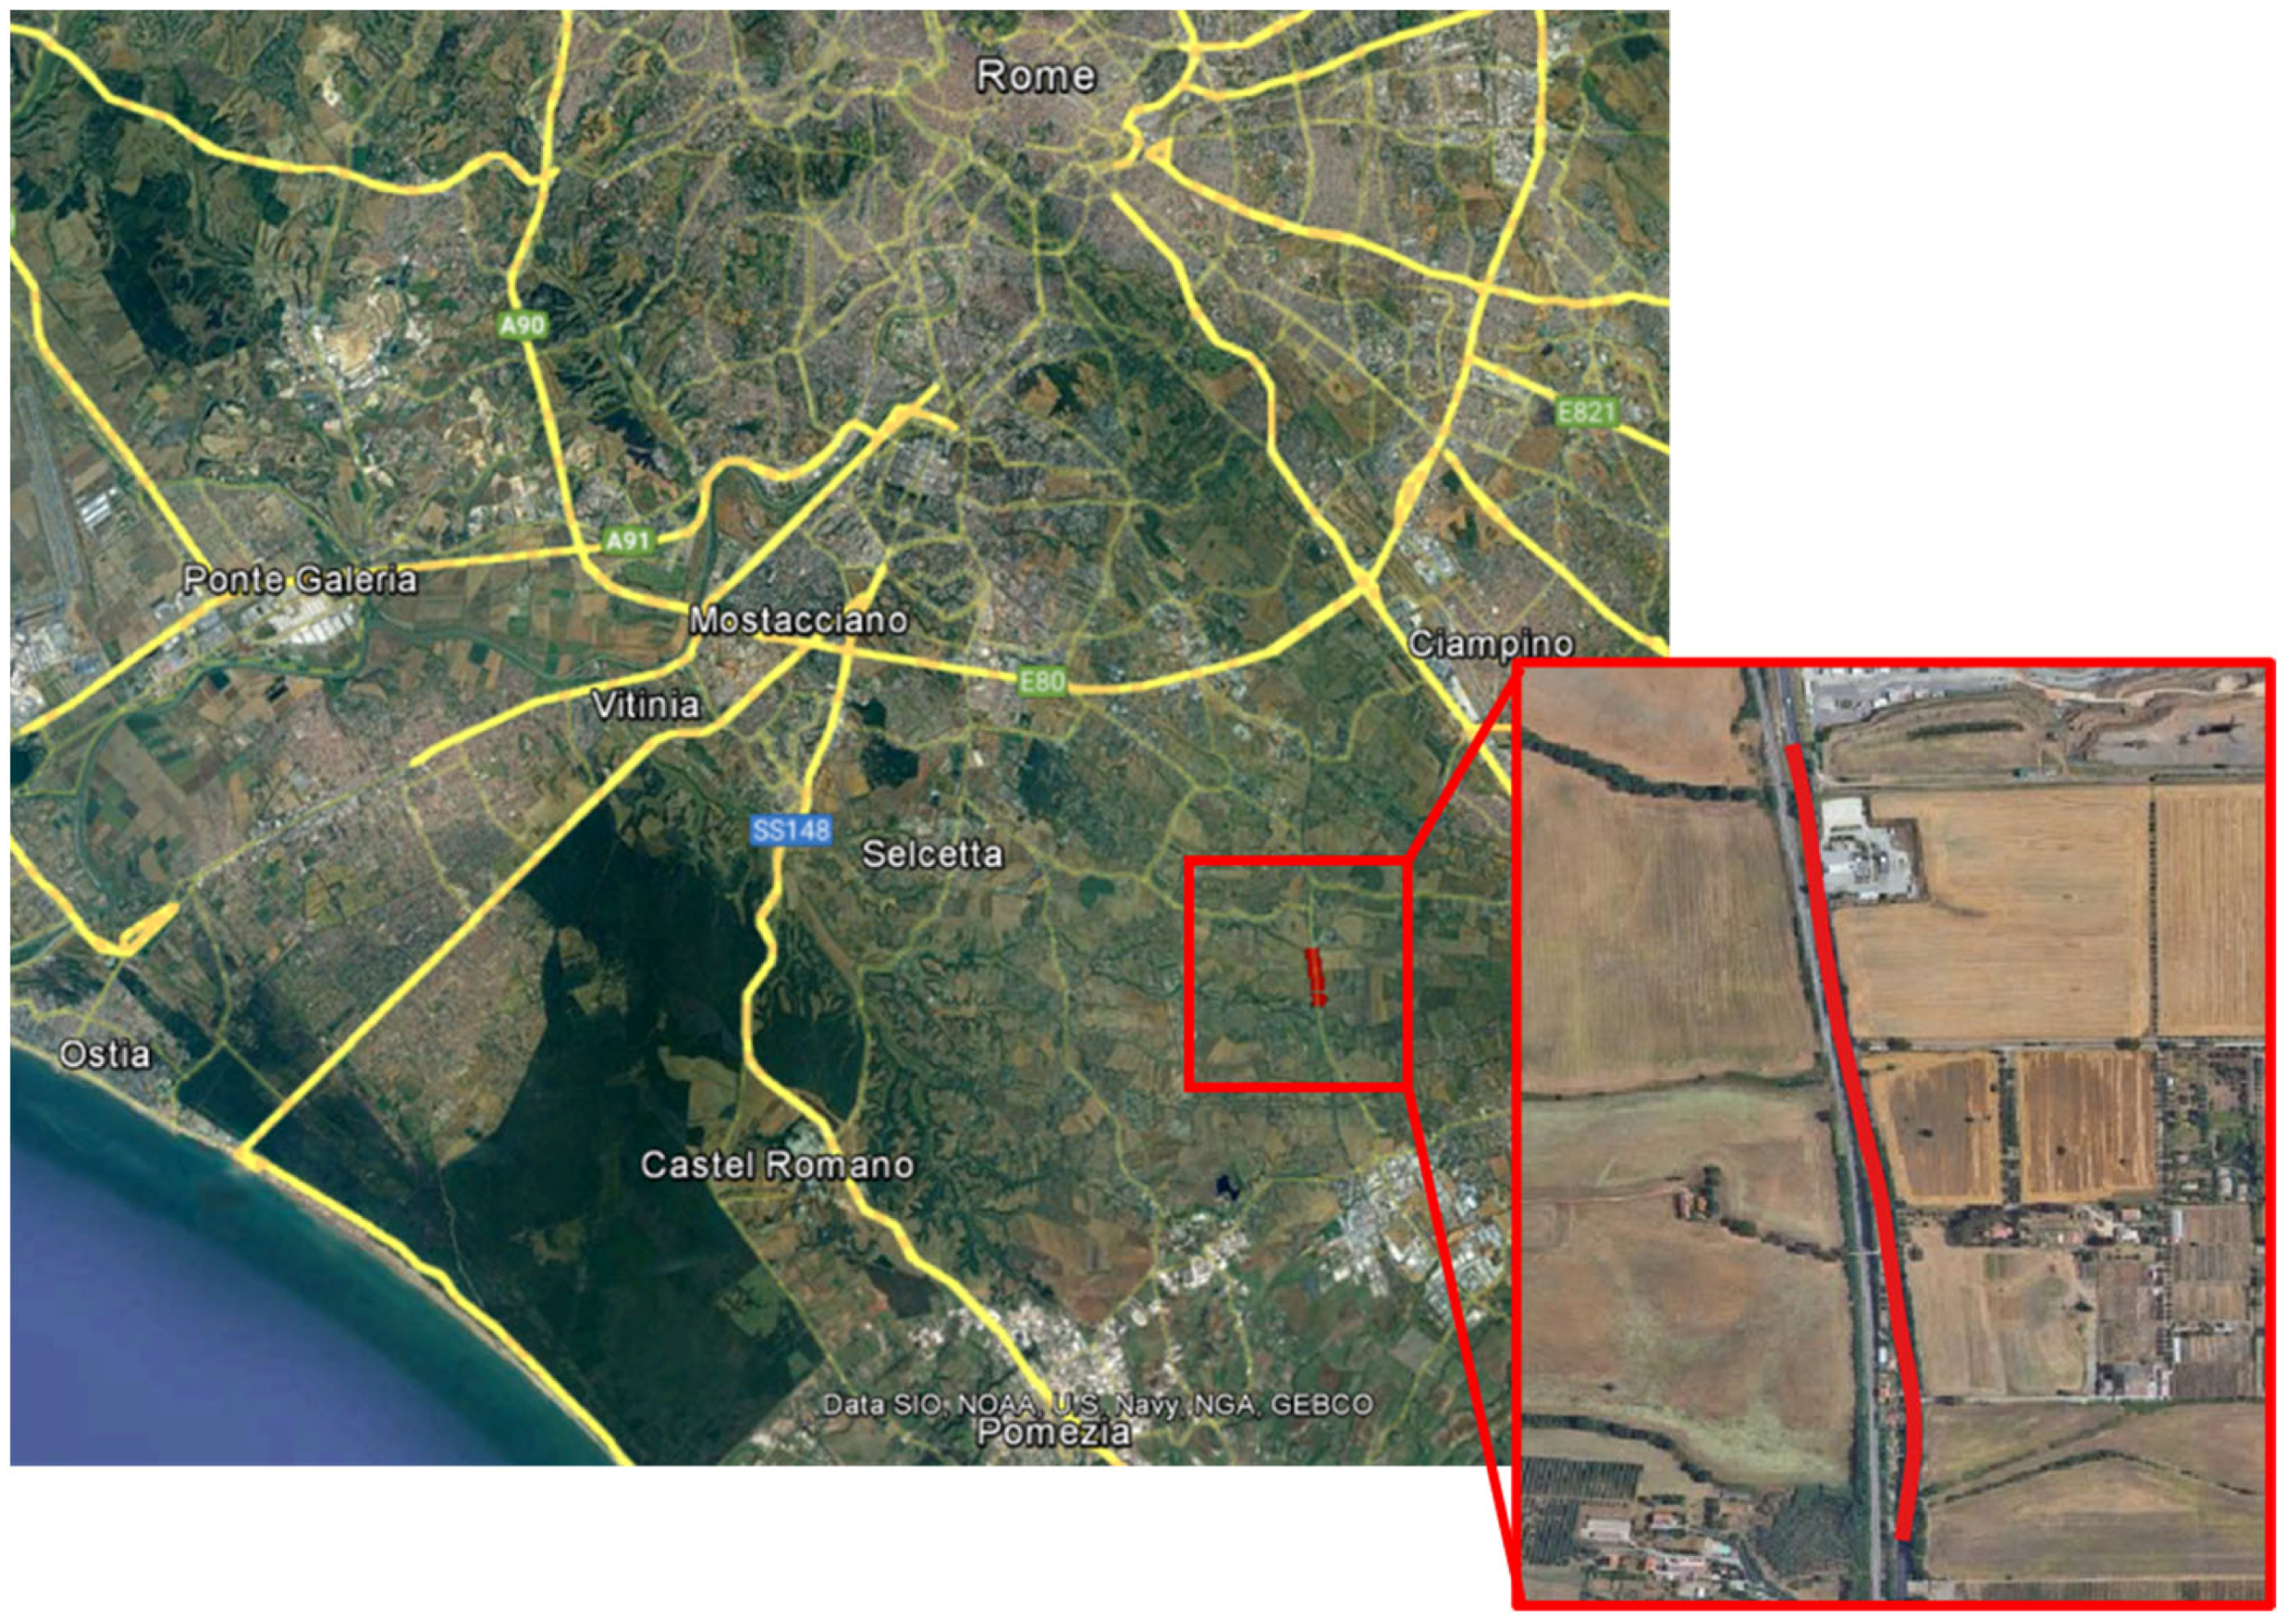
The case study investigates a stretch of road (Figure 1) belonging to the SP 3 Ardeatina, in the southern part of the city of Rome, covering a length of approximately 1 km. It is characterized by the homogeneity of subgrade bearing capacity, uniform traffic volume (absence of intersections that could disrupt traffic flow), longitudinal slopes of about 2%, and non-extreme climatic conditions. In greater detail, the minimum temperature recorded during the past 10 years has been −5.3 °C in winter, the collected highest average weekly temperature has been 29.7 °C, and the number of rainy days has been equal to 78.
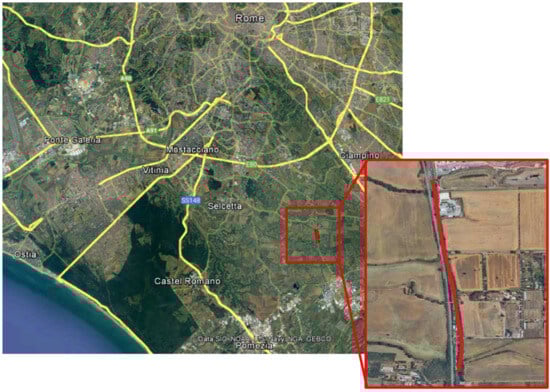
Figure 1.
Examined road section.
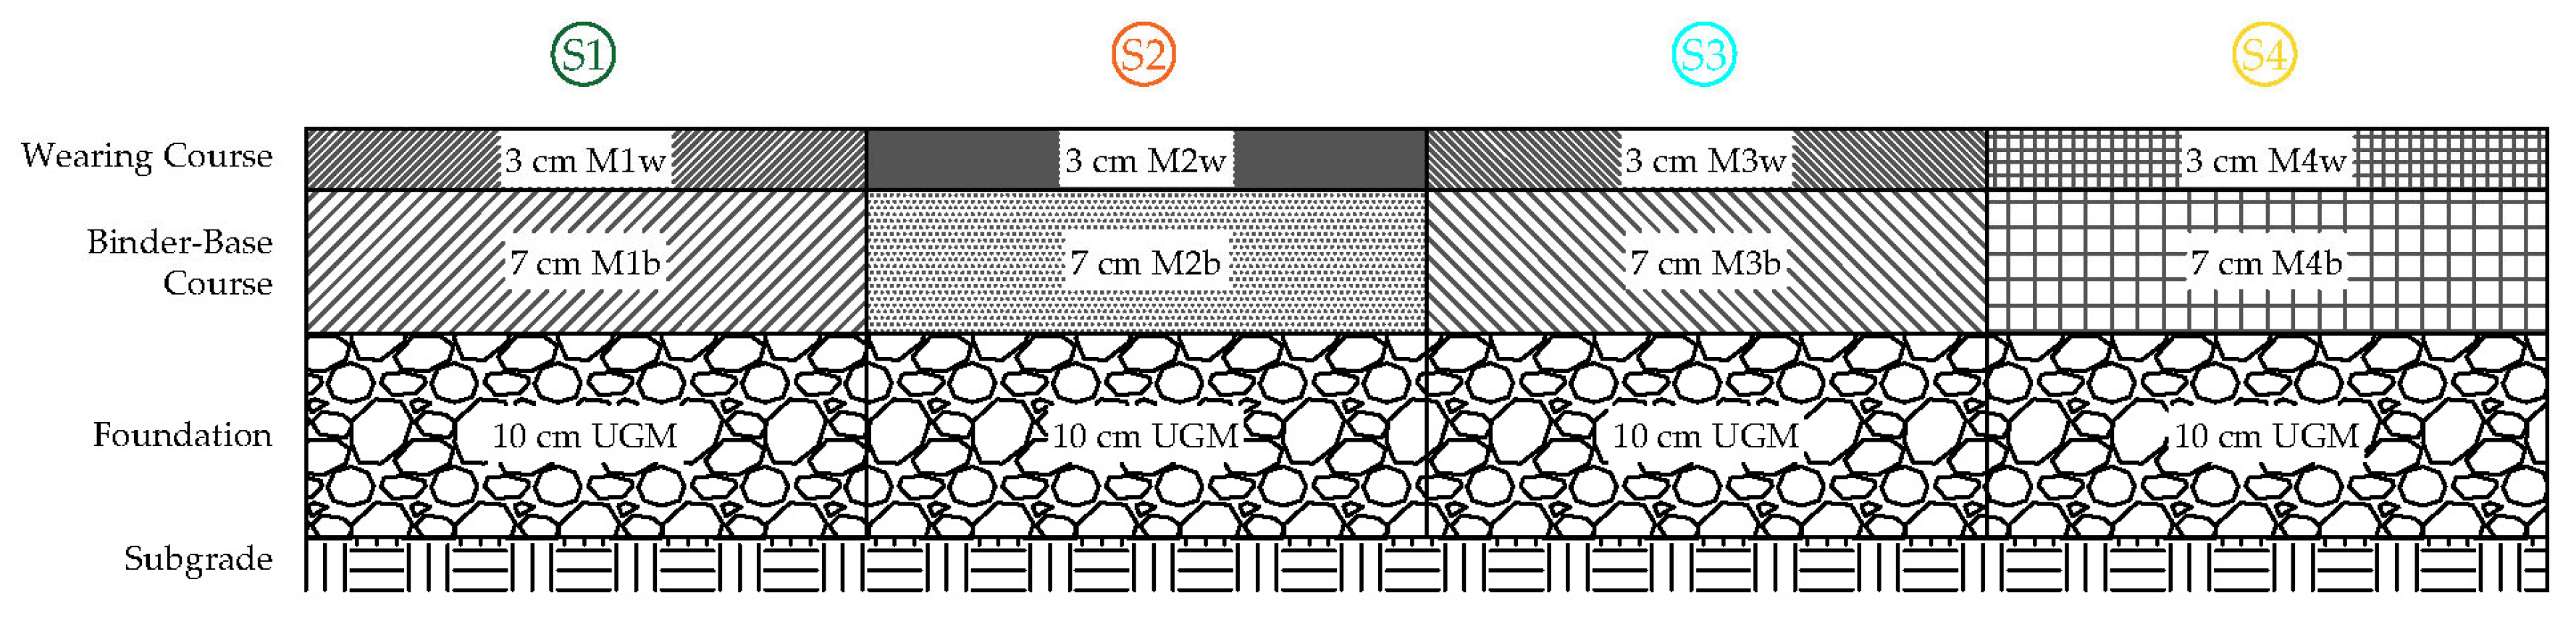
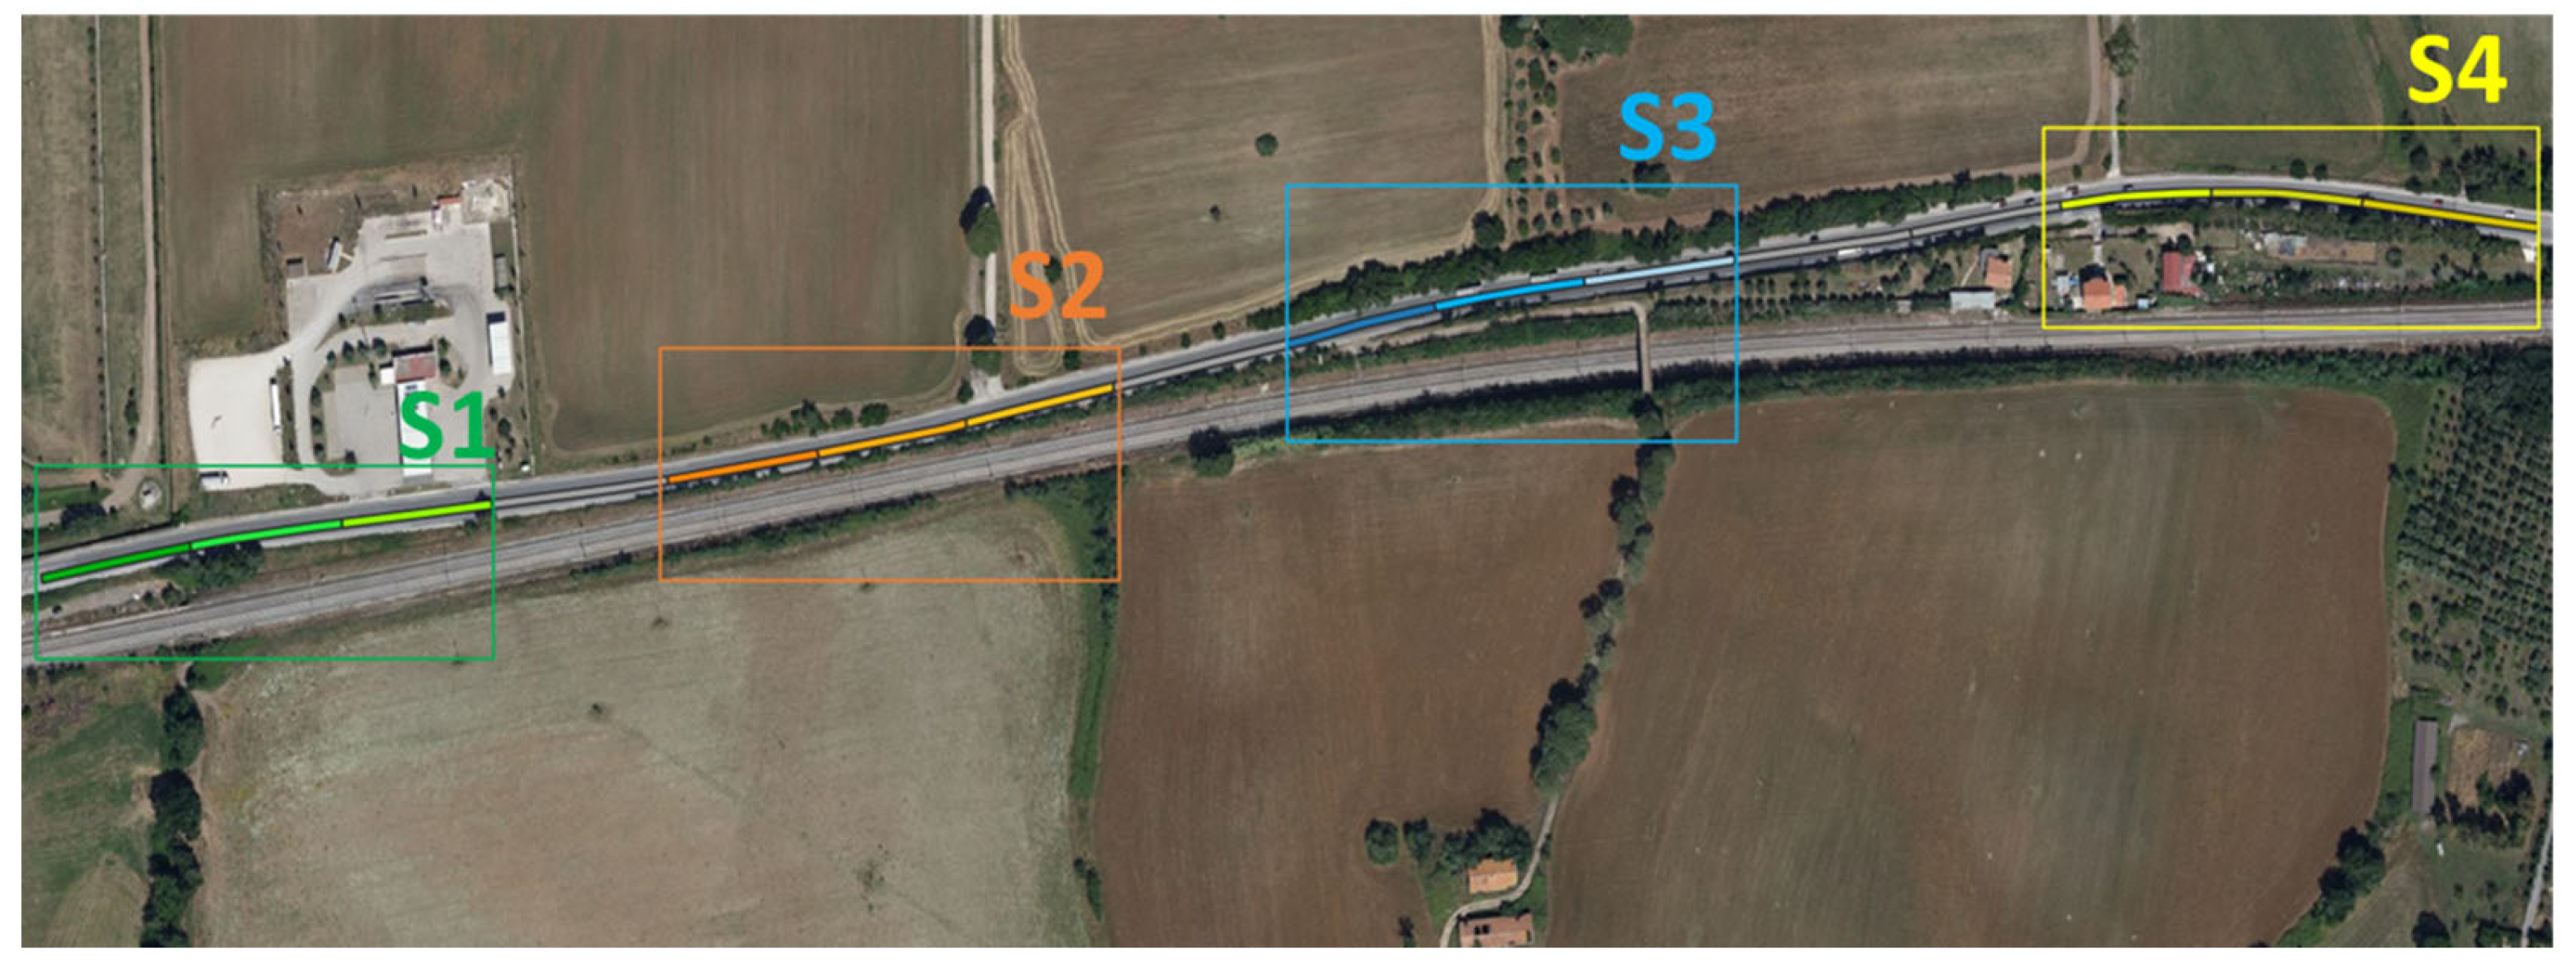
The examined road has been divided into four sections (Figure 2), each characterized by the utilization of different ACs. In the manuscript, each section is identified using an alphanumerical code, the so-called Si (i = 1, …, 4). Specifically:
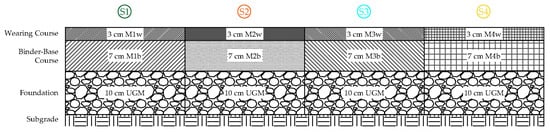
Figure 2.
Experimental sections (S1 to S4).
- A modified AC with graphene and selected recycled hard plastics was adopted for S1 (PMA)
- For S2, a hard-modified AC with styrene–butadiene–styrene (SBS) polymer was used (PMB)
- For S3, a soft-modified AC with a polymer compound (M3) was adopted (PMA)
- For S4, an unmodified AC (M4) was used.
The experimental mixtures, denoted as Mi (i = 1, …, 4), are distinguished for wearing and binder courses by adding the extra-subscripts w and b, respectively.
The pavement structure, which consists of a 3 cm wearing course and a 7 cm binder course, remains consistent across all sections. The sub-base, approximately 10 cm thick, is composed of unbound granular material (UGM). The experimental sections were paved in 2018.
Traffic analyses were conducted in 2019 based on vehicle weights (Table 1).

Table 1.
Traffic data for the examined sections.
The results show a considerable presence of heavy vehicles for the examined sections: it could be observed that about 435,000 heavy vehicles circulated in 2019, which corresponds to about 17% of the total number of vehicles that transited. Therefore, according to the Italian pavement catalogue, the section can be classified as heavy traffic [48].
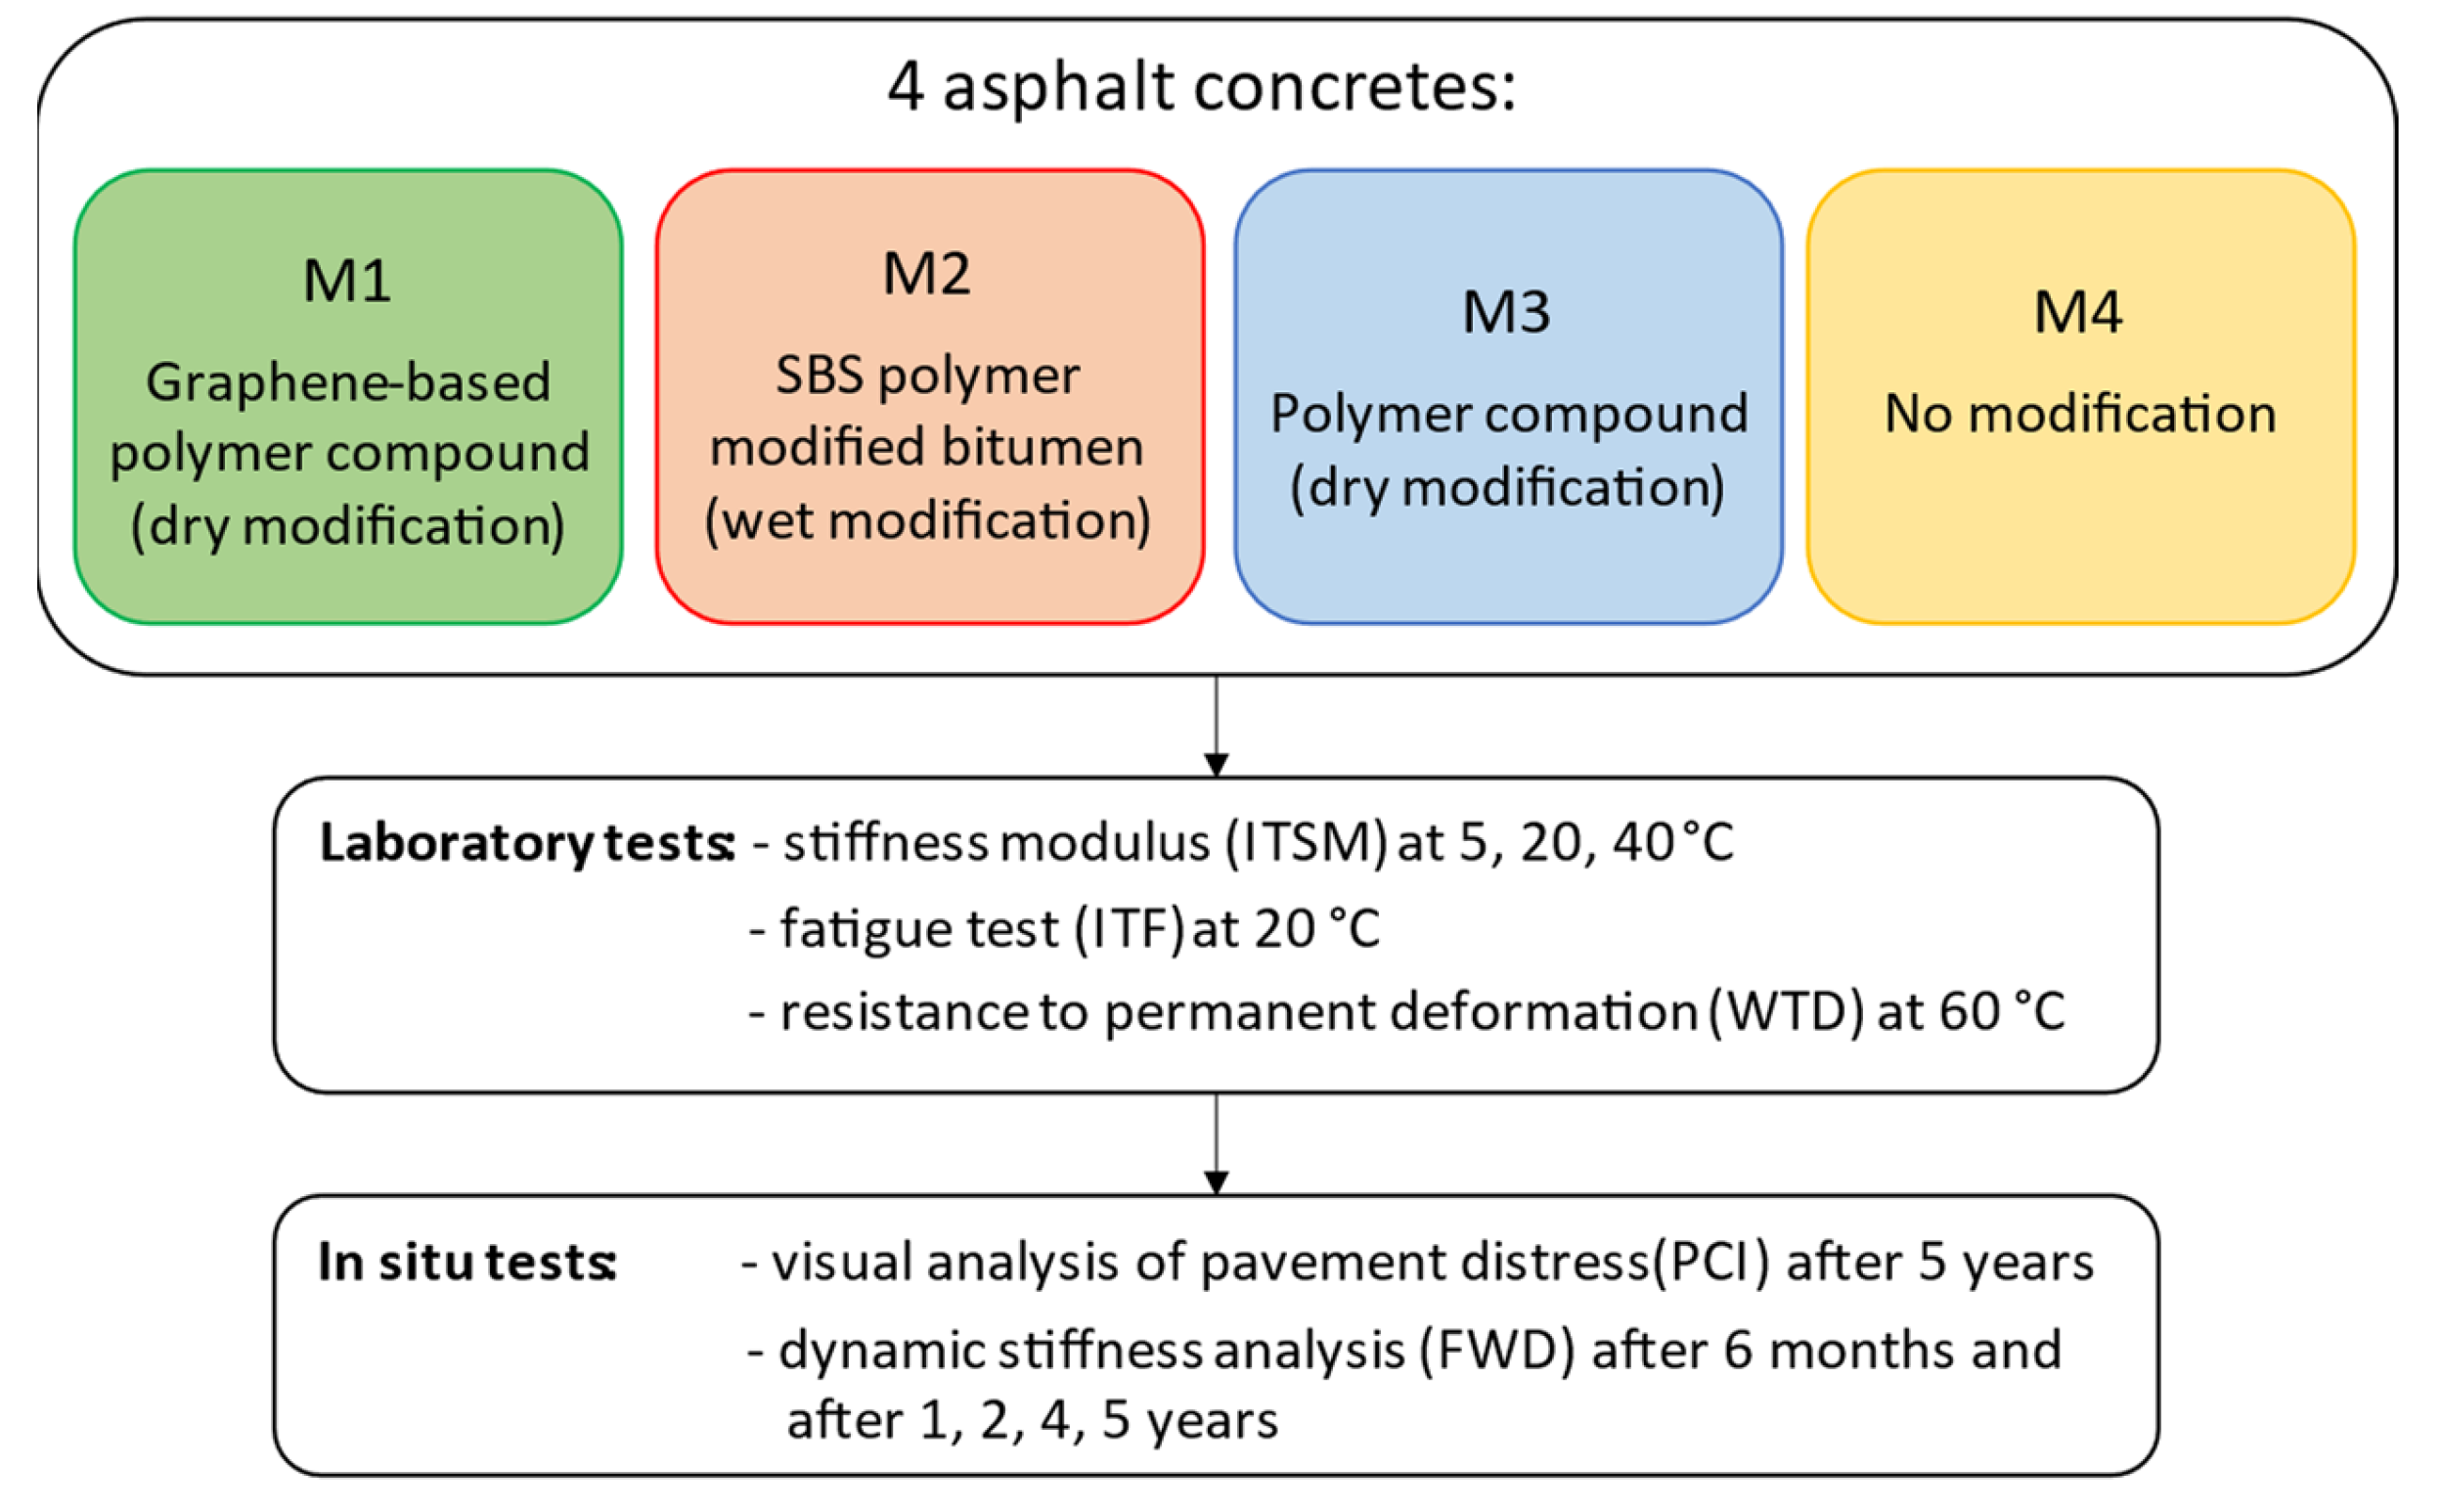
Figure 3 provides a brief overview of the sequential steps in our study, providing a clear visual guide to our laboratory research methodology and its logical progression.

Figure 3.
Experimental program flowchart.
2.1. Asphalt Mixture Characteristics
Mi are designed by properly grain-size curves, according to Italian local specifications [49].
During the paving of Si, material specimens were collected and initially subjected to a binder extraction test [50], followed by the determination of the grain size curve for the extracted aggregates [51]. The grain size curves of Si for the wearing course (Figure 4a) and binder-base course (Figure 4b), align with the prescribed grain size ranges specified in the standards.
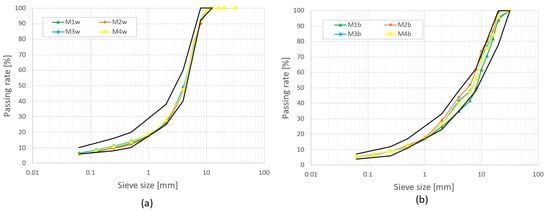
Figure 4.
(a) Wearing course grain size curves; (b) binder-base course grain size curves.
In the wearing layer (Figure 4a), the aggregate mixtures exhibit continuous and uniform grading, whereas in the binder layer (Figure 4b) there is a noticeable variation attributed to the presence of coarse calcareous aggregates, which may undergo slight crushing during the compaction phase. Table 2 reveals the binder percentages of each mixture, determined by extraction tests.
Table 2.
Binder content.
Table 3 shows the characteristics of Mi. In particular, the different mixtures were tested in the laboratory before being laid on.
Table 3.
Mixtures composition.
The mixtures were characterized by different types and percentages of modifying agents. RAP quantities of 30% and 40% were incorporated into the wearing and binder-base layers, respectively. Additionally, a rejuvenator additive at a rate of 0.2% was employed in the current experimentation.
2.2. Asphalt Mixture Performance Tests (Laboratory)
2.2.1. Indirect Tensile Strength Modulus (ITSM) Test
The stiffness of AC is a very important parameter used for predicting its behavior under different climatic conditions [52]. Hence, a comprehensive understanding of material stiffness becomes pivotal in the design of road pavements [53]. Seyed et al. indicate that the stiffness of a material can be an indicator of the load distribution capability of an AC layer [54].
The AC mixtures were then subjected to indirect tensile strength modulus (ITSM) tests, according to EN 12697-26 [55] at different temperatures. In particular, tests were conducted on cylindrical specimens applying a half-sinusoidal load with a rise tie of 124 ± 4 ms. Moreover, to compare the different mixtures, only the specimens with similar air void content were tested: in this way, the only variable is the type of binder used in the mixture.
2.2.2. Indirect Tensile Fatigue (ITF) Test
Fatigue in AC is one of the main degradation mechanisms of road pavements [56]. It is defined as the phenomenon causing cracking due to tensile strains generated in the pavement when subjected to load repetitions, temperature variations, and inadequate construction practices [57].
The fatigue behavior of AC plays a pivotal role in assessing the durability of highway and/or airport pavements [58]. In this study, the fatigue resistance was evaluated according to [59], which involves the use of cylindrical AC specimens and an indirect tensile loading configuration. The test is conducted by applying a constant haver-sinusoidal load (stress control) at a frequency of 2 Hz and measuring the corresponding deformation. Each type of mixture was tested with three different initial strain levels (ε0) between 100 and 400 μs strain. For each mixture, the fatigue curves were plotted (σ vs. n° of cycles).
2.2.3. Hamburg Wheel Tracking (HWT) Test
Permanent deformation, recognized as rutting, is one of the main distresses occurring in asphalt pavements [60]. This phenomenon is characterized by the accumulation of unrecoverable deformation mainly in the AC layers that appear as longitudinal depressions in the wheel paths and small upheavals to the sides [61]. With the constant increase in traffic loads and the number of passages, resistance to permanent deformation has become a significant factor for the durability of road surfaces, particularly in hot climates with high average annual temperatures [62].
In the present work, the resistance to permanent deformation for the different mixtures was evaluated using a wheel track device (WTD) test according to the European standard [63]. In accordance with standard guidelines, rectangular specimens (slabs) were prepared and then subjected to 30,000 passages of a tire, which applied a weight of 700 N, all at a controlled temperature. It should be noted that, due to the high stiffness of the mixtures, the number of passes was increased from 10,000 (normally used in experimentation) to 30,000 [64]. The slabs to be tested (length 40 cm, width 30 cm, and thickness 4 cm) were prepared using a roller compactor according to [65], and at a defined air void value.
2.3. In Situ Tests
Road tests were carried out to assess the behavior of Mi. In this section, the methods and procedures used in the paper for evaluating pavement conditions are described.
2.3.1. Pavement Condition Index (PCI)
The Pavement condition index (PCI), as defined by ASTM D6433 [66], provides a quantitative assessment of the current state of the pavement. It takes into account the type, extent, and severity of identified road distress [67,68]. More precisely, the detection and assessment of road surface distress are grouped for flexible pavements into cracking, distortion, disintegration, and skid hazards. The PCI classification, as shown in Table 4, is expressed by a numerical range that varies from 0 (i.e., failed pavement) to 100 (i.e., pavement in good condition).
Table 4.
Standard PCI rating scale.
An essential element in the calculation of PCI values is the delineation of sections that are homogenous about traffic and material composition within the pavement The sections are then divided into sample units (SUs), homogeneous pavement areas of 225 ± 90 m2.
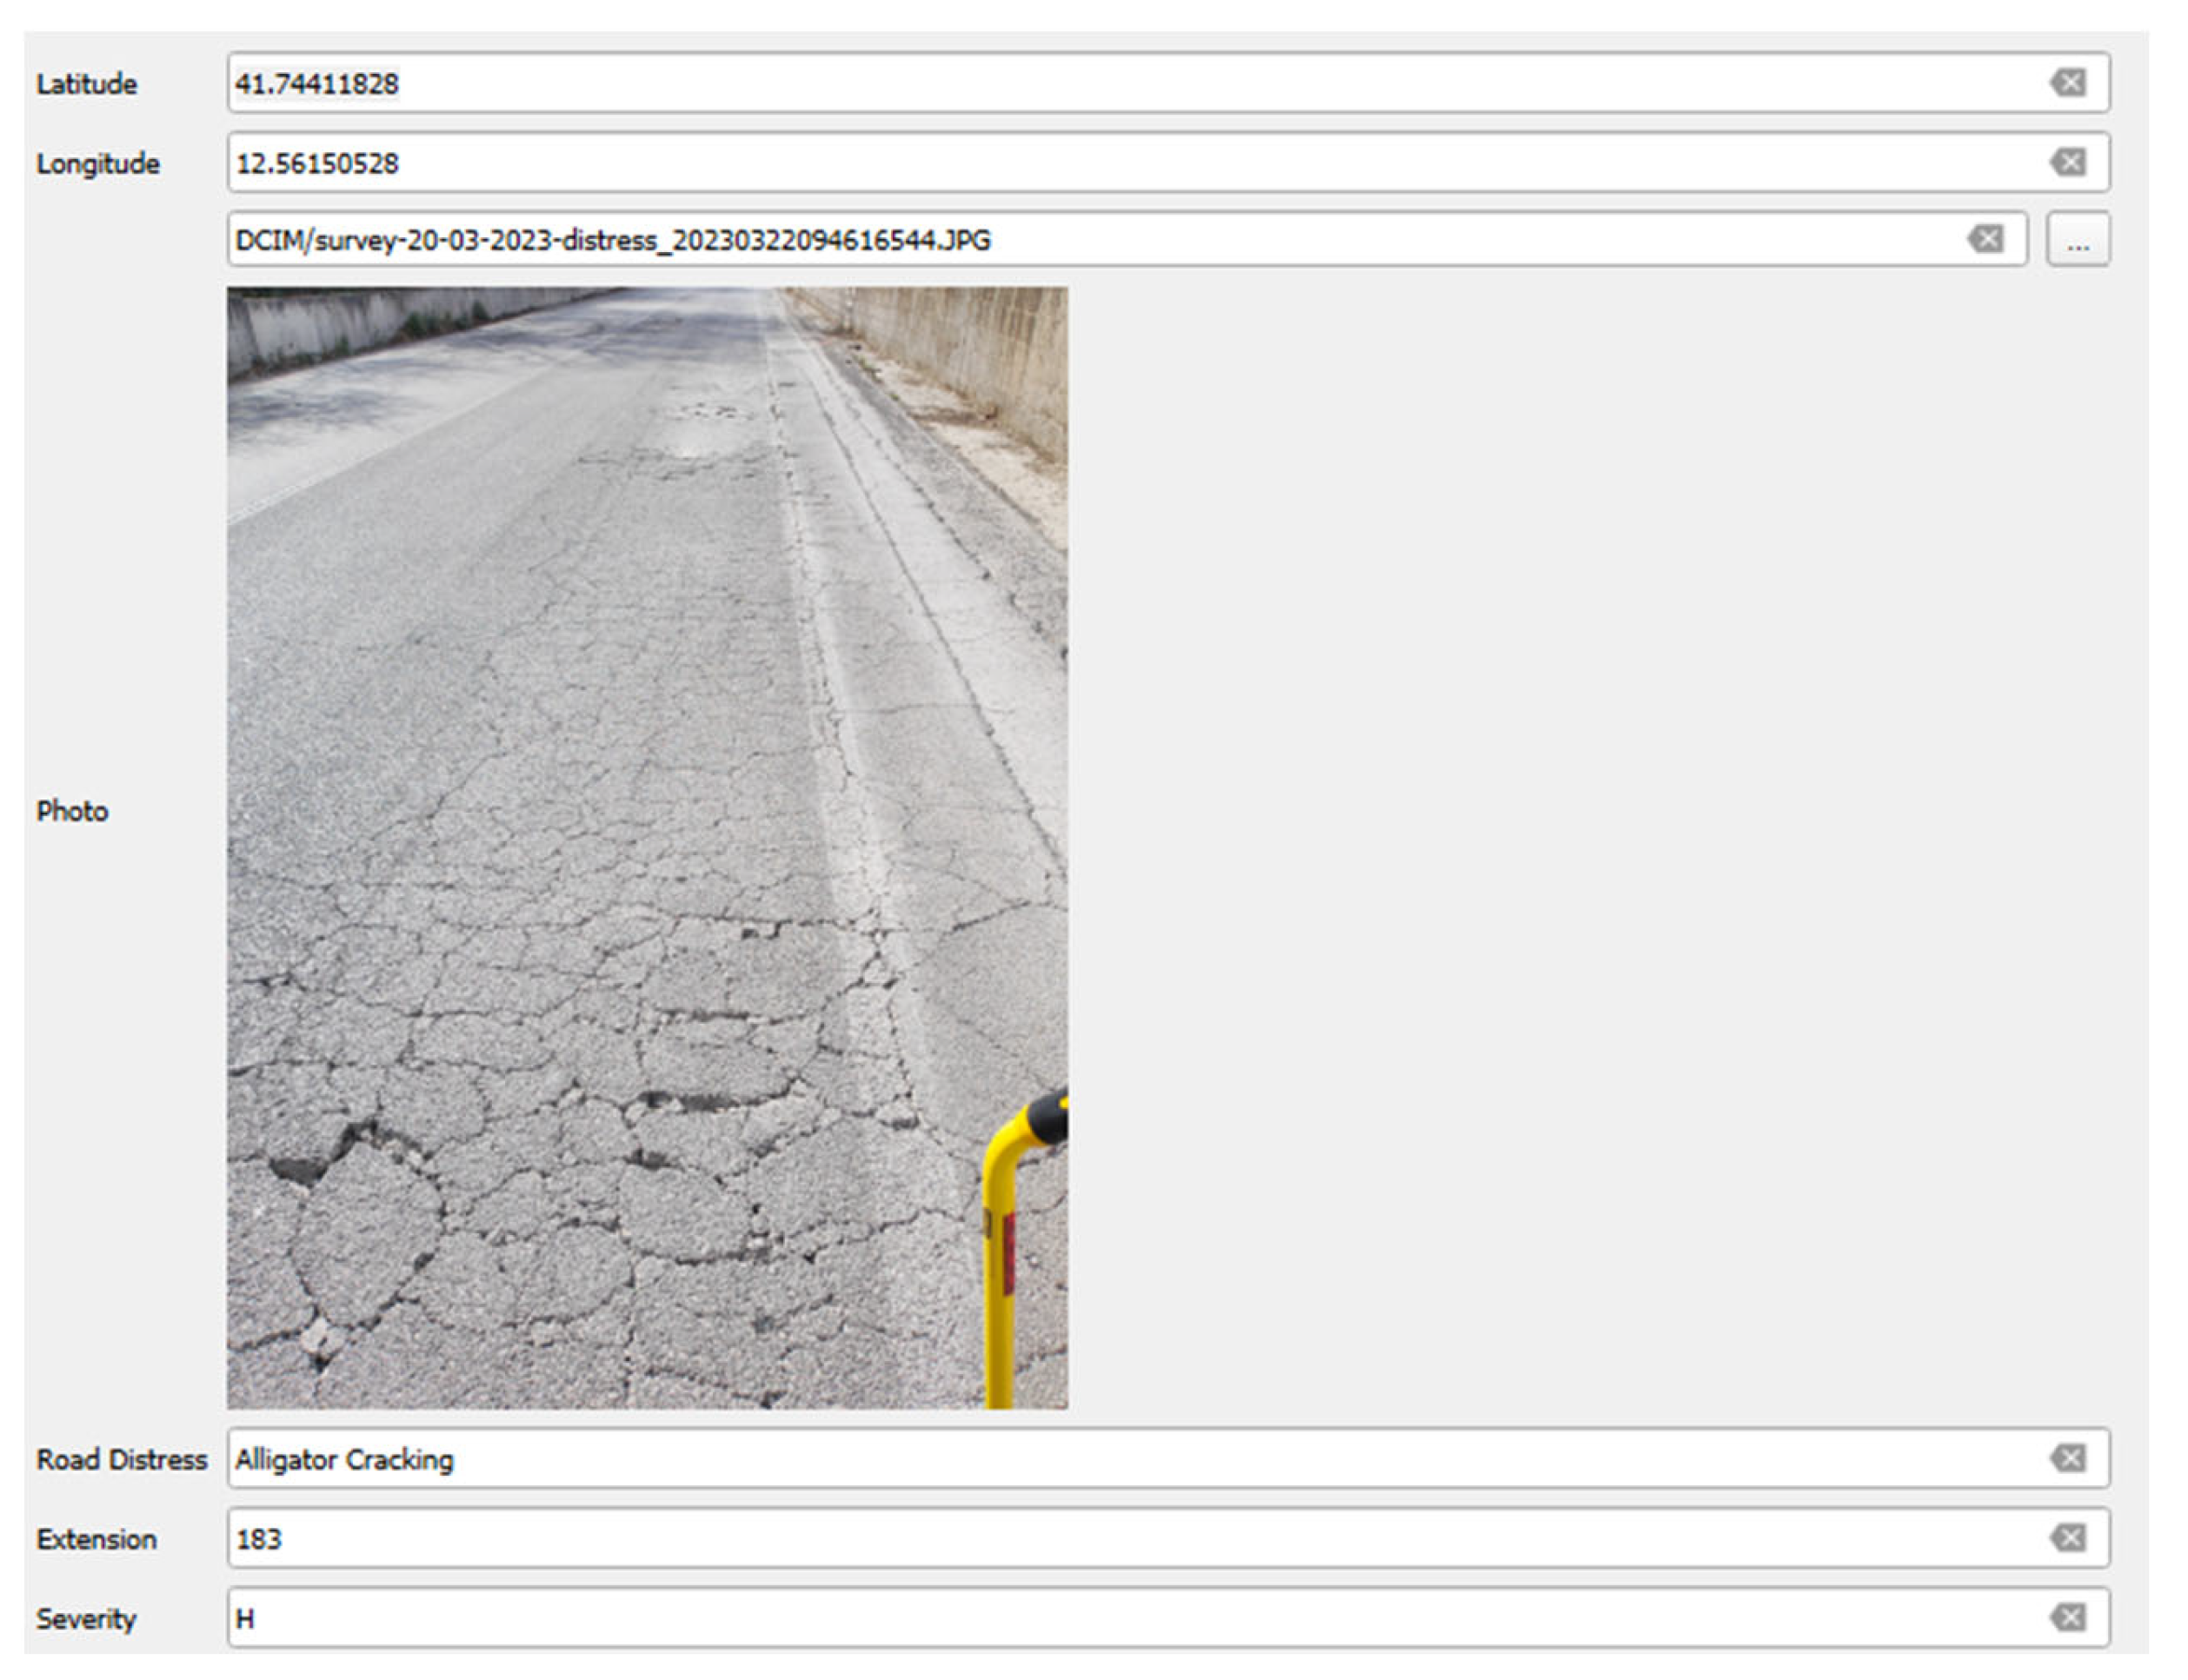
The PCI index is computed through a visual inspection process, which involves identifying and categorizing each defect on the road surface. In this study, a combination of semi-automated techniques was employed for road inspections. The methodology has been described in a previous study [69]. Therefore, data were collected as shown in Figure 5.
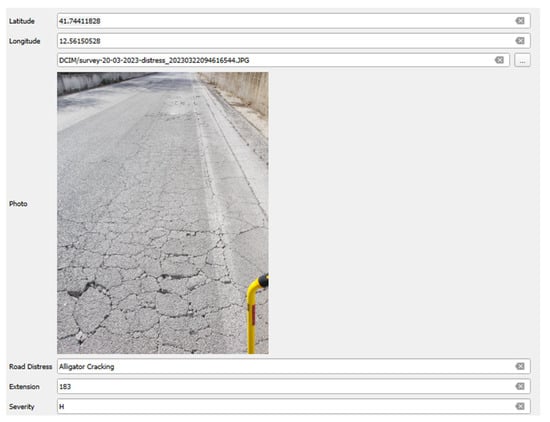
Figure 5.
Sample of a distress report form.
Once all the defects identified during the visual inspections have been recorded, the PCI index is calculated using the equation provided in the standard [66], expressed in Equation (1).
where is the deduct weighting value depending on the distress type Ti, level of severity Sy, and density of distress Dij, i = 1, … P, j = 1, … mi and the function F(t,d) is the adjustment factor for multiple distress, which varies with the total summed deduct value t and the number of deducts d.
The PCI value of the analyzed section is obtained by Equation (2).
where is the PCI value of the SU, and is the surface of the SU.
2.3.2. Falling Weight Deflectometer Tests (FWD)
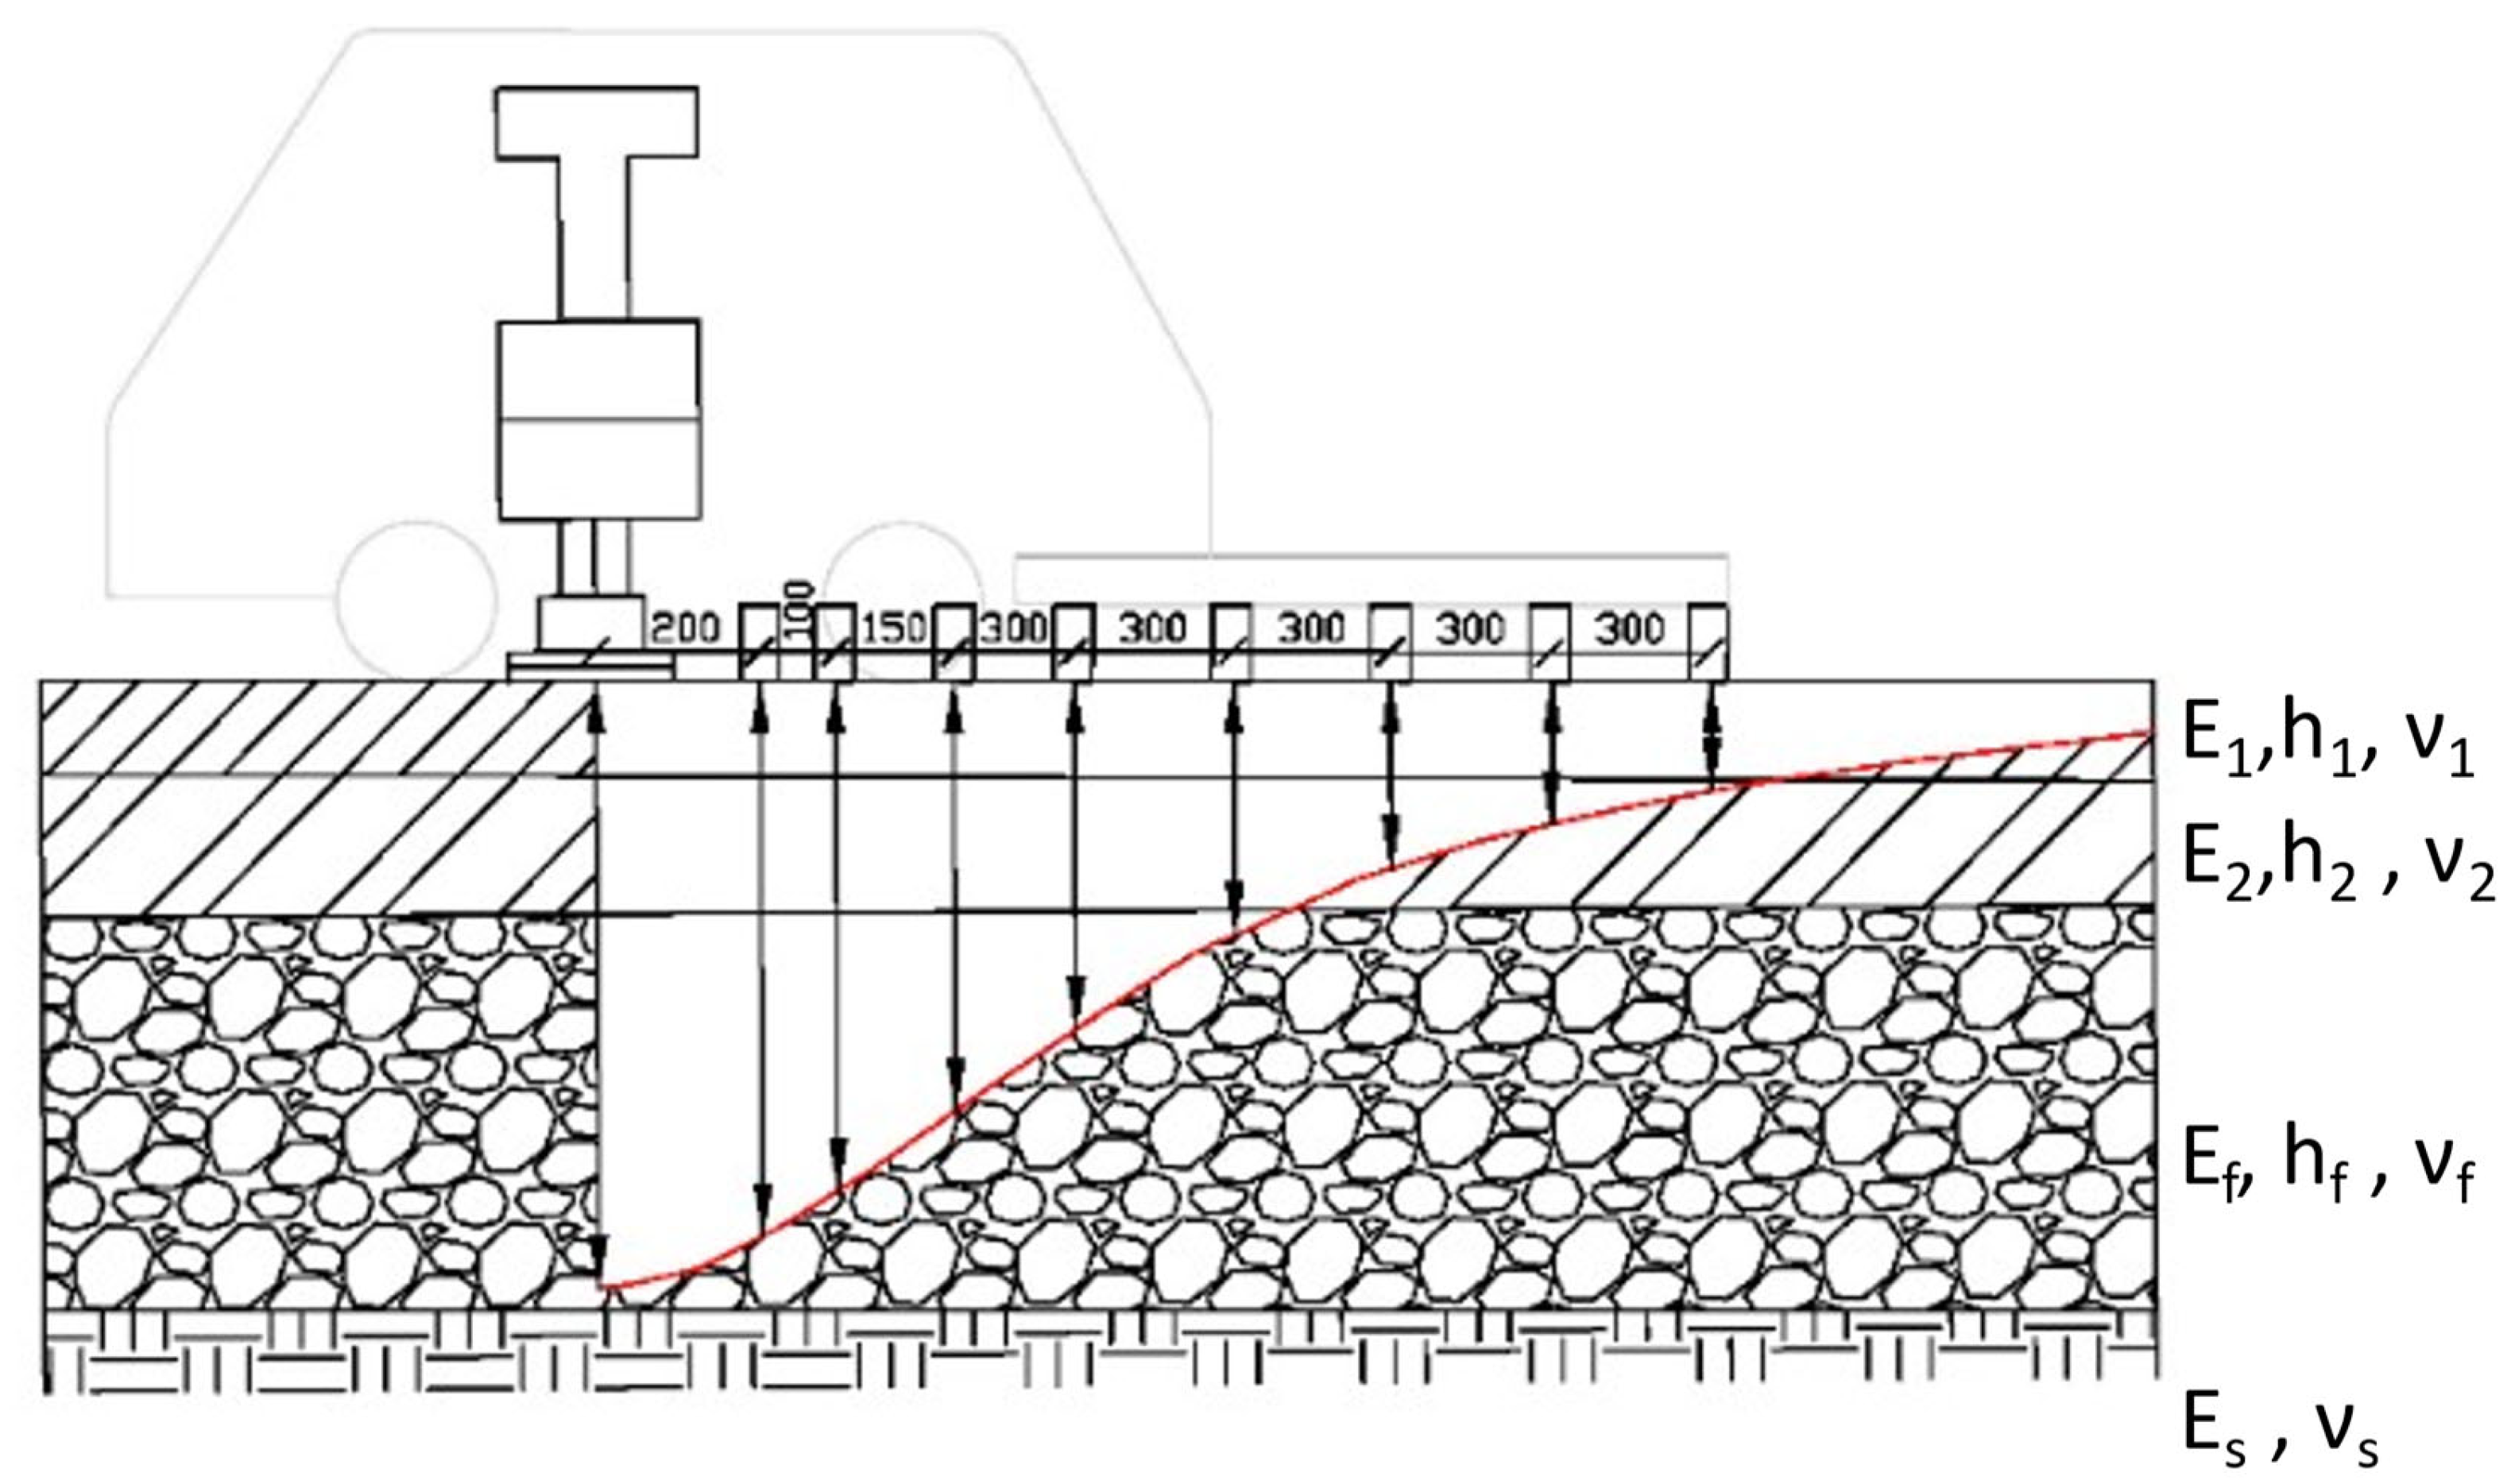
In this study, the analysis of structural pavement degradation evolutions is based on falling weight deflectometer (FWD) tests. Three different load cycles equal to 40, 55, and 85 kN were employed, using a 150 mm diameter plate. The application of each load cycle induces a deflection that is detected by geophones positioned at increasing distances, as shown in Figure 6. These instruments are designed to measure the vertical deflection of the road surface resulting from the application of the load cycles.
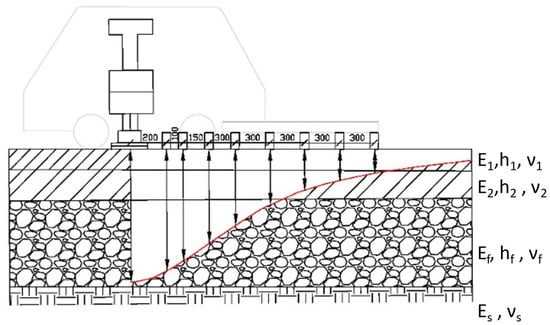
Figure 6.
Schematic diagram of the FWD test.
The initial outcome of the FWD test is a deflection basin, which requires a back-calculation process to determine the stiffness moduli of the materials. To enhance this analytical procedure, the equivalent thickness method (MET) [70,71] is incorporated to estimate the mechanical properties of different pavement layers, such as the stiffness modulus. This estimation is based on deflection basin data and accounts for the nonlinearity of the foundation and subgrade.
Initial iteration values are assigned in accordance with material types (i.e., bonded materials at 2500 MPa, unbound granular materials (UGMs) at 400 MPa, and subgrade at 100 MPa), considering the simplification provided by the MET in converting complex multilayer systems into an equivalent single layer for analysis. This approach uses a multi-layer elastic model enhanced by the MET. It attempts to emulate the identical load cycle observed in the FWD tests, thereby generating a deflection basin. During this process, iterative adjustments are made to the Young’s modulus and Poisson’s ratio for each layer. The goal is to match as closely as possible the deflection basin recorded during the FWD test. These parameters continue to be refined over several iterations until there exists a remarkable congruence between the modeled and field measured deflections. The final result is a set of stiffness modulus values that theoretically represent the material’s response to the applied load cycle during the FWD test. This provides an accurate estimate of the mechanical properties of the various layers without the need for a physical specimen.
In this study, the back-calculation on the deflection basins was performed using the commercial software ELMOD 6 (evaluation of layer modules and overlay design) [72], already applied in various scientific research projects [73,74,75,76].
3. Results and Discussion
3.1. Laboratory Test Results
3.1.1. ITSM Results
The results of the ITSM tests performed on Mi are shown in Figure 7.
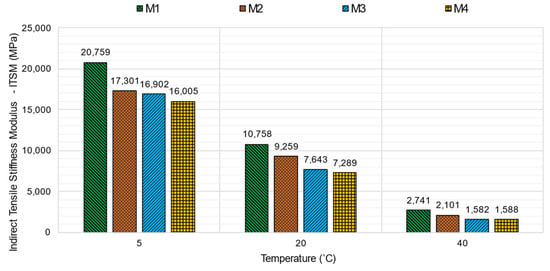
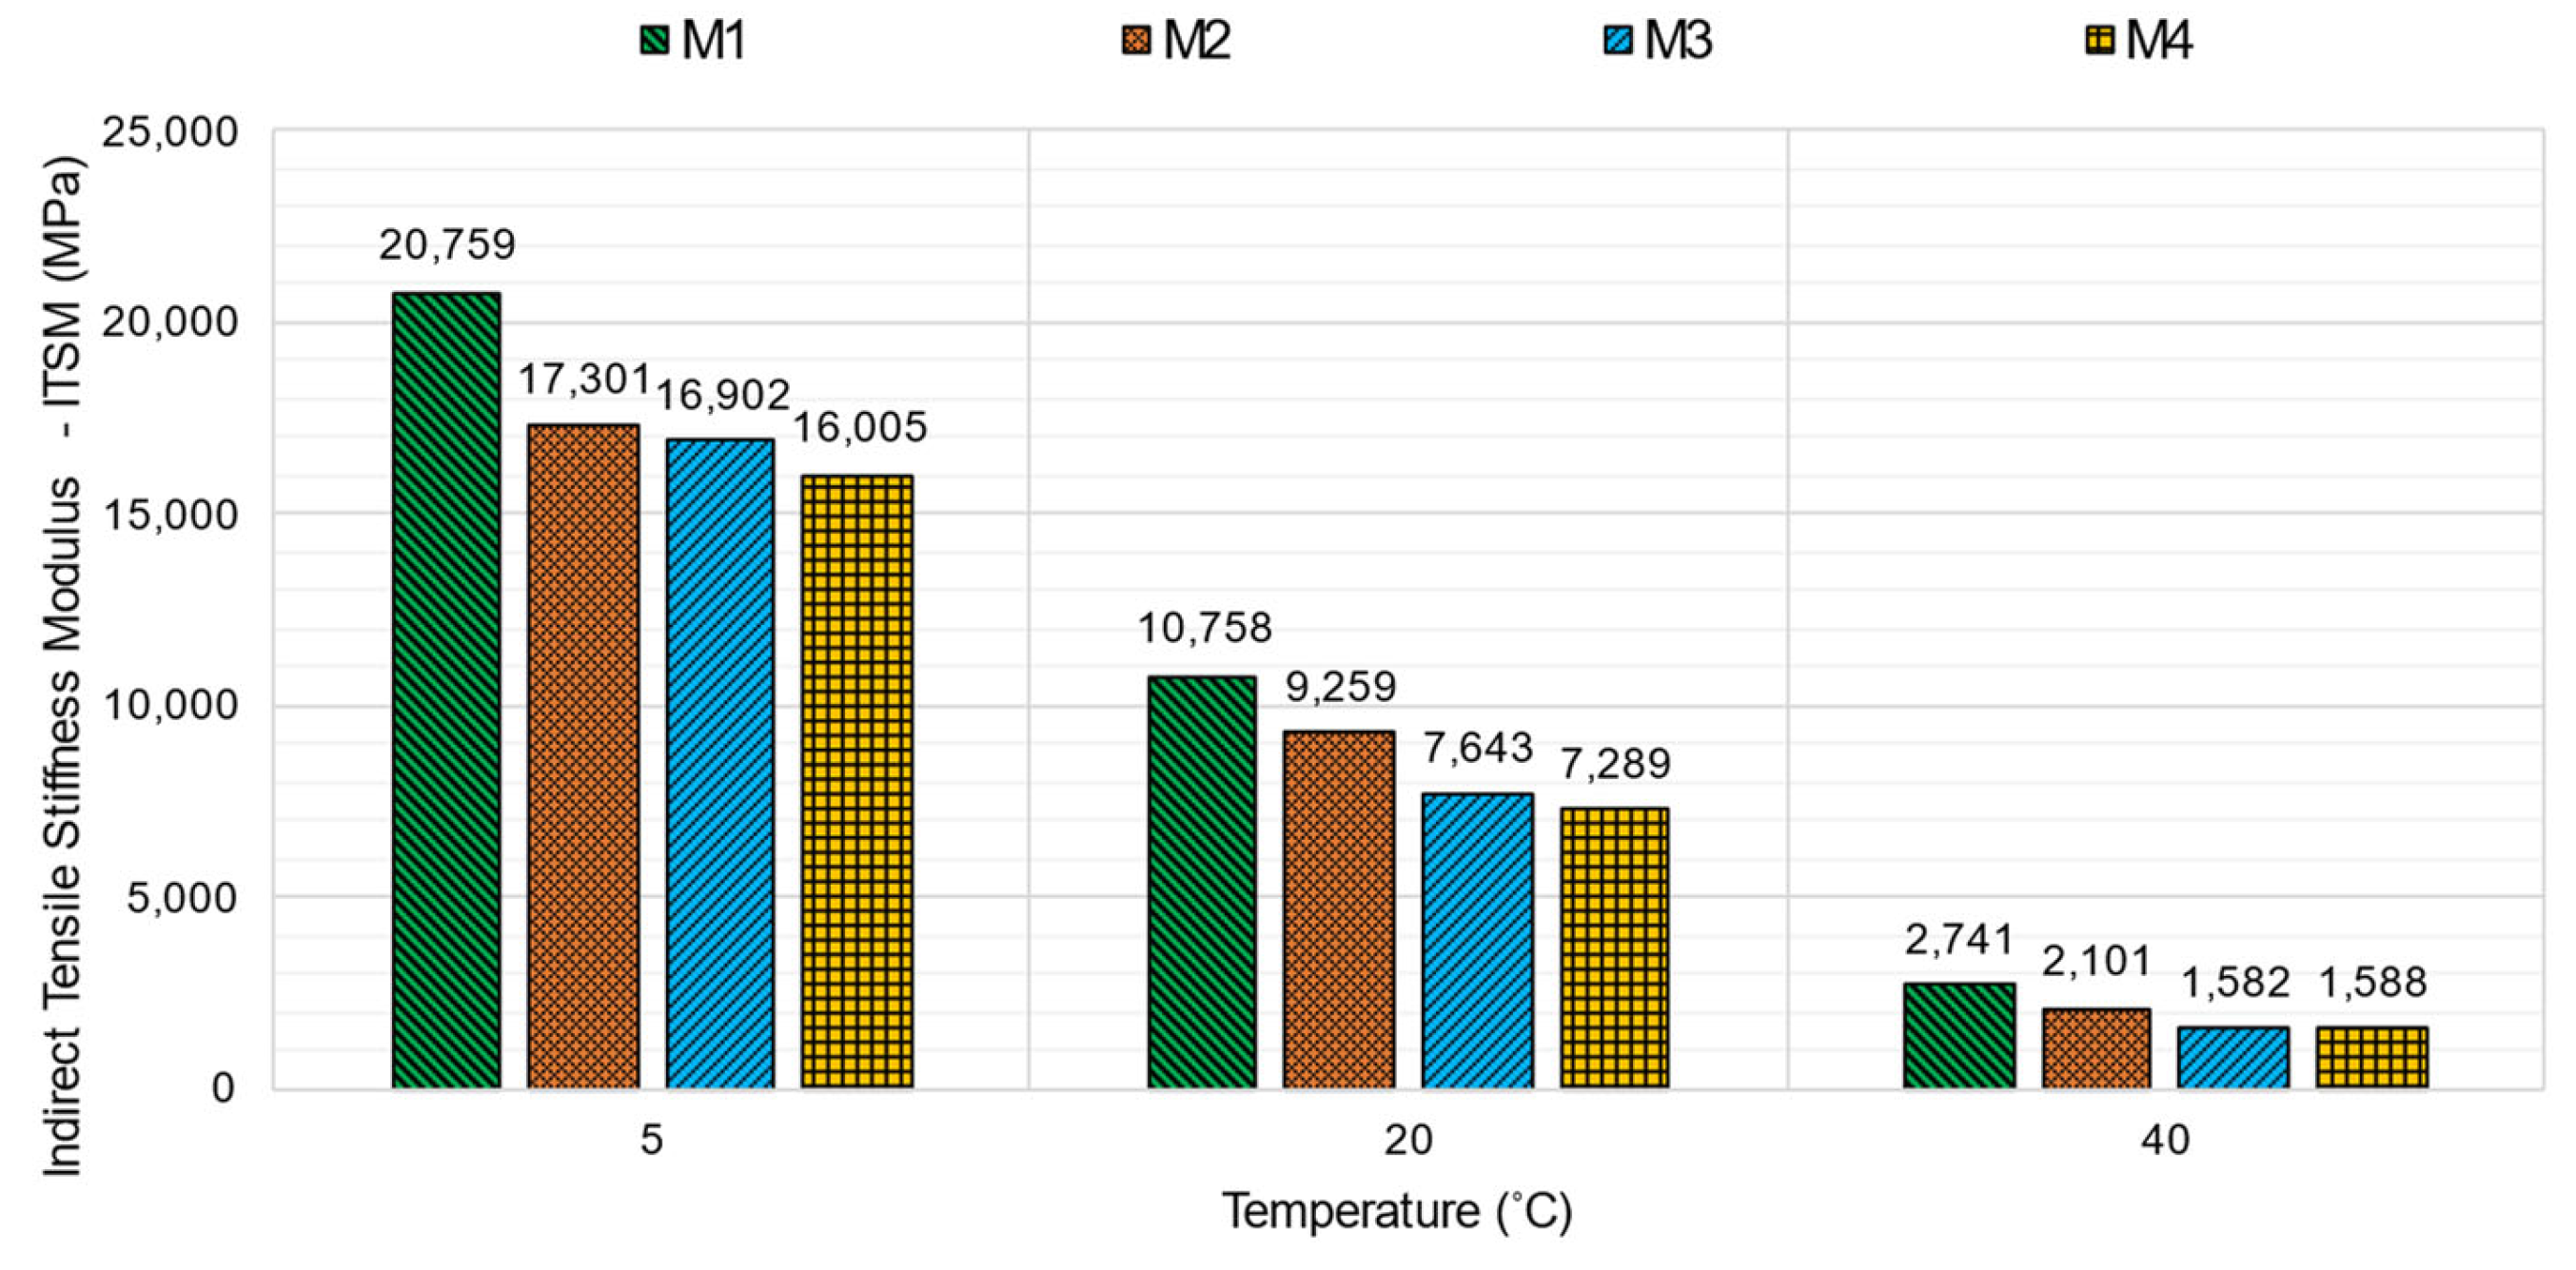
Figure 7.
ITSM test results at three different temperatures.
M1 exhibited the highest stiffness modulus values, followed by M2, M3, and finally M4, regardless of the test temperature. Specifically, the percentage of increase in stiffness was more pronounced at high temperatures (40 °C), with values of +30% compared to M2, and a substantial +73% compared to both M3 and M4. The increased stiffness at elevated temperatures can be attributed to the reduced influence of the bituminous binder as the material approaches its softening point. The GPC, on the other hand, continues to provide stability and thus represents a significant improvement over materials containing SBS polymers and especially over soft-modified or unmodified materials [77]. This is a good result because higher stiffness at high temperatures also means higher resistance to rutting phenomena [78]. Consequently, at 20 °C, the stiffness enhancement achieved by the GPC-modified mixture (M1) amounted to +16%, +41%, and +48% when compared to M2, M3, and M4, respectively. Finally, at lower temperatures (5 °C), these increments decrease to +20%, +22%, and +30%. This is also a positive observation, as an excessive increase in stiffness at low temperatures can potentially be harmful to mixtures and be the cause of thermal cracking problems [79].
3.1.2. ITF Results
As depicted in Figure 8, M1 exhibited the most favorable fatigue behavior, as the fatigue line consistently remained above the corresponding lines for the other materials at every stress level. For instance, when considering a medium-stress level of 350 kPa, the number of cycles leading to fatigue failure (Nf) is as follows: 15,637 for M1, 2701 for M2, 7688 for M3, and finally 2663 for M4. It should be noted, however, that these results were extrapolated from tests all conducted at medium/high-stress levels, and thus further tests (at low-stress levels) should be carried out to validate this aspect.
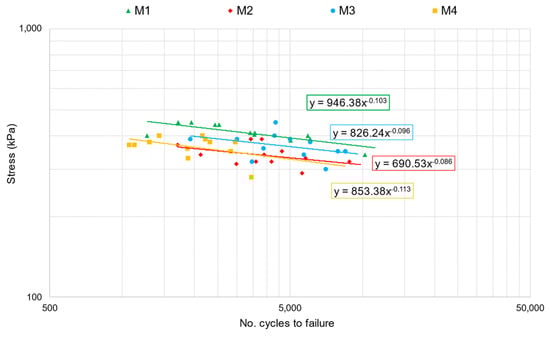
Figure 8.
Fatigue regression lines for the four different mixtures.
3.1.3. HWT Results
Figure 9 shows the results of the HWT test.

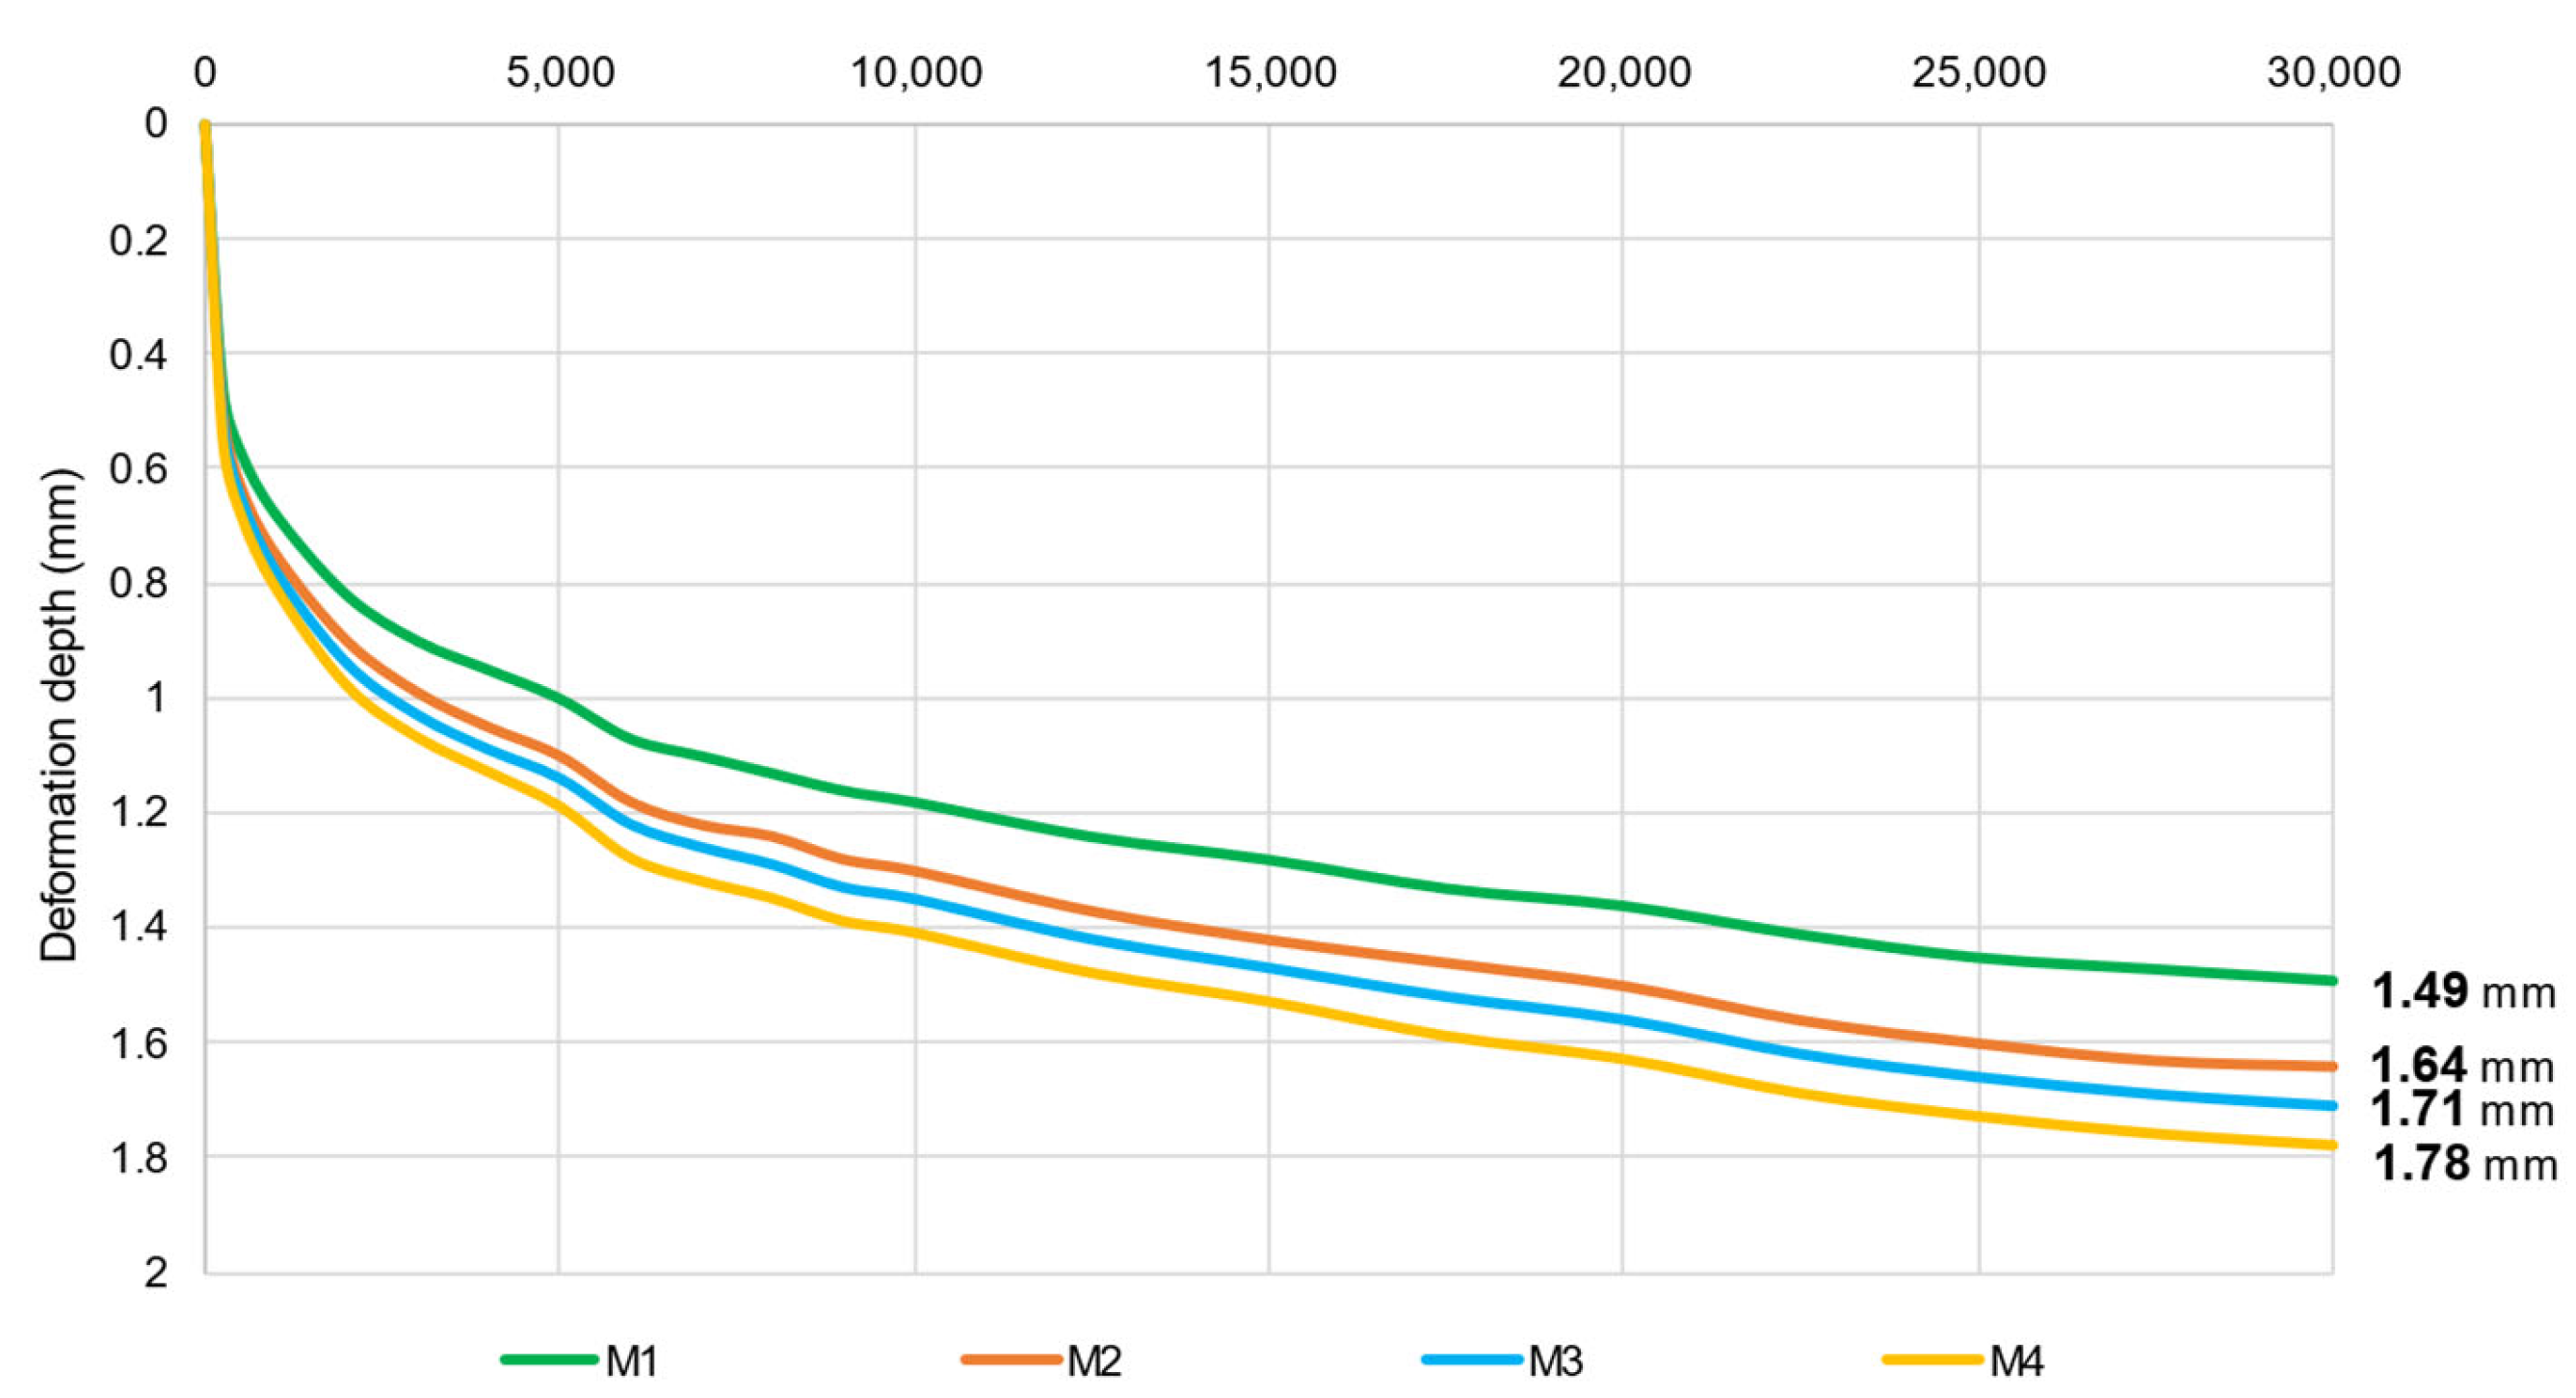
Figure 9.
Permanent deformation vs. number of passages.
In particular, the graph highlights the rutting depth (mm) as a function of the number of wheel passages, for each of the materials tested. The results show that M1 has the best performance against the accumulation of permanent deformation, due to the presence of GPC. Specifically, the final rut depth (1.49 mm) was about 13% less than M2 (1.64 mm), 15% less than M3 (1.71 mm), and finally 19.5% less than M4 (1.78 mm).
Another method for interpreting the test involves measuring the proportional rut depth (PRD), calculated as the percentage between the rut depth formed as a result of the test (after 30,000 wheel passes) and the initial thickness of the specimen. The PRD values were 3.72%, 4.27%, 4.11%, and 4.45% for M1, M2, M3, and M4, respectively, confirming the best performance of M1. Furthermore, it can be seen that Mi returned values below the limits imposed by local specifications, which usually impose a maximum acceptance threshold (5%).
These results are consistent with those obtained from the ITSM test at high temperatures, as a mixture that exhibits a higher modulus in the ITSM test demonstrates greater resistance to rutting.
3.2. In Situ Test Results
3.2.1. PCI Results
To conduct visual surveys, it is essential to identify the survey units (SU), considering the requirement for homogeneity. Therefore, before defining the SUs, sections S1 to S4 must be located on the pavement. Segments of variable length (i.e., transition zones) separate these four sections. These transition zones were prepared during construction to create a buffer between the various types of wearing course and binder, preventing localized discontinuities and ensuring a smoother material transition. In this study, the PCI was calculated for the entire study area (Figure 10), except for the transition zones.

Figure 10.
Localization of Si and SU.
The identified sections had widths ranging from 2.9 to 3 m, with surface areas varying between 188 and 226 m2. This division led to the creation of three SUs for each section. Each SU has a length between 66 and 77 m. Table 5 provides an overview of the SUs along with their respective areas, lengths in relation to the road’s longitudinal axis, and their associated sections.
Table 5.
Sample units description.
Table 6 lists the types of distress observed during the surveys, including their dimensional parameters and associated causes.
Table 6.
Distress based on ASTM D6433 and their cause.
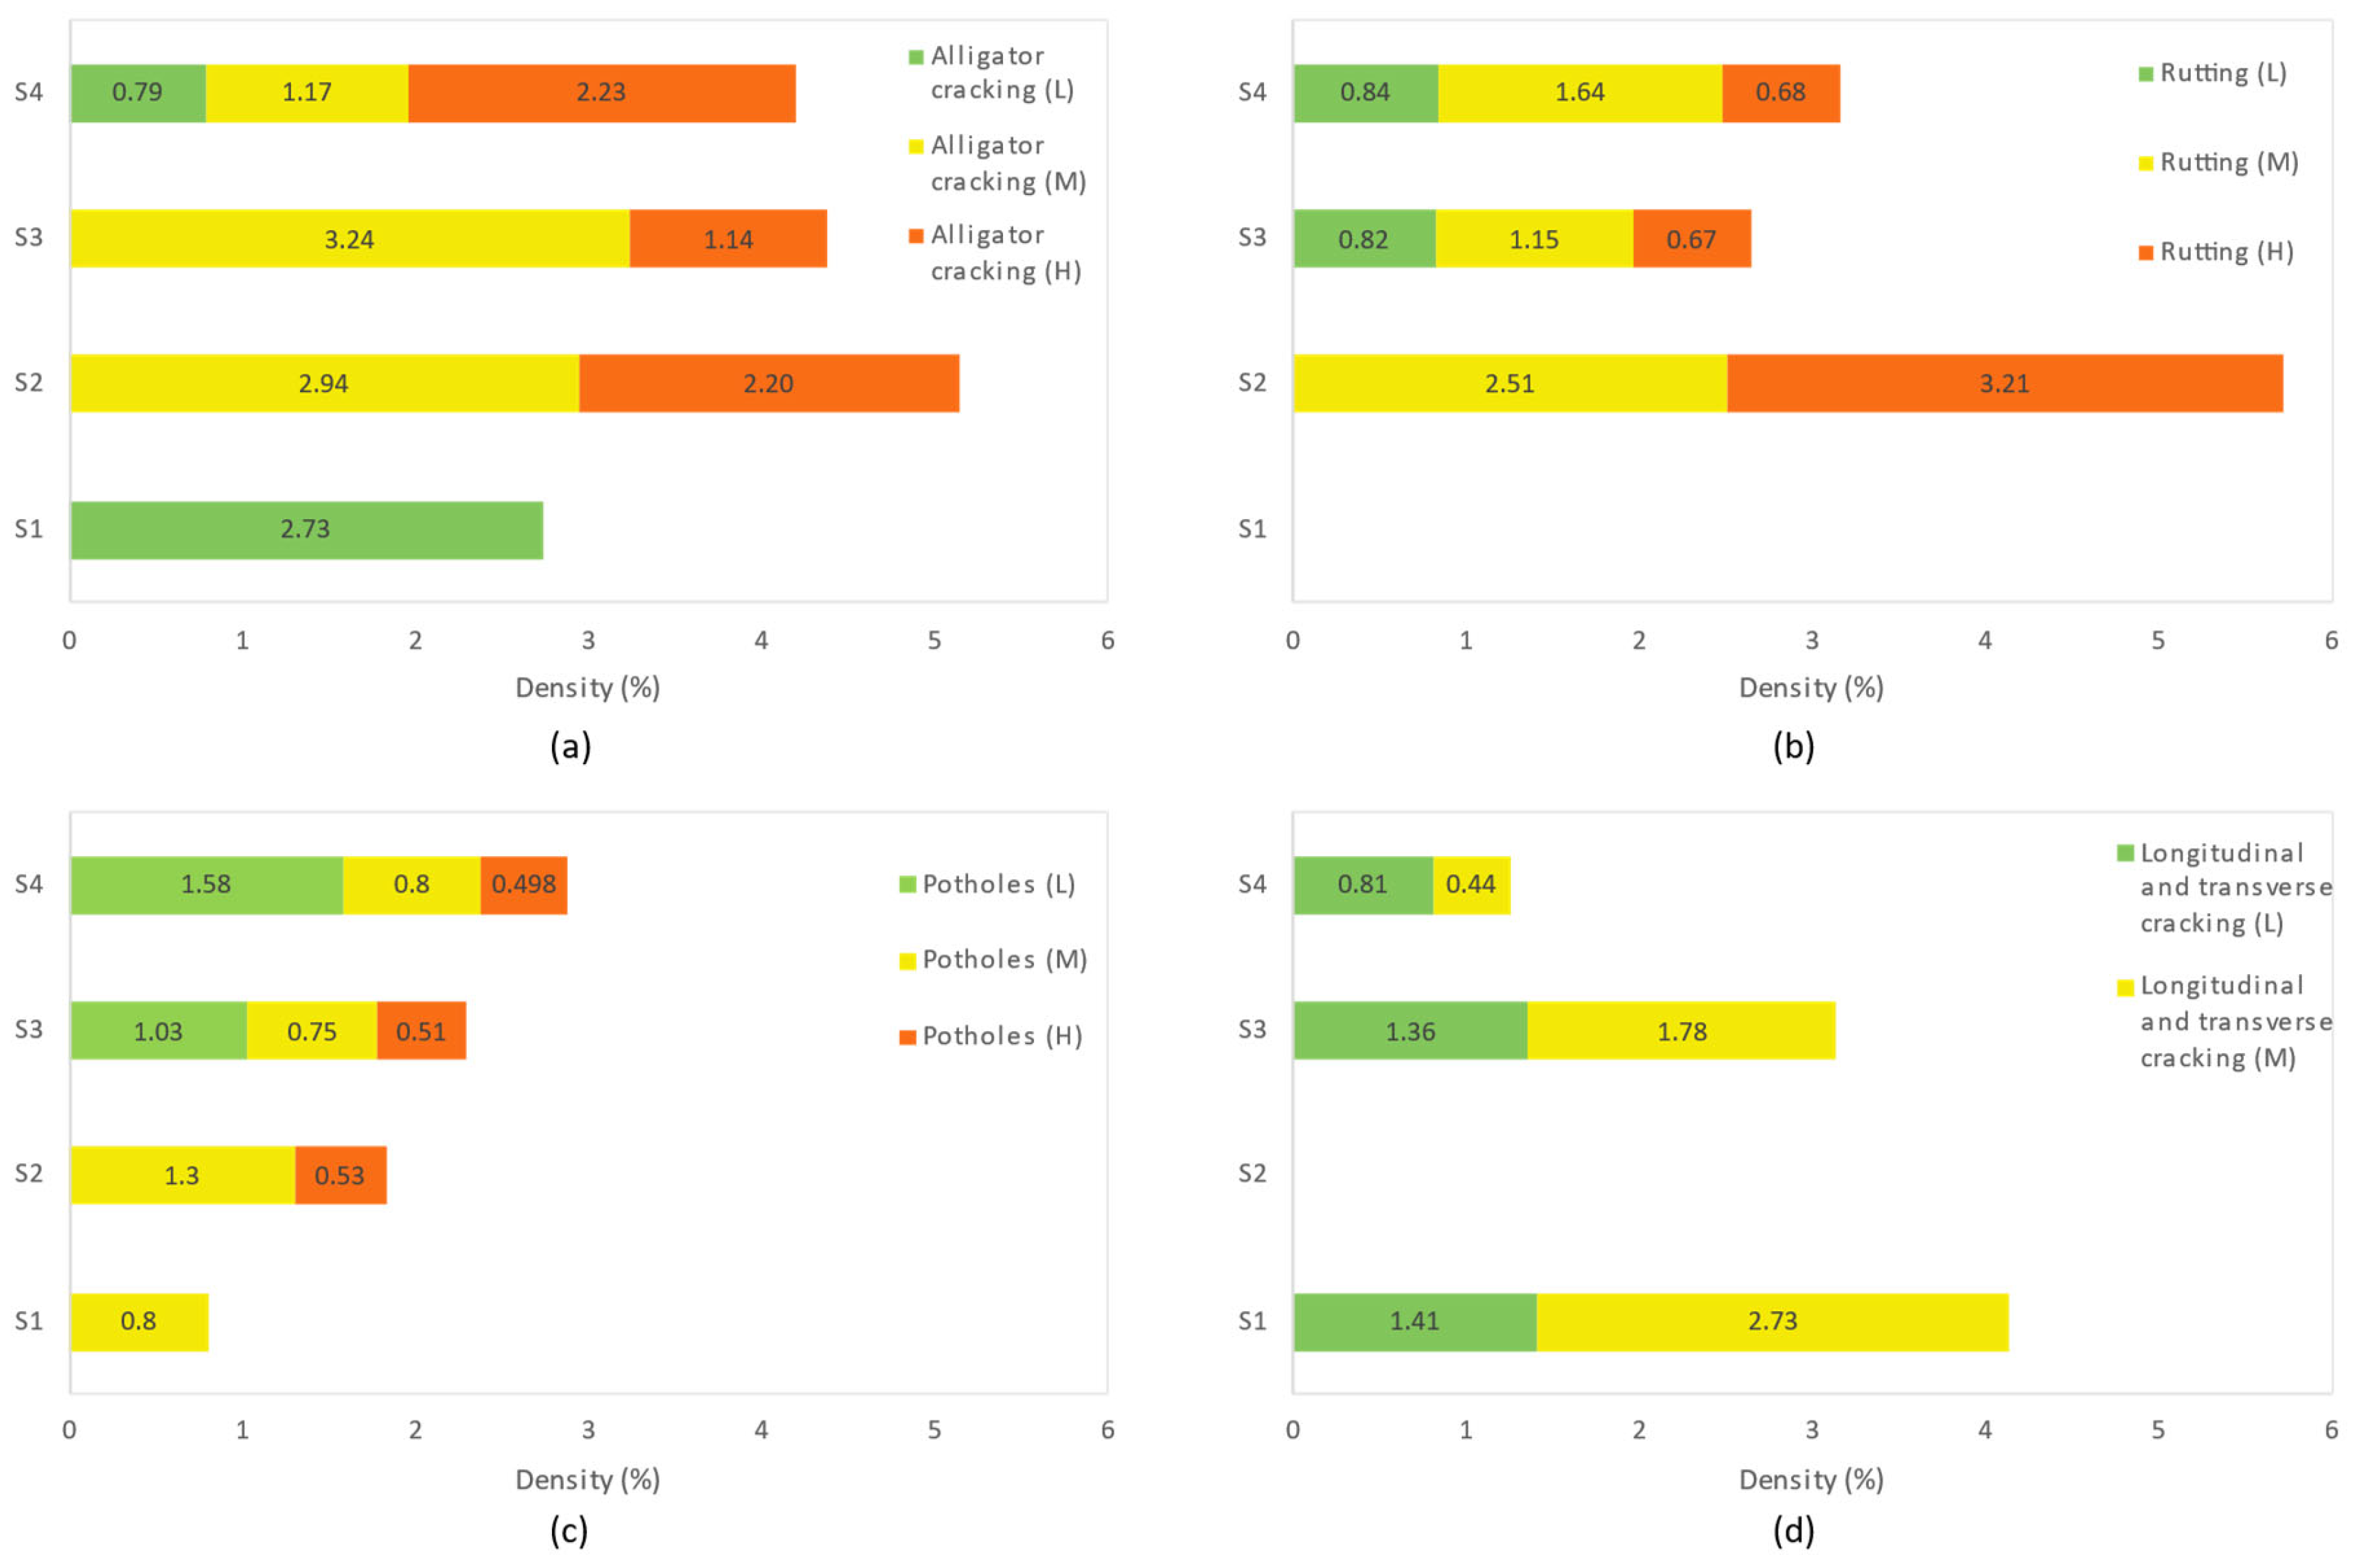
To quantify the prevalence of each type of distress in the four sections, the density (the ratio of distress area to the total SU area) for each type of distress was subsequently computed for each SU (as shown in Figure 11). Among all the distresses identified during the visual inspection, the densities of the most common distresses, such as alligator cracking (Figure 11a), rutting (Figure 11b), potholes (Figure 11c), and longitudinal and transverse cracking (Figure 11d), are presented.
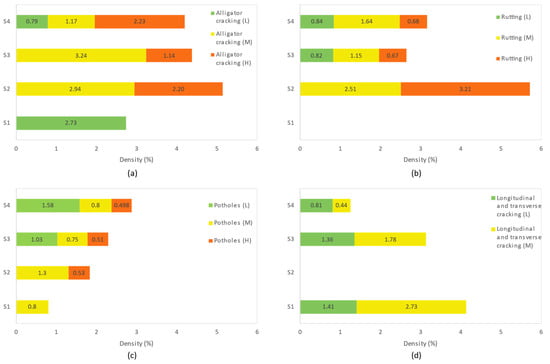
Figure 11.
Density of most detected distress: (a) alligator cracking; (b) rutting, (c) potholes, and (d) longitudinal and transverse cracking.
The densities displayed in Figure 11 were calculated according to the ASTM D6433 standard [59] concerning the area of the SUs shown in Table 5. In the diagram, because the areas of the SUs are comparable and the qualified operator who performed the inspections was always the same, the average value of the three SUs of each section for the most common distresses was reported.
Section S1 exhibits a lower density of alligator cracking, rutting, and potholes in both absolute terms and severity levels when compared to sections S2–S4. However, it exhibits a higher density of longitudinal and transverse cracking. This type of distress is more influenced by climatic factors than by loading, as indicated in Table 6. This finding is consistent with previous studies [8,80], which have shown that high-modulus asphalt pavements tend to be more susceptible to thermal stress.
The sections exhibit similar distress types to each other at a different severity level compared to the control section S4, with causes attributable mainly to traffic load.
Based on the density of each type of distress, the PCI index of each SU was calculated using Equation (1). Therefore, the overall PCI index of Si was calculated using Equation (2). The ultimate findings, as presented in Table 7, include the PCI value for each SU, the main distress, a photograph of the SU, and the PCI value for the entire section.
Table 7.
PCI values results for each SU and each section Si.
Localized defects during construction processes, such as inadequate compaction during paving or excavation and subsequent backfilling for utilities, or point infiltration from the subgrade, may account for the difference in PCI found for the same Si in different SUs.
3.2.2. FWD Results
In order to compare the performance of different Sis, the structural response of the entire pavement should be homogeneous. Therefore, FWD tests were carried out in 2018 (before the experimental sections were paved) to investigate this condition. Figure 12 shows the FWD test results for the foundation and subgrade layers.
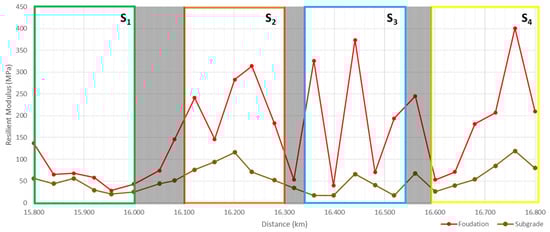
Figure 12.
Elastic modulus back-calculated from FWD tests for foundation and subgrade layers.
The investigations conducted before paving reveal that the foundation and subgrade layers have comparable values. It is noted that S1 exhibits the lowest resilient modulus values for both the foundation and the subgrade, whereas the highest values are recorded for section S3.
After surfacing the four experimental sections, the following monitoring was carried out at the following intervals:
- Phase 1: six months after paving;
- Phase 2: one year after paving;
- Phase 3: two years after paving;
- Phase 4: four years after paving;
- Phase 5: five years after paving.
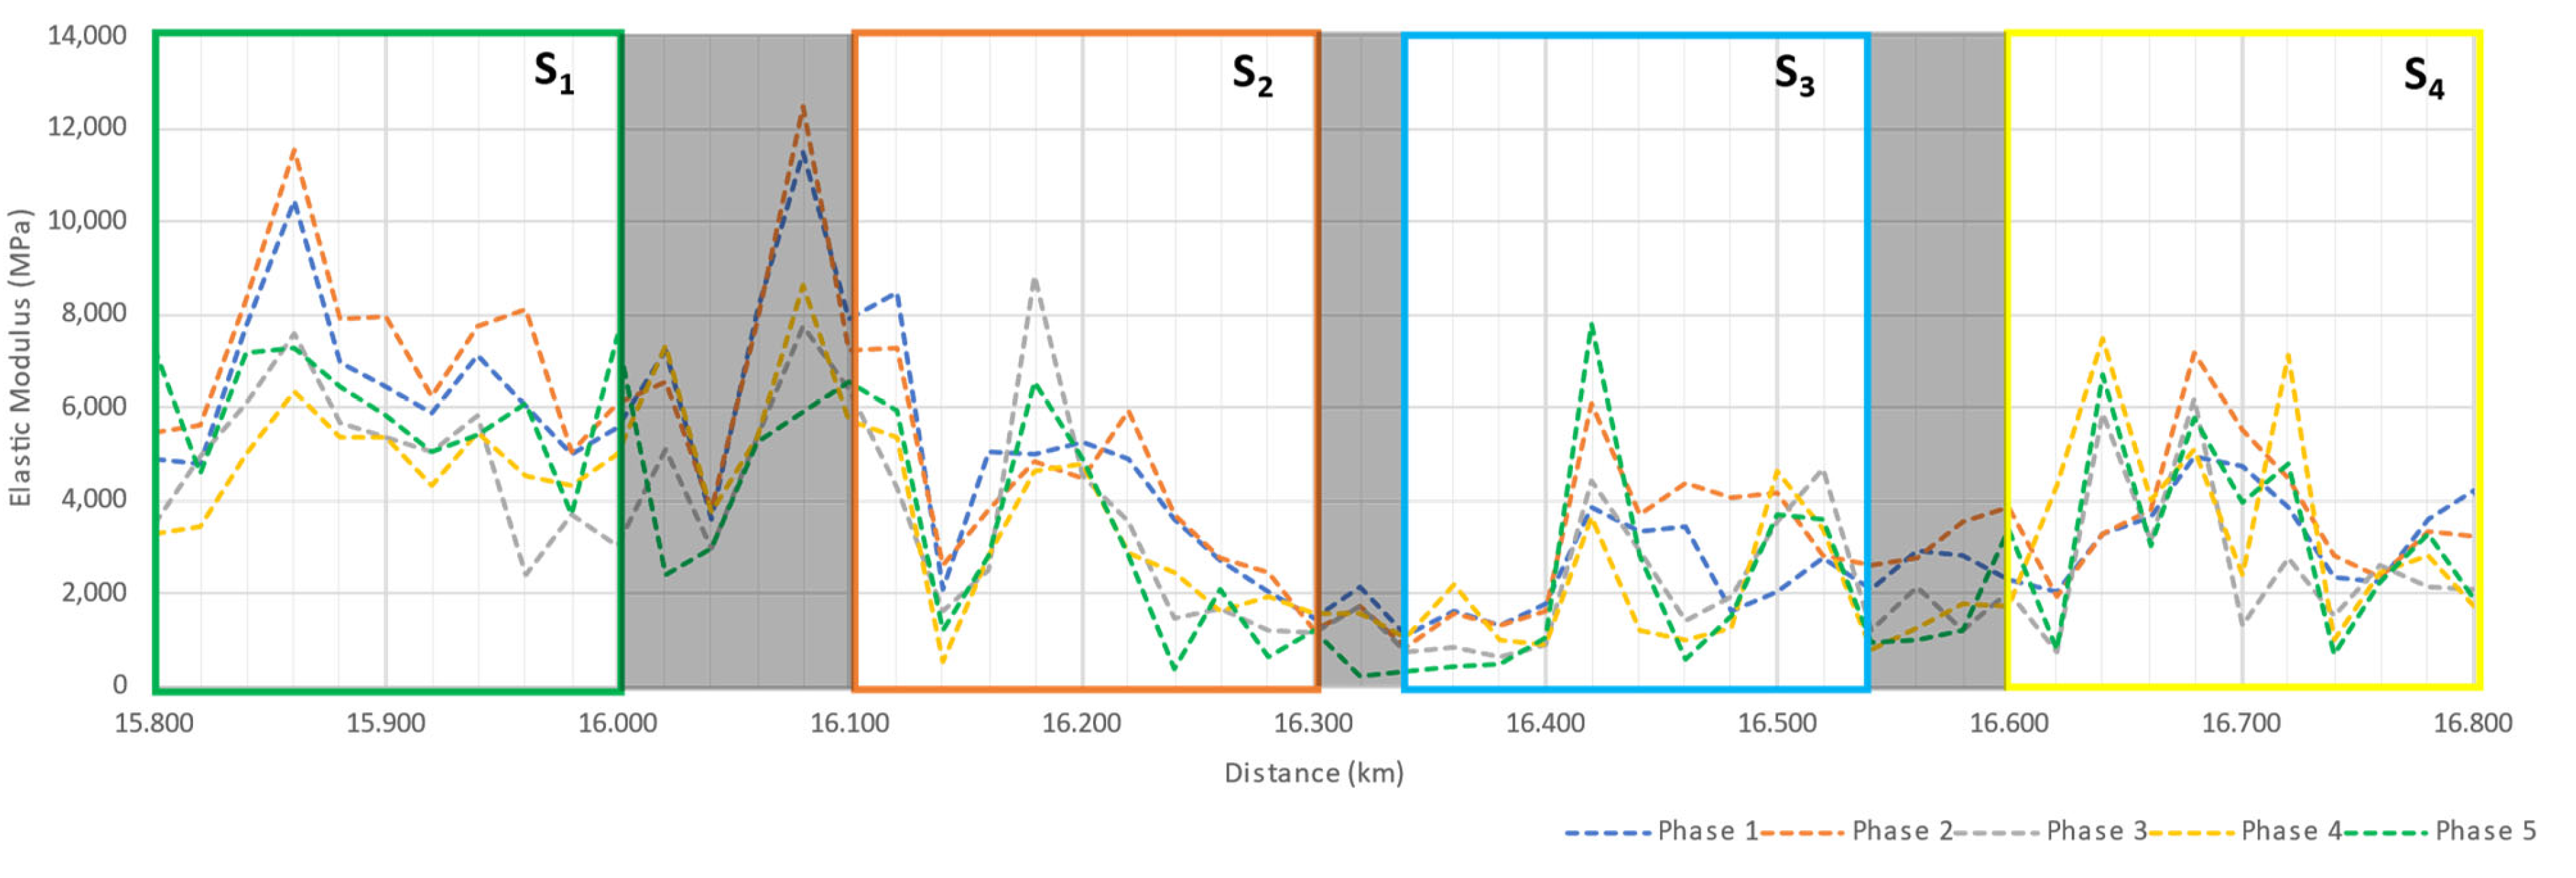
The results of the FWD measurements, after back-calculation, provide an overview of the elasticity modulus of the layers. In this case, the results allow us to plot the variation over the years of Mi elasticity moduli, as shown in Figure 13.
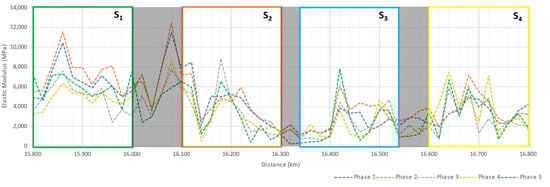
Figure 13.
Elastic modulus back-calculated from FWD tests.
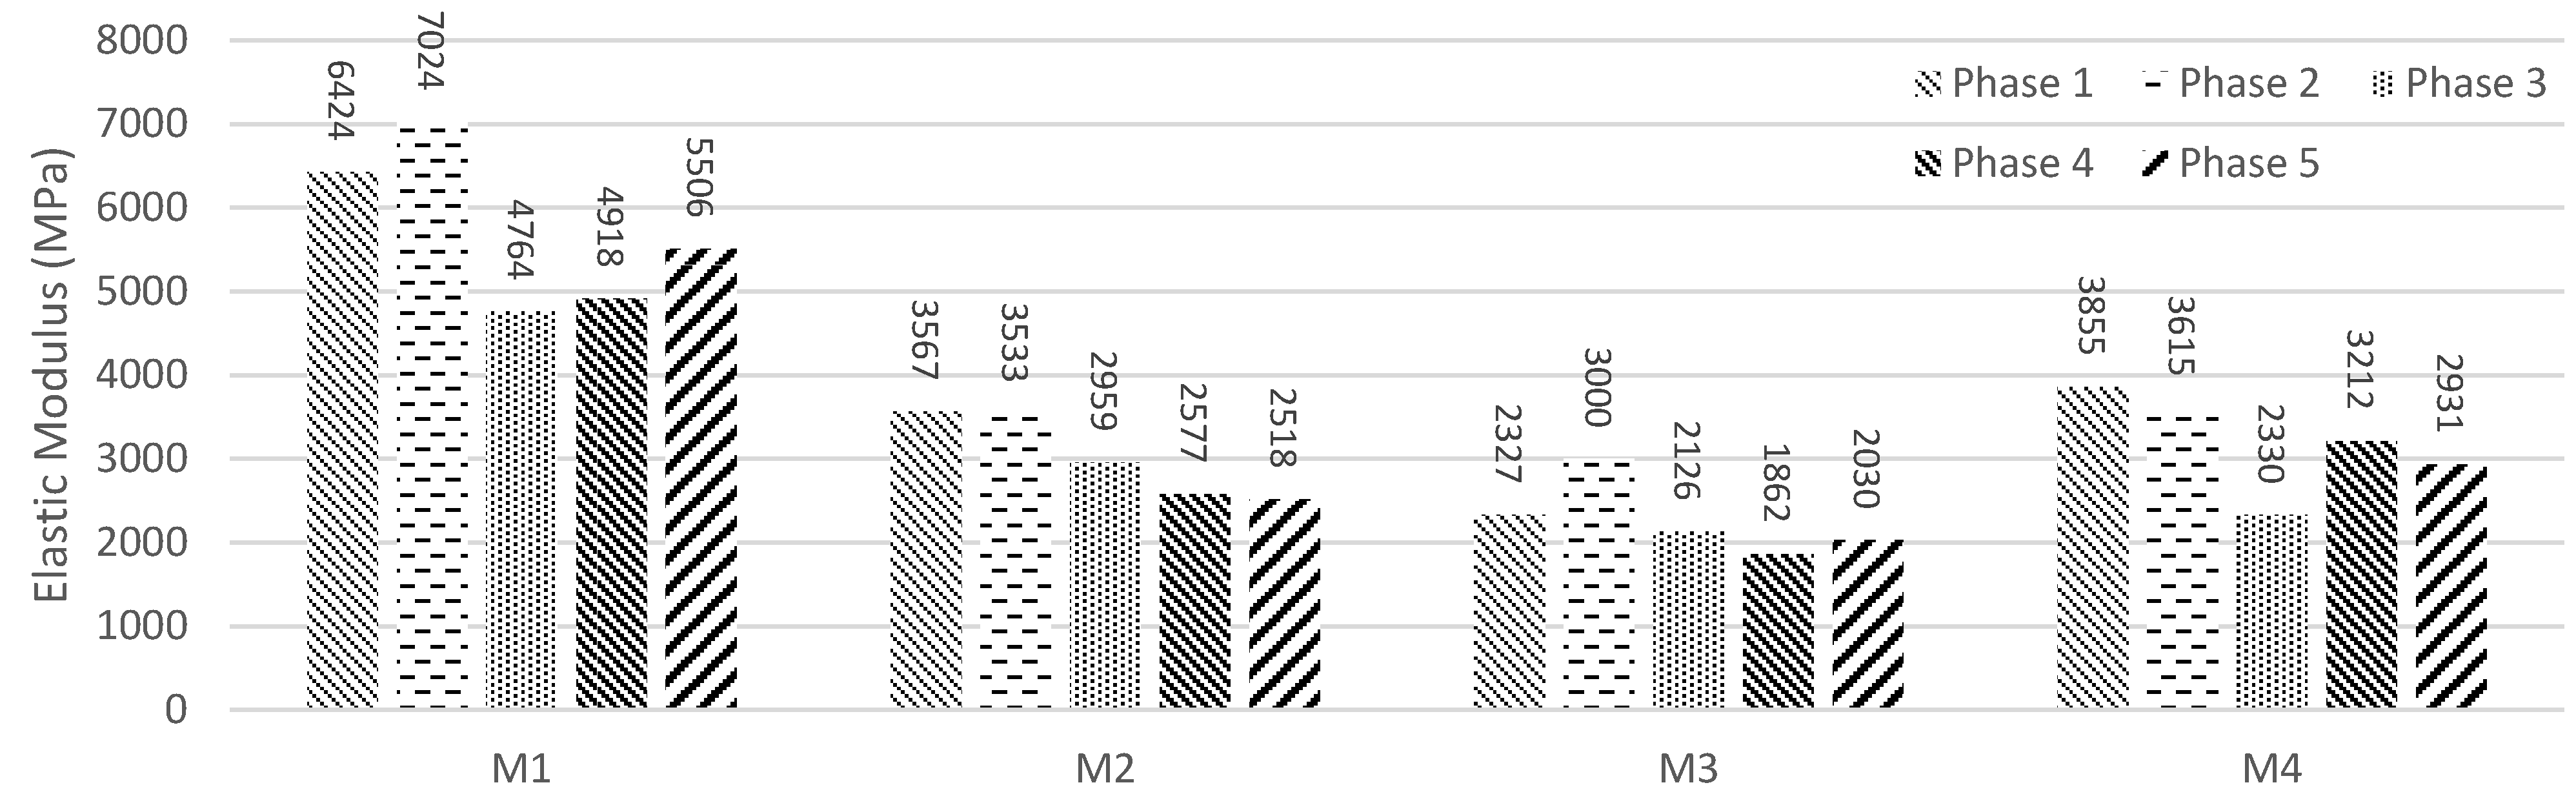
It can be observed that the highest moduli are reached one year after paving (phase 2), which is consistent with the rheological behavior of ACs. After this phase, the moduli decrease due to the formation of cracks. The development of cracks and their propagation from the lower layers to the surface, known as fatigue cracking, leads to a gradual decrease in material stiffness. This reduction in moduli was observed in this study. To illustrate this behavior more effectively, the averages of the FWD test results across the sections were computed and are depicted in Figure 14.
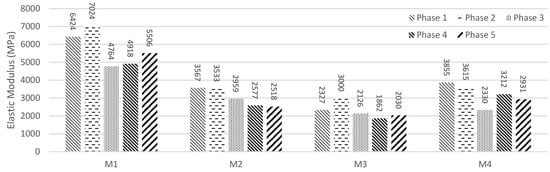
Figure 14.
Average elastic modulus from FWD tests.
M1 exhibited an initial elastic modulus of 6424 MPa, representing an 80% increase over M2 (3567 MPa), a 176% increase over M3 (2327 MPa), and a 66% increase over M4 (3855 MPa) from the first survey. After 5 years, the high-modulus asphalt M1 experienced a modest reduction of approximately 17% in its initial modulus. In contrast, M2, M3, and M4 experienced more significant reductions of 42%, 15%, and 32%, respectively. This reduction in modulus is indicative of the progression of crack development [81]. After the same number of years, M1 demonstrated the best stiffness performance (5506 MPa), followed by M4 (2931 MPa), M2 (2518 MPa), and finally, M3 (2030 MPa).
Finally, Table 8 shows the price per unit of the four mixtures obtained from the regional price schedule of the Lombardy Region [82], the only Italian authority that has provided such analyses for Mi.
Table 8.
Prices from the price schedule of Lombardy Region.
In particular, M1 is 36% and 16% more expensive than M4 and M2 (reference for modified mixtures), respectively. However, at the end of the test period, the improved mechanical performances of M1 return an acceptable residual life in the long term (Table 7 and Figure 14), compared to the other sections that are in a critical condition and require expensive and urgent maintenance activities.
Thus, a proper economic evaluation of the four proposed solutions should include a comparison of all direct and indirect costs incurred by the community over the service life of the pavement over a sufficient interval of analysis (i.e., from paving to full rehabilitation). Such an analysis would be the subject of further studies that are beyond the scope of this research paper.
4. Conclusions
In this study, a comparative analysis of four distinct ACs through laboratory and in situ tests was conducted. More precisely, the research aimed to compare the performance of an AC modified with a GPC with three other mixtures commonly used in road construction (i.e., a mixture of SBS-modified bitumen, a mixture modified with a polymer compound, and finally a mixture consisting of unmodified bitumen). The conclusions of the research are summarized below:
- Laboratory ITSM tests indicated that the material containing the GPC exhibited the highest stiffness values at different temperatures, especially at intermediate to high temperatures (+16% at 20 °C and +30% at 40 °C when compared to M2);
- ITF test results demonstrated the best fatigue behavior in the GPC mixture, which was further confirmed by in situ tests;
- The addition of the GPC also led to a significant improvement in terms of resistance to permanent deformation at high temperatures (HWT), aligning with the high-temperature ITSM test results (+13%, +15%, and +19.5% compared to M2, M3, and M4, respectively);
- The surveys conducted and the calculation of the PCI index provided a clear picture of the level of degradation reached at the end of the life cycle of the four sections. S1 had a PCI index of 65, while S2 to S4 sections returned PCI values equal to 17, 28, and 29, respectively. The significant difference in the index between S1 and the remaining sections indicates that the mixture M1 proved to be the most adept at enduring heavy traffic loads, but was more susceptible to thermal cracking;
- Over a five-year monitoring period, the FWD test results have provided significant knowledge into the long-term performance of the different ACs. S1 consistently showed higher modulus values than the other sections. This is an indication of a long-term structural integrity and superior resistance to deformation under traffic loads over 6 years. On the other hand, S2, S3, and S4 showed a gradual decrease in the elastic modulus. This trend suggests a greater susceptibility to structural degradation over time. These long-term FWD results are critical in demonstrating the effectiveness of the GPC mixture in extending the life and maintaining the structural integrity of road pavements, particularly given high traffic loads and varying climatic conditions.
In terms of cost, M1 is 16% more expensive than M2 at zero time. On the other hand, modified asphalt with a graphene-enhanced polymeric compound could be considered a suitable innovative technology for paving high-traffic roads as maintenance costs are cut down during the service life.
Author Contributions
Conceptualization, G.L. and L.V. (Loretta Venturini); methodology, G.L., S.B. and L.V. (Lorenzo Vita); software, S.B. and L.V. (Lorenzo Vita); validation, L.V. (Loretta Venturini) and C.C.; formal analysis, G.L. and C.C.; investigation, S.B. and L.V. (Lorenzo Vita); resources, G.L.; data curation, L.V. (Loretta Venturini) and C.C.; writing—original draft preparation, C.C., S.B. and L.V. (Lorenzo Vita); writing—review and editing, G.L. and L.V. (Loretta Venturini); visualization, S.B.; supervision, S.B. and G.L.; project administration, G.L. and L.V. (Loretta Venturini); funding acquisition, G.L. and L.V. (Loretta Venturini). All authors have read and agreed to the published version of the manuscript.
Funding
This research received no external funding.
Data Availability Statement
The data presented in this study are available on request from the corresponding author. The data are not publicly available for confidentiality reasons.
Acknowledgments
The authors would like to acknowledge Iterchimica S.p.A. for their collaboration and availability, and also for providing the testing materials for this study. The new graphene-enhanced polymeric supermodifer considered in this paper was developed through the “ECOPAVE PROJECT”, which was funded by the European Union and the Lombardy Region (POR-FESR 2014-2020/Innovation and Competitivity). The authors would like to acknowledge GRS studio for their contribution to our research through the use of ELMOD software.
Conflicts of Interest
Lorenzo Vita is receiving a reserch grant co-financed by the Iterchimica company and the National Operational Program with European structural funds. Carlo Carpani and Loretta Venturini were employed by the Iterchimica S.p.A. Other authors declare no conflicts of interest.
References
- Mohod, M.V.; Kadam, D.K.N. A Comparative Study on Rigid and Flexible Pavement: A Review. IOSR J. Mech. Civ. Eng. IOSR-JMCE 2016, 13, 84–88. [Google Scholar]
- Ventura, R. Bridge’s Vehicular Loads Characterization through Weight-In-Motion (WIM) Systems. The Case Study of Brescia. Eur. Transp. 2023, 1–12. [Google Scholar] [CrossRef]
- Ventura, R.; Barabino, B.; Vetturi, D.; Maternini, G. Monitoring Vehicles with Permits and That Are Illegally Overweight on Bridges Using Weigh-In-Motion (WIM) Devices: A Case Study from Brescia. Case Stud. Transp. Policy 2023, 13, 101023. [Google Scholar] [CrossRef]
- Liu, Y.; Su, P.; Li, M.; You, Z.; Zhao, M. Review on Evolution and Evaluation of Asphalt Pavement Structures and Materials. J. Traffic Transp. Eng. (Engl. Ed.) 2020, 7, 573–599. [Google Scholar] [CrossRef]
- Assogba, O.C.; Tan, Y.; Sun, Z.; Lushinga, N.; Bin, Z. Effect of Vehicle Speed and Overload on Dynamic Response of Semi-Rigid Base Asphalt Pavement. Road Mater. Pavement Des. 2021, 22, 572–602. [Google Scholar] [CrossRef]
- Kamal, I.; Bas, Y. Materials and Technologies in Road Pavements—An Overview. Mater. Today Proc. 2021, 42, 2660–2667. [Google Scholar] [CrossRef]
- Ullah, S.; Yang, C.; Cao, L.; Wang, P.; Chai, Q.; Li, Y.; Wang, L.; Dong, Z.; Lushinga, N.; Zhang, B. Material Design and Performance Improvement of Conductive Asphalt Concrete Incorporating Carbon Fiber and Iron Tailings. Constr. Build. Mater. 2021, 303, 124446. [Google Scholar] [CrossRef]
- Chen, Y.; Wang, H.; Xu, S.; You, Z. High Modulus Asphalt Concrete: A State-of-the-Art Review. Constr. Build. Mater. 2020, 237, 117653. [Google Scholar] [CrossRef]
- Abed, A.H.; Bahia, H.U. Enhancement of Permanent Deformation Resistance of Modified Asphalt Concrete Mixtures with Nano-High Density Polyethylene. Constr. Build. Mater. 2020, 236, 117604. [Google Scholar] [CrossRef]
- Heitzman, M.A. State of the Practice: Design and Construction of Asphalt Paving Materials with Crumb-Rubber Modifier. Final Report; Federal Highway Administration, Office of Engineering: Washington, DC, USA, 1992.
- Alfayez, S.A.; Suleiman, A.R.; Nehdi, M.L. Recycling Tire Rubber in Asphalt Pavements: State of the Art. Sustainability 2020, 12, 9076. [Google Scholar] [CrossRef]
- Habbouche, J.; Boz, I.; Diefenderfer, B.K.; Smith, B.C.; Adel, S.H. State of the Practice for High Polymer-Modified Asphalt Binders and Mixtures. Transp. Res. Rec. 2021, 2675, 235–247. [Google Scholar] [CrossRef]
- Zhu, J.; Birgisson, B.; Kringos, N. Polymer Modification of Bitumen: Advances and Challenges. Eur. Polym. J. 2014, 54, 18–38. [Google Scholar] [CrossRef]
- Brasileiro, L.; Moreno-Navarro, F.; Tauste-Martínez, R.; Matos, J.; del Carmen Rubio-Gámez, M. Reclaimed Polymers as Asphalt Binder Modifiers for More Sustainable Roads: A Review. Sustainability 2019, 11, 646. [Google Scholar] [CrossRef]
- Prahara, E.; Aswita, F.; Shinta, E.S.N.P. The Effect of High-Density Polyethylene (HDPE) and Low-Density Polyethylene (LDPE) on Characteristics of Asphalt Concrete with Dry and Wet Mixing Process. IOP Conf. Ser. Mater. Sci. Eng. 2020, 852, 012056. [Google Scholar] [CrossRef]
- Miranda, H.M.B.; Domingues, D.; Rato, M.J. The Influence of Recycled Plastics Added via the Dry Process on the Properties of Bitumen and Asphalt Mixtures. Transp. Eng. 2023, 13, 100197. [Google Scholar] [CrossRef]
- Duarte, G.M.; Faxina, A.L. Asphalt Concrete Mixtures Modified with Polymeric Waste by the Wet and Dry Processes: A Literature Review. Constr. Build. Mater. 2021, 312, 125408. [Google Scholar] [CrossRef]
- Asim, N.; Badiei, M.; Samsudin, N.A.; Mohammad, M.; Razali, H.; Soltani, S.; Amin, N. Application of Graphene-Based Materials in Developing Sustainable Infrastructure: An Overview. Compos. Part B Eng. 2022, 245, 110188. [Google Scholar] [CrossRef]
- Eskandarsefat, S.; Dondi, G.; Sangiorgi, C. Recycled and Rubberized SMA Modified Mixtures: A Comparison between Polymer Modified Bitumen and Modified Fibres. Constr. Build. Mater. 2019, 202, 681–691. [Google Scholar] [CrossRef]
- Riekstins, A.; Baumanis, J.; Barbars, J. Laboratory Investigation of Crumb Rubber in Dense Graded Asphalt by Wet and Dry Processes. Constr. Build. Mater. 2021, 292, 123459. [Google Scholar] [CrossRef]
- Tahami, S.A.; Mirhosseini, A.F.; Dessouky, S.; Mork, H.; Kavussi, A. The Use of High Content of Fine Crumb Rubber in Asphalt Mixes Using Dry Process. Constr. Build. Mater. 2019, 222, 643–653. [Google Scholar] [CrossRef]
- Nizamuddin, S.; Boom, Y.J.; Giustozzi, F. Sustainable Polymers from Recycled Waste Plastics and Their Virgin Counterparts as Bitumen Modifiers: A Comprehensive Review. Polymers 2021, 13, 3242. [Google Scholar] [CrossRef]
- Ranieri, M.; Costa, L.; Oliveira, J.R.M.; Silva, H.M.R.D.; Celauro, C. Asphalt Surface Mixtures with Improved Performance Using Waste Polymers via Dry and Wet Processes. J. Mater. Civ. Eng. 2017, 29, 04017169. [Google Scholar] [CrossRef]
- Xu, F.; Zhao, Y.; Li, K. Using Waste Plastics as Asphalt Modifier: A Review. Materials 2022, 15, 110. [Google Scholar] [CrossRef] [PubMed]
- Venturini, L.; Eskandarsefat, S. High performance PMA: From polymeric compounds to graphene-based super modifier. In Proceedings of the 26th World Road CongressWorld Road Association (PIARC), Abu Dhabi, United Arab Emirates, 6–10 October 2019. [Google Scholar]
- Munera, J.C.; Ossa, E.A. Polymer Modified Bitumen: Optimization and Selection. Mater. Des. (1980–2015) 2014, 62, 91–97. [Google Scholar] [CrossRef]
- Lastra-González, P.; Calzada-Pérez, M.A.; Castro-Fresno, D.; Vega-Zamanillo, Á.; Indacoechea-Vega, I. Comparative Analysis of the Performance of Asphalt Concretes Modified by Dry Way with Polymeric Waste. Constr. Build. Mater. 2016, 112, 1133–1140. [Google Scholar] [CrossRef]
- Viscione, N.; Lo Presti, D.; Veropalumbo, R.; Oreto, C.; Biancardo, S.A.; Russo, F. Performance-Based Characterization of Recycled Polymer Modified Asphalt Mixture. Constr. Build. Mater. 2021, 310, 125243. [Google Scholar] [CrossRef]
- Mishra, B.; Gupta, M.K. Use of Plastic Waste in Bituminous Mixes by Wet and Dry Methods. Proc. Inst. Civ. Eng.-Munic. Eng. 2020, 173, 87–97. [Google Scholar] [CrossRef]
- Ma, Y.; Zhou, H.; Jiang, X.; Polaczyk, P.; Xiao, R.; Zhang, M.; Huang, B. The Utilization of Waste Plastics in Asphalt Pavements: A Review. Clean. Mater. 2021, 2, 100031. [Google Scholar] [CrossRef]
- Movilla-Quesada, D.; Raposeiras, A.C.; Silva-Klein, L.T.; Lastra-González, P.; Castro-Fresno, D. Use of Plastic Scrap in Asphalt Mixtures Added by Dry Method as a Partial Substitute for Bitumen. Waste Manag. 2019, 87, 751–760. [Google Scholar] [CrossRef]
- Bocci, E.; Prosperi, E.; Bocci, M. Influence of the Hot-Mix Asphalt Production Temperature on the Effectiveness of the Reclaimed Asphalt Rejuvenation Process. Infrastructures 2023, 8, 8. [Google Scholar] [CrossRef]
- Guo, M.; Liu, H.; Jiao, Y.; Mo, L.; Tan, Y.; Wang, D.; Liang, M. Effect of WMA-RAP Technology on Pavement Performance of Asphalt Mixture: A State-of-the-Art Review. J. Clean. Prod. 2020, 266, 121704. [Google Scholar] [CrossRef]
- Fiore, N.; Bruno, S.; Del Serrone, G.; Iacobini, F.; Giorgi, G.; Rinaldi, A.; Moretti, L.; Duranti, G.M.; Peluso, P.; Vita, L.; et al. Experimental Analysis of Hot-Mix Asphalt (HMA) Mixtures with Reclaimed Asphalt Pavement (RAP) in Railway Sub-Ballast. Materials 2023, 16, 1335. [Google Scholar] [CrossRef] [PubMed]
- Suchismita, A.; Singh, D. Rheological Performance of Bitumen Mixed with Laboratory Simulated Polymerized RAP Binders. Constr. Build. Mater. 2023, 400, 132706. [Google Scholar] [CrossRef]
- Moreno-Navarro, F.; Sierra, F.J.; Sol-Sánchez, M.; Rubio-Gámez, M.C.; Castillo, M.; Estévez, E. High-Performance Sustainable Asphalt Mixtures for High-Volume Traffic Roads in Severe Climates. Sustainability 2020, 12, 8765. [Google Scholar] [CrossRef]
- Huang, G.; Zhang, J.; Hui, B.; Zhang, H.; Guan, Y.; Guo, F.; Li, Y.; He, Y.; Wang, D. Analysis of Modulus Properties of High-Modulus Asphalt Mixture and Its New Evaluation Index of Rutting Resistance. Sustainability 2023, 15, 7574. [Google Scholar] [CrossRef]
- Mi, S.-Z.; Li, Y.-X.; Zhang, H.-W. Preparation and Characterization of High Modulus Agent Modified Asphalt and Its High Modulus Mixture. Adv. Mater. Sci. Eng. 2022, 2022, 2374241. [Google Scholar] [CrossRef]
- Moreno-Navarro, F.; Sol-Sánchez, M.; Tomás-Fortún, E.; Rubio-Gámez, M.C. High-Modulus Asphalt Mixtures Modified with Acrylic Fibers for Their Use in Pavements under Severe Climate Conditions. J. Cold Reg. Eng. 2016, 30, 04016003. [Google Scholar] [CrossRef]
- Ma, T.; Ding, X.; Zhang, D.; Huang, X.; Chen, J. Experimental Study of Recycled Asphalt Concrete Modified by High-Modulus Agent. Constr. Build. Mater. 2016, 128, 128–135. [Google Scholar] [CrossRef]
- Ranieri, M.; Celauro, C. Improvement of High Modulus Asphalt Mixtures with Average Quality Aggregate and Bitumen by Application of Polymeric Additives. Constr. Build. Mater. 2018, 178, 183–194. [Google Scholar] [CrossRef]
- Li, P.; Zheng, M.; Wang, F.; Che, F.; Li, H.; Ma, Q.; Wang, Y. Laboratory Performance Evaluation of High Modulus Asphalt Concrete Modified with Different Additives. Adv. Mater. Sci. Eng. 2017, 2017, e7236153. [Google Scholar] [CrossRef]
- Russo, F.; Eskandarsefat, S.; Venturini, L.; Viscione, N. A Complete Study on an Asphalt Concrete Modified with Graphene and Recycled Hard-Plastics: A Case Study. Case Stud. Constr. Mater. 2022, 17, e01437. [Google Scholar] [CrossRef]
- D’Angelo, S.; Ferrotti, G.; Cardone, F.; Canestrari, F. Asphalt Binder Modification with Plastomeric Compounds Containing Recycled Plastics and Graphene. Materials 2022, 15, 516. [Google Scholar] [CrossRef]
- Zhou, H.-Y.; Dou, H.-B.; Chen, X.-H. Rheological Properties of Graphene/Polyethylene Composite Modified Asphalt Binder. Materials 2021, 14, 3986. [Google Scholar] [CrossRef]
- Moretti, L.; Fabrizi, N.; Fiore, N.; D’Andrea, A. Mechanical Characteristics of Graphene Nanoplatelets-Modified Asphalt Mixes: A Comparison with Polymer-and Not-Modified Asphalt Mixes. Materials 2021, 14, 2434. [Google Scholar] [CrossRef]
- Perucca, M.; Capuano, L.; Magatti, G.; Rosa, F.; Mantecca, P. Environmental Performance of Road Asphalts Modified with End-of-Life Hard Plastics and Graphene: Strategies for Improving Sustainability. Processes 2022, 10, 2151. [Google Scholar] [CrossRef]
- CNR. Catalogo delle Pavimentazioni Stradali, B.U. n. 178 Parte IV—Norme Tecniche; Consiglio Nazionale delle Ricerche: Rome, Italy, 1995. (In Italian) [Google Scholar]
- Documenti Tecnici|Anas, S.p.A. Available online: https://www.stradeanas.it/it/lazienda/attivit%C3%A0/documenti-tecnici (accessed on 10 July 2023).
- UNI EN 12697-1:2006; Miscele Bituminose—Metodi di Prova per Conglomerati Bituminosi a Caldo—Parte 1: Contenuto di Legante Solubile. Ente Nazionale Italiano di Unificazione (UNI): Milan, Italy, 2006; 51p.
- UNI EN 12697-2:2019; Miscele Bituminose—Metodi di Prova—Parte 2: Determinazione della Granulometria. UNI Ente Italiano Di Normazione: Milan, Italy, 2020.
- Iwański, M.M. Effect of Hydrated Lime on Indirect Tensile Stiffness Modulus of Asphalt Concrete Produced in Half-Warm Mix Technology. Materials 2020, 13, 4731. [Google Scholar] [CrossRef] [PubMed]
- Chen, H.; Alamnie, M.M.; Barbieri, D.M.; Zhang, X.; Liu, G.; Hoff, I. Comparative Study of Indirect Tensile Test and Uniaxial Compression Test on Asphalt Mixtures: Dynamic Modulus and Stress-Strain State. Constr. Build. Mater. 2023, 366, 130187. [Google Scholar] [CrossRef]
- Seyed, A.S.; Dariush, M.; Danial, M. Effect of Stiffness Modulus and Dynamic Loading on Pavement Subgrade. J. Civ. Eng. Constr. Technol. 2014, 5, 30–34. [Google Scholar] [CrossRef]
- UNI EN 12697‐26:2018; Bituminous Mixtures—Test Methods—Part 26: Stiffness. UNI Ente Italiano Di Normazione: Milan, Italy, 2018; 49p.
- Bańkowski, W. Evaluation of Fatigue Life of Asphalt Concrete Mixtures with Reclaimed Asphalt Pavement. Appl. Sci. 2018, 8, 469. [Google Scholar] [CrossRef]
- Gul, M.A.; Irfan, M.; Ahmed, S.; Ali, Y.; Khanzada, S. Modelling and Characterising the Fatigue Behaviour of Asphaltic Concrete Mixtures. Constr. Build. Mater. 2018, 184, 723–732. [Google Scholar] [CrossRef]
- Wang, Y.D.; Keshavarzi, B.; Kim, Y.R. Fatigue Performance Prediction of Asphalt Pavements with FlexPAVETM, the S-VECD Model, and DR Failure Criterion. Transp. Res. Rec. 2018, 2672, 217–227. [Google Scholar] [CrossRef]
- UNI EN 12697-24:2018; Bituminous Mixtures—Test Methods—Part 24: Resistance to Fatigue. Ente Nazionale Italiano di Unificazione (UNI): Milan, Italy, 2018; 111p.
- Zhao, Z.; Jiang, J.; Ni, F.; Dong, Q.; Ding, J.; Ma, X. Factors Affecting the Rutting Resistance of Asphalt Pavement Based on the Field Cores Using Multi-Sequenced Repeated Loading Test. Constr. Build. Mater. 2020, 253, 118902. [Google Scholar] [CrossRef]
- Zhu, T.; Ma, T.; Huang, X.; Wang, S. Evaluating the Rutting Resistance of Asphalt Mixtures Using a Simplified Triaxial Repeated Load Test. Constr. Build. Mater. 2016, 116, 72–78. [Google Scholar] [CrossRef]
- Alkaissi, Z.A. Effect of High Temperature and Traffic Loading on Rutting Performance of Flexible Pavement. J. King Saud Univ.-Eng. Sci. 2020, 32, 1–4. [Google Scholar] [CrossRef]
- UNI EN 12697-22:2004; Miscele Bituminose—Metodi di Prova per Conglomerati Bituminosi a Caldo—Metodo Della Traccia Delle Ruote (Wheel Tracking). Ente Nazionale Italiano di Unificazione (UNI): Milan, Italy, 2004; 33p.
- Capitão, S.; Picado-Santos, L. Applications, Properties and Design of High Modulus Bituminous Mixtures. Road Mater. Pavement Des. 2006, 7, 103–117. [Google Scholar] [CrossRef]
- UNI EN 12697-33:2004; Miscele Bituminose—Metodi di Prova per Conglomerati Bituminosi a Caldo—Provino Preparato con Compattatore a Rullo. Ente Nazionale Italiano di Unificazione (UNI): Milan, Italy, 2004; 23p.
- Standard Practice for Roads and Parking Lots Pavement Condition Index Surveys; ASTM International: West Conshohocken, PA, USA, 2021.
- Loprencipe, G.; Cantisani, G.; Di Mascio, P. Global assessment method of road distresses. In Life-Cycle of Structural Systems: Design, Assessment, Maintenance and Management—Proceedings of the 4th International Symposium on Life-Cycle Civil Engineering, IALCCE, Tokyo, Japan, 16–19 November 2014; International Association for Life Cycle Civil Engineering: Delft, The Netherlands, 2015; pp. 1113–1120. ISBN 978-113800120-6. [Google Scholar] [CrossRef]
- Bruno, S.; Colonnese, S.; Scarano, G.; Del Serrone, G.; Loprencipe, G. Pavement Distress Estimation via Signal on Graph Processing. Sensors 2022, 22, 9183. [Google Scholar] [CrossRef] [PubMed]
- Bruno, S.; Vita, L.; Loprencipe, G. Development of a GIS-Based Methodology for the Management of Stone Pavements Using Low-Cost Sensors. Sensors 2022, 22, 6560. [Google Scholar] [CrossRef] [PubMed]
- Sahis, M.K.; Biswas, P.P. Optimization of Bituminous Pavement Thickness Using Mechanistic-Empirical Strain-Based Design Approach. Civ. Eng. J. 2021, 7, 804–815. [Google Scholar] [CrossRef]
- Dalla Valle, P.; Thom, N. Improvement to Method of Equivalent Thicknesses (MET) for Calculation of Critical Strains for Flexible Pavements. Int. J. Pavement Eng. 2018, 19, 1053–1060. [Google Scholar] [CrossRef]
- ELMOD. Available online: https://dynatest.com/elmod/ (accessed on 10 January 2024).
- Appea, A.K.; Al-Qadi, I.L. Assessment of Falling Weight Deflectometer Data for Stabilized Flexible Pavements. Transp. Res. Rec. 2000, 1709, 19–25. [Google Scholar] [CrossRef]
- Mahoney, J.P.; Coetzee, N.F.; Stubstad, R.N.; Lee, S.W. A Performance Comparison of Selected Backcalculation Computer Programs. Nondestruct. Test. Pavements Backcalc. Moduli 1989, 452–467. [Google Scholar]
- Guzzarlapudi, S.D.; kumar Adigopula, V.; Kumar, R. Comparative Study of Flexible Pavement Layers Moduli Backcalculation Using Approximate and Static Approach. Mater. Today Proc. 2017, 4, 9812–9816. [Google Scholar] [CrossRef]
- Chou, Y.J.; Lytton, R.L. Accuracy and Consistency of Backcalculated Pavement Layer Moduli. Transp. Res. Rec. 1991, 1293, 72–85. [Google Scholar]
- Wu, J.; Wang, H.; Liu, Q.; Gao, Y.; Liu, S. A Temperature-Independent Methodology for Polymer Bitumen Modification Evaluation Based on DSR Measurement. Polymers 2022, 14, 848. [Google Scholar] [CrossRef] [PubMed]
- Moreno-Navarro, F.; Sol-Sánchez, M.; Gámiz, F.; Rubio-Gámez, M.C. Mechanical and Thermal Properties of Graphene Modified Asphalt Binders. Constr. Build. Mater. 2018, 180, 265–274. [Google Scholar] [CrossRef]
- Judycki, J.; Jaskula, P.; Dolzycki, B.; Pszczola, M.; Jaczewski, M.; Rys, D.; Stienss, M. Investigation of Low-Temperature Cracking in Newly Constructed High-Modulus Asphalt Concrete Base Course of a Motorway Pavement. Road Mater. Pavement Des. 2015, 16, 362–388. [Google Scholar] [CrossRef]
- Rys, D.; Judycki, J.; Pszczola, M.; Jaczewski, M.; Mejlun, L. Comparison of Low-Temperature Cracks Intensity on Pavements with High Modulus Asphalt Concrete and Conventional Asphalt Concrete Bases. Constr. Build. Mater. 2017, 147, 478–487. [Google Scholar] [CrossRef]
- Pantuso, A.; Flintsch, G.W.; Katicha, S.W.; Loprencipe, G. Development of Network-Level Pavement Deterioration Curves Using the Linear Empirical Bayes Approach. Int. J. Pavement Eng. 2021, 22, 780–793. [Google Scholar] [CrossRef]
- Prezzario Regionale Delle Opere Pubbliche. Available online: https://www.regione.lombardia.it/wps/portal/istituzionale/HP/DettaglioServizio/servizi-e-informazioni/Enti-e-Operatori/Autonomie-locali/Acquisti-e-contratti-pubblici/Osservatorio-regionale-contratti-pubblici/prezzario-opere-pubbliche/prezzario-opere-pubbliche (accessed on 13 February 2024).


Disclaimer/Publisher’s Note: The statements, opinions and data contained in all publications are solely those of the individual author(s) and contributor(s) and not of MDPI and/or the editor(s). MDPI and/or the editor(s) disclaim responsibility for any injury to people or property resulting from any ideas, methods, instructions or products referred to in the content. |
© 2024 by the authors. Licensee MDPI, Basel, Switzerland. This article is an open access article distributed under the terms and conditions of the Creative Commons Attribution (CC BY) license (https://creativecommons.org/licenses/by/4.0/).