Article

Automated Geographic Information System Multi-Criteria Decision Tool to Assess Urban Road Suitability for Active Mobility

1
Department of Civil Engineering and Architecture, University of Beira Interior, 6200-358 Covilhã, Portugal
2
GeoBioSciences, GeoTechnologies and GeoEngineering (GEOBIOTEC) Research Unit, Department of Civil Engineering and Architecture, University of Beira Interior, 6200-358 Covilhã, Portugal
3
Civil Engineering Research and Innovation for Sustainability (CERIS) Research Unit, Instituto Superior Técnico, University of Lisbon, 1049-001 Lisbon, Portugal
*
Author to whom correspondence should be addressed.
Urban Sci. 2024, 8(4), 206; https://doi.org/10.3390/urbansci8040206
Submission received: 3 October 2024 / Revised: 1 November 2024 / Accepted: 3 November 2024 / Published: 7 November 2024

Abstract

:
The planning of greener, more accessible, and safer cities is the focus of several strategies that aim to improve the population’s quality of life. This concern for the environment and the population’s quality of life has led to the implementation of active mobility policies. The effectiveness of the mobility solutions that are sought heavily depends on the identification of the main factors that favor their use, as well as how adequate urban spaces are in minimizing existing difficulties. This study presents an automated geographic information system (GIS) decision support tool that allows the identification of the level of suitability of urban transportation networks for the use of active modes. The tool is based on the determination of a set of mobility indices: walkability, bikeability, e-bikeability, and active mobility (a combination of walking and cycling suitability). The indices are obtained through a spatial multi-criteria analysis that considers the geometric features of roads, population density, and the location and attractiveness of the city’s main trip-generation points. The treatment, representation, and study of the variables considered in the analysis are carried out with the aid of geoprocessing, using the spatial and network analysis tools available in the GIS. The Model Builder functionality available in ArcGIS® was used to automate the various processes required to calculate walking, cycling, and e-biking travel times, as well as the mobility indices. The developed tool was tested and validated through its application to a case study involving the road network of the urban perimeter of the medium-sized city of Covilhã, Portugal. However, the tool is designed to be applied with minimal adaptation to different scenarios and levels of known input information, providing average or typical values when specific information is not available. As a result, a flexible and automated GIS-based tool was obtained to support urban space and mobility managers in the implementation of efficient measures compatible with each city’s scenario.

1. Introduction

1.1. Framework

Several European cities (Amsterdam, Barcelona, Bremen, Copenhagen, Edinburgh, Ferrare, Graz, Strasbourg, etc.) have demonstrated the importance of promoting the use of more sustainable and environmentally friendly modes of transport, such as walking, cycling, and the use of public transport and hybrid or hydrogen vehicles. These cities have implemented policies that encourage the use of public transport, cycling, and car-sharing, as well as policies that restrict the use of private cars. These changes have promoted economic growth, accessibility to business and commercial centers, and the improvement of the quality of life of the population [1]. In this context, soft transport plays a very important role in the development of national and international transport and urban policies. Low-speed modes of transport, such as walking, cycling, skateboarding, inline skating, and other similar modes, take up little space on public roads and do not emit gases into the atmosphere. These alternatives represent more sustainable mobility, also called active mobility, as they contribute to reducing the negative impacts of transport and promote the well-being and health of citizens [2,3].
The integration of active modes into a city’s mobility system brings individual benefits for the users of the active modes and collective benefits for the local community in general. Individual benefits include reductions in the proportion of the family budget spent on cars and medical services (because of regular physical activity); the prevention and mitigation of some health conditions, such as obesity, cardiovascular disease, and osteoporosis, and the promotion of self-esteem; a reduction in sedentary lifestyles and stress; and a reduction in noise, pollution, and hours lost in traffic jams [2,4,5,6]. The collective benefits include reduced energy dependency and space requirements for the circulation and parking of vehicles; increased attractiveness and competitiveness of local communities; the democratization of mobility; better accessibility to urban services (commerce, leisure, work, school); the promotion of sociability; reductions in greenhouse gas emissions and noise pollution; the conservation of non-renewable resources; fewer road accidents involving motor vehicles; and reductions in new road infrastructure and road congestion [2,4,5,7].
In the context of European mobility policies and strategies, the European Union (EU) argues that one of the challenges to be faced in the field of transport is the growth of soft mobility, or mobility with reduced emissions, given that the current transport context causes, directly or indirectly, various environmental damages [8]. Since 2005, Europe has favored investment in sustainable urban mobility, with a focus on the 2013 package, which aims to reaffirm the Sustainable Urban Mobility Plans (SUMPs) [9]. These are described as “strategic plans designed to meet the mobility needs of people and businesses in cities and surrounding areas for a better quality of life” [10,11,12]. In 2018, the Partnership for Urban Mobility Final Action Plan established four working groups [13]: governance and planning, public transport, active mobility and public space, and new mobility services and innovation. This plan includes a set of EU partnerships to achieve the objectives of the European agenda in the field of soft mobility. In the active mobility and public space realm, the lack of European guidelines regarding infrastructure that catalyzes active travel (walking and cycling) is mentioned. The plan also warns of the lack of ideal conditions for walking and cycling, namely, the existence of “incomplete networks, unnecessary detours, inadequate surfaces, non-existent or poor signage, insufficient pedestrian crossings or their inconvenience, and waiting times at traffic lights”. Still, in the European context, the concept of the ‘15-minute city’, which can be defined as a city that meets the needs of its inhabitants within a 15 min walking or cycling radius [14], stands out. This concept gained prominence during the re-election campaign of Anne Hidalgo as Mayor of Paris. One of the campaign measures was to enable residents to meet their daily needs by walking or cycling [15].
Regarding the Portuguese context, a set of “National Guidelines for Mobility” was established in 2012 [16]. These guidelines define the National Mobility Strategy and indicate the instruments and plans for its implementation, reflecting on eleven points, of which the following stand out: to define and guarantee an adequate level of accessibility offered by the transport system to all citizens; to establish an efficient configuration of the accessibility system; to improve the quality of life of citizens by reducing the negative impacts of mobility (social, environmental, and economic); and to create good conditions for non-motorized modes of transport, in particular for pedestrians. With the emergence of the Strategic Urban Development Plans in 2019, an increase in investment in the promotion of soft modes, in particular cycling [17,18,19,20], has been noticeable. By 2030, Portugal aims to have a cycle network of approximately 7660 km [20]. At the municipal level, Sustainable Urban Mobility Plans (PMUSs) aim to change the patterns of transport planning through cooperation between public administration and the private sector. However, its preparation is not mandatory, and Portugal is the only country in southern Europe without legislation in this field [21].

1.2. Objective and Structure of the Article

The objective of this work is to define an approach to obtain an active mobility index that reflects the suitability of existing road network infrastructures for pedestrian and bicycle mobility (conventional and electric bicycles) in commuting trips. Another objective is the application of this index in a GIS environment, including the automation of the process using ArcGIS Model Builder. The process of automating the different stages using the object programming functionality available in GIS programs has significant advantages in terms of the time spent on analyses and the flexibility and replicability of the models developed. The authors’ literature review revealed that there is no approach that combines pedestrian and cycling suitability indices and that automates the process using Model Builder. This makes the approach presented innovative and useful for network managers, as it allows for isolated and/or aggregated assessments considering more than one mode of transport.
This article is organized into four sections. Section 1 presents the importance of promoting active modes of transportation, the main EU and Portuguese strategies for sustainable urban mobility, and the aim of the work. The main approaches and variables used in the determination of walkability and bikeability indices and the use of the ArcGIS Model Builder functionality in the field of transportation are also presented. Section 2 presents the variables used and the methodological steps considered in the process of obtaining the proposed active mobility index for each segment of a road network. The approach is then applied to a case study in Section 3 (road network of the urban perimeter of the municipality of Covilhã), and Section 4 presents the main results obtained and discusses future work.

1.3. Walkability and Bikeability: Approaches and Variables

Due to its growing importance and relevance, active mobility is a topic that is frequently discussed in academia. In the context of pedestrian mobility, recent studies by Glazier et al. [22], Reyer et al. [23], Koschinsky et al. [24], and Nogueira et al. [25] are examples of methodologies that attempt to evaluate the suitability of infrastructures for this type of mobility. For cycling mobility, recent studies include those developed by Arellana et al. [26], Tran et al. [27], Schmid-Querg et al. [28], and Santos et al. [29].
As far as the use of GISs is concerned, this technology can provide valuable information to support decision making in the context of active mobility. It can also objectively support and improve the measures that may be implemented. Spatial multi-criteria analysis, implemented in GISs, allows the development of decision-making tools, in which the influence of each variable can be quantified. Furthermore, the result can be shaped and adapted according to the characteristics and objectives of the organizations involved in the mobility management. This approach allows the integration of spatial data and the knowledge and vision of those involved in managing and promoting mobility [30]. This has been used to calculate pedestrian and cycling road network suitability [22,23,25,29,31,32], which is translated by the global indices of walkability and bikeability. In general, data collection, spatial and network analysis, spatial multicriteria analysis, the standardization of values, and calibration are the stages in the process of calculating walkability and bikeability indices. An overview and key characteristics of studies addressing walkability and bikeability using GISs are presented in Table 1 and Table 2.
Table 1 shows that the main scientific fields in which studies on walkability indices are published are public health and transportation, with both areas focused on urban space characteristics. In the field of public health, several studies have reported positive associations between level of walkability and walking. Most of these studies attempt to measure the degree of walkability of urban spaces based on the transportation and urban planning literature, in order to relate it to aspects of public health, such as obesity, diabetes, cardiometabolic diseases, or mental health. On the other hand, promoting non-motorized transport has recently become a common feature among urban planners seeking to achieve sustainable transport. In this sense, studies in the field of transportation show efforts to develop walkability indices that show the status of walkability for specific urban zones. The first studies were mainly conducted in the USA and Australia, with more recent ones in Europe and other countries. In view of the purpose of this study, all analyzed studies used GISs to record, organize, combine, analyze, and visualize walkability variables and results.
Out of the 14 studies included in the review, 6 reported the use of the additive method to combine variables [22,33,34,35,36,37], 4 applied linear regression [38,39,40,41], 3 applied multicriteria spatial analysis with one of the previous methods [23,25,31], and 1 applied principal component analysis [42]. The normalized distribution of variables (z-score) [36,38,40,41] and the reclassification of variables into deciles [33,34,35] were the most used methods to obtain the variable weights to be considered. The spatial units adopted to determine walkability vary between area units, usually defined according to administrative divisions [23,33,34,35], and they include census tracks [22,35,36,42] and road or sidewalk segments [25,37,39], essentially depending on the availability of data.
According to the review, the studies on bikeability are more recent and fewer in number than those on walkability, and they tend to be published in the scientific field of transportation. Out of the 11 studies reviewed, 4 took place in the US and South America, 4 in Europe, and 3 in Asia. Most studies aim to assess the existing conditions for cycling, considering local characteristics, perceptions of the cycling environment, and the use of bicycles. The aim is to obtain a measure that can be presented in the form of a map of the most and least cycling-friendly areas.
Given the scope of the work presented, all the selected studies used spatial analysis within GISs, with the spatial units being the city [43], a specific grid size [32,44,45] or, in most cases, the street segment [26,27,28,29,46,47,48]. Regarding the methods used to combine the variables considered to determine the bikeability index, most of the studies used additive models applied in a GIS environment. Out of the 11 studies, 2 used the weighted regression method [44,46], 8 used the weighted linear/additive method [26,27,28,29,43,45,47,48], and 10 used spatial analysis.
Given the similarity of the variables usually considered when analyzing walkability and bikeability indices, they are analyzed together here. Walkability and bikeability variables can be categorized from a geometric, spatial, or land-use planning point of view. The first category refers to the presence of a dedicated infrastructure and to the characteristics of the road, such as the street connectivity and the width of the roadway, bicycle lane, or sidewalk. It aims to understand the feasibility of building, including, or sharing cycle traffic, as well as the suitability for pedestrians. To a greater or lesser extent, all studies included this type of variable. Spatially, digital terrain models (DTMs), and thus topography or slope [25,27,29,32,41,44,45,47,48], and population or residential density, are also very relevant categories that have been considered in most studies [22,23,25,29,31,32,33,34,35,36,37,38,40,41,42]. The former are essentially considered in bikeability studies and the latter in walkability studies. From a planning and land-use perspective, most of the aspects to be considered are available and do not require field data collection, such as the location of facilities considered as major trip-generation points. All walkability studies included a variable related to land use and most bikeability studies included this as well. When assessing walking and cycling potential, it is important to identify the main trip-generation points, such as shopping areas, educational facilities (schools, universities), health facilities (health centers, hospitals) and transport interfaces (bus stops and stations, railway stations), as well as their main connections. It is also important to identify urban areas of mixed use (historic centers, shopping streets) and other leisure centers. Most studies also considered the local perspective through census or other official data and the analysis of surveys issued to local citizens.
Table 1. Literature review on walkability index.
Citation
Year
Study Category
MethodSpatial UnitVariables Used in the AnalysisCase Study
[38]
2005
Public Health
Multiple linear regression.
Weight considered through variables with normalized distribution (z-score).
Local perspective considered through characteristics of 357 citizens.
1 km grid.Road intersection, density, residential density, land-use mix.Atlanta,
United States of America
[33]
2007
Public Health
Additive method.
Each variable reclassified into deciles to provide a standard score from 1 to 10.
Local perspective considered through a survey issued to 2650 citizens.
Districts (each with approximately 250 households).Residential density, road network connectivity, land use, net retail area.Adelaide,
Australia
[31]
2011
Public Health
Multicriteria spatial analysis including the evaluation of spatial autocorrelation of data using GISs.
Local perspective considered through a survey issued to 733 citizens.
Street network buffers of 50 m around street center lines that extend along the network 400, 800 and 1600 m from geocoded home addresses.Facilities density, median pedestrian route directness, density of parks, intersection density, number of cul de sacs, average speed limit, highway density, residential density, population density.Four metropolitan cities,
United States of America
[42]
2012
Public Health
Principal component analysis.
Factor analysis used to identify index candidate variables and weights.
Local perspective considered through survey data from Census of Canada, Transportation Tomorrow Survey, and the Canadian Community Health Survey.
Census tracks.Population density, residential density, availability of walkable destinations (sum of retail stores, services, public recreation centers and schools), road network connectivity.Toronto,
Canada
[34]
2013
Public Health
Additive method (based on [49]).
Variables’ values reclassified into deciles with a scale from 1 to 10.
Walkability measure obtained with available official data.
Two Australian administrative spatial units: Collection District (CD) and State-Derived Suburb (SSC).
Three road buffer walkable built environments: 500 m (5–7 min walk), 1000 m (10–12 min walk), and 1600 m (15–18 min walk).
Intersection density, dwelling density, land use, net retail area.Adelaide,
Australia
[39]
2014
Transportation
Sum of 12 weighted regression sub-models.
Note: no statistically significant regression model was yielded for sub-model 7; thus, it was not considered.
Sub-models weighted in proportion to the walker perception survey results.
Sub-models:
For sense of safety: 1. Pedestrian crossing affected by traffic speed; 2. Pedestrian crossing affected by facilities; 3. Walking on the sidewalk affected by nearby traffic. For sense of security (from crime): 4. Existence of others; 5. Affected by visibility at night; 6. Visual surveillance from nearby buildings.
For comfort: 7. Sidewalk level of service and continuity; 8. Buffering negative environmental effects; 9. Sense of street scale and enclosure. For convenience: 10. Ease of pedestrian crossing; 11. Easy access to local stores. Visual interest: 12. Visual variety; 13. Visual attractiveness.
Road segment or route (combination of segments).Age, pedestrian crossing coverage rate, average number of through-traffic lanes, commercial use of adjacent buildings, average ground-level luminosity, existence of on-street parking, average width of buffer zone, percentage of walking-conducive commercial areas, average building width, residential use of adjacent buildings, gender, average number of upper-level windows/500 ft, average building height, existence of sidewalk, street enclosure index II (3.3), average pedestrian-level façade transparency, type of on-street parking, percentage of first-floor residential uses, fence coverage rate, percentage of sidewalk faced with building façades, type of sidewalk pavement, average number of street trees/500 ft.California,
United States of America
(in a station area)
[23]
2014
Public Health
Multicriteria analysis with additive method.
Aggregation of the standardized variables with double weighting for the connectivity index.
Local perspective considered through the geo-referenced household survey data collected by Verband Region Sttuttgard (regional authority).
Sub-districts (each with approximately 500 households).Connectivity index or intersection index, Shannon’s entropy index (level of mixed land use), floor area ratio (intensity of shopping opportunities), household density index.Stuttgart,
Germany
[22]
2014
Public Health
Additive method.
Variables equally weighted.
Local perspective considered through survey data collected by Canada census, Statistics Canada, DMTI Spatial Inc. Enhanced Points of Interest, City of Toronto, and the Ministry of Education.
800 m geographic buffers around dissemination blocks’ residentially weighted centroids.
Dissemination block is the smallest geographic unit for which census population and dwelling data are available.
Population density, residential density, availability of walkable destinations (sum of all retail, service, and recreation centers, and school destinations), street connectivity.Toronto,
Canada
[35]
2016
Public Health
Additive method (based on [49]).
Variables’ values reclassified into deciles with a scale from 1 to 10.
Three walkability models were developed for each spatial unit, differing in the land uses included in the analysis.
Walkability measure obtained from Census and Whitehall II Study sample data (sample size of 10,308).
Three spatial units of contiguous administrative areas: 21,140 output areas, 633 census area statistics, and 33 local authorities.Residential dwelling density, street connectivity, land-use mix.London,
United Kingdom
[40]
2018
Transportation
Linear regression analysis.
Weight considered through variables normalized distribution (z-score).
Individual models by trip purpose: job, educational, shopping, and all trips.
Information about the Rasht Household Travel Survey—RHTS—was used. Local perspective considered through a survey that was randomly distributed among more than 5000 households.
112 Traffic Analysis Zones—TAZs (defined
by the Rasht Household Travel Survey—RHTS).
21 street design variables, 4 diversity indices (entropy, Herfindal–Hershman index, mixed-use index, job–population balance), population density, destination accessibility indices (aerial distance to Central Business District (CBD) and network distance to CBD).
Criteria studied for the trip share: job, educational, shopping, and all trips.
Rasht,
Iran
[36]
2018
Public Health
Additive method.
Weight considered through the normalized distribution of variables (z-score).
Local information obtained from census data.
Census tracts (neighborhoods).Residential density, street connectivity, destination-based entropy index.Porto,
Portugal
[37]
2019
Public Health
Additive method.
Variables’ weights defined based on the results of surveys conducted with 66 experts. The sum of the weights equals 1.
Official open access data provided by Madrid City Council (National Institute of
Statistics, Municipal Cartography, National Land Registry, General Directorate of Sustainability and Environmental Control and Municipal Register)
Sections of the sidewalk.Population density, diversity of business activities, connectivity, noise, sun/shade.Madrid,
Spain
[25]
2021
Transportation
Spatial multicriteria analysis with
weighted linear method.
Variables’ weights defined based on the opinion of 15 urban mobility experts and local authorities.
Sub-variables’ weights defined by the stated preferences of 275 citizens (survey).
Road segment.Population density, location, and attractiveness (service areas) of the main trip-generation points, road hierarchy, slope, and cross-section geometry.Covilhã,
Portugal
[41]
2023
Transportation
Multiple linear regression.
(based on [38])
Weight considered through the normalized distribution of variables (z-score). Double weighting for the intersection density variable.
Walkability measure obtained with available official data.
100 m grid.Geometrical characteristics of sidewalks (length and slope), intersection density, Shannon’s entropy index (level of mixed land use), floor area ratio index (FAR—ratio of commercial building area to total commercial land use area) and household density.Seoul,
Republic of Korea
Table 2. Literature review on bikeability index.
Citation
Year
Study Category
MethodSpatial UnitVariables Used in the AnalysisCase Study
[46]
1998
Transportation
Weighted regression.Road segment.Presence of a bicycle lane or paved shoulder, bicycle lane or paved shoulder width, curb lane width, curb lane volume, other lane(s) volume, 85th percentile speed of traffic, presence of a parking lane, type of roadside development (residential or other type), combined adjustment factor for truck volumes, parking turnover, right-turn volumes.Olympia, Austin, and Chapel Hill,
United States of America
[44]
2013
Transportation
Weighted regression.
Variables’ weights defined using a multilevel logistic regression.
Variables’ information obtained from surveys, focus groups, and expert knowledge of local users (914 participants).
50 m grid.Infrastructure factor, topographical factor, security factor, environmental factor.Cali,
Colombia
[45]
2015
Transportation
Additive method.
Variables’ values reclassified into deciles with a scale from 1 to 10. Variables’ information from 278 bike trips was used in the study.
100 m grid.Cycling infrastructure, presence of separated bicycle pathways, main roads without any parallel bicycle infrastructure, green and aquatic areas, topography, land use.Graz,
Austria
[32]
2017
Transportation
Spatial analysis.
Factor analysis used to perform the variables’ weight distribution.
Local perspective considered through a survey issued to 231 citizens.
10 m grid.Residencial density, mixed land use, topography, safety, types of infrastructure.Curitiba,
Brazil
[43]
2020
Urban Planning
Additive method.
Based on Copenhagenize Index.
Variables’ values rated with a scale from 1 to 4.
Local perspective considered through a survey issued to 406 city center citizens.
City.Advocacy, bicycle culture, bicycle facilities, bicycle infrastructure, bike-sharing programs, gender split, modal share for bicycles, modal share increase since 2006, safety perception, politics, social acceptance, urban planning, traffic calming, bonus points (awarded for particularly impressive efforts/results towards re-establishing the bicycle as a feasible, acceptable, and practical form of transport).Shanghai,
China
[26]
2020
Transportation
Weighted additive function.
Discrete choice model used to estimate variable weights based on users’ perception results from ranking surveys issued to 336 bicycle users.
Road segment.Directness and coherence, comfort and attractiveness, traffic safety, security, climate, presence of bicycle infrastructure, cost of the trip.Barranquilla,
Colombia
[27]
2020
Transportation
Additive method with spatial analysis.
Four sub-indices are considered: accessibility, suitability, perceptibility, prevailing air quality in the vicinity of cycling routes.
Variables’ weights: air quality evaluated by varying weight from 0% to 12.5% to 25%, and all other three sub-indices with the same weights of 33.3%, 29.2%, and 25%.
Road segment.For accessibility—points of interest (POI): leisure, transport, commercial, daily routine.
For suitability: slope, sinuosity, bike route.
For perceptibility: greenery, crowdedness, outdoor enclosure.
For air quality: PM2.5 (particulate matter), BC (black carbon).
Singapore
[28]
2021
Transportation
Weighted overlay of linear criteria in GIS.
Weights of 50% for bicycle infrastructure, 25% for speed limit, and 25% for bicycle parking (variables rated with a scale from 1 to 10).
Variables’ weights defined based on interviews conducted with active local cyclists.
Road segment and intersection.Existence and type of bike path, speed limit, parking facilities for bicycles, quality of intersection infrastructure for bicycles.Munich,
Germany
[29]
2022
Transportation
Spatial multicriteria analysis with weighted linear method.
Variables’ weights defined based on the opinion of eight urban mobility experts and local authorities.
Sub-criterion’s weight defined from the citizens’ stated preferences survey issued to 92 participants.
Road segment.Population density, service areas of trip-generation points, road hierarchy, slope and cross-section geometry, type of bicycle (conventional and electric).Covilhã,
Portugal
[47]
2023
Transportation
Additive method.
Combination of 13 variables that translate four subindices: safety, comfort, accessibility, and vitality. Variables’ weight defined using principal component analysis (PCA).
Use of spatio-temporal open-source big data from Digital China Innovation Contest 2021, Geospatial Data Cloud, China Unicom, Baidu Map, Ecology and Environment Agency, European Centre for Medium-Range Weather Forecasts, and Copernicus.
Road segment.Safety variables: wind speed, road slope, precipitation.
Comfort variables: temperature, sky view index, green view index, trajectory sinuosity, air pollution.
Accessibility variables: average speed of trajectory, public transportation accessibility, commercial accessibility.
Vitality variables: number of trajectories, crowdedness.
Xiamen,
China
[48]
2024
Transportation
Additive method.
Indicator selection and model parametrization performed by iterative refinement and adjustment based on the scientific literature, knowledge of local experts in planning, and user feedback.
Variables’ value within 0–1 with weighted average computed across all indicators.
For steep gravel segments, an increased weight for slope and surface was considered.
Use of open and globally available data sets.
Road segment.Road category, bicycle infrastructure, maximum speed, gradient, type of pavement, designated bicycle route.Salzburg,
Austria
Wuppertal,
Germany
In all cases, assessment through these indices is used by decision-makers to evaluate, prioritize, and plan not only the effective implementation of walking and cycling policies, but also projects that aim to improve accessibility and the uptake of active transport.

1.4. Process Automation with ArcGIS Model Builder
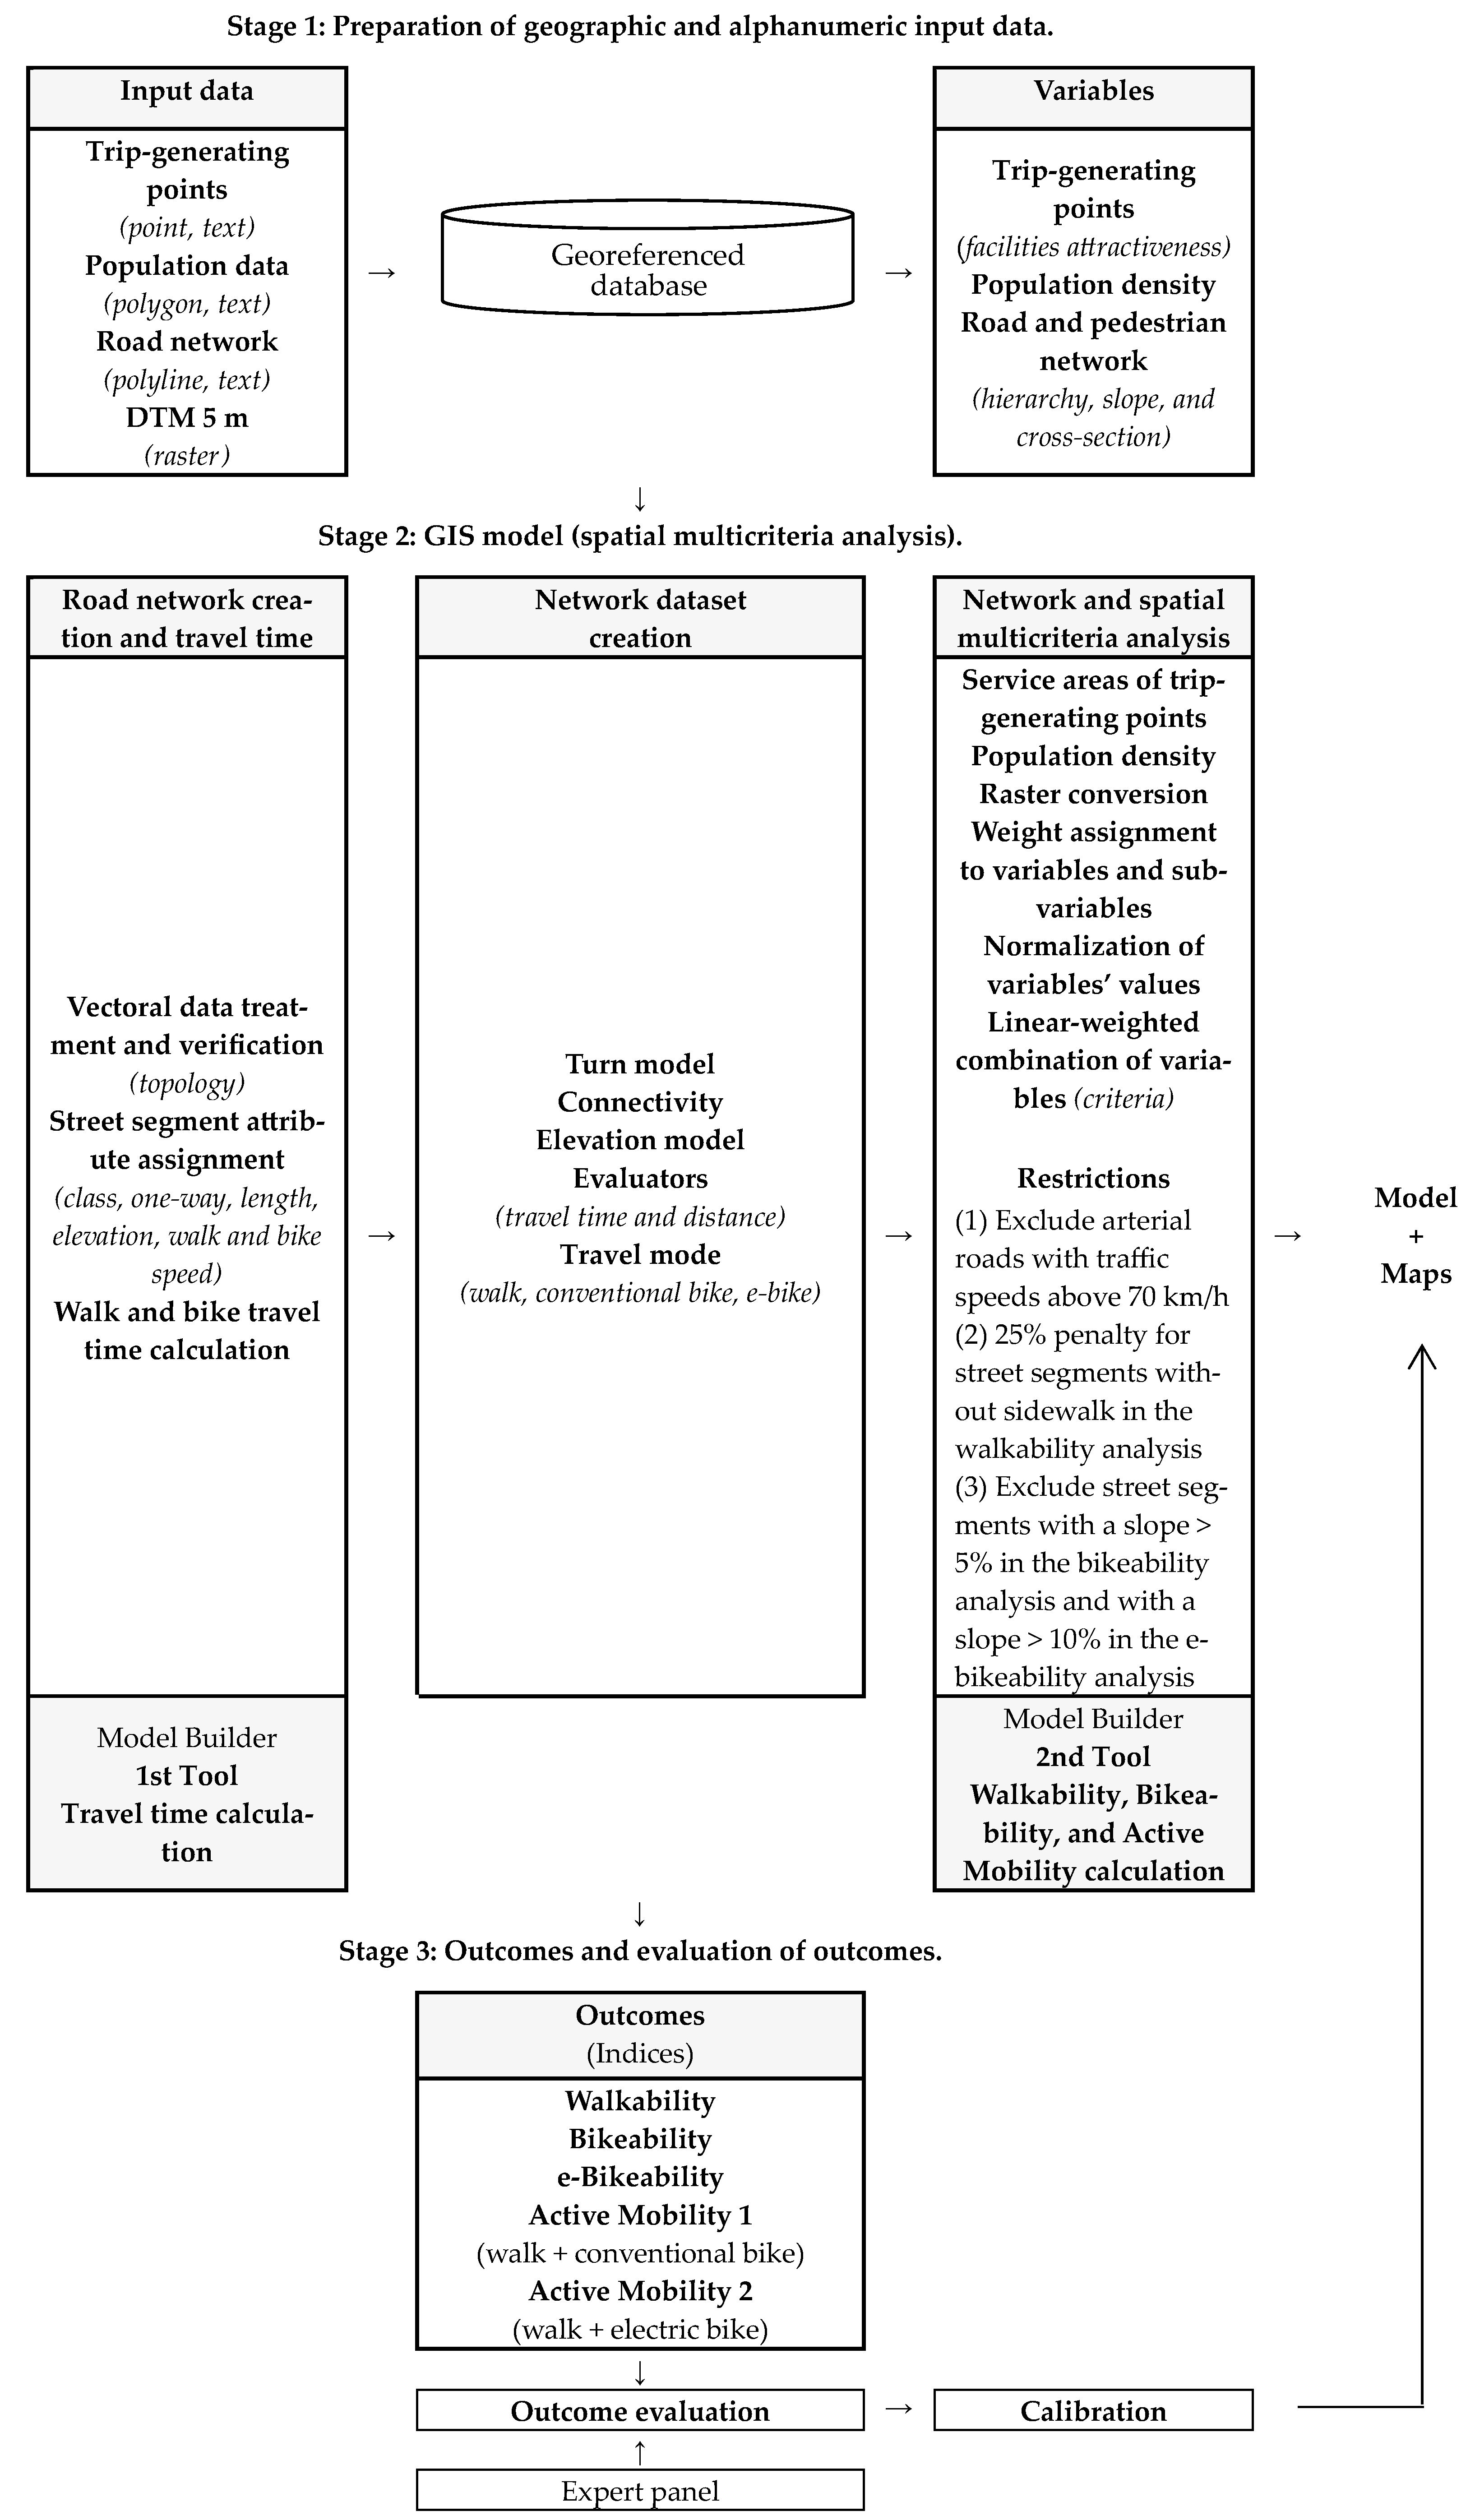
GIS technology allows processes to be automated using the drag and drop functionality, such as via the Model Builder tool available in the ArcGIS software or the Graphical Modeler in Quantum GIS (QGIS) software. These types of models are produced by a sequence of geoprocessing tools, in which the result (output) of one tool can be used as the input for another tool, thus following a sequence of processes [50]. There are few examples of process automation in the transport sector using Model Builder. It is mainly used to speed up intermediate processes in order to accelerate the achievement of results. Therefore, it is more useful when calculations need to be reproduced repeatedly. However, the development of models does not require the creation of specific tools and can only be used as a means to obtain results for a given study [51,52,53]. As the present study aims to use the ArcGIS Network Analyst functionality and to develop a tool based on Model Builder, Table 3 presents an analysis of studies from this perspective.
The performed review revealed that Model Builder is mainly used in the field of transportation for the acceleration and structuring of certain procedures that are part of a larger process [37,54,55,56,59,60]. However, in the studies analyzed, structuring a complete model using Model Builder in order to achieve a certain result is also common, although it does not presuppose the applicability of the tool to other realities [51,53,57]. Applications of Model Builder range from determining accessibility [55,56,57,58] to locating equipment [53] and calculating cost maps [54,60] or walkability [37], among others. Although European case studies dominate, all continents are represented in the analyzed studies.
The fact that the studies are concentrated in recent years shows that the use of Model Builder in transportation is beginning to be seen as an asset that can be exploited. However, the Network Analyst extension is not always used or replicated with this functionality. The literature review showed that the topic of active mobility is still underexplored in terms of the use of the Model Builder functionality or similar tools. Despite this, important themes regarding the study of walkability and bikeability have been addressed [37,57].

2. Method

The methodology developed is intended to be the basis of a decision support tool that municipalities can use to better understand the mobility characteristics of their territory and to make sustainable decisions on where to implement active mobility measures and allocate human and financial resources. The methodology is based on Spatial Multi-Criteria Analysis, a decision support technique that allows the comparison of different scenarios using multiple spatial criteria. Spatial multi-criteria analysis is technologically easy to apply and can be automated in a GIS environment.
Based on the literature review, population density, attractiveness of trip-generation points, and road/pedestrian network characteristics (hierarchy, gradient and cross-section) were selected as variables and aggregated in the multi-criteria analysis to obtain active mobility indices using the weighted linear combination method. In addition to the analysis of the literature, the choice of variables also considered the availability of official and free input data. The result of the data aggregation was a set of indices that can be used to assess the suitability of a road network for walking and cycling: walkability, bikeability, e-bikeability (based on electric bicycles), and two combined walking and cycling indices, one called Active Mobility 1, which considers walking and conventional cycling, and the other called Active Mobility 2, for walking and e-cycling. The universality of the variables, as well as the flexibility in defining their weights for specific local conditions using survey information, allows the proposed approach to be applied to cities with different characteristics, including those outside Portugal.
The process of obtaining the active mobility indices involves several stages of verification and construction. The flowchart in Figure 1 shows the developed process, which is divided into three main stages: preparation of the input data (Stage 1), application of the GIS tools to implement the model (Stage 2), and analysis of the results (Stage 3). The objective (outputs) is to classify road network segments according to their suitability for active modes of transport (walking and cycling) on a 0–100 scale. Summarized descriptions of the main activities considered at each stage of the process are presented in Section 2.1, Section 2.2, Section 2.3 and Section 2.4.

2.1. Stage 1: Preparation of Geographic and Alphanumeric Input Data

The first stage consists of collecting and processing vector and raster geographical information: road network, urban perimeter (study area), administrative division of the territory into statistical subsections (census tracks), location of trip-generation points and digital terrain model (DTM). To ensure connectivity between sections and a rigorous representation of the existing network, road network information in vector format requires careful handling. The absence of certain types of road segments (footpaths, tracks, stairs, pedestrian lifts, etc.) and the identification of different elevation levels (e.g., viaducts, footbridges) are examples of common situations that need to be checked and dealt with.
The use of data available online (freeware) makes the method affordable and, in most cases, there is no need to collect additional data in the field. As far as alphanumeric data are concerned, this form of data is mostly freely available on official websites, such as those providing national or regional statistics. Raster data (DTM) can be collected online or provided by municipal organizations. Vector information (road network and location of facilities) can be imported from various online databases, such as Geofabrik or Open Street Map.

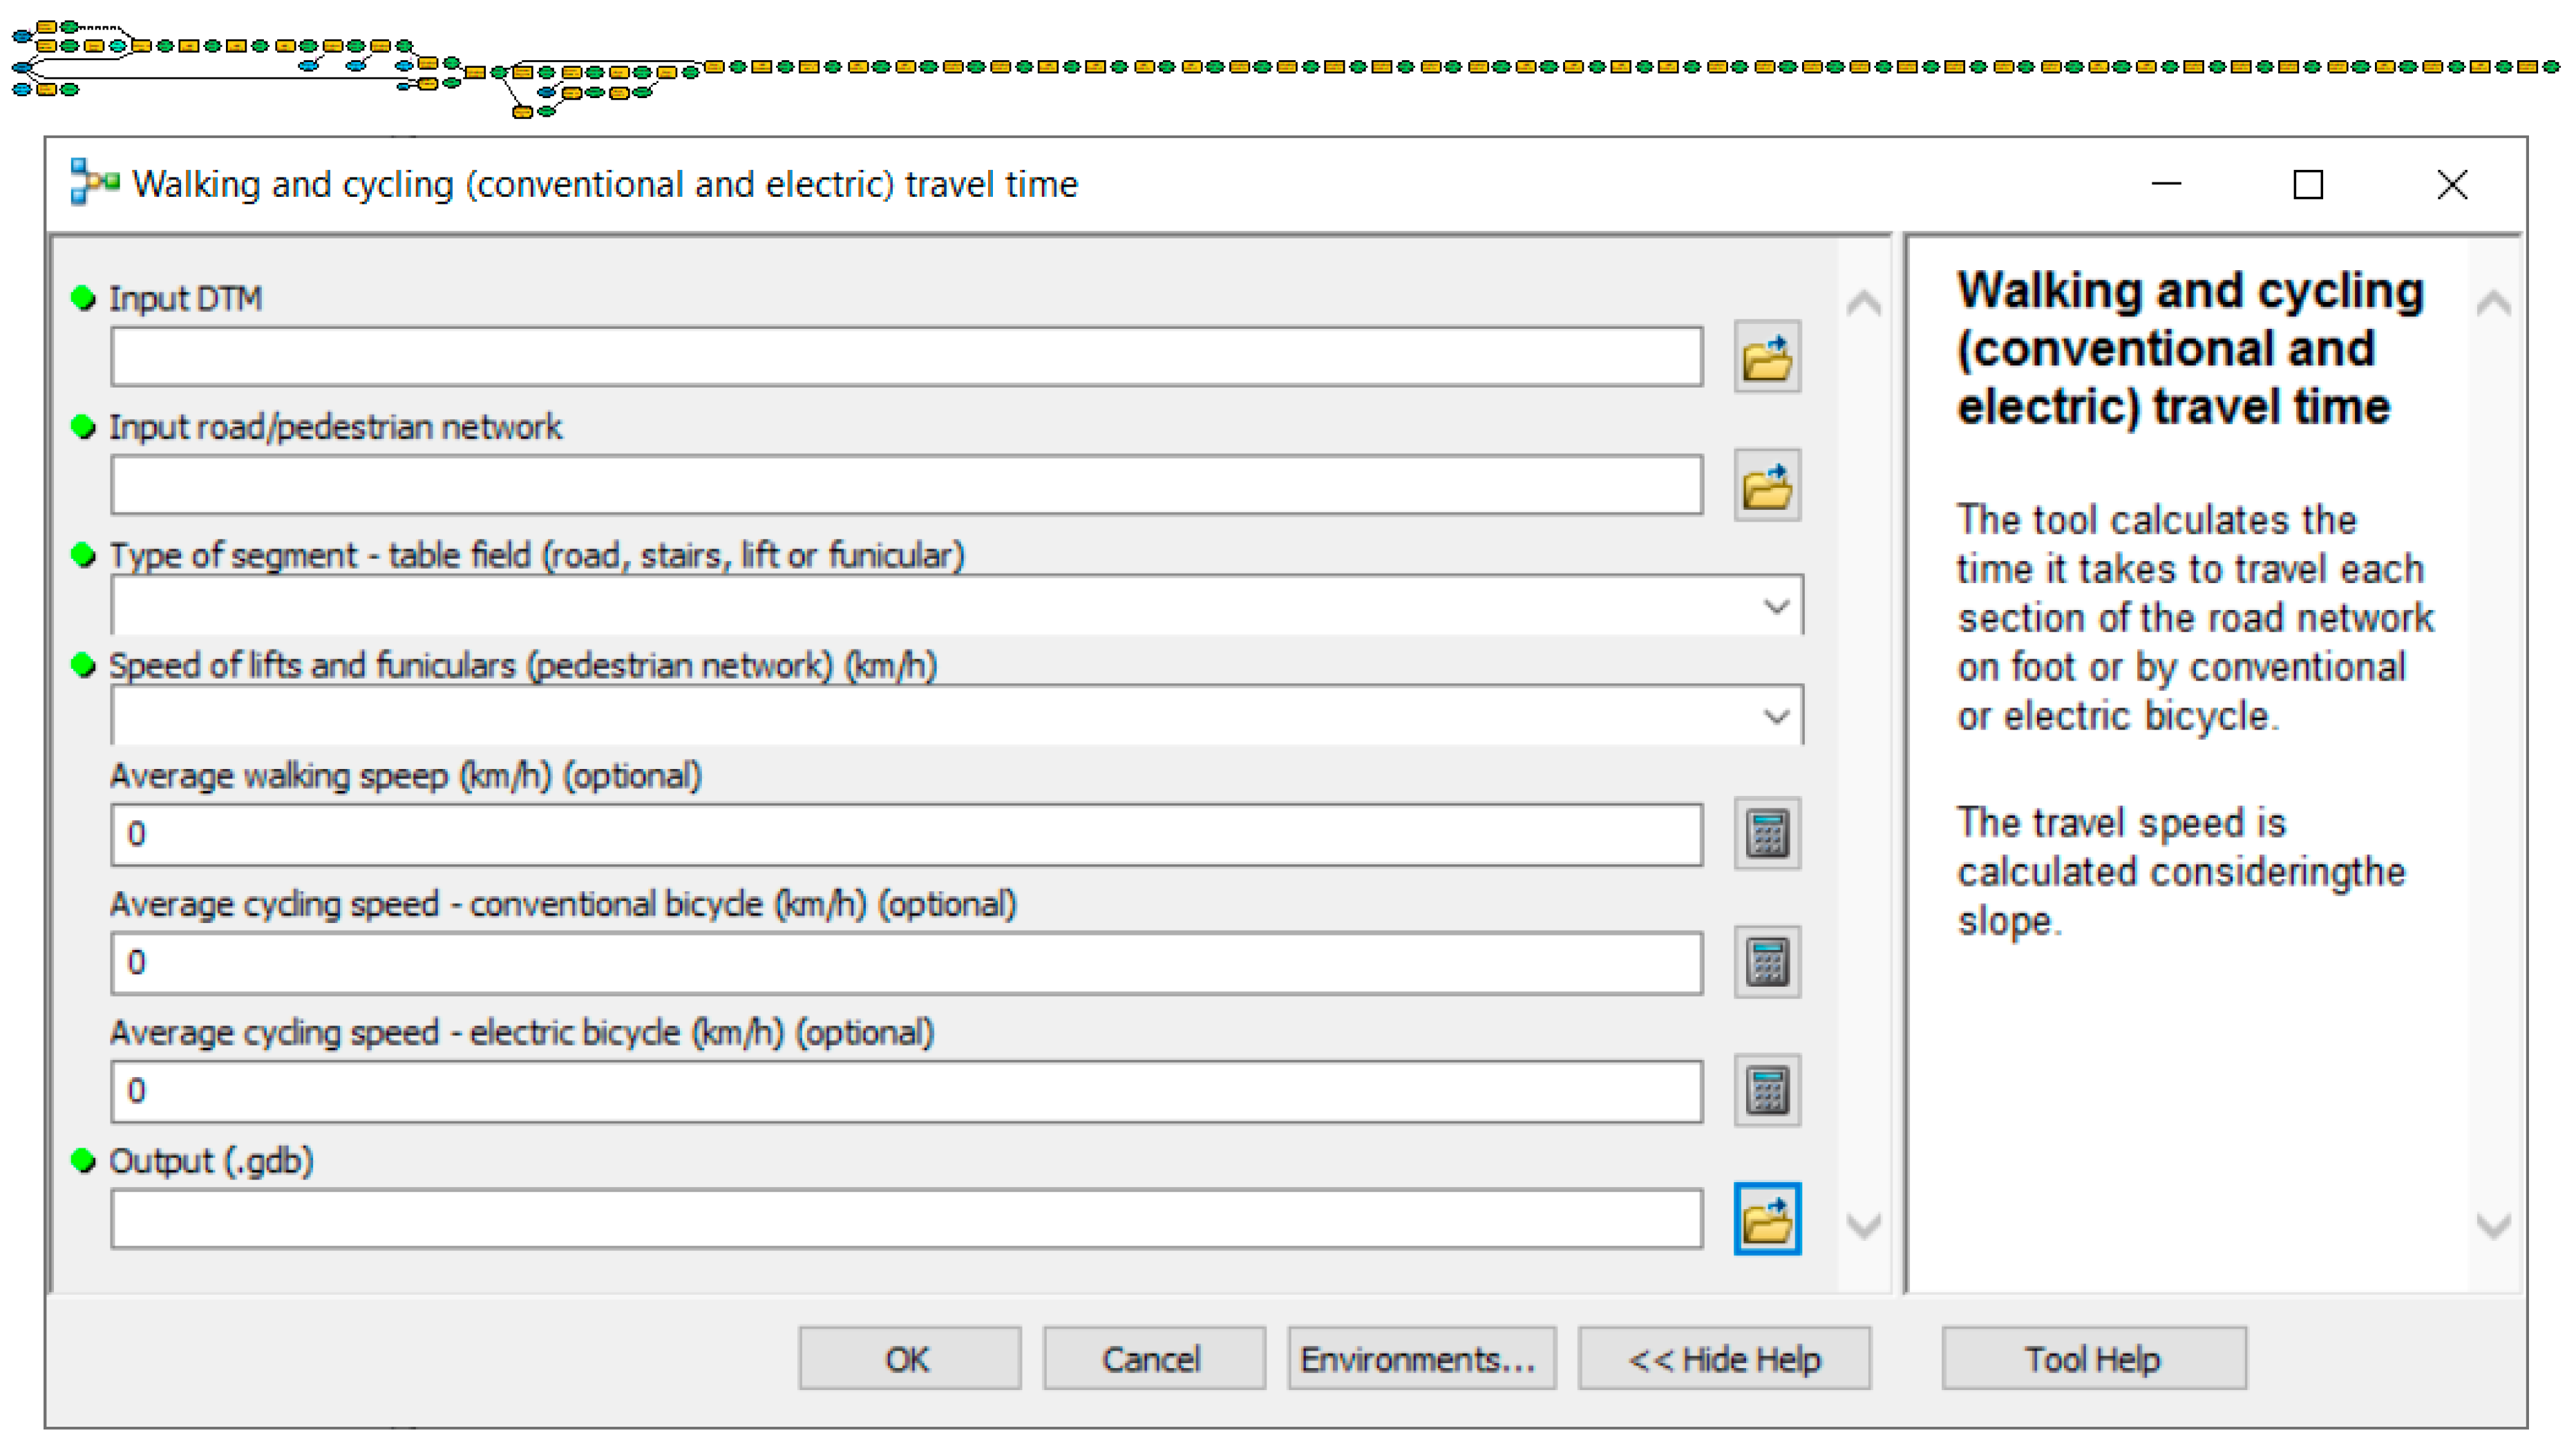
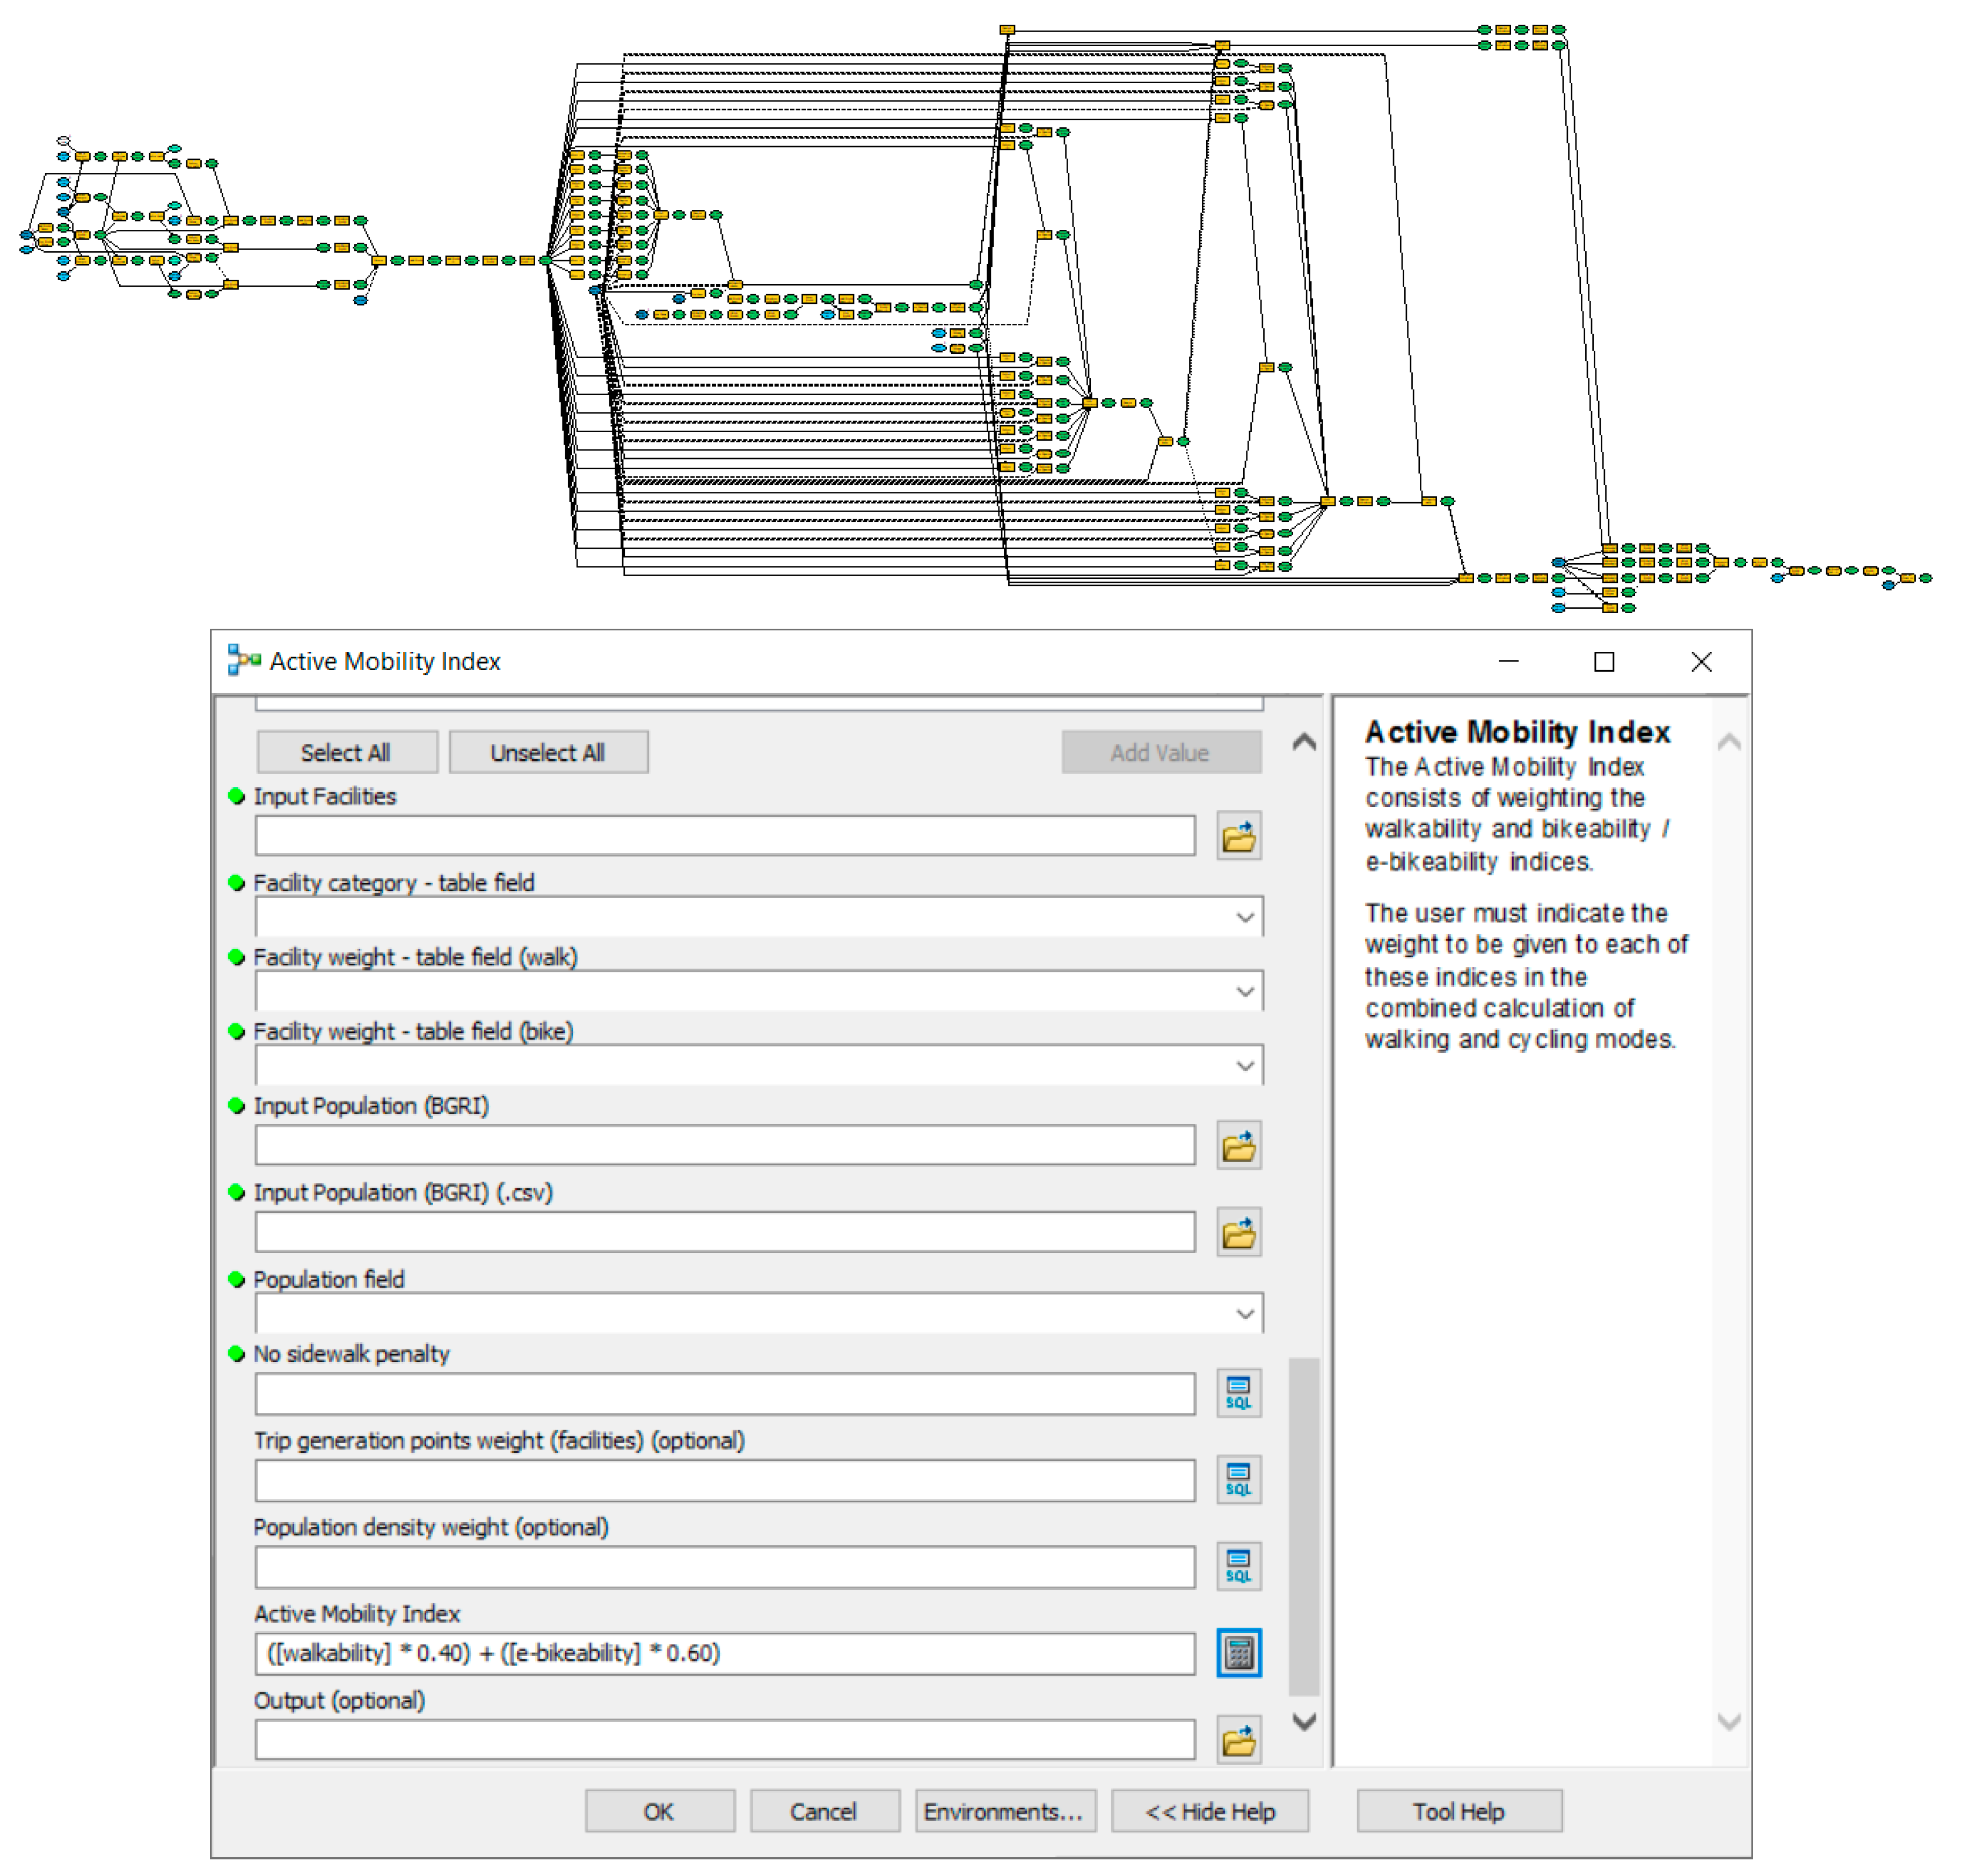
2.2. Stage 2: GIS Model (Spatial Multicriteria Analysis)

The methodology proposed is based on spatial, network, and multicriteria analysis. The first two types of analysis allow the calculation and presentation of the service areas of trip generators in terms of acceptable walking and cycling times, as well as the population density of the study area. Pedestrian travel time is determined using the expression developed by Tobler [61] for walking speed ( V w ) (see Expressions (1) to (3)). In the case of stairs, the speeds given by Fruin and Strakosch [62] are used, i.e., 1.8 km/h when descending and 1.6 km/h when ascending. The speeds of lifts and funiculars for pedestrians can be measured on site. Finally, the conventional and electric cycling time is determined using speed expressions ( V b c and V b e ) that were developed in this study through trendline analysis applied to the data collected by Flügel et al. [63] (see Expressions (4) and (5)).
T m = L V m × 60
V w = 6 × e 3.5 × d h d x + 0.05
d h d x = S = tan θ
V b c = 25,657 S 4 + 7990.5 S 3 198.27 S 2 102.56 S + 17.513
V b e = 84,821 S 4 + 4819.7 S 3 + 341.54 S 2 69.808 S + 18.269
Note: Expressions (4) and (5) are valid for −0.09 < slope < 0.09. For −0.09 > slope > 0.09, speeds corresponding to −0.09 and 0.09 must be used.
  • where
  • Tm is the travel time of the mode m in minutes;
  • m is equal to w for walking, bc for conventional cycling, and be for electric cycling;
  • Vm is the speed of mode m in km/h;
  • L is the street segment length in km;
  • dh is the elevation difference between the start and the end point of the street segment in meters;
  • dx is the street segment length in meters;
  • S is the street segment slope (decimal value);
  • θ is the angle of the slope.
In the multi-criteria analysis, weights are assigned to each of the considered facilities’ categories (commerce, education, leisure, health, public services, transport, and tourism) to represent their attractiveness. Weights are also assigned to the variables in the analysis. The maximum travel time and weights are defined based not only on the results of surveys conducted with the local working population, but also on a panel of experts. For the three modes of transport, journeys with a maximum duration of 20 min were considered. Thus, the approach is tailored towards the needs of the study area and, consequently, its inhabitants. At this stage, map raster conversion is performed for the three variables, the pixel values are normalized (on a scale of 0 to 100) and the variables are combined using the weighted linear method, resulting in the following four active mobility indices:
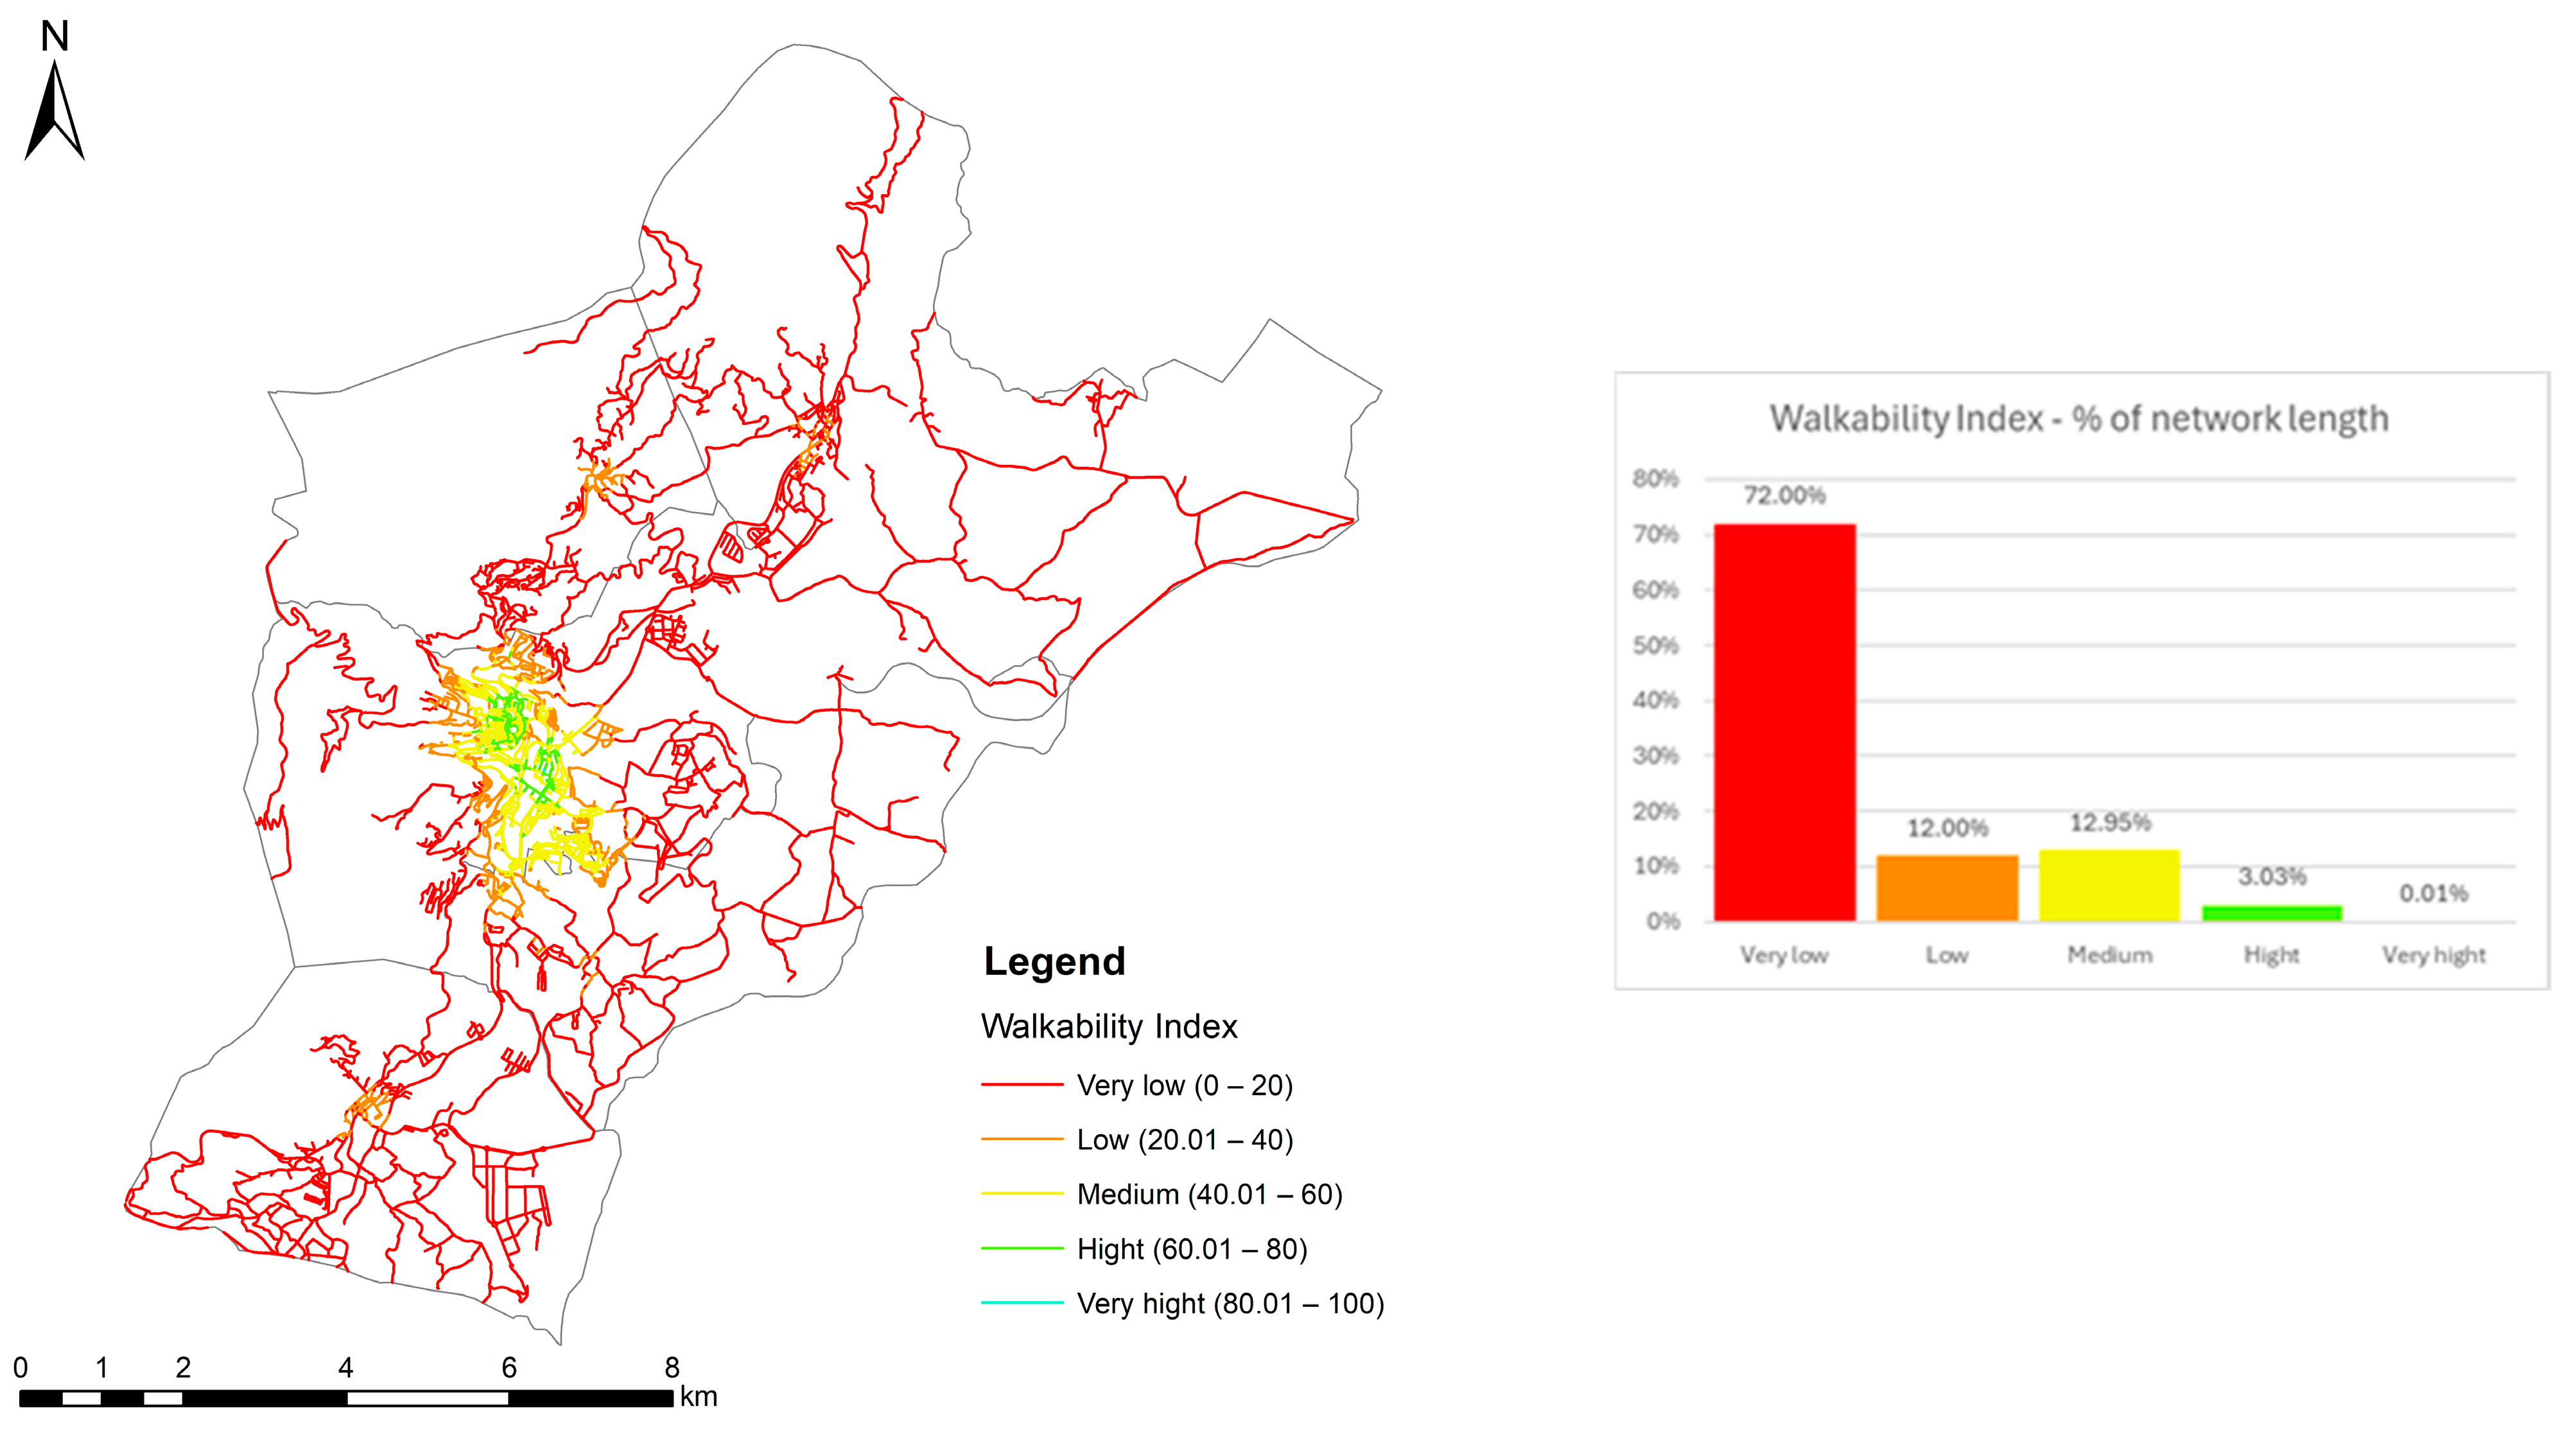
  • The walkability index, which refers to the attractiveness and suitability of an urban area for walking.
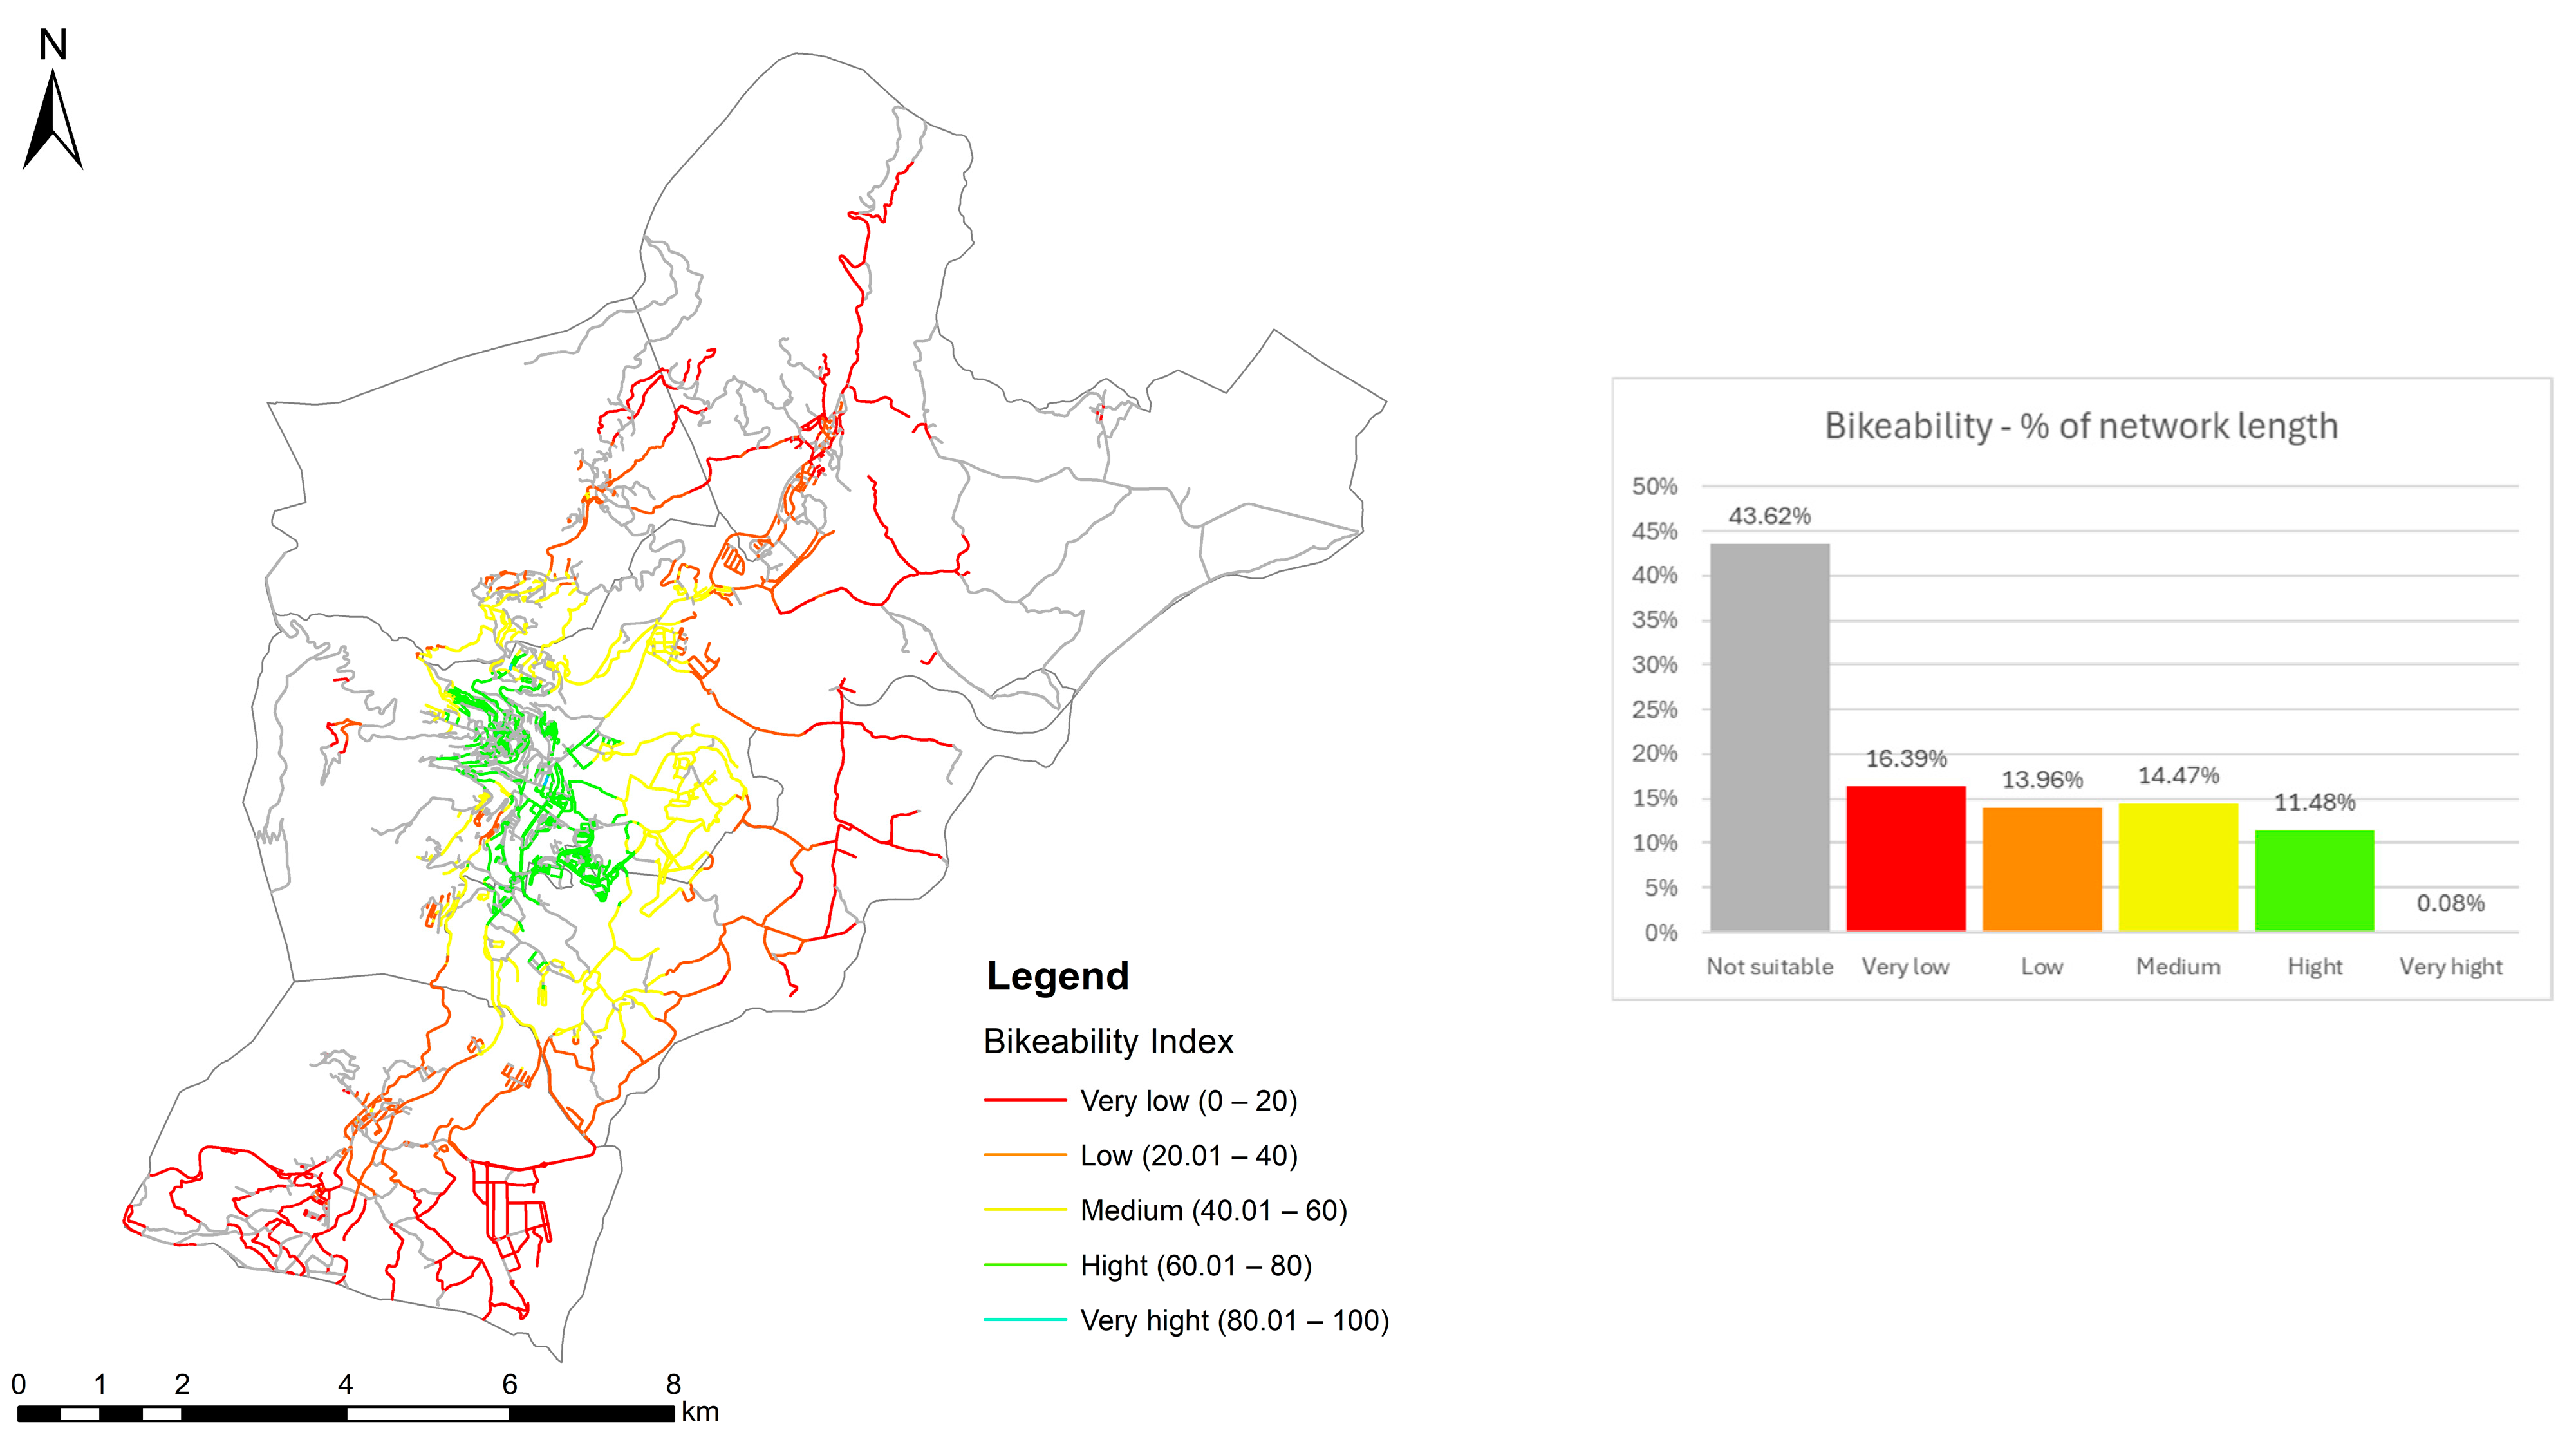
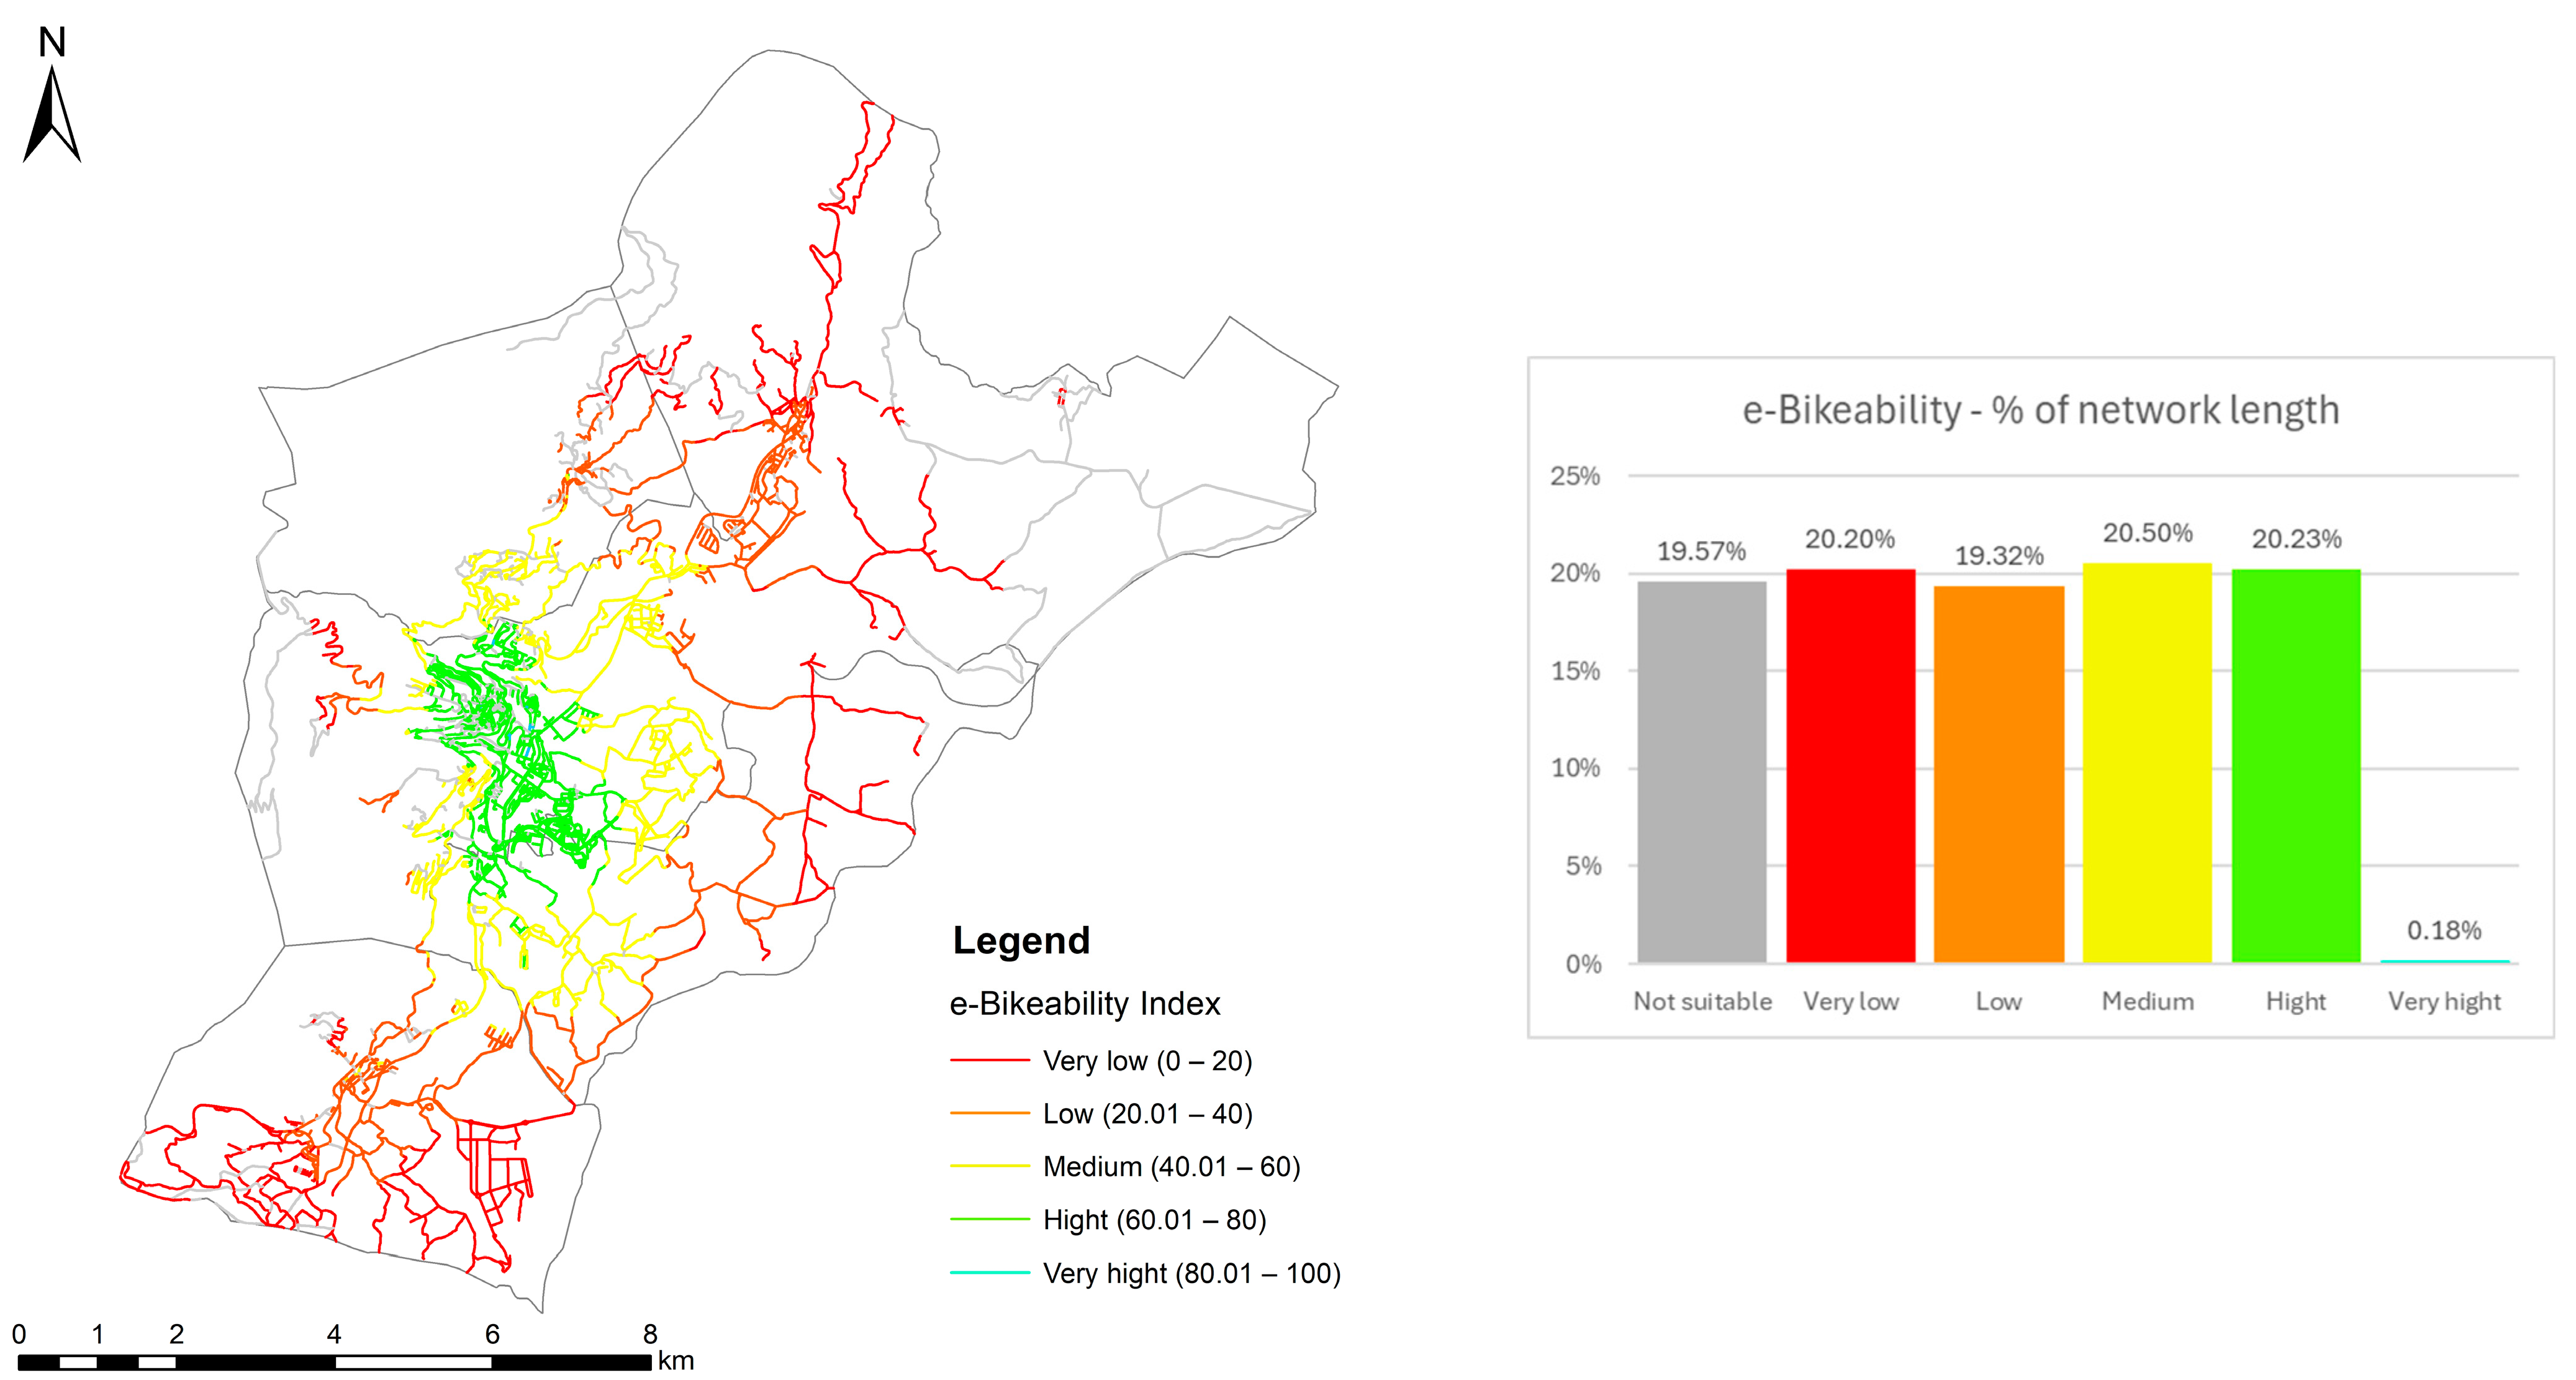
  • Two bikeability indices (for conventional and electric bikes), which reflect the comfort, safety, attractiveness, and suitability of an urban area for cycling.
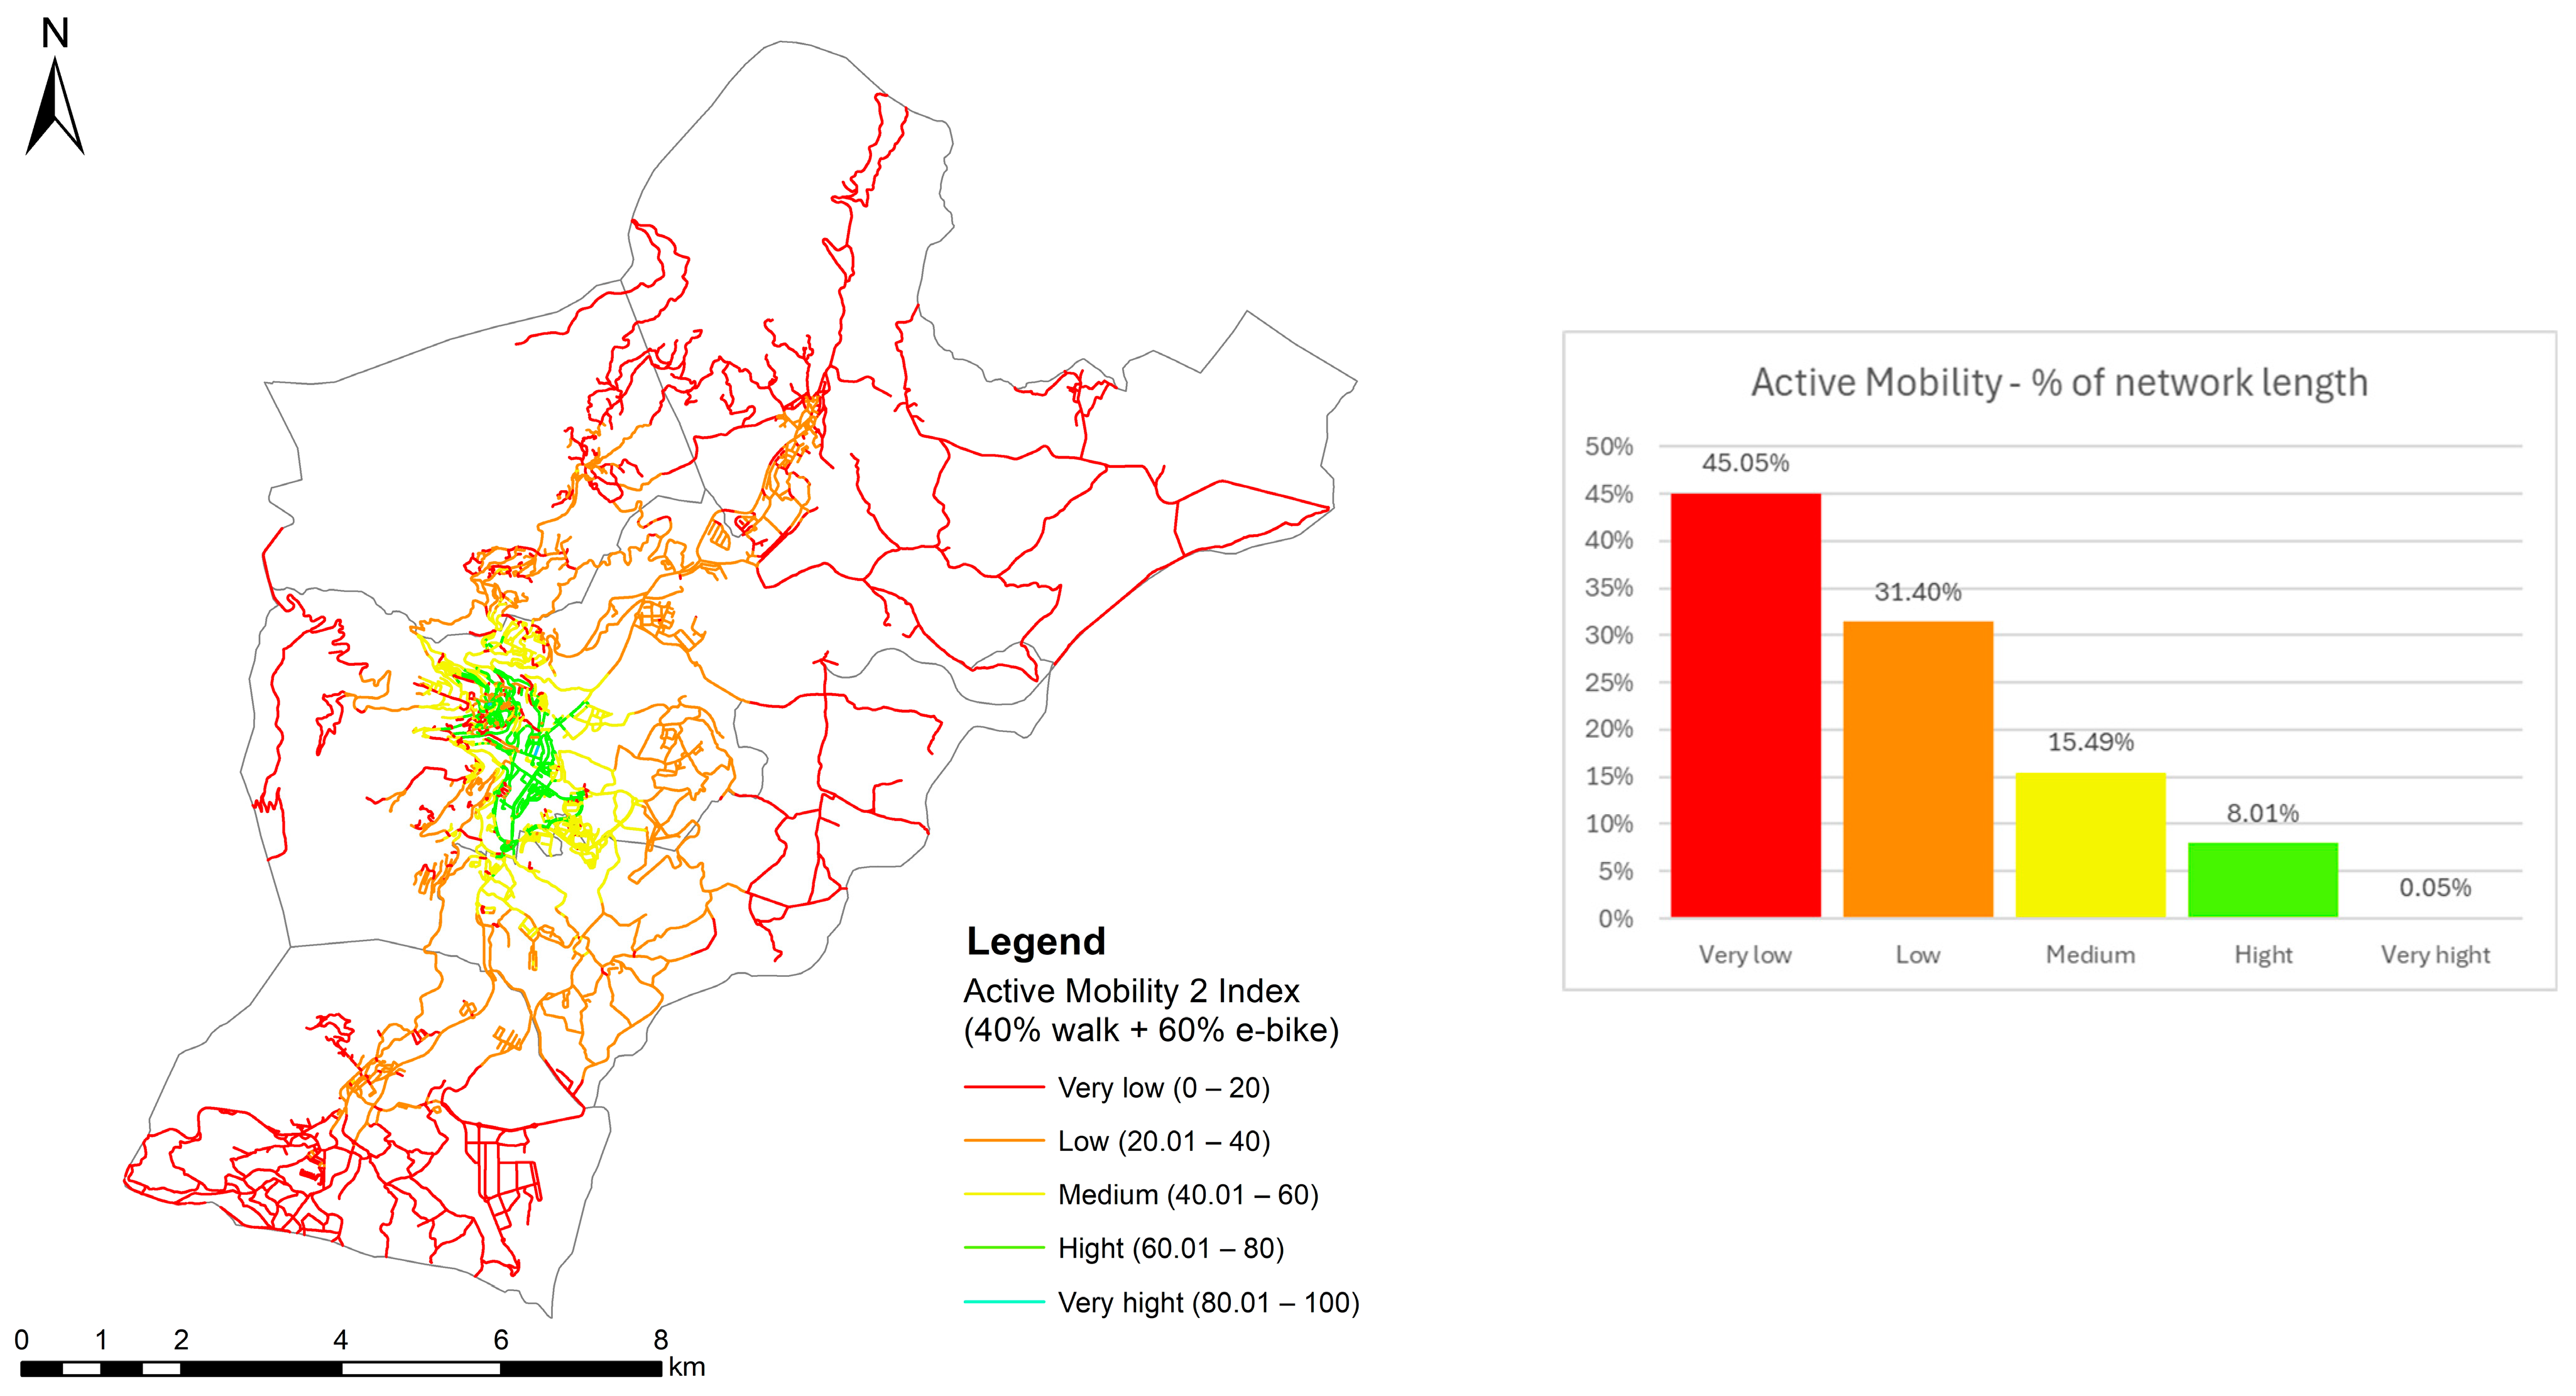
  • Two combinations of the previous: the Active Mobility 1 (walking and conventional cycling) and Active Mobility 2 (walking and e-cycling) indices.
Expressions (6) to (11) present the model formulation.
T G P m = j n w n × j n n
P D = R P A
P m _ n o r _ i = P i P m i n P m a x P m i n × 100
I i _ m = ( p T G P × T G P n o r + p P D × P D n o r ) × N S i
I A M _ 1 = p w × I i _ w + p b c × I i _ b c
I A M _ 2 = p w × I i _ w + p b e × I i _ b e
where
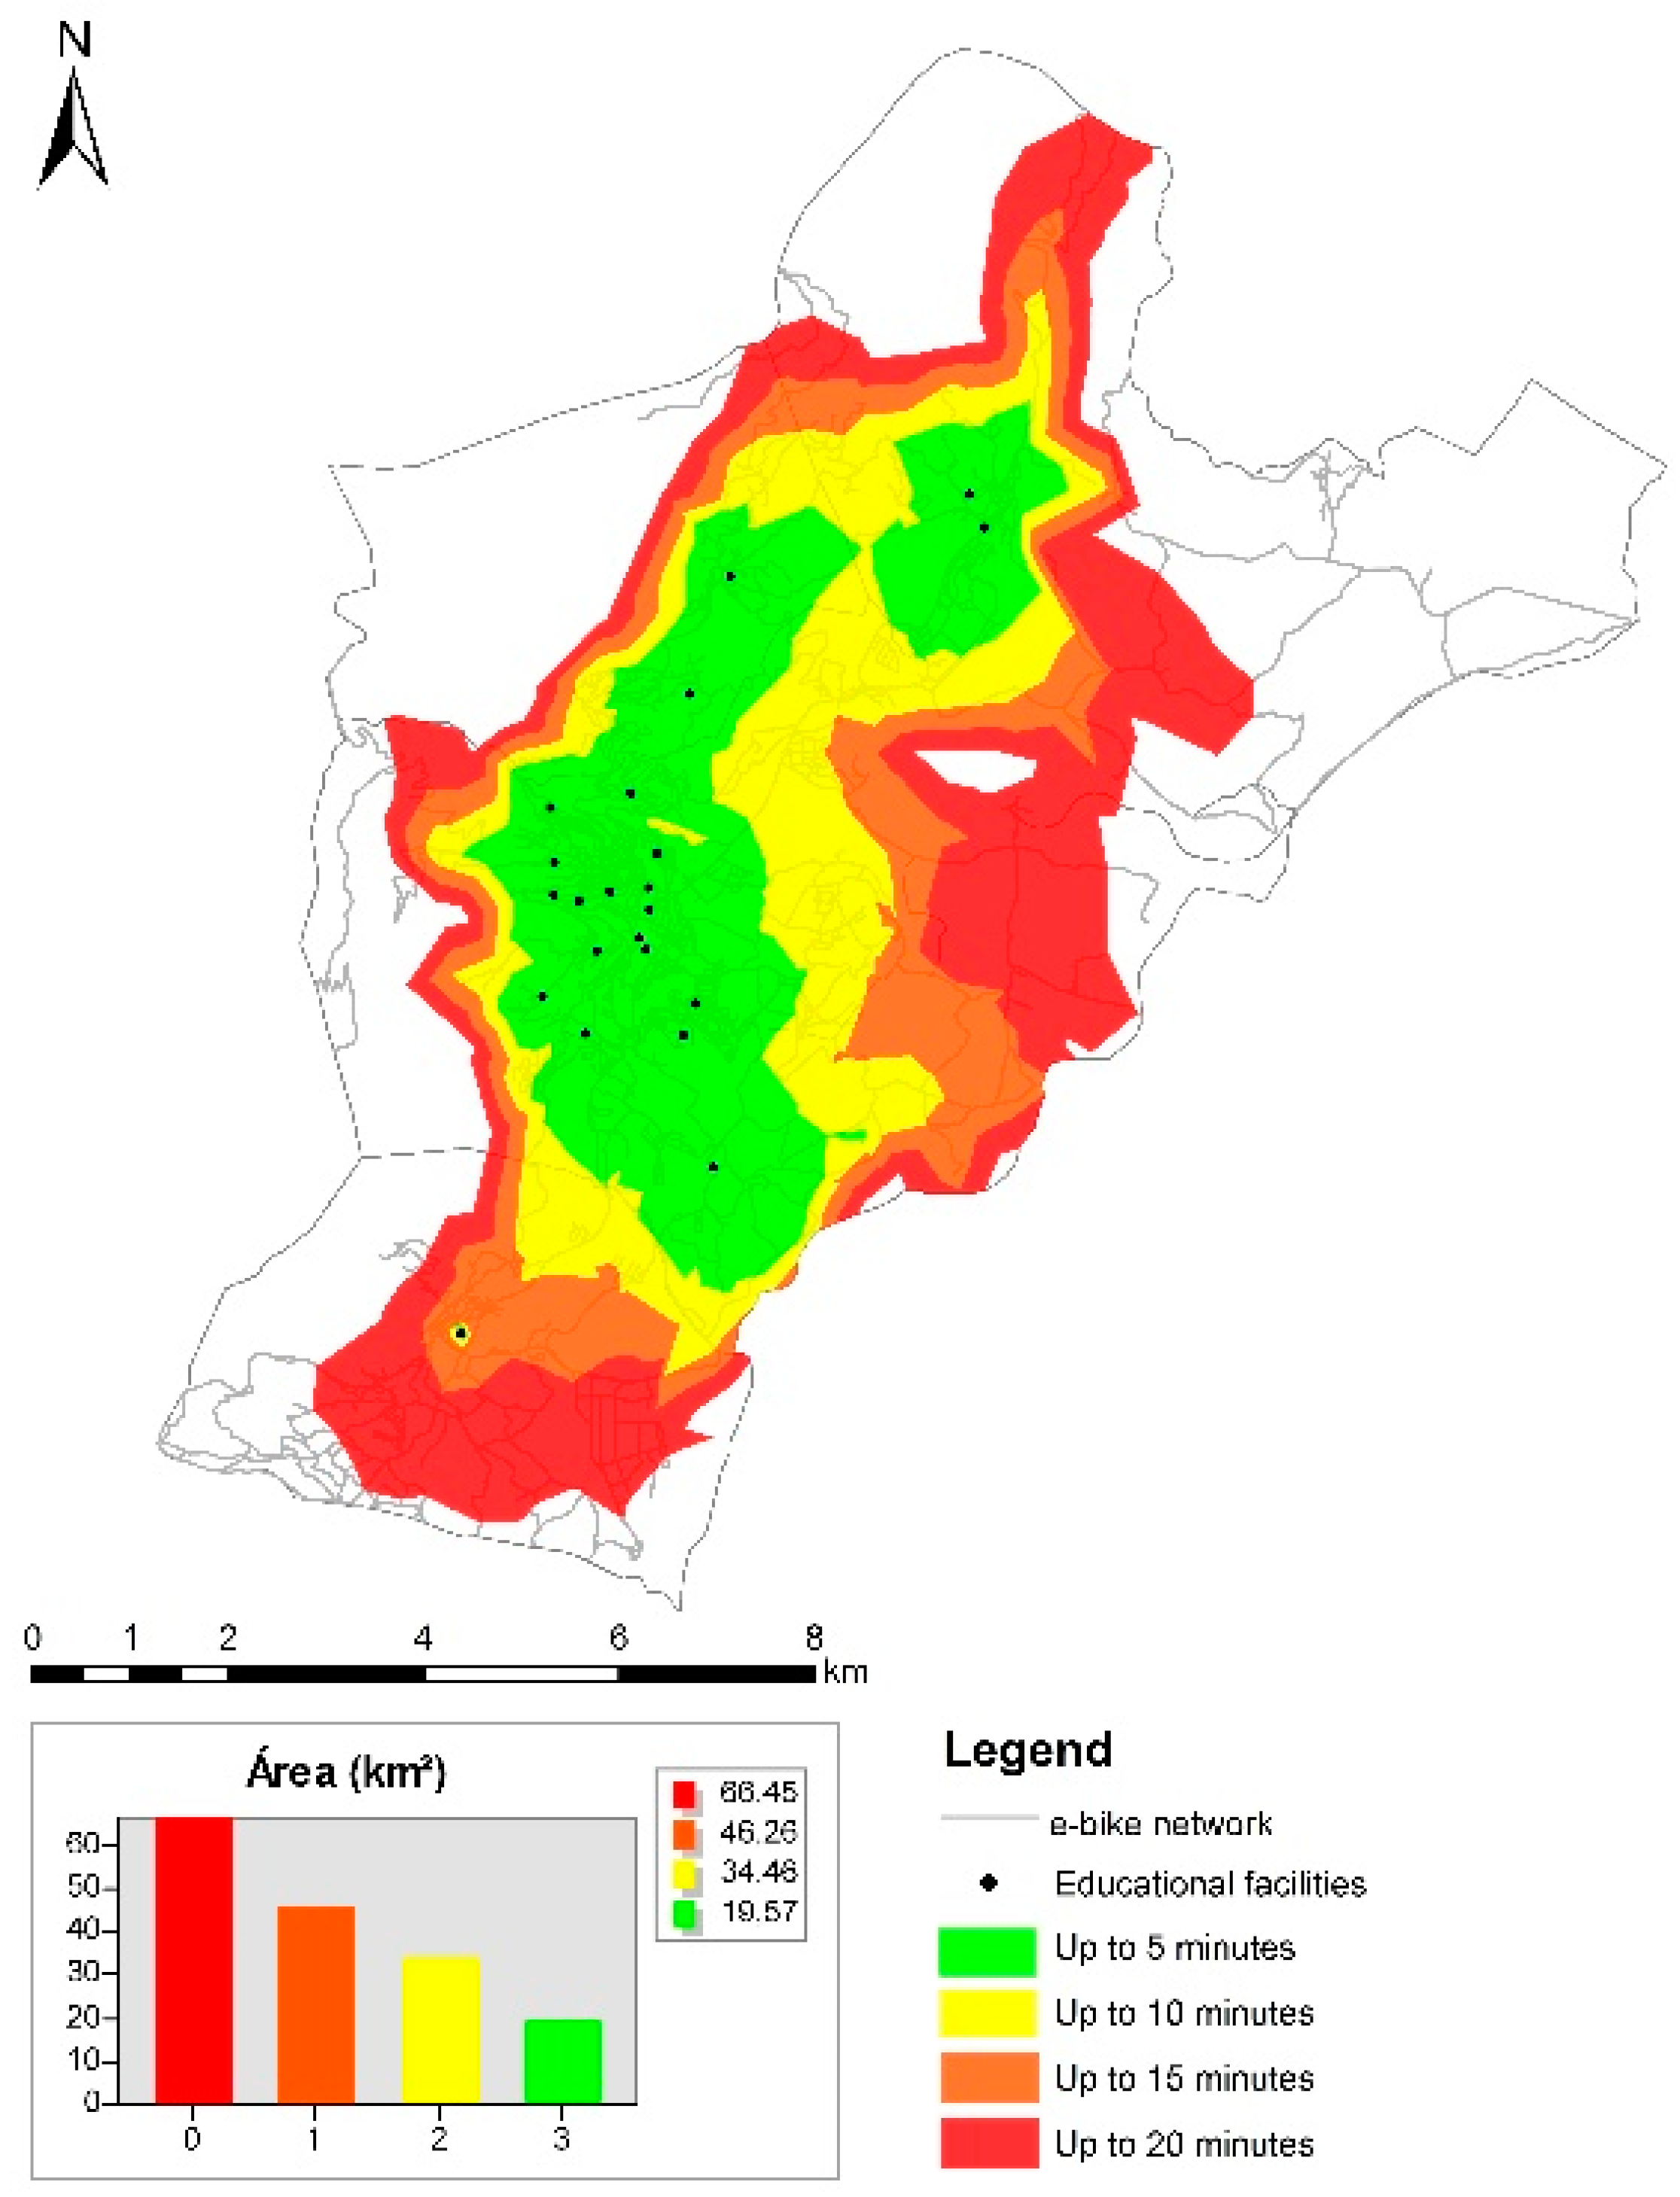
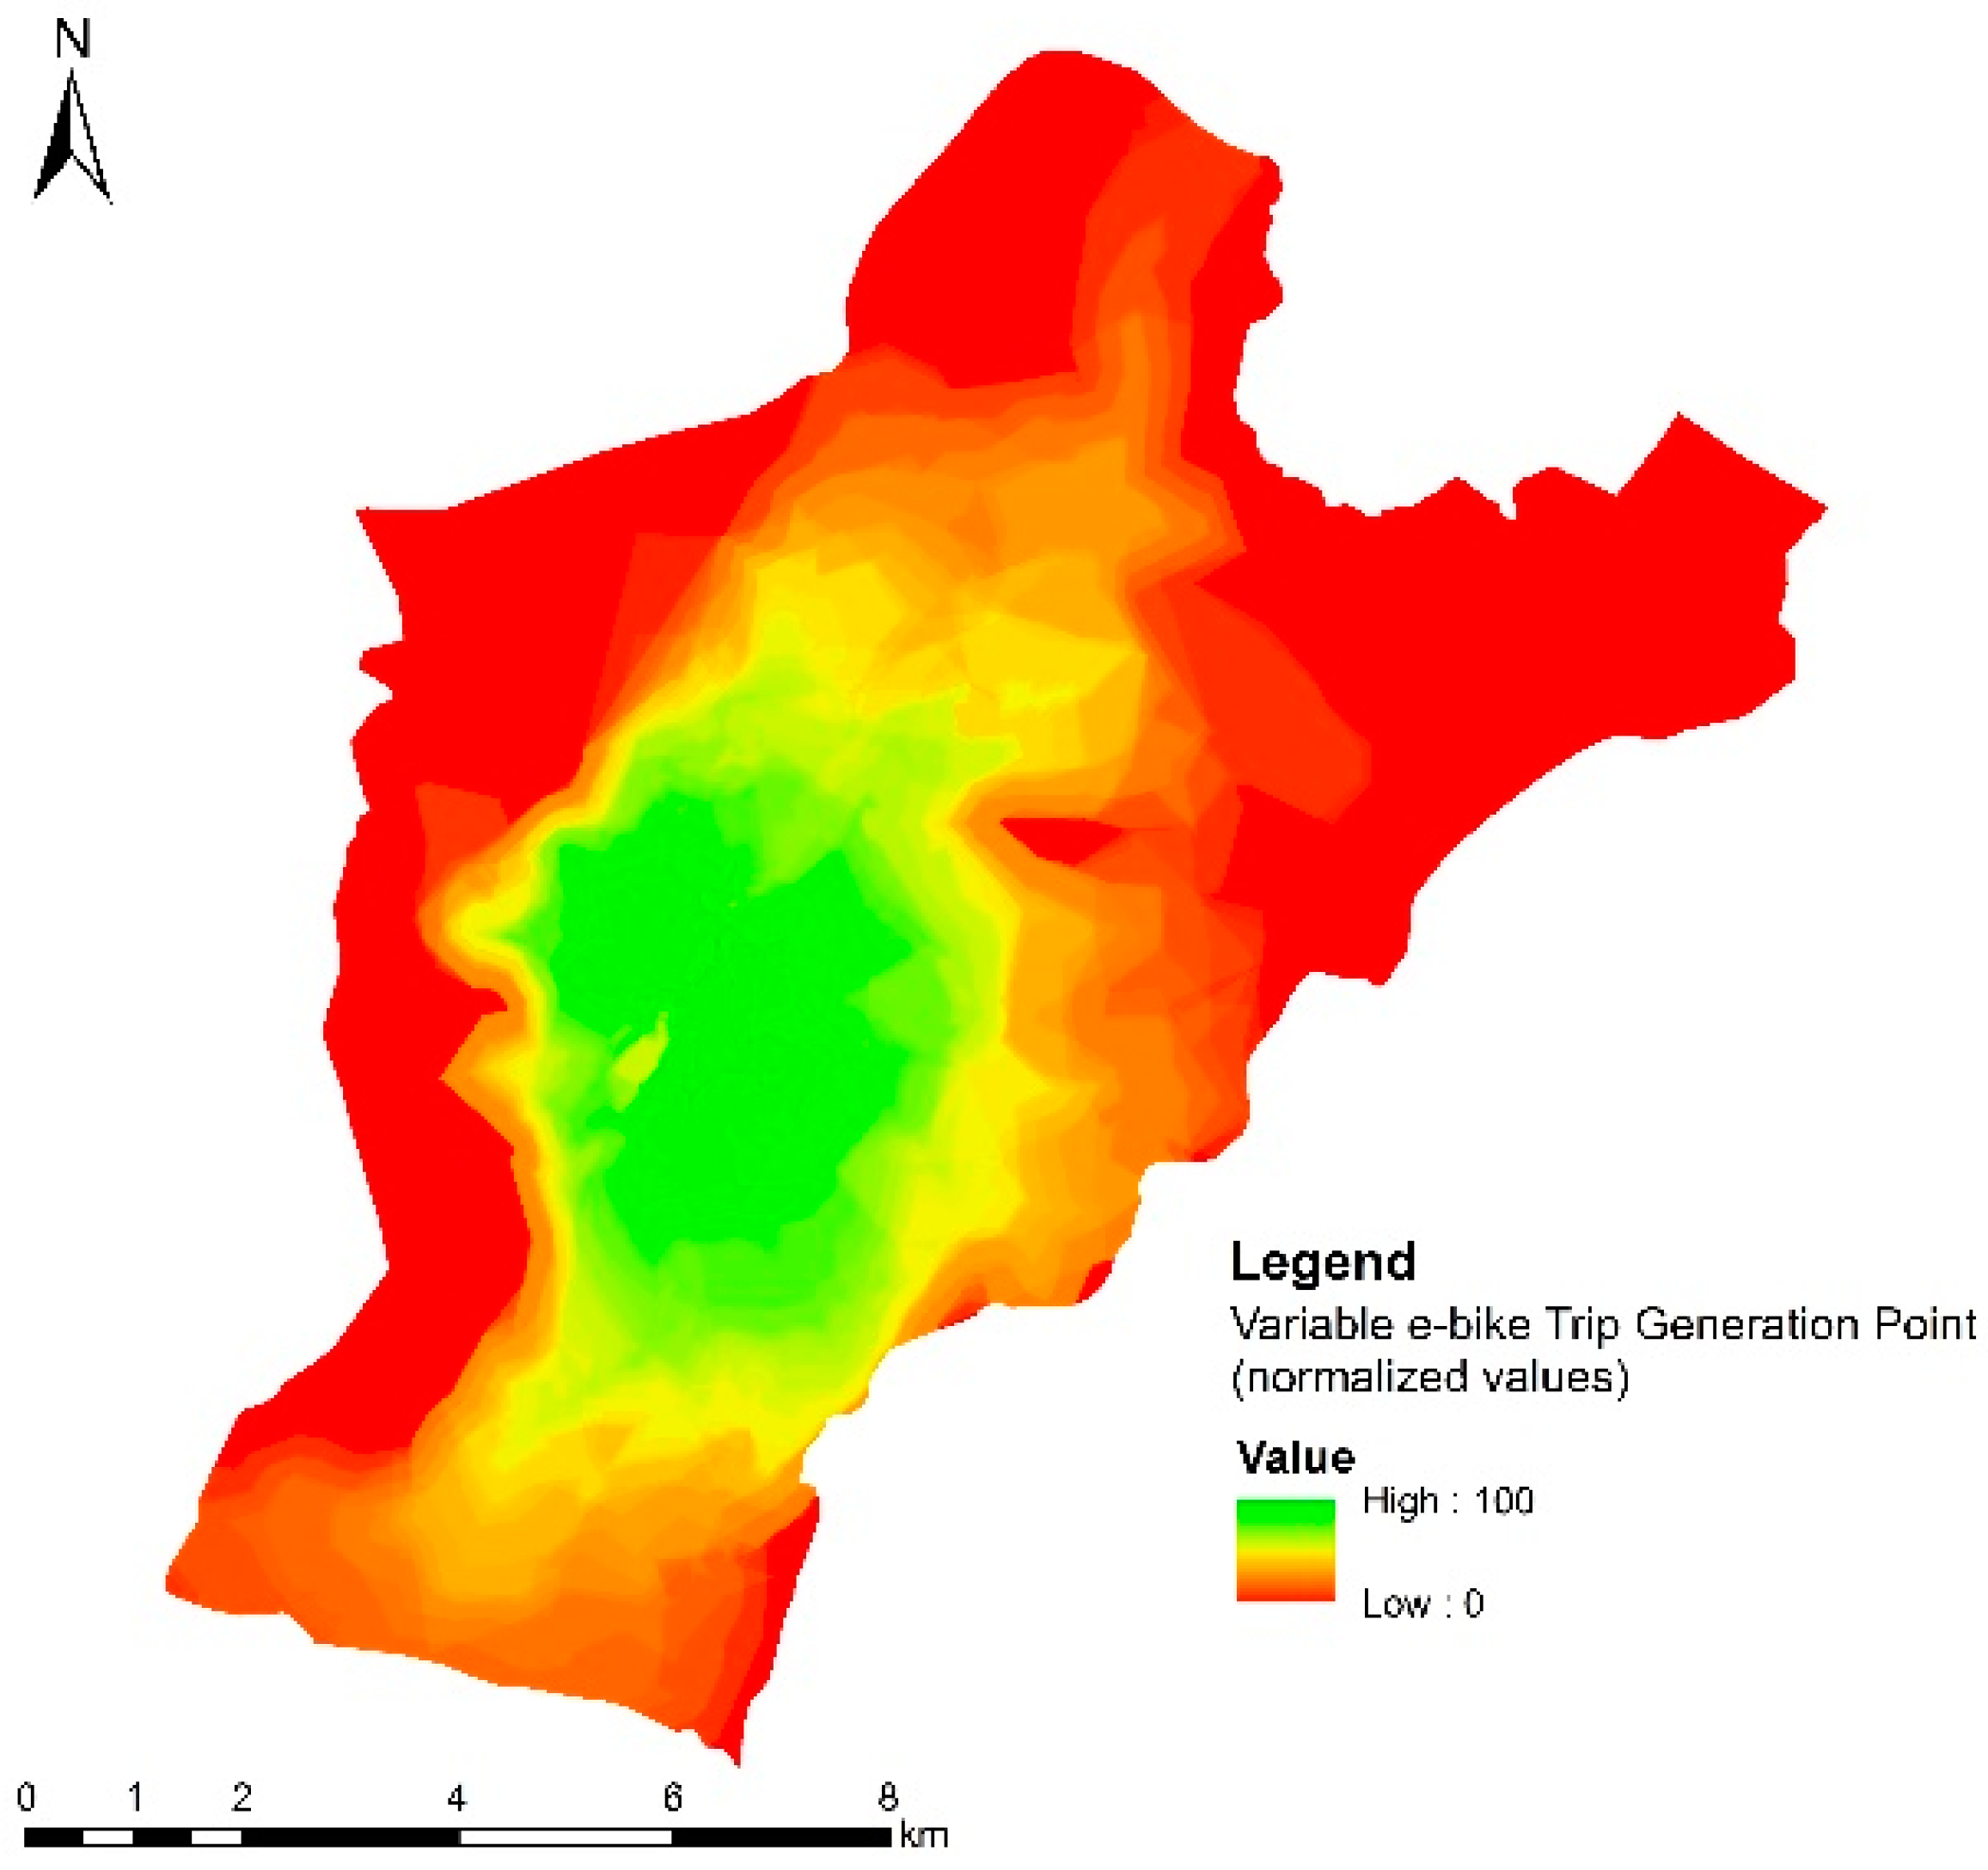
  • TGPm is the value of the trip-generation point variable for mode m (w for walkability, bc for conventional bike, and be for electric bike) (pixel, not normalized);
  • n is the number of sub-variables (number of facility categories, such as health, educational, services, etc.);
  • j is the score assigned to the service areas, and it represents the level of demand for walking or cycling (defined as a function of travel time, 0–100);
  • wn is the n sub-variable’s weight (defined from the inhabitants’ stated preferences survey, 0–1);
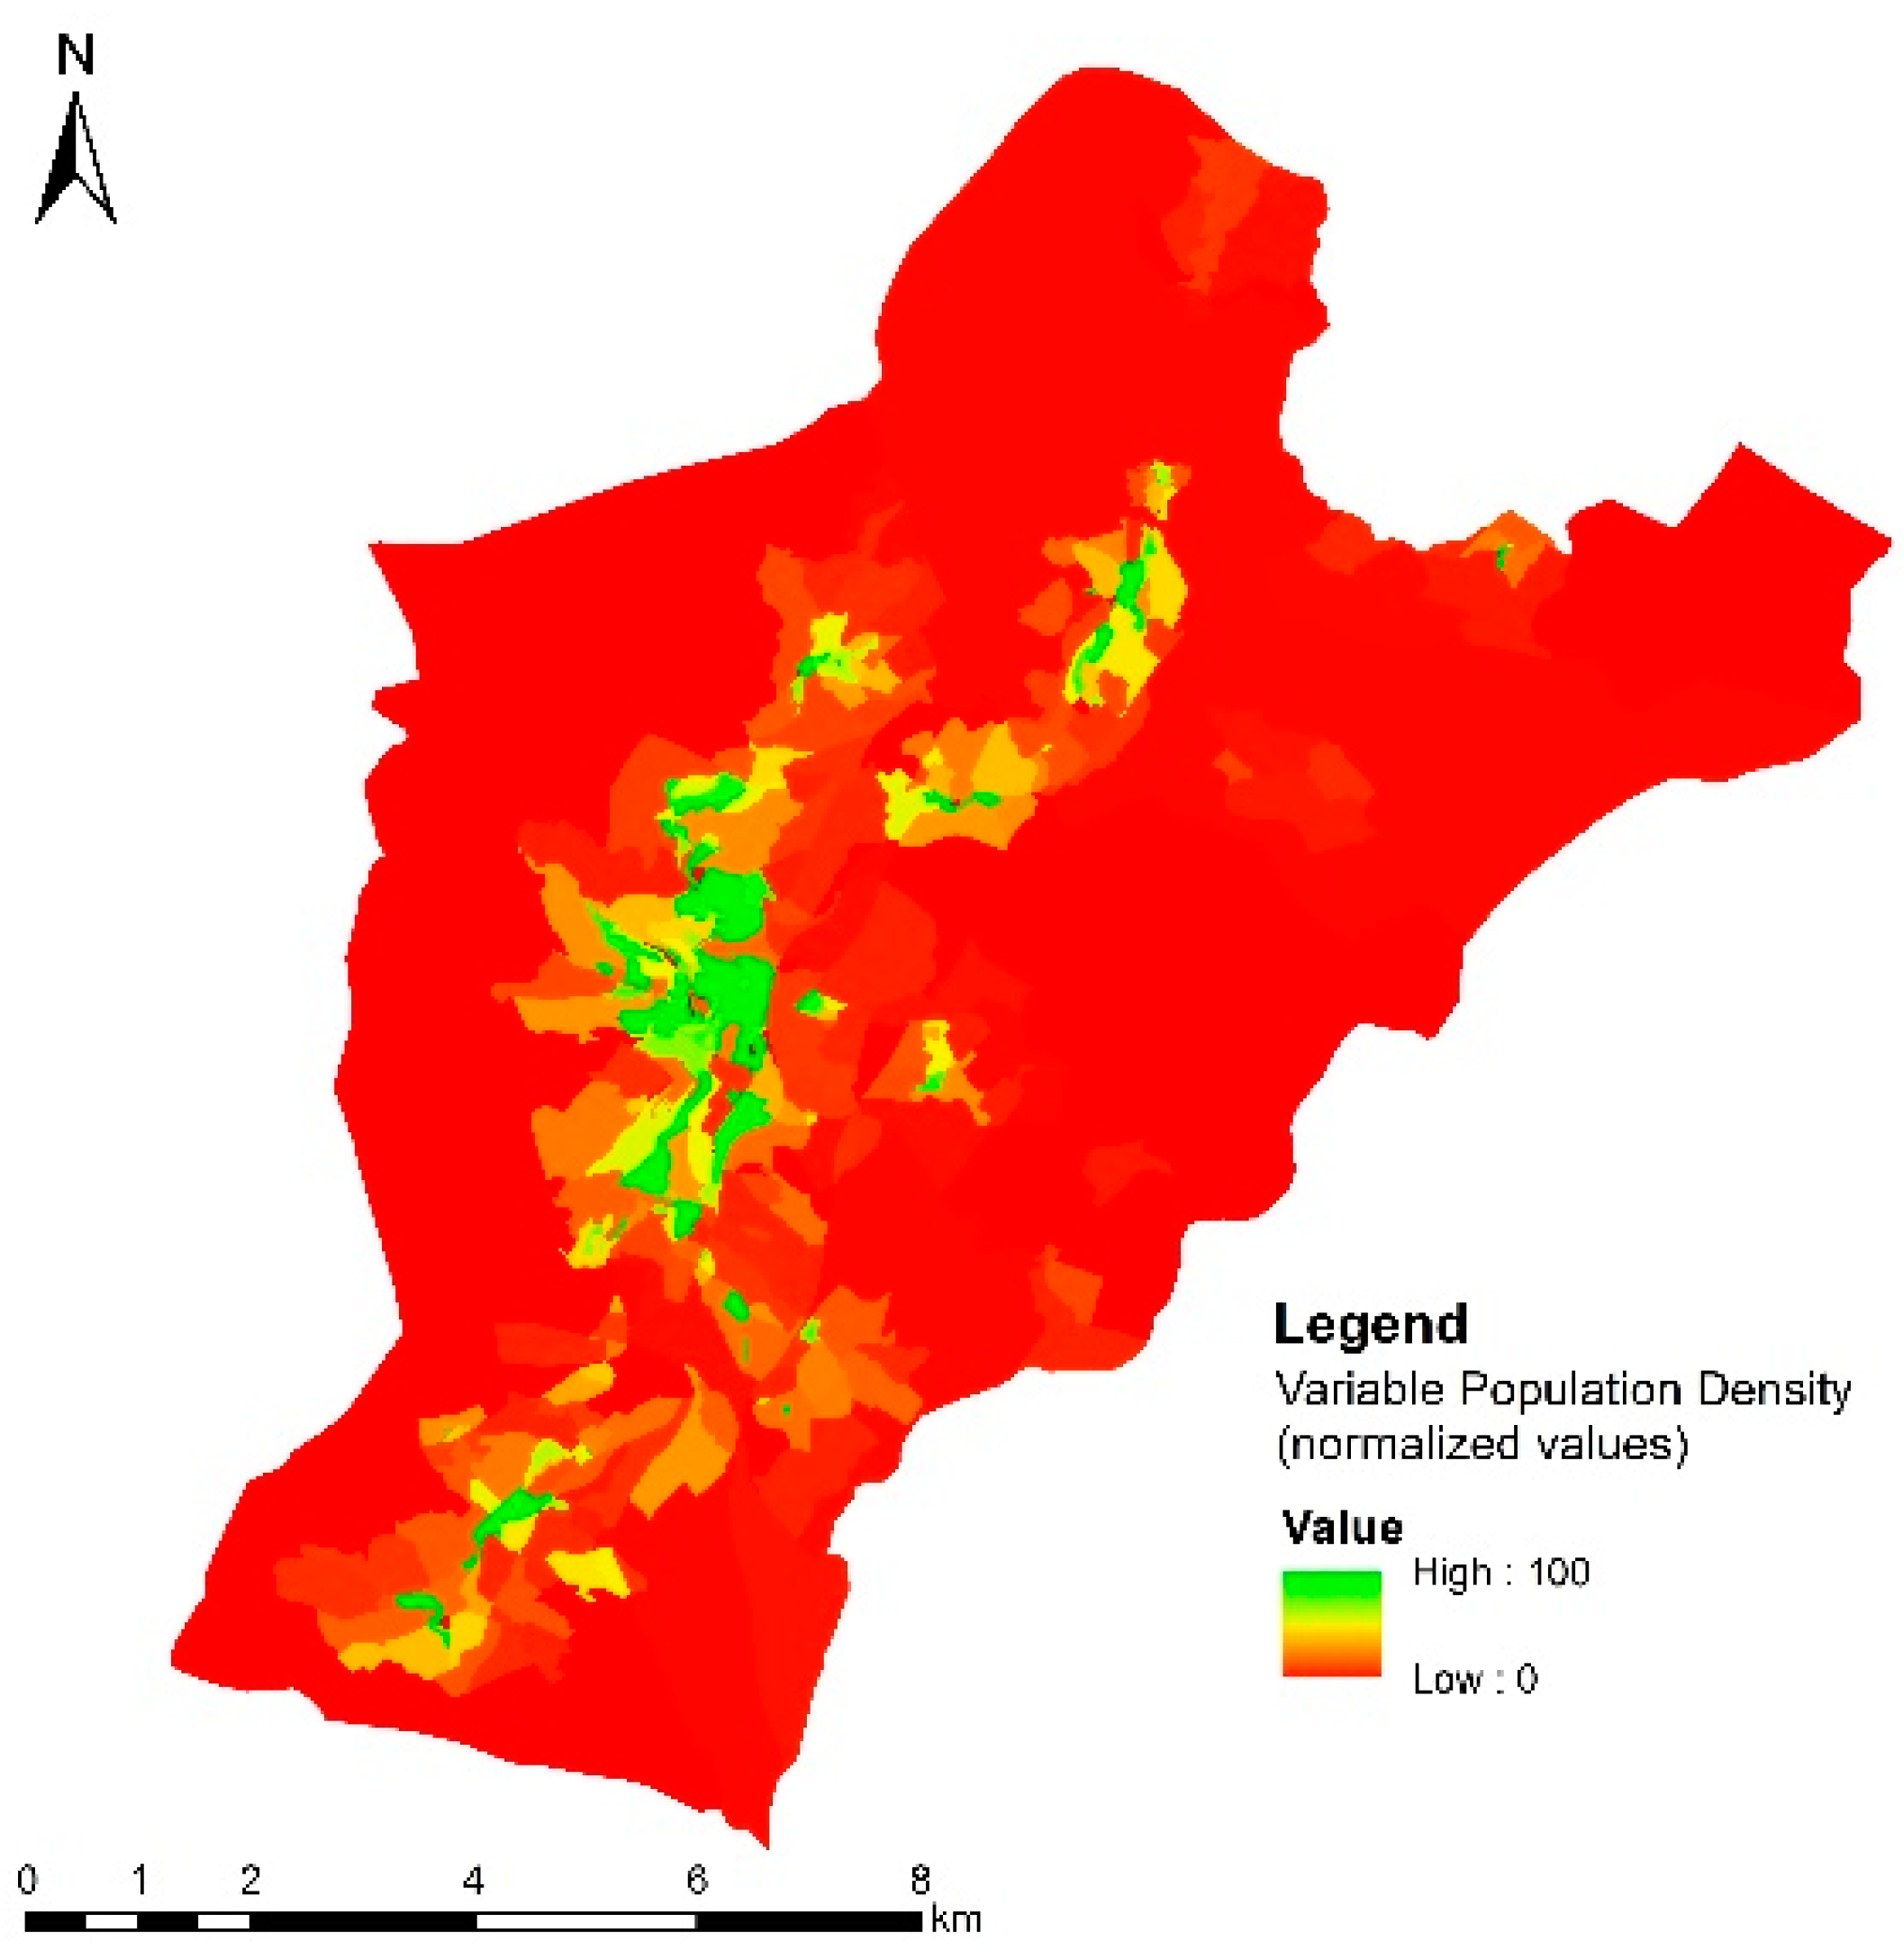
  • PD is the value of the population density variable in inhabitants/ha or inhabitants/km2 (pixel, not normalized);
  • RP is the resident population of a considered urban area (pixel, inhabitants);
  • A is the urban area under study in ha or km2; the A unit should be chosen according to the administrative territory division dimension that is considered (for example, neighbourhoods (ha) or parishes (km2));
  • Pm_nor_i is the normalized pixel value for TGPm_nor or PDnor (0–100);
  • Pi is the not-normalized pixel value for TGPm or PD;
  • Pmin and Pmax are the variable (pixel) minimum and maximum values (not normalized);
  • Ii_m is the network suitability index for pixel i on a 0–100 scale by transport mode m (very high: 80 < Ii_m ≤ 100; high: 60 < Ii_m ≤ 80; medium: 40 < Ii_m ≤ 60; low: 20 < Ii_m ≤ 40; and very low: 0 < Ii_m ≤ 20 suitability);
  • pTGP and pPD are the weights assigned to the trip-generation points and to the population density variable, defined by a panel of experts (0–1);
  • TGPnor is the value of the trip-generation point variable (pixel, normalized, 0–100);
  • PDnor is the value of the population density variable (pixel, normalized, 0–100);
  • NSi is the value of the road network characteristics variable for street segment i (0 for segments not adequate for walking or cycling, 0.75 for segments without a sidewalk that are adequate for walking, 1 for segments with a sidewalk that are adequate for walking, and 1 for segments adequate for cycling);
  • IAM_1 is the active mobility index, which is determined considering the walk and conventional bike modes on a 0-100 scale (very high: 80 < Ii_m ≤ 100; high: 60 < Ii_m ≤ 80; medium: 40 < Ii_m ≤ 60; low: 20 < Ii_m ≤ 40; and very low: 0 < Ii_m ≤ 20 suitability);
  • pw, pbc, and pbe are the weights to be assigned to the contribution of each mode to active mobility suitability, being defined by the panel of transportation experts and local authorities (0–1);
  • IAM_2 is the active mobility index, which is determined considering the walk and electric bike modes.
The results obtained are then converted back into a vector format, so that the indices can be assigned to each segment of the considered road network on a 0–100 scale (very high: 80 < Ii_m ≤ 100; high: 60 < Ii_m ≤ 80; medium: 40 < Ii_m ≤ 60; low: 20 < Ii_m ≤ 40; and very low: 0 < Ii_m ≤ 20 suitability).

2.3. Stage 3: Outcomes and Their Evaluation

The third and final stage is to collect and evaluate the results in order to identify the road and pedestrian network segments suitable for active mobility, as well as where conditions can be created to encourage the uptake of active modes. This stage allows the expected results to be compared with the observed results, which may contradict or confirm the initial expectations of the network managers. At this stage, the sensitivity analysis of the model is carried out, evaluating the results obtained for different combinations of weights. This leads to the calibration of the model based on the experience of mobility experts and network managers (expert panel). The results are then presented on maps showing the different levels of suitability for each segment of the road/pedestrian network for walking, cycling (conventional and electric), and for a combination of the two. The results of the active mobility indices are translated into vector files (lines) and thematic maps. In these maps, the road network segments are classified into six classes of suitability for active commuting: not suitable (segments excluded based on the considered restrictions), very low (0–20), low (20–40), reasonable (40–60), high (60–80), and very high suitability (80–100).

2.4. Automation of the Spatial Analysis Model in GIS
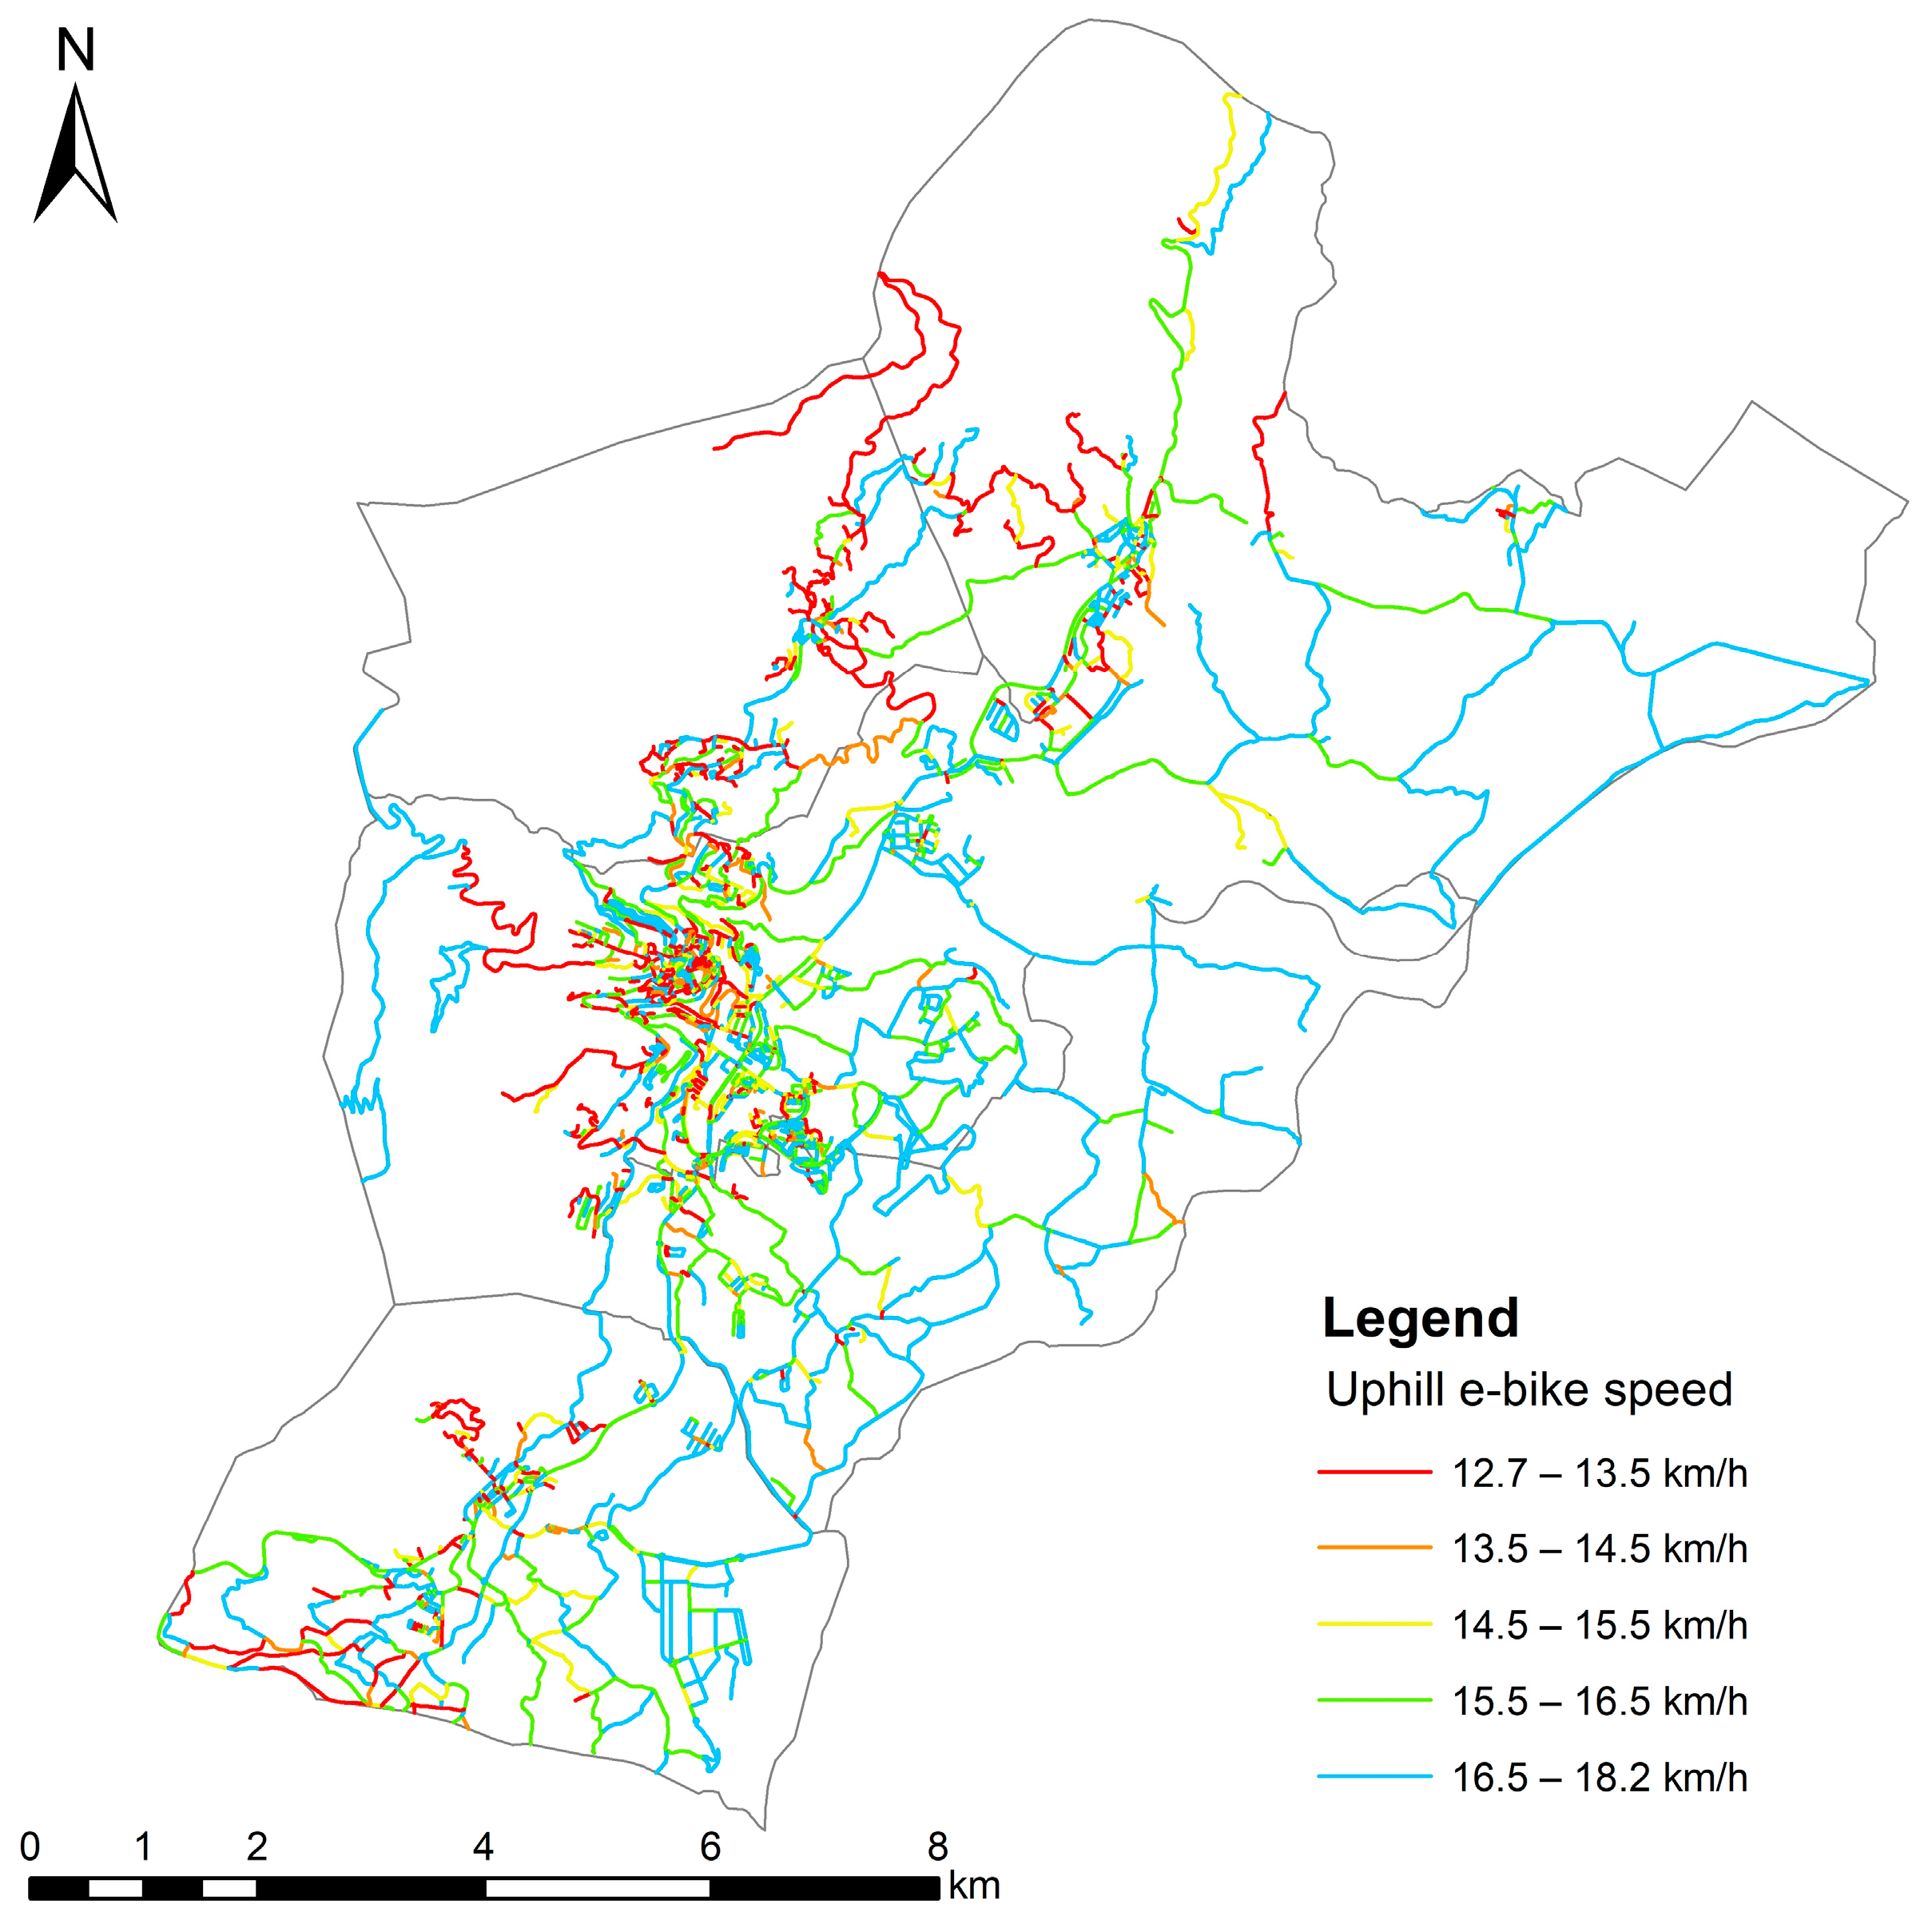
To facilitate the application of the proposed methodology by urban space managers, as well as its replicability in other urban spaces, the process was modelled in the ArcGIS Model Builder tool and tested using a case study to analyze the suitability of the existing road and pedestrian network of the city of Covilhã for active mobility. Figure 2 shows a simplified view of the first tool model (top of the figure) and the interface that allows the calculation of walking and cycling (conventional and electric) travel times. Figure 3 presents a simplified view of the second tool model (top of the figure) and part of the tool developed for the calculation of the walkability, bikeability, e-bikeability, and active mobility indices.
Although not fully readable, Figure 2 and Figure 3 give an idea of the significant number of processes involved and the complexity of the models. Details of the models developed for the tools are available from the authors on request.

3. Case Study

To validate the proposed approach and demonstrate the model’s ability to identify the active mobility potential of urban transport infrastructures, the methodology was applied to the pedestrian and road network of the urban perimeter of the municipality of Covilhã, Portugal. Additional network elements not included in the available vector data, such as lifts, funiculars, stairs, and pedestrian and cycle paths, with some integrated into parks and green spaces, were added to the network. Furthermore, the choice of a hilly city made it possible to validate the applicability and interest of the approach for different scenarios and topographic characteristics.
Table 4 shows the weights considered for the trip-generation point variable and sub-variables, defined on the basis of preferences expressed by the active surveyed population of Covilhã (275 responses for walking and 92 for cycling) and the opinions of an expert panel (panel of 15 experts for walking, 8 for cycling, and 13 for active mobility—walking and cycling combined). Figure 4, Figure 5, Figure 6 and Figure 7 show examples of the maps obtained for trip-generation point attractiveness, population density, and road and pedestrian networks. Examples of the results obtained for the walkability, bikeability, e-bikeability, and active mobility indices are shown in Figure 8, Figure 9, Figure 10 and Figure 11.
For the scenario that was considered representative by the network manager (i.e., that was assigned a weight of 70% for the attractiveness of trip-generation points variable, 30% for the population density variable, 40% for the walkability index, and 60% for the bikeability and e-bikeability indices), it was found that 16.0%, 26.0% and 40.9% of the network length had a reasonable to very high suitability for pedestrian mobility, conventional and electric bicycle use (respectively), and 23.5% was found reasonable to very suitable for active mobility. The latter corresponds to the aggregation of pedestrian and electric bicycle use, which is considered more representative for this case study as Covilhã is a hilly city (see Table 5).

4. Discussion and Conclusions

This study presents an automated GIS tool based on a proposed methodology for the identification of the most suitable transport network segments for walking and cycling regarding commuter journeys. The aim is to help decision makers that are responsible for urban spatial and mobility planning to support and develop solutions that encourage the use of active modes of transport. The proposed methodology uses the location and attractiveness of trip-generation points, population density, and the characteristics of the road and pedestrian network (namely, road class (road hierarchy), road slope, and the presence of sidewalks) as variables to be considered in the analysis. The proposed methodological process starts with the collection and processing of the publicly available data needed for the analysis, followed by the preparation and validation of the road and pedestrian network, which consists of operations that are carried out in a GIS environment. Network and spatial multi-criteria analyses based on a weighted linear method are then applied. This type of approach is well suited to the analysis and combination of the variables under consideration, as it can provide a measure of the suitability of the existing transport network for walking and cycling. The use of available and reliable data and automating the process using the Model Builder tool in a GIS environment makes it easier to apply the approach to different scenarios with minimal adaptation and to obtain results quickly in an automated, scalable, and reproducible way.
To validate the approach, the proposed methodology was applied to a case study that involved the city of Covilhã, located in the central region of Portugal. Based on studies and surveys conducted with specialists and managers of the network under study, the weights to be assigned to the variables considered were determined: 70% for the trip-generation point attractiveness variable and 30% for the population density variable. For the road/pedestrian network variable, restrictions were defined considering the active mode analyzed (presence of sidewalks for walking and road slopes for cycling). The application made it possible to illustrate the whole process of obtaining and processing data, as well as the definition of their respective weights.
The results show that, as expected, the areas with the highest concentration of facilities and population have the greatest potential when analyzing walkability (higher index values). However, due to the unfavorable slope of the road network in some of these areas, part of it is classified as ‘not suitable’ for the use of conventional bicycles (43.3% of the analyzed network), but this is not so significant when it comes to the use of electric bicycles (19.6%). On the other hand, the network segments with reasonable to very high suitability represent 16.0% for walking, 26.0% for the use of conventional bicycles, and 40.9% for the use of electric bicycles (for a maximum travel time of 20 min). The analysis of suitability for active mobility, which combines walking and cycling, shows that this index increases as the importance of cycling over walking increases. When comparing the results of the active mobility index for ‘walk + conventional bicycle’ and for ‘walk + electric bicycle’, the suitability of the network increases when the use of electric bicycles is considered. As Covilhã is a hilly city, this analysis is particularly interesting for this case study. Considering different combinations of weightings of the two modes, we found the following: with 60% for walkability and 40% for e-bikeability, the increase in the percentage of network length with reasonable to very high suitability was 7.3% compared to the use of the bikeability index; with a combination of 50% walkability and 50% e-bikeability, the increase was 8.3%; and with 40% walkability and 60% e-bikeability, the increase was 9.4%. More favorable results for the use of electric bicycles compared to conventional bicycles are to be expected.
In conclusion, the results obtained allow urban space and mobility managers to identify the urban areas with the best mobility characteristics and those with potential for improvement, supporting intervention solutions aimed at promoting different active transport modes together or separately.
The difficulties encountered in the development of this study included the lack of geo-referenced information on the presence of sidewalks, which had to be collected, and the limitations of the Model Builder tool, which appears to have been designed for smaller and less complex models. For future work, it is suggested to consider different topography scenarios, to make the data pre-processing fully autonomous (as it is still time-consuming), and to test the automation of the process using the Python programming language. Improvements are also sought to include other modes of soft transport, the width and condition of paths and sidewalks, user safety, and accessibility for people with reduced mobility. Local authorities can play a crucial role in collecting and reviewing this information over time to effectively support strategic decisions on sustainable urban mobility.

Author Contributions

Conceptualization, B.S., S.F. and P.L.; methodology, B.S., S.F. and P.L.; validation, B.S., S.F. and P.L.; formal analysis, S.F. and P.L.; investigation, B.S., S.F. and P.L.; writing—original draft preparation, B.S.; writing—review and editing, B.S., S.F. and P.L.; supervision, B.S.; funding acquisition, B.S. All authors have read and agreed to the published version of the manuscript.

Funding

This work was supported by the GeoBioTec Research Unit through the strategic projects UIDB/04035/2020 (https://doi.org/10.54499/UIDB/04035/2020) and UIDP/04035/2020 (https://doi.org/10.54499/UIDP/04035/2020), funded by the Fundação para a Ciência e a Tecnologia, IP/MCTES, through national funds (PIDDAC).

Institutional Review Board Statement

Not applicable.

Informed Consent Statement

Not applicable.

Data Availability Statement

The data used in the current study are available online (freeware) on official websites. These include national statistical and road network databases. For the case study presented, data for the city of Covilhã were obtained from the websites www.ine.pt and https://download.geofabrik.de/ (accessed on 15 February 2021). The results derived from these data for the case study presented, as well as the tools developed, are available on request from the authors.

Acknowledgments

The authors acknowledge the University of Beira Interior, GEOBIOTEC—GeoBioSciences, GeoTechnologies and GeoEngineering (UID/GEO/04035/2020) and CERIS—Civil Engineering Research and Innovation for Sustainability (UID/ECI/04625/2020) for supporting the performed study.

Conflicts of Interest

The authors declare no conflicts of interest.

References

  1. Dekoster, J.; Schollaert, U. Cidades Para Bicicletas, Cidades de Futuro; European Commission: Brussels, Belgium, 2000. (In Portuguese) [Google Scholar]
  2. IMTT. Guia Para a Elaboração de Planos de Mobilidade e Transportes. 2011. Available online: https://www.imt-ip.pt/sites/IMTT/Portugues/Planeamento/DocumentosdeReferencia/PacotedaMobilidade/Documents/Pacote%20da%20Mobilidade/Guia%20PMT_Mar%C3%A7o_2011.pdf (accessed on 3 January 2020). (In Portuguese).
  3. European Commission. New EU Urban Mobility Framework—Commission Communication. 2021. Available online: https://ec.europa.eu/transport/themes/urban/urban_mobility_en (accessed on 3 June 2024).
  4. Southworth, M. Designing the Walkable City. J. Urban. Plan. Dev. 2005, 131, 246–257. [Google Scholar] [CrossRef]
  5. Vale, D. The city and the bicycle: An analitycal reading. Finisterra 2016, 51, 45–66. [Google Scholar] [CrossRef]
  6. Paglione, L.; Donato, M.; Cofone, L.; Sabato, M.; Appolloni, L.; D’Alessandro, D. The Healthy City Reimagined: Walkability, Active Mobility, and the Challenges of Measurement and Evaluation. Urban. Sci. 2024, 8, 157. [Google Scholar] [CrossRef]
  7. Enab, D.; Zawawi, Z.; Qanazi, S.; Shahrour, I. Socio-Spatial Analysis of Schools Based on Neighborhood Planning of the 15-min City. Urban Sci. 2024, 8, 143. [Google Scholar] [CrossRef]
  8. European Commission. Transport in the European Union Current Trends and Issues; European Commission: Brussels, Belgium, 2019. Available online: https://transport.ec.europa.eu/news-events/news/new-eu-transport-report-current-trends-and-issues-2024-06-27_en (accessed on 19 September 2020).
  9. European Platform of Sustainable Urban Mobility Plans. Guidelines for Developing and Implementing a Sustainable Urban Mobility Plan, Germany. 2021. Available online: https://urban-mobility-observatory.transport.ec.europa.eu/system/files/2023-09/sump_guidelines_2019_second%20edition.pdf (accessed on 19 September 2020).
  10. European Commission. Communication from the Commission to the European Parliament, the Council, the European Economic and Social Committee and the Committee of the Regions—Together Towards Competitive and Resource-Efficient Urban Mobility; European Commission: Brussels, Belgium, 2013. Available online: https://eur-lex.europa.eu/legal-content/EN/TXT/HTML/?uri=CELEX:52013DC0913 (accessed on 19 September 2020).
  11. European Commission. A European Strategy for Low-Emission Mobility; European Commission: Brussels, Belgium, 2016. Available online: https://ec.europa.eu/commission/presscorner/detail/en/MEMO_16_2497 (accessed on 19 September 2020).
  12. United Nations Economic Commission for Europe. Paris Declaration: City in Motion, People First; UNECE: New York, NY, USA, 2015. Available online: http://digitallibrary.un.org/record/792596 (accessed on 19 September 2020).
  13. Urban Agenda for the EU. Partnership for Urban Mobility Final Action Plan. 2018. Available online: https://ec.europa.eu/futurium/en/system/files/ged/2018-11-14_pum_final_action_plan.pdf (accessed on 19 September 2024).
  14. Duany, A.; Steuteville, R. Defining the 15-Minute City, Public Square, A CNU Journal. Available online: https://www.cnu.org/publicsquare/2021/02/08/defining-15-minute-city (accessed on 19 September 2024).
  15. Caetano, L. A Cidade de 15 Minutos, W2G Consultoria e Investigação em Mobilidade e Transportes (in Portuguese). 2021. Available online: https://www.w2g.pt/2020/08/a-cidade-de-15-minutos-747/ (accessed on 19 September 2020).
  16. IMTT. Diretrizes Nacionais para a Mobilidade. 2012. Available online: https://www.imt-ip.pt/sites/IMTT/Portugues/Planeamento/DocumentosdeReferencia/PacotedaMobilidade/Documents/Pacote%20da%20Mobilidade/Directrizes_vposconsultapublica_abril2012.pdf (accessed on 3 January 2020). (In Portuguese).
  17. Fundo para o Serviço Público de Transportes. Apoio à Aquisição e Instalação de Equipamentos Destinados ao Estacionamento de Bicicletas; Fundo para o Serviço Público de Transportes: Lisboa, Portugal, 2021. (In Portuguese) [Google Scholar]
  18. Diário da República n.º 253/2021; Série, I. Lei n.º 98/2021—Lei de Bases do Clima. Assembleia da República: Lisboa, Portugal, 2021. (In Portuguese)
  19. Diário da República n.º 45/2021; Série II. Despacho n.º 2535/2021—Regulamento de Atribuição do Incentivo Pela Introdução no Consumo de Veículos de Baixas Emissões. Assembleia da República: Lisboa, Portugal, 2021. (In Portuguese)
  20. Diário da República n.º 147/2019; Série, I. Resolução do Conselho de Ministros n.º 131/2019—Estratégia Nacional para a Mobilidade Ativa Ciclável 2020–2030. Assembleia da República: Lisboa, Portugal, 2021. (In Portuguese)
  21. ZERO. ZERO Quer Verdadeiros Planos de Mobilidade Urbana Sustentável. 2020. Available online: https://zero.ong/noticias/zero-quer-verdadeiros-planos-de-mobilidade-urbana-sustentavel-pmus-obrigatorios/ (accessed on 19 December 2023). (In Portuguese).
  22. Glazier, R.; Creatore, M.; Weyman, J.; Fazli, G.; Matheson, F.; Gozdyra, P.; Moineddin, R.; Shriqui, V.; Booth, G. Density, destinations or both? A comparison of measures of walkability in relation to transportation behaviors, obesity and diabetes in Toronto, Canada. PLoS ONE 2014, 9, e85295. [Google Scholar] [CrossRef]
  23. Reyer, M.; Fina, S.; Siedentop, S.; Schlicht, W. Walkability is only part of the story: Walking for transportation in Stuttgart, Germany. Int. J. Environ. Res. Public Health 2014, 11, 5849–5865. [Google Scholar] [CrossRef]
  24. Koschinsky, J.; Talen, E.; Alfonzo, M.; Lee, S. How walkable is Walker’s paradise? Environ. Plan. B Urban Anal. City Sci. 2017, 44, 343–363. [Google Scholar] [CrossRef]
  25. Nogueira, A.; Santos, B.; Gonçalves, J.; Kempa, J.; Chmielewski, J. Transportation Network Spatial Analysis to Measure Pedestrian Suitability. The Case of Hilly Cities. IOP Conf. Ser. Mater. Sci. Eng. 2021, 1203, 022107. [Google Scholar] [CrossRef]
  26. Arellana, J.; Saltarín, M.; Larrañaga, A.; González, V.; Henao, C. Developing an urban bikeability index for different types of cyclists as a tool to prioritise bicycle infrastructure investments. Transp. Res. Part A Policy Pract. 2020, 139, 310–334. [Google Scholar] [CrossRef]
  27. Tran, P.; Zhao, M.; Yamamoto, K.; Minet, L.; Nguyen, T.; Balasubramanian, R. Cyclists’ personal exposure to traffic-related air pollution and its influence on bikeability. Transp. Res. D Transp. Environ. 2020, 88, 102563. [Google Scholar] [CrossRef]
  28. Schmid-Querg, J.; Keler, A.; Grigoropoulos, G. The munich bikeability index: A practical approach for measuring urban bikeability. Sustainability 2021, 13, 428. [Google Scholar] [CrossRef]
  29. Santos, B.; Passos, S.; Gonçalves, J.; Matias, I. Spatial Multi-Criteria Analysis for Road Segment Cycling Suitability Assessment. Sustainability 2022, 14, 9928. [Google Scholar] [CrossRef]
  30. Malczewski, J. GIS-based multicriteria decision analysis: A survey of the literature. Int. J. Geogr. Inf. Sci. 2006, 20, 703–726. [Google Scholar] [CrossRef]
  31. Duncan, D.; Aldstadt, J.; Whalen, J.; Melly, S.; Gortmaker, S. Validation of Walk Score® for estimating neighborhood walkability: An analysis of four US metropolitan areas. Int. J. Environ. Res. Public. Health 2011, 8, 4160–4179. [Google Scholar] [CrossRef]
  32. Motta, B. A Bikeability Index for Curitiba (Brazil). Ph.D. Thesis, University of Twente: Twente, The Netherlands, 2017. [Google Scholar]
  33. Owen, N.; Cerin, E.; Leslie, E.; duToit, L.; Coffee, N.; Frank, L.; Bauman, A.; Hugo, G.; Saelens, B.; Sallis, J. Neighborhood Walkability and the Walking Behavior of Australian Adults. Am. J. Prev. Med. 2007, 33, 387–395. [Google Scholar] [CrossRef] [PubMed]
  34. Coffee, N.; Howard, N.; Paquet, C.; Hugo, G.; Daniel, M. Is walkability associated with a lower cardiometabolic risk? Health Place. 2013, 21, 163–169. [Google Scholar] [CrossRef]
  35. Stockton, J.C.; Duke-Williams, O.; Stamatakis, E.; Mindell, J.S.; Brunner, E.J.; Shelton, N.J. Development of a novel walkability index for London, United Kingdom: Cross-sectional application to the Whitehall II Study. BMC Public Health 2016, 16, 1–12. [Google Scholar] [CrossRef]
  36. Ribeiro, A.; Hoffimann, E. Development of a neighbourhood walkability index for Porto metropolitan area. How strongly is walkability associated with walking for transport? Int. J. Environ. Res. Public Health 2018, 15, 2767. [Google Scholar] [CrossRef]
  37. Al Shammas, T.; Escobar, F. Comfort and time-based walkability index design: A GIS-based proposal. Int. J. Environ. Res. Public Health 2019, 16, 2850. [Google Scholar] [CrossRef]
  38. Frank, L.; Schmid, T.; Sallis, J.; Chapman, J.; Saelens, B. Linking objectively measured physical activity with objectively measured urban form: Findings from SMARTRAQ. Am. J. Prev. Med. 2005, 28, 117–125. [Google Scholar] [CrossRef]
  39. Park, S.; Deakin, E.; Lee, J. Perception-based walkability index to test impact of microlevel walkability on sustainable mode choice decisions. Transp. Res. Rec. 2014, 2464, 126–134. [Google Scholar] [CrossRef]
  40. Habibian, M.; Hosseinzadeh, A. Walkability index across trip purposes. Sustain. Cities Soc. 2018, 42, 216–225. [Google Scholar] [CrossRef]
  41. Jeong, I.; Choi, M.; Kwak, J.; Ku, D.; Lee, S. A comprehensive walkability evaluation system for promoting environmental benefits. Sci. Rep. 2023, 13, 1–23. [Google Scholar] [CrossRef] [PubMed]
  42. Glazier, R.; Weyman, J.; Creatore, M.; Gozdyra, P.; Moineddin, R.; Matheson, F.; Dunn, J.; Booth, G. Development and Validation of an Urban Walkability Index for Toronto, Canada, Toronto, Canada. 2012. Available online: https://www.torontohealthprofiles.ca/a_documents/aboutTheData/12_2_AboutTheData_Walkability_WKB_2006-2008.pdf (accessed on 19 September 2020).
  43. Leslie, E.; Coffee, N.; Frank, L.; Owen, N.; Bauman, A.; Hugo, G. Walkability of local communities: Using geographic information systems to objectively assess relevant environmental attributes. Health Place 2007, 13, 111–122. [Google Scholar] [CrossRef] [PubMed]
  44. Ostensen, A. The Bicycle Compatibility Index: A level of Service Concept, Implementation Manual (FHWA-RD-98-095), USA. 1998. Available online: https://safety.fhwa.dot.gov/tools/docs/bci.pdf (accessed on 19 September 2020).
  45. Urrego, N.; Páez, D.; Guzmán, V. Cali Bikeability Index Map: A Tool for Evaluating Public Investment and Future Needs, Engineering Department, Universidad de Los Andes, Colombia. 2014. Available online: http://hdl.handle.net/1992/19831 (accessed on 30 June 2022).
  46. Krenn, P.; Oja, P.; Titze, S. Development of a Bikeability Index to Assess the Bicycle-Friendliness of Urban Environments. Open J. Civ. Eng. 2015, 5, 451–459. [Google Scholar] [CrossRef]
  47. Chevalier, A.; Xu, L. On the Applicability of a Western Bikeability Index in the Chinese Context. Int. Rev. Spat. Plan. Sustain. Dev. 2020, 8, 59–93. [Google Scholar] [CrossRef]
  48. Dai, S.; Zhao, W.; Wang, Y.; Huang, X.; Chen, Z.; Lei, J. Assessing spatiotemporal bikeability using multi-source geospatial big data: A case study of Xiamen, China. Int. J. Appl. Earth Obs. Geoinf. 2023, 125, 103539. [Google Scholar] [CrossRef]
  49. Werner, C.; Van der Meer, L.; Kaziyeva, D.; Stutz, P.; Wendel, R.; Loidl, M. Bikeability of road segments: An open, adjustable and extendible model. J. Cycl. Micromobility Res. 2024, 2, 100040. [Google Scholar] [CrossRef]
  50. ESRI. Use ModelBuilder. Available online: https://pro.arcgis.com/en/pro-app/latest/help/analysis/geoprocessing/modelbuilder/modelbuilder-quick-tour.htm (accessed on 19 September 2020).
  51. Leite, M.; Ferreira, J. Application of GIS in Public Transportation. In Proceedings of the 7th VCT (Virtual Cities and Territories), Lisboa, Portugal, 11–13 October 2011; pp. 439–446. Available online: https://e-geo.fcsh.unl.pt/sites/default/files/dl/artigos/JF_Paper_Ferreira_Jorge&Leite_Ines_FinalVersion.pdf (accessed on 19 September 2020).
  52. King, G. A Spatial Framework Supports Road Investment Decisions, Esri. 2016. Available online: https://www.esri.com/about/newsroom/wp-content/uploads/2018/09/a-spatial-framework-supports-road-investment-decisions.pdf?srsltid=AfmBOoplyhjBwA0OCzQE86h2sRXLeQj9r8-hbgDdIp4YPkRyQkE-IUwr (accessed on 19 September 2020).
  53. Perera, P.; Hewage, K.; Sadiq, R. Electric vehicle recharging infrastructure planning and management in urban communities. J. Clean. Prod. 2020, 250, 119559. [Google Scholar] [CrossRef]
  54. Möller, B.; Nielsen, P. Analysing transport costs of Danish forest wood chip resources by means of continuous cost surfaces. Biomass Bioenergy 2007, 31, 291–298. [Google Scholar] [CrossRef]
  55. Benenson, I.; Martens, K.; Rofé, Y. Measuring the gap between car and transit accessibility: Estimating access using a high-resolution transit network geographic information system. Transp. Res. Rec. 2010, 2144, 28–35. [Google Scholar] [CrossRef]
  56. Papa, E.; Carpentieri, G.; Guida, C. Measuring walking accessibility to public transport of the elderly: The case of Naples. J. Land Use Mobil. Environ. 2018, 17, 105–116. [Google Scholar] [CrossRef]
  57. Wu, H.; Tseng, M. Evaluating disparities in elderly community care resources: Using a geographic accessibility and inequality index. Int. J. Environ. Res. Public Health 2018, 15, 1353. [Google Scholar] [CrossRef] [PubMed]
  58. Wolny, A.; Ogryzek, M.; Źróbek, R. Towards sustainable development and preventing exclusions-determining road accessibility at the sub-regional and local level in rural areas of Poland. Sustainability 2019, 11, 4880. [Google Scholar] [CrossRef]
  59. Nadi, P.; Murad, A. Modelling sustainable urban transport performance in the Jakarta city Region: A GIS approach. Sustainability 2019, 11, 1879. [Google Scholar] [CrossRef]
  60. Ma, C.; Zhang, Y. Effect of terrain relief on the transport cost on road of biomass raw materials: Energy conservation study of 9 cities and counties in China. J. Environ. Manag. 2020, 274, 111212. [Google Scholar] [CrossRef]
  61. Irtenkauf, E. Analyzing Tobler’s Hiking Function and Naismith’s Rule Using Crowd-Sourced GPS Data. Pennsylvania State University, USA. 2014. Available online: https://handbook.geospatial.psu.edu/sites/default/files/capstone/Irtenkauf_596B_20140430.docx (accessed on 19 September 2020).
  62. Fruin, G.; Strakosch, J. Pedestrian, Planning and Design; Elevator World: Mobile, AL, USA, 1987. [Google Scholar]
  63. Flügel, S.; Hulleberg, N.; Fyhri, A.; Weber, C.; Ævarsson, G. Empirical speed models for cycling in the Oslo road network. Transportation 2019, 46, 1395–1419. [Google Scholar] [CrossRef]
Figure 1. Methodology for the assessment of road network suitability for active mobility.
Urbansci 08 00206 g001
Figure 2. Tool 1—Diagram of the model (blue boxes for input data, input value, or derived value; green for derived data; and yellow for tool) and user interface created with the Model Builder.
Urbansci 08 00206 g002
Figure 3. Tool 2—Diagram of the model (blue boxes for input data, input value, or derived value; green for derived data; and yellow for tool) and extract of the interface created using Model Builder.
Urbansci 08 00206 g003
Figure 4. Uphill electric bicycle segment speed.
Urbansci 08 00206 g004
Figure 5. Electric bicycle service areas based on travel time for educational facilities.
Urbansci 08 00206 g005
Figure 6. Values of the trip-generation point variable for the combination of all facilities.
Urbansci 08 00206 g006
Figure 7. Values of the population density variable (normalized values).
Urbansci 08 00206 g007
Figure 8. Walkability index for Covilhã’s road and pedestrian network.
Urbansci 08 00206 g008
Figure 9. Bikeability index for Covilhã’s road network.
Urbansci 08 00206 g009
Figure 10. e-Bikeability index for Covilhã’s road network.
Urbansci 08 00206 g010
Figure 11. Active mobility index for Covilhã’s road and pedestrian network.
Urbansci 08 00206 g011
Table 3. Literature review on ArcGIS Model Builder in transport studies.
Citation
Year
StudyCase StudyModel Builder FunctionNetwork Analyst Extension UseModel Builder Tool-Based
[54]
2007
Cost map for woody biomass transportDenmarkIntermediate processesNoNo
[55]
2010
Transit- and car-based accessibilityTel Aviv,
Israel
ModelYesYes
[51]
2011
Supply and demand for public transportAlmada,
Portugal
ModelYesNo
[52]
2016
Economic impacts of unplanned road closuresQueensland,
Australia
ModelYesNo
[56]
2018
Walking accessibility to public transportNaples,
Italy
Intermediate processesYesNo
[57]
2018
Elderly community center accessibilityTaiwanModelYesNo
[58]
2019
Road accessibility in rural areasWarmia and Mazury, PolandIntermediate processesYesNo
[37]
2019
Walkability indexMadrid,
Spain
Intermediate processesNoNo
[59]
2019
Sustainable urban transport performanceJakarta,
Indonesia
Intermediate processesNoNo
[53]
2020
Planning and management of vehicle recharging infrastructureKelowna,
Canada
ModelYesNo
[60]
2020
Effect of terrain relief on transport cost9 Chinese citiesIntermediate processesNoNo
Table 4. Service area scores and sub-criteria weights (facility category).
Trip-Generation Point Service AreasTrip-Generation Point Sub-Variables
Travel Time (Minutes)Score
(0–100)
Facility CategoryWeight for Walk Mode
Weight for Walk Mode
[25]
Weight for Bike Mode (Conventional and Electric)
[29]
0–5100Transportation0.710.69
5–1075Health0.680.70
10–1550Educational0.750.79
15–2025Services0.620.68
+201Commercial0.630.71
Tourism0.600.80
Culture0.540.73
Recreation0.650.82
Sport0.580.78
Table 5. Summary of results.
Suitability
IndexNetwork LengthNot
Suitable
Very LowLowReasonableHighVery High
Walkabilitykm0286.9547.8451.6212.060.06
%072.0012.0012.953.030.01
Bikeabilitykm173.1065.0255.3857.4245.540.32
%43.6216.3913.9614.4711.480.08
e-Bikeabilitykm77.6780.1476.6881.3380.280.68
%19.5720.2019.3220.5020.230.18
Active Mobility 1 (walk + bike)km0241.0699.6639.8716.020.16
%060.7525.1210.054.040.04
Active Mobility 2 (walk + e-bike)km0178.77124.6061.4831.770.16
%045.0631.4015.498.010.05
Disclaimer/Publisher’s Note: The statements, opinions and data contained in all publications are solely those of the individual author(s) and contributor(s) and not of MDPI and/or the editor(s). MDPI and/or the editor(s) disclaim responsibility for any injury to people or property resulting from any ideas, methods, instructions or products referred to in the content.

