
Fractal Dimension Warning via Microseismic Time–Energy Data During Rock Mass Failure


Abstract
1. Introduction
2. Engineering Background and Microseismic Monitoring
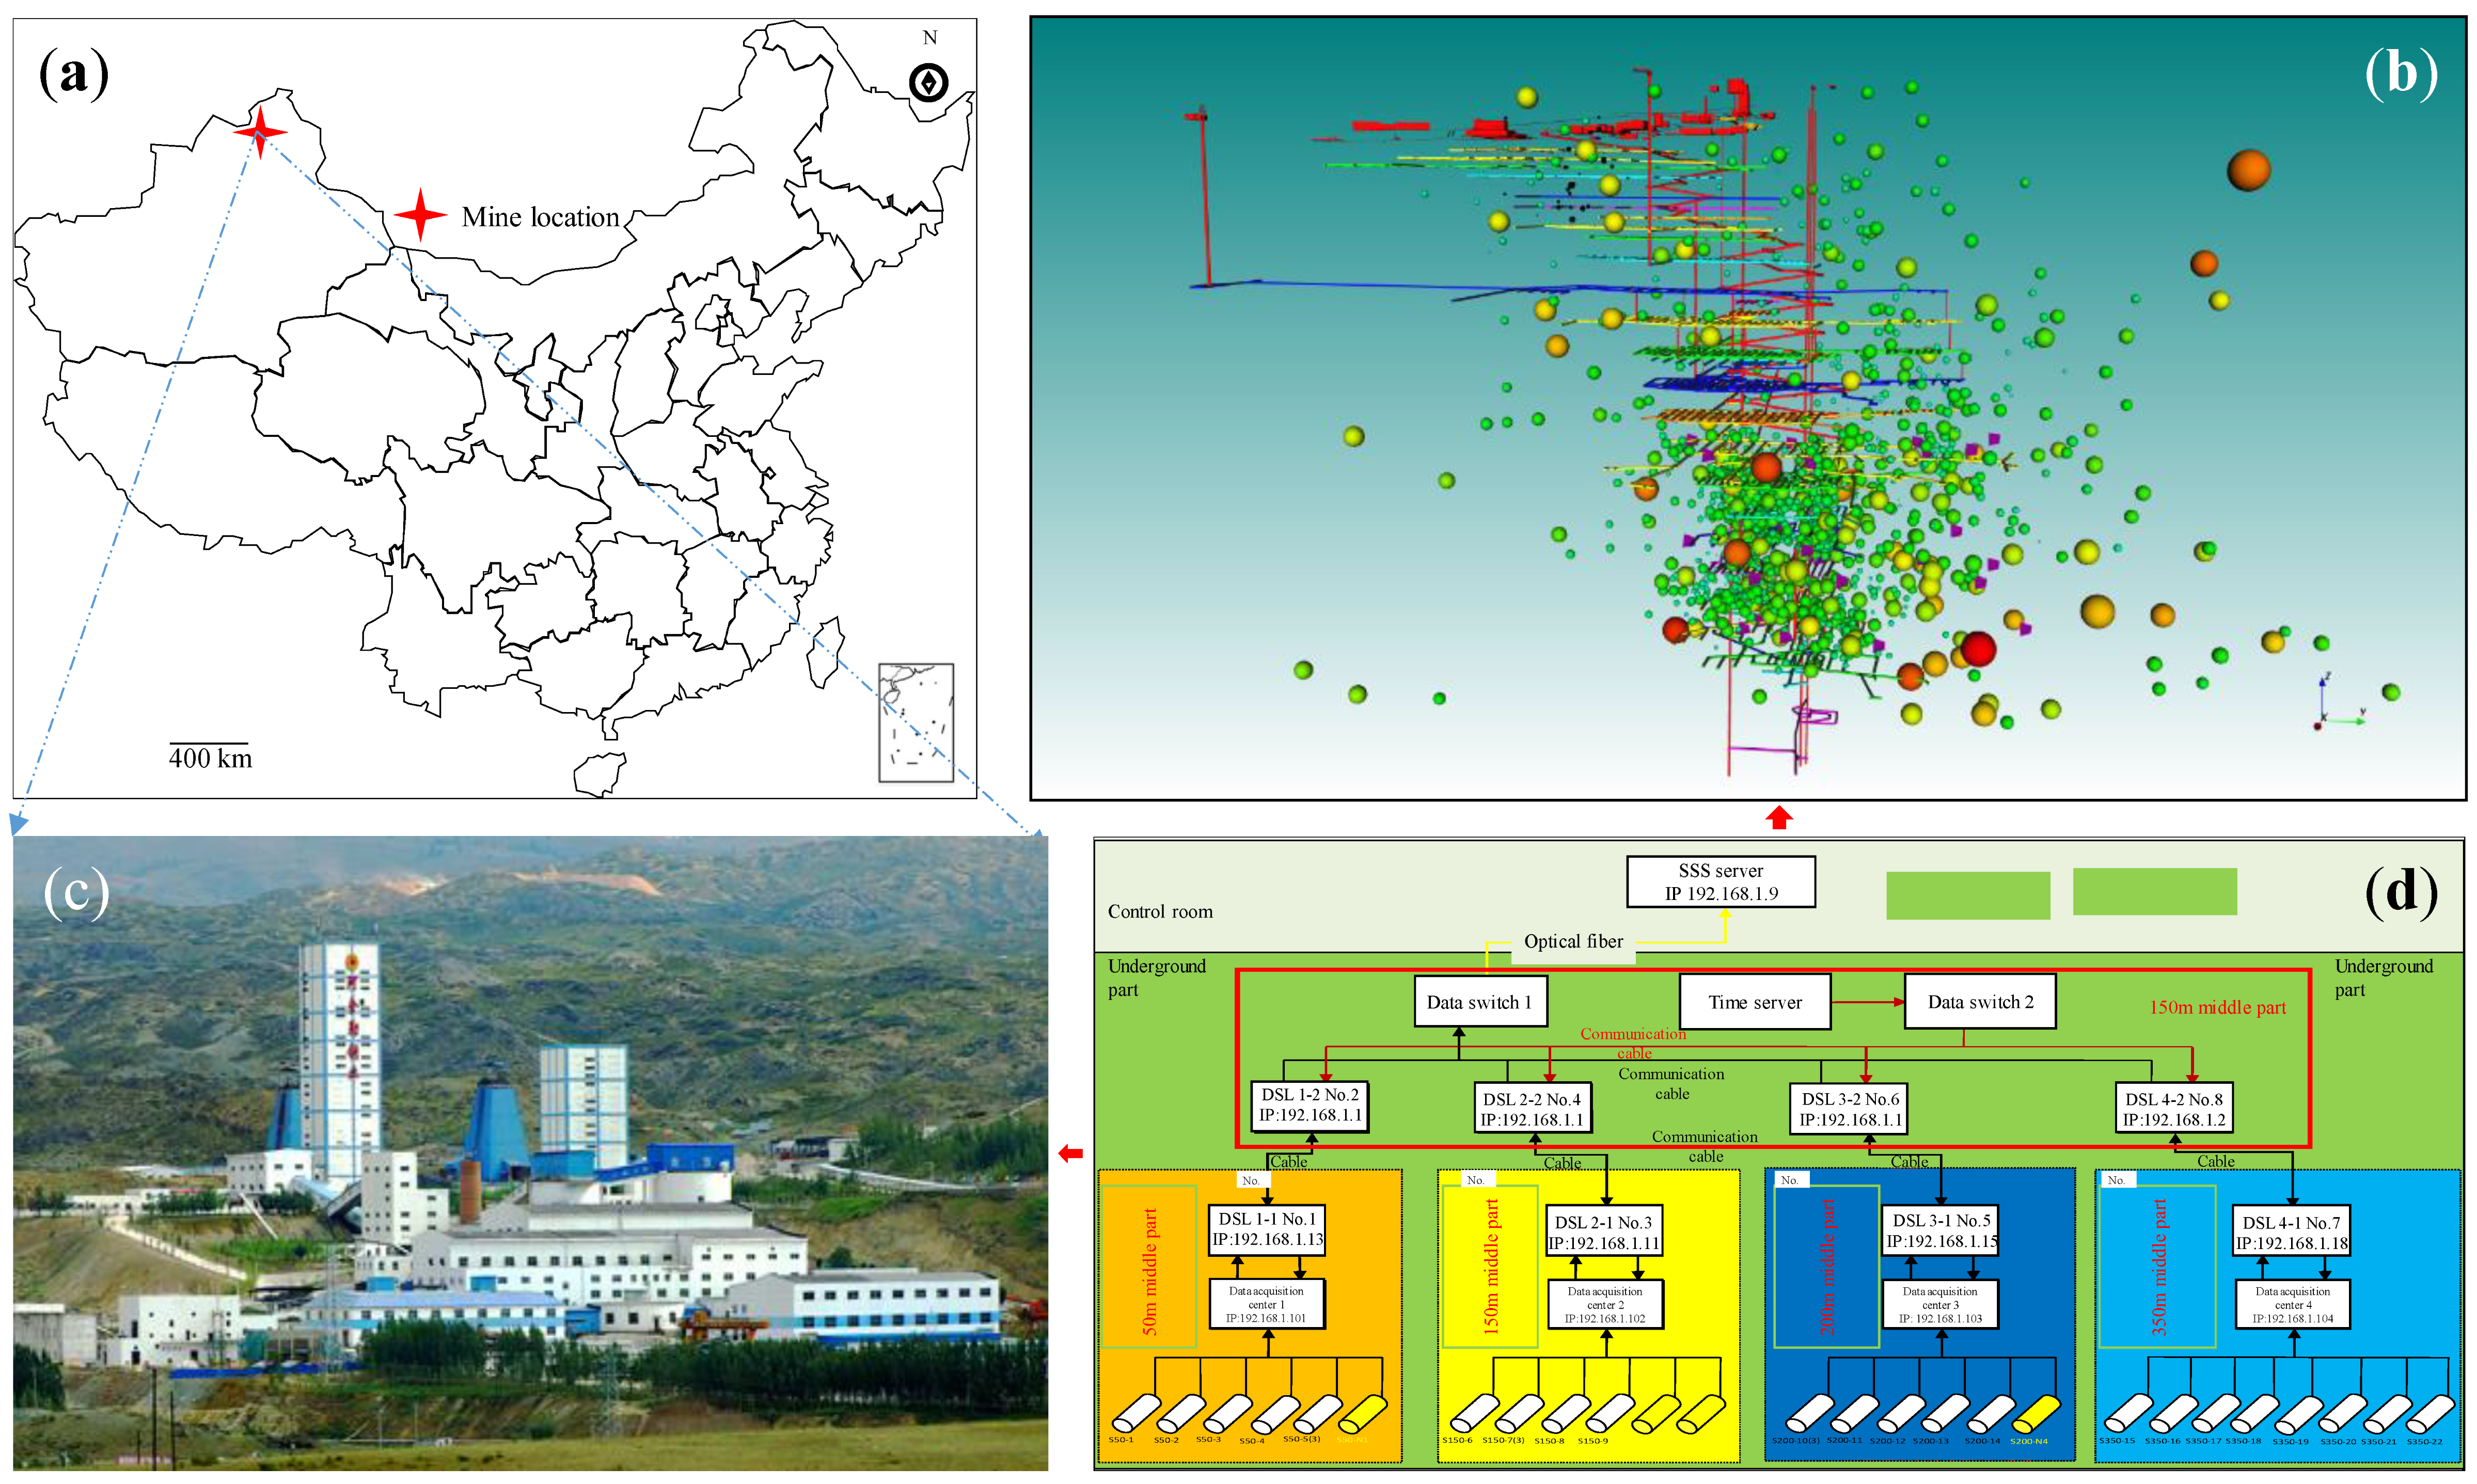
2.1. Engineering Background
2.2. Microseismic Monitoring and Experimental Methods
- (1)
- Experimental background:
- (2)
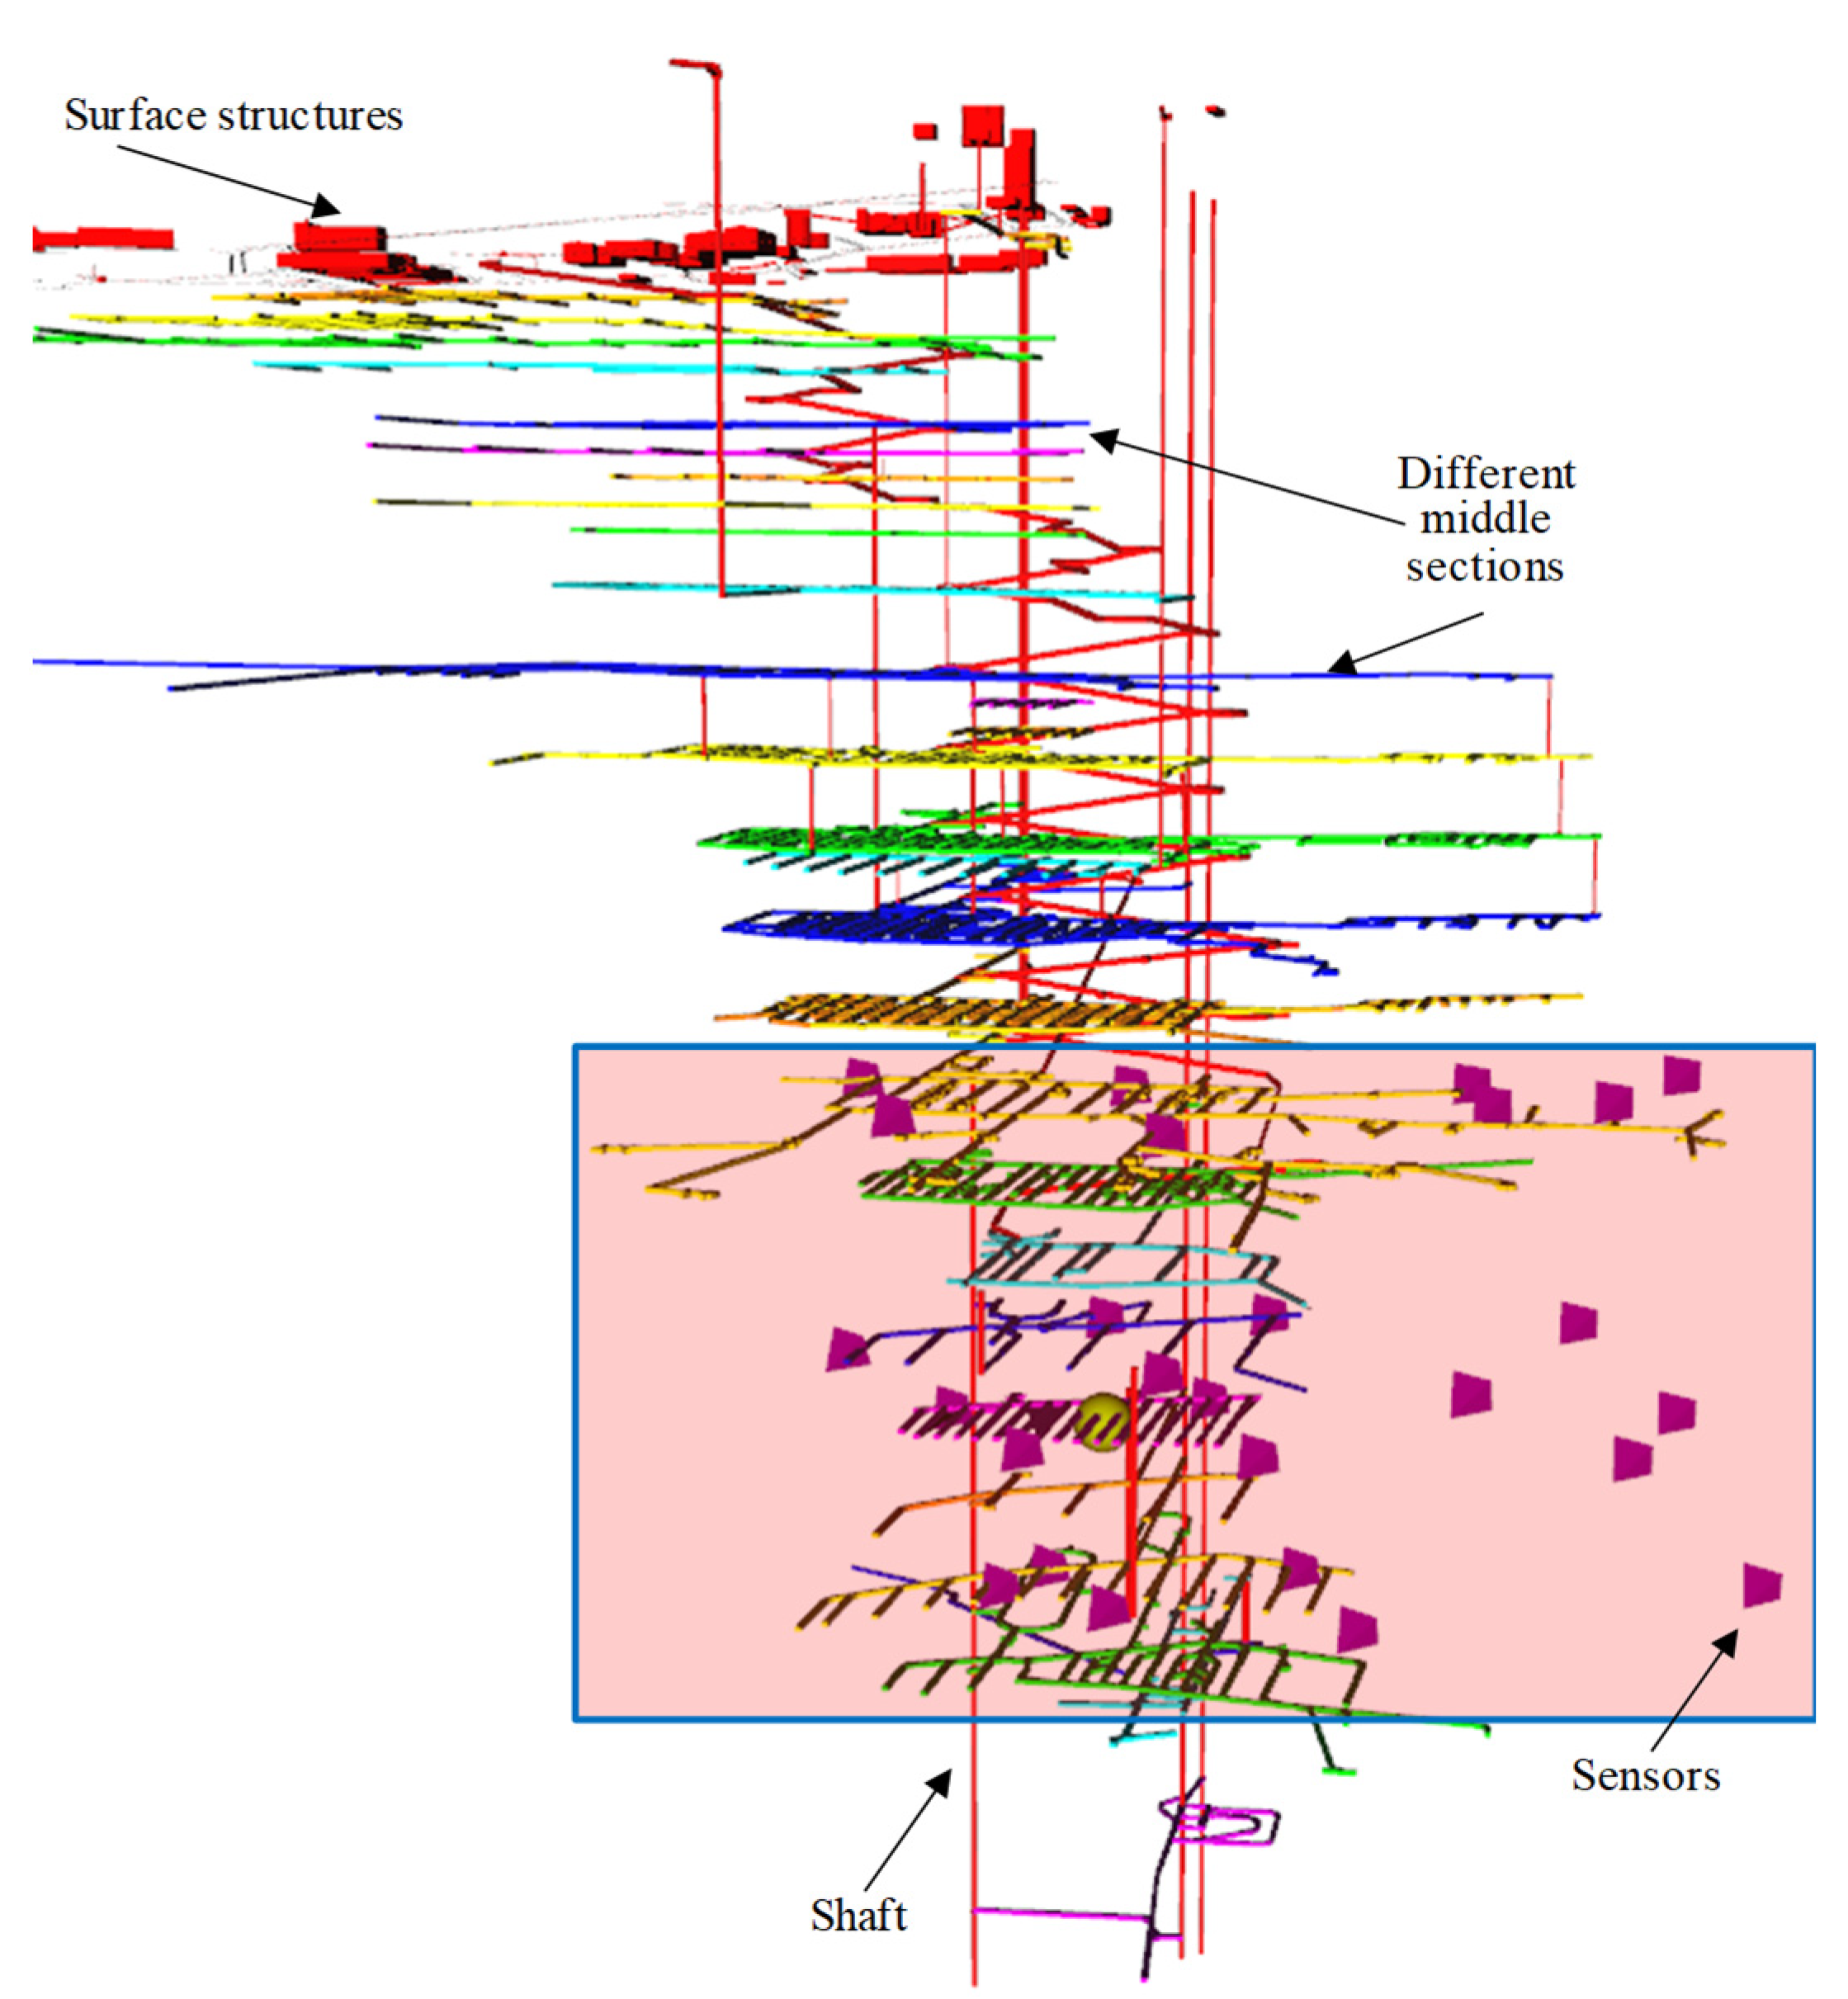
- Sensor layout
- (3)
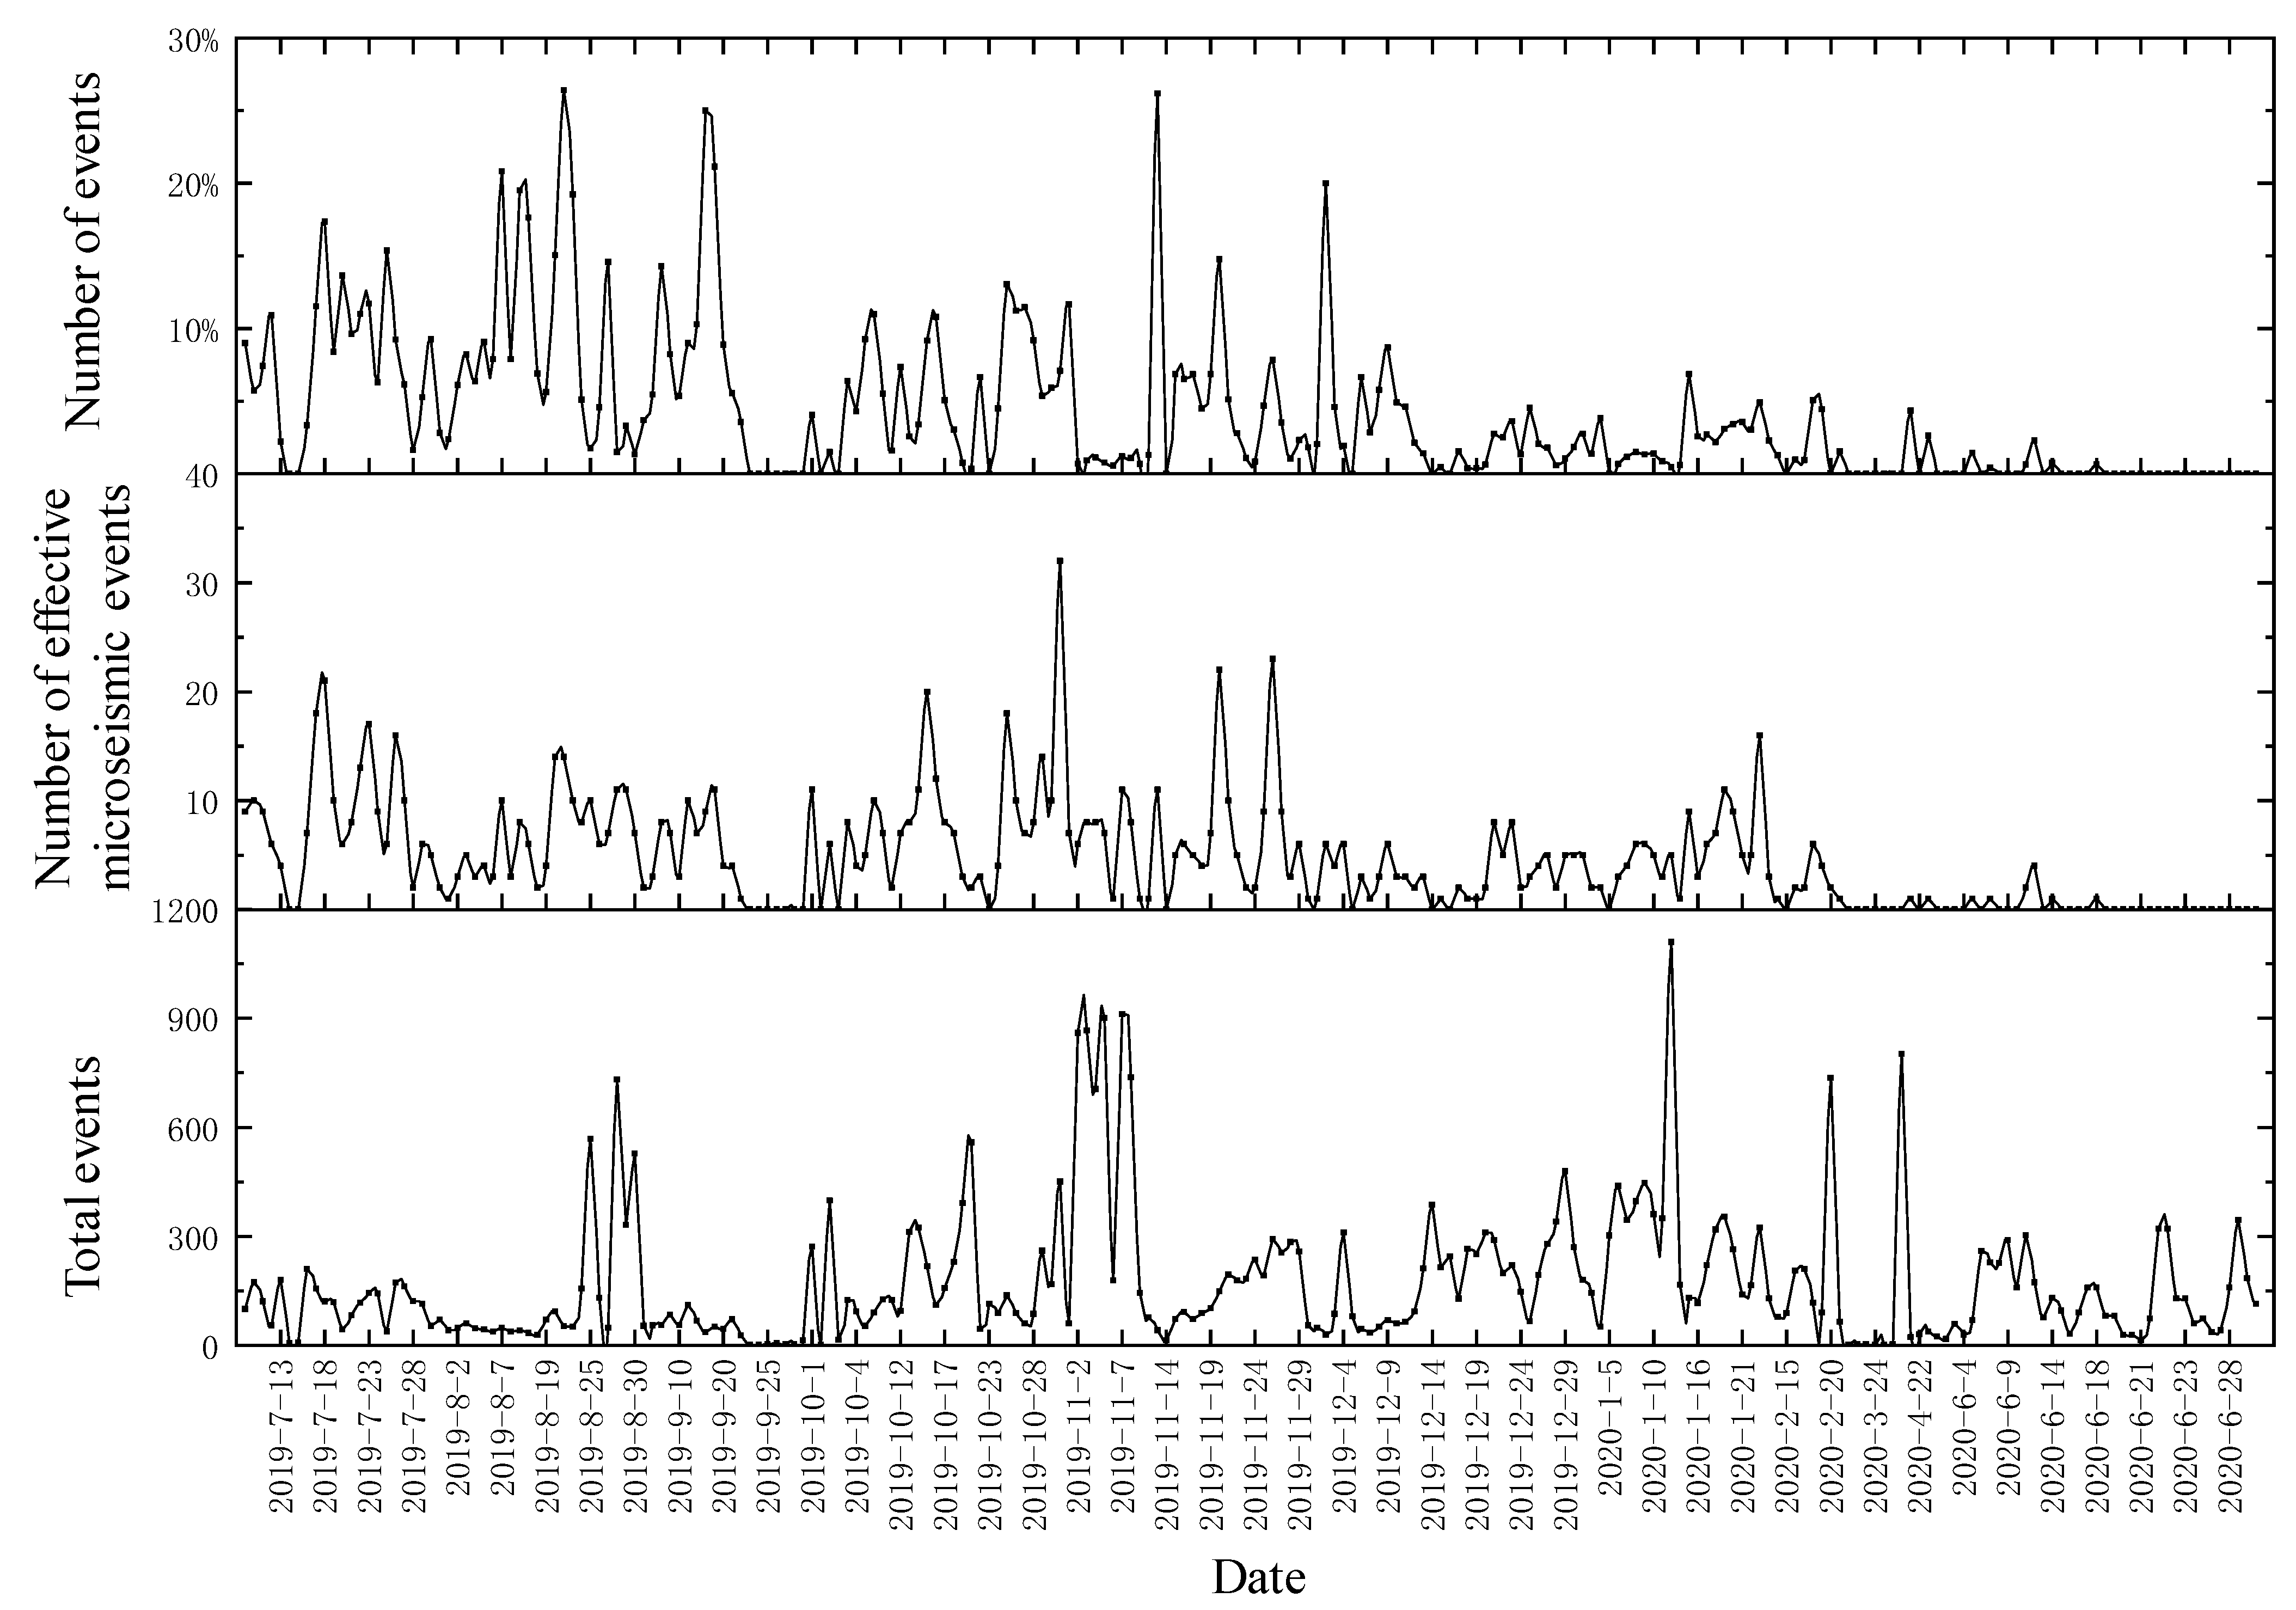
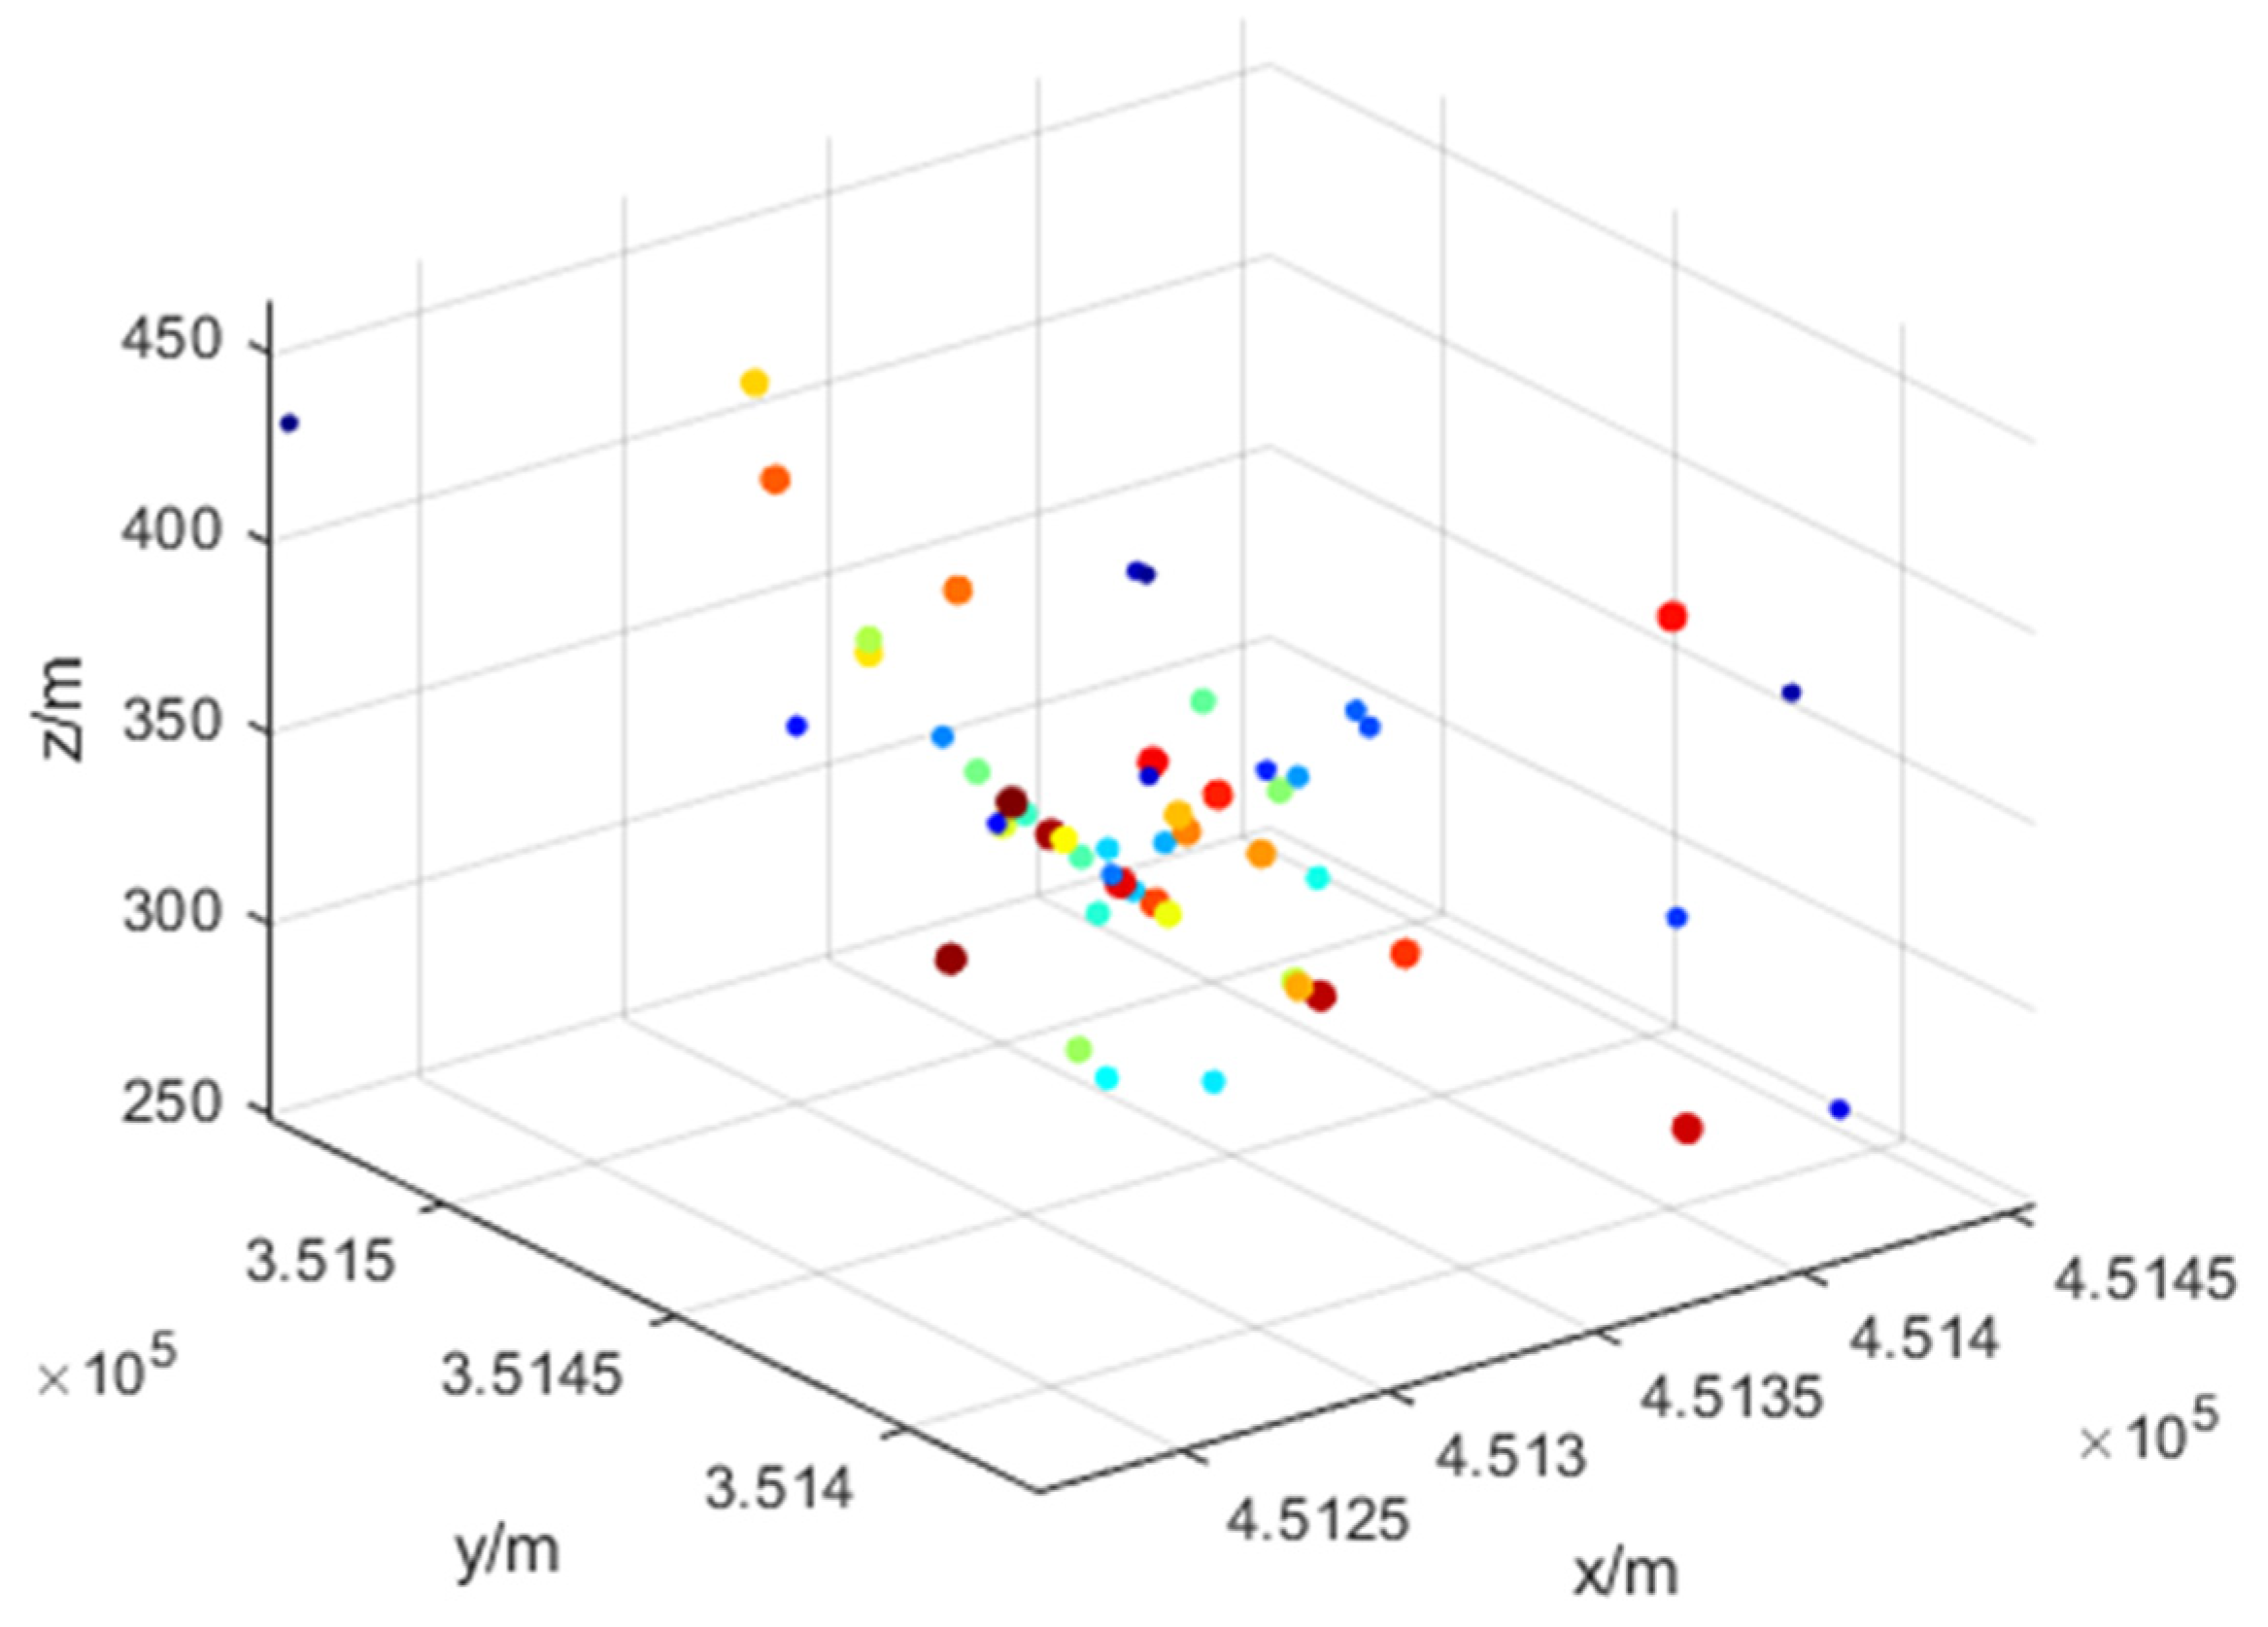
- Overall distribution characteristics of microseismic events
- (4)
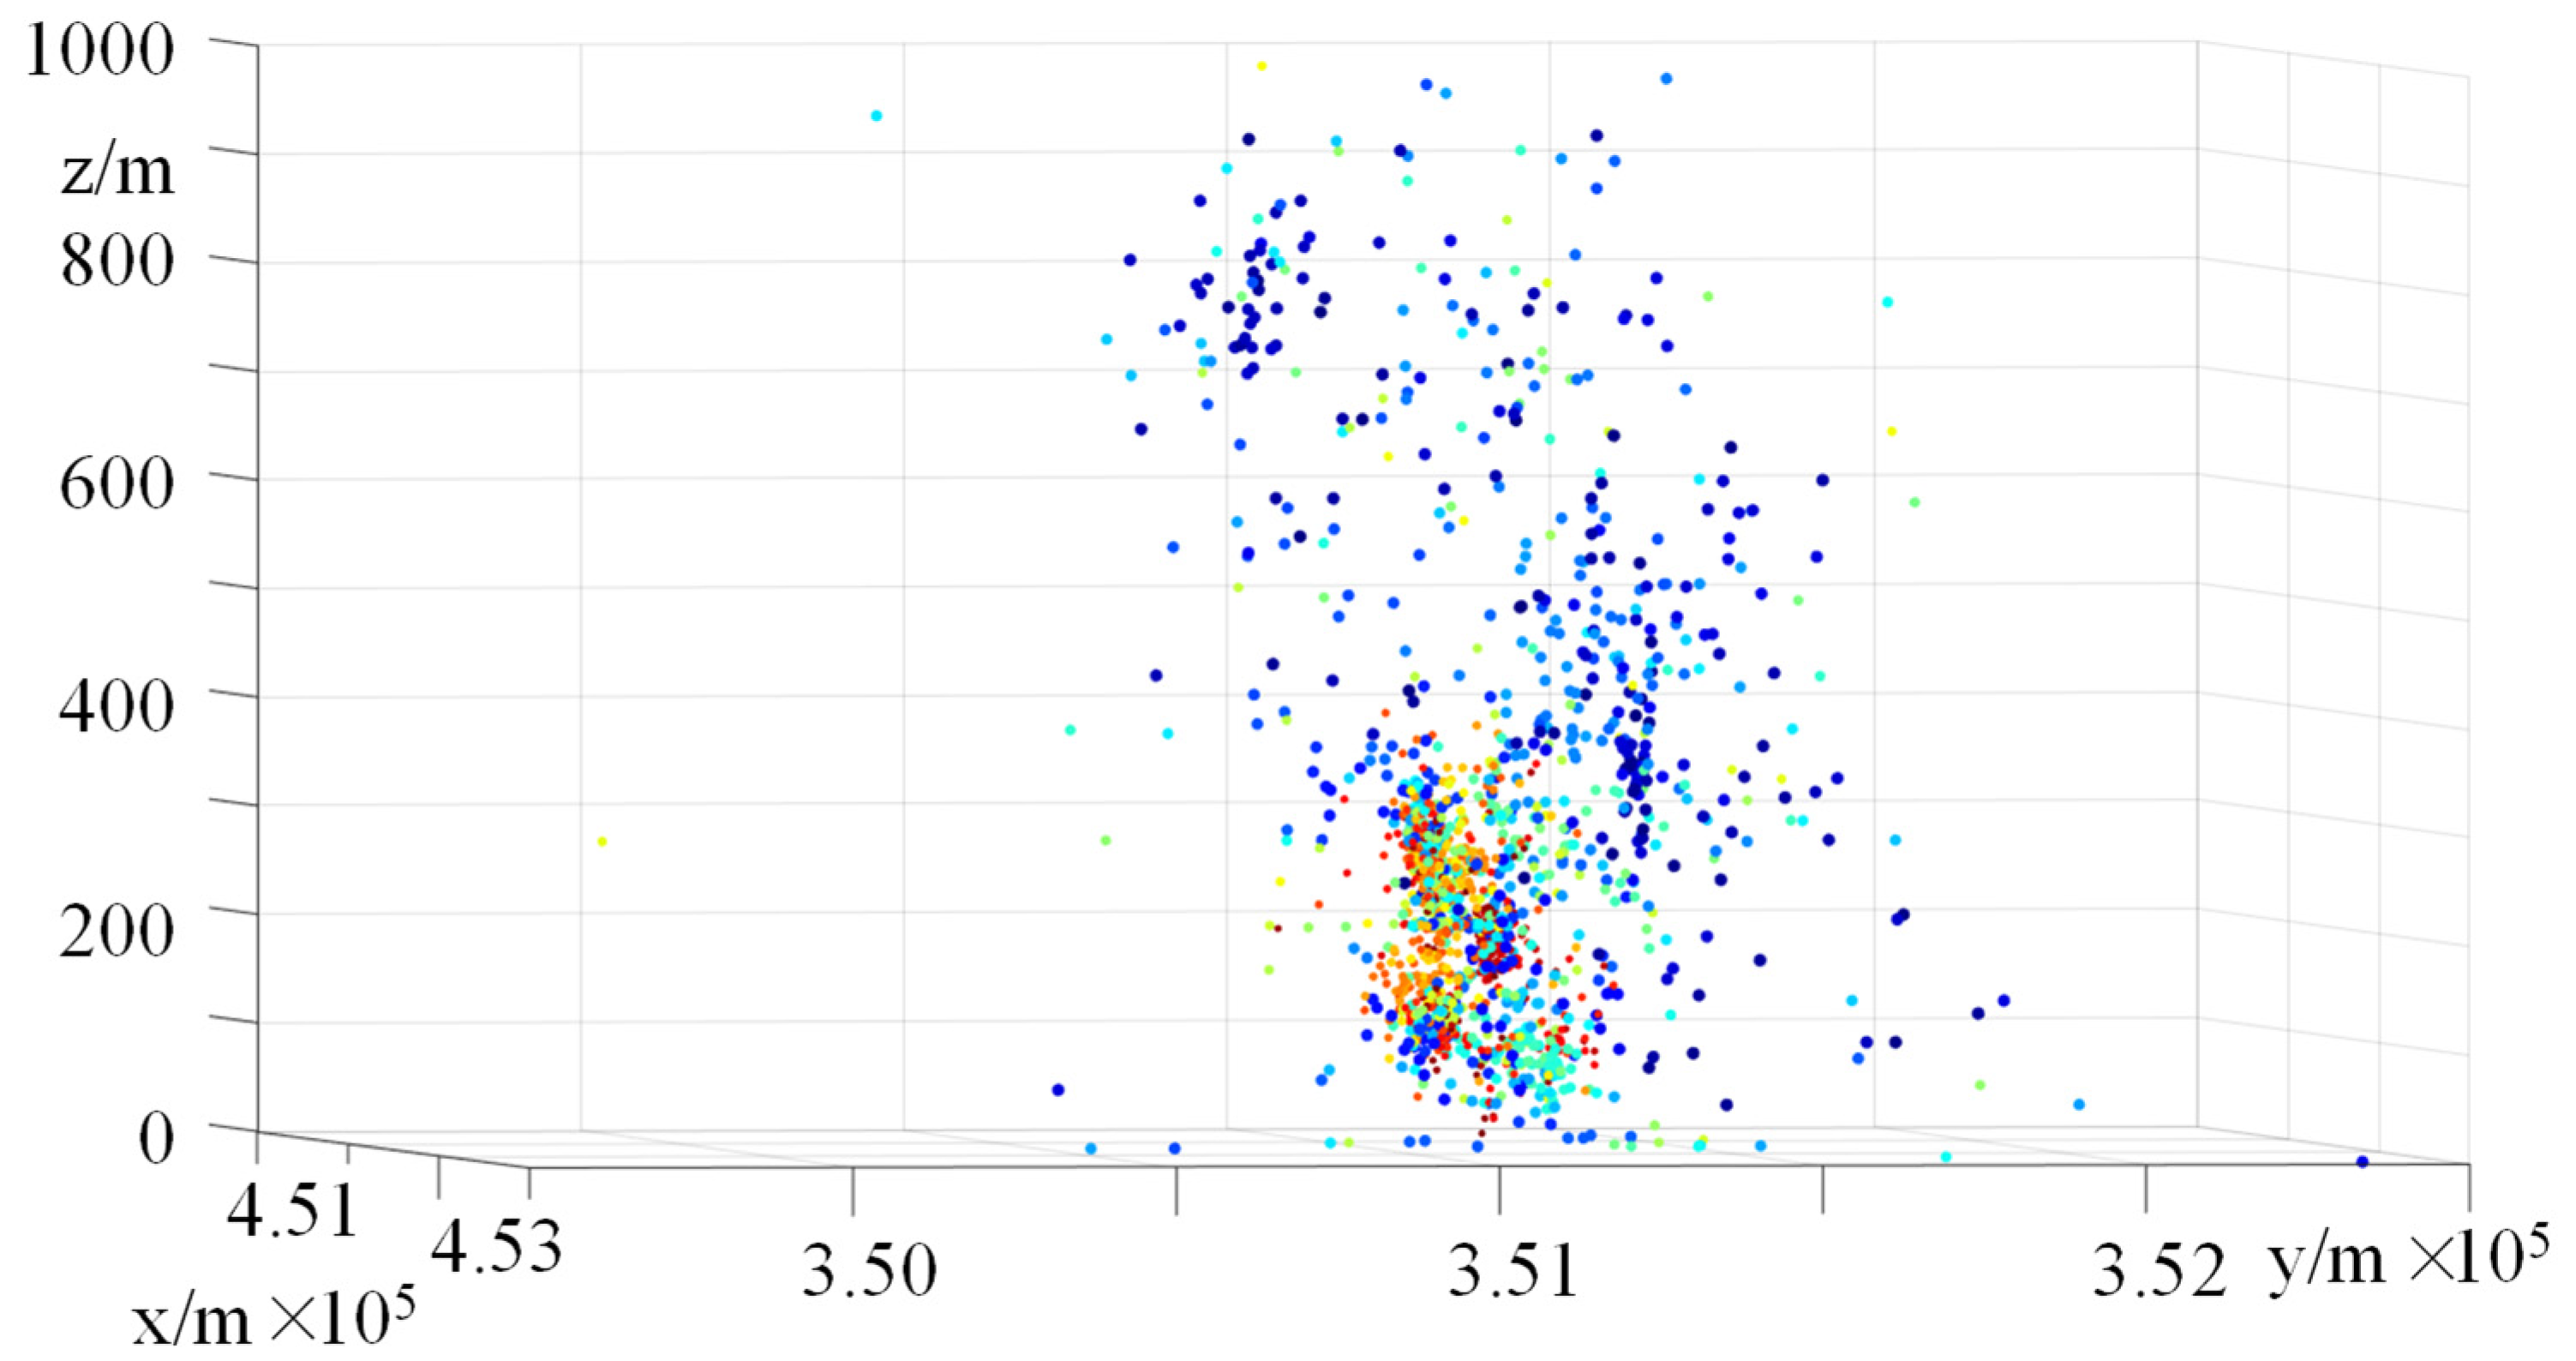
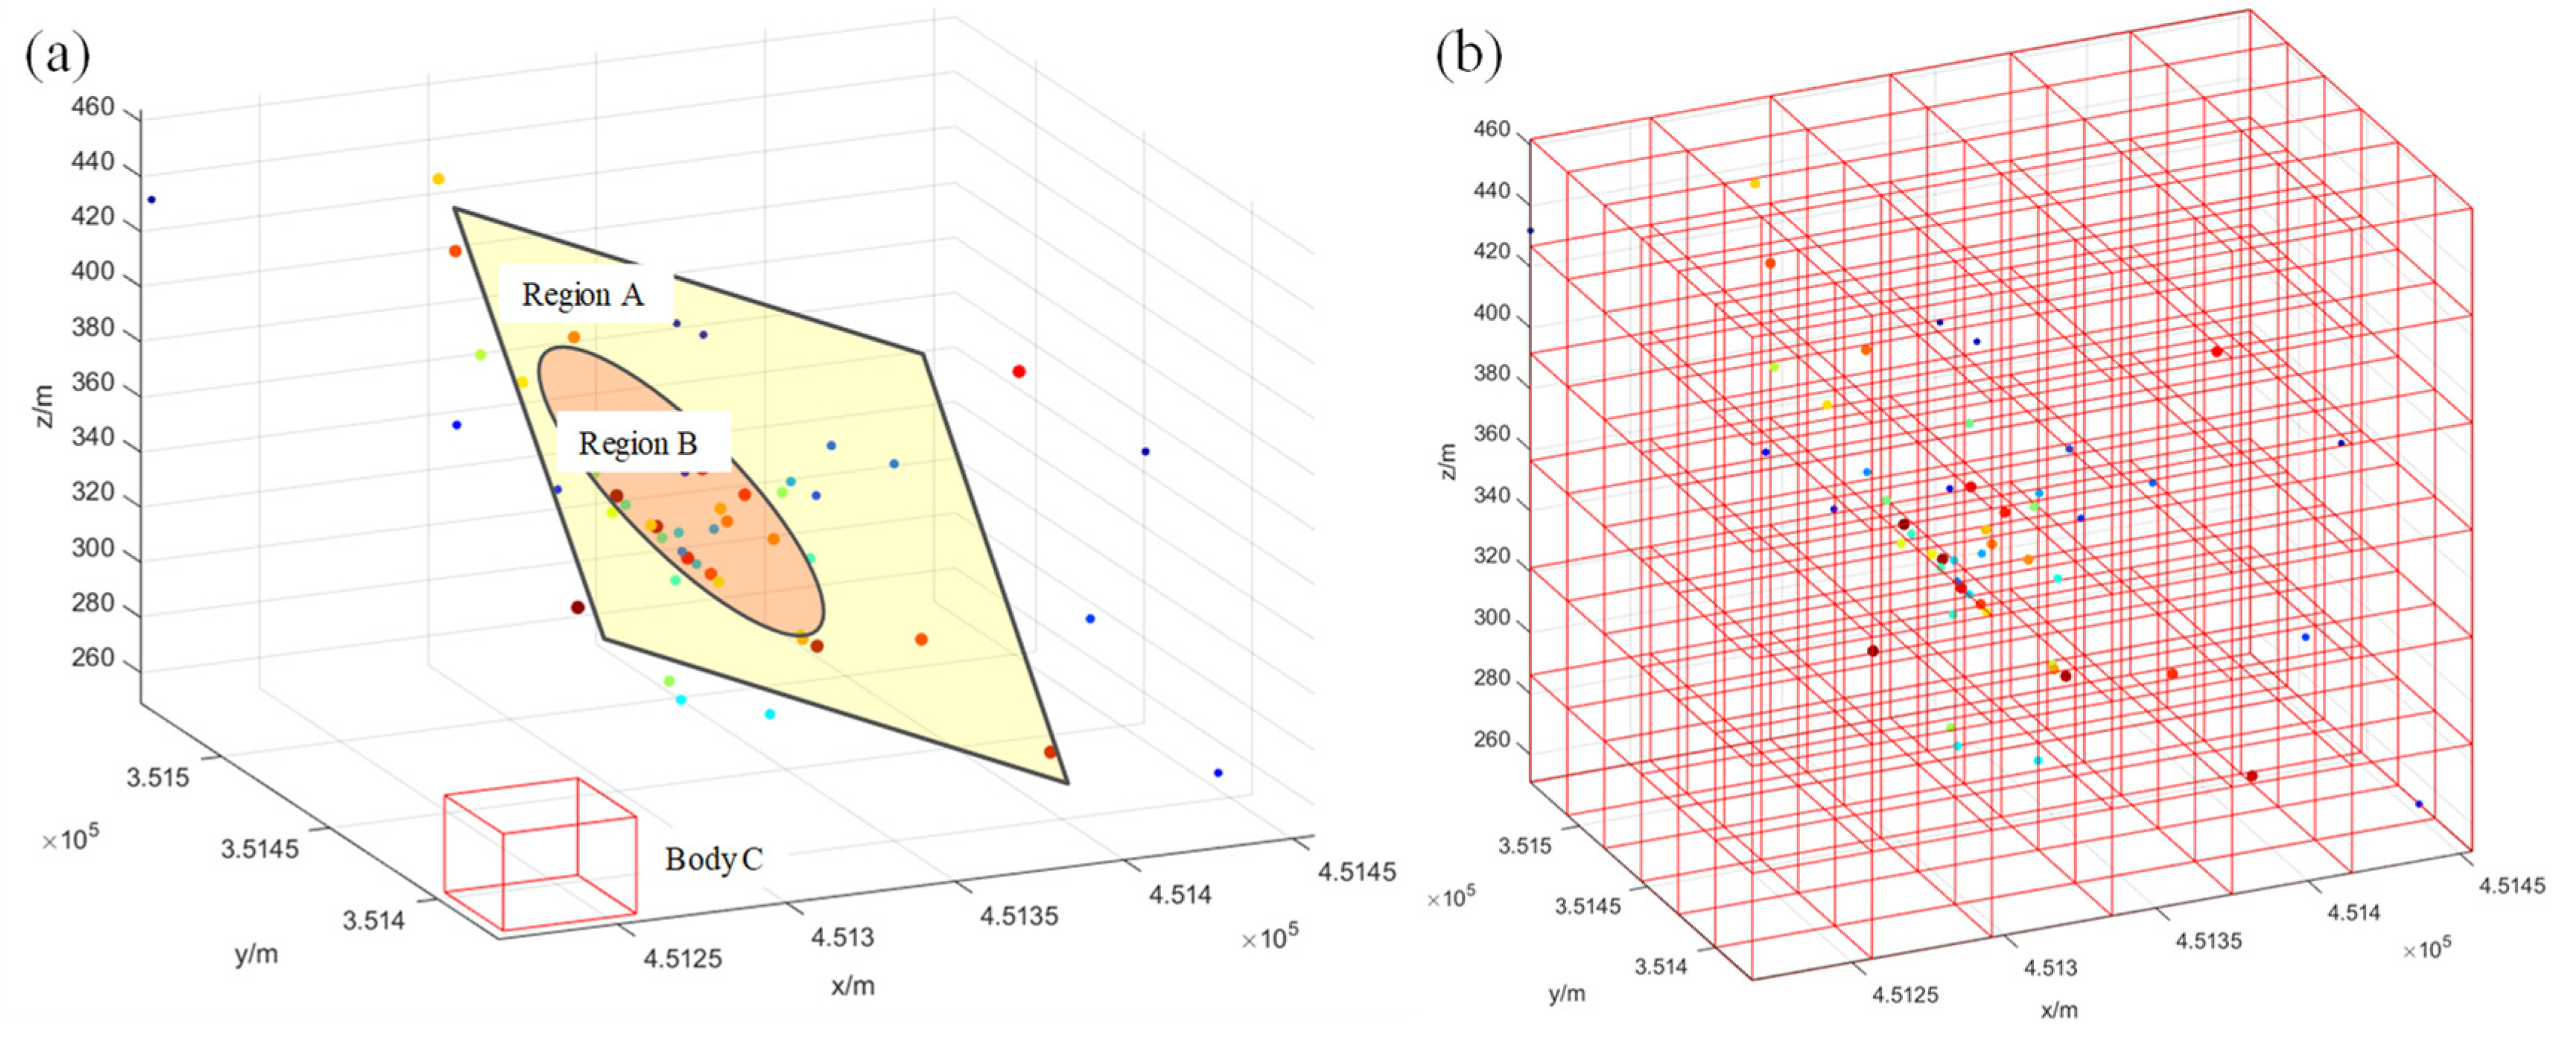
- Extraction and spatial distribution of effective rock fracture events
3. Early Warning Methods for Microseismic Events’ Time and Energy
3.1. Fundamental Principles of Time–Energy Fractal Warning
3.2. Key Procedures for Time–Energy Fractal Warning Implementation
4. Interpretation and Analysis of Results of Time Dimension Data
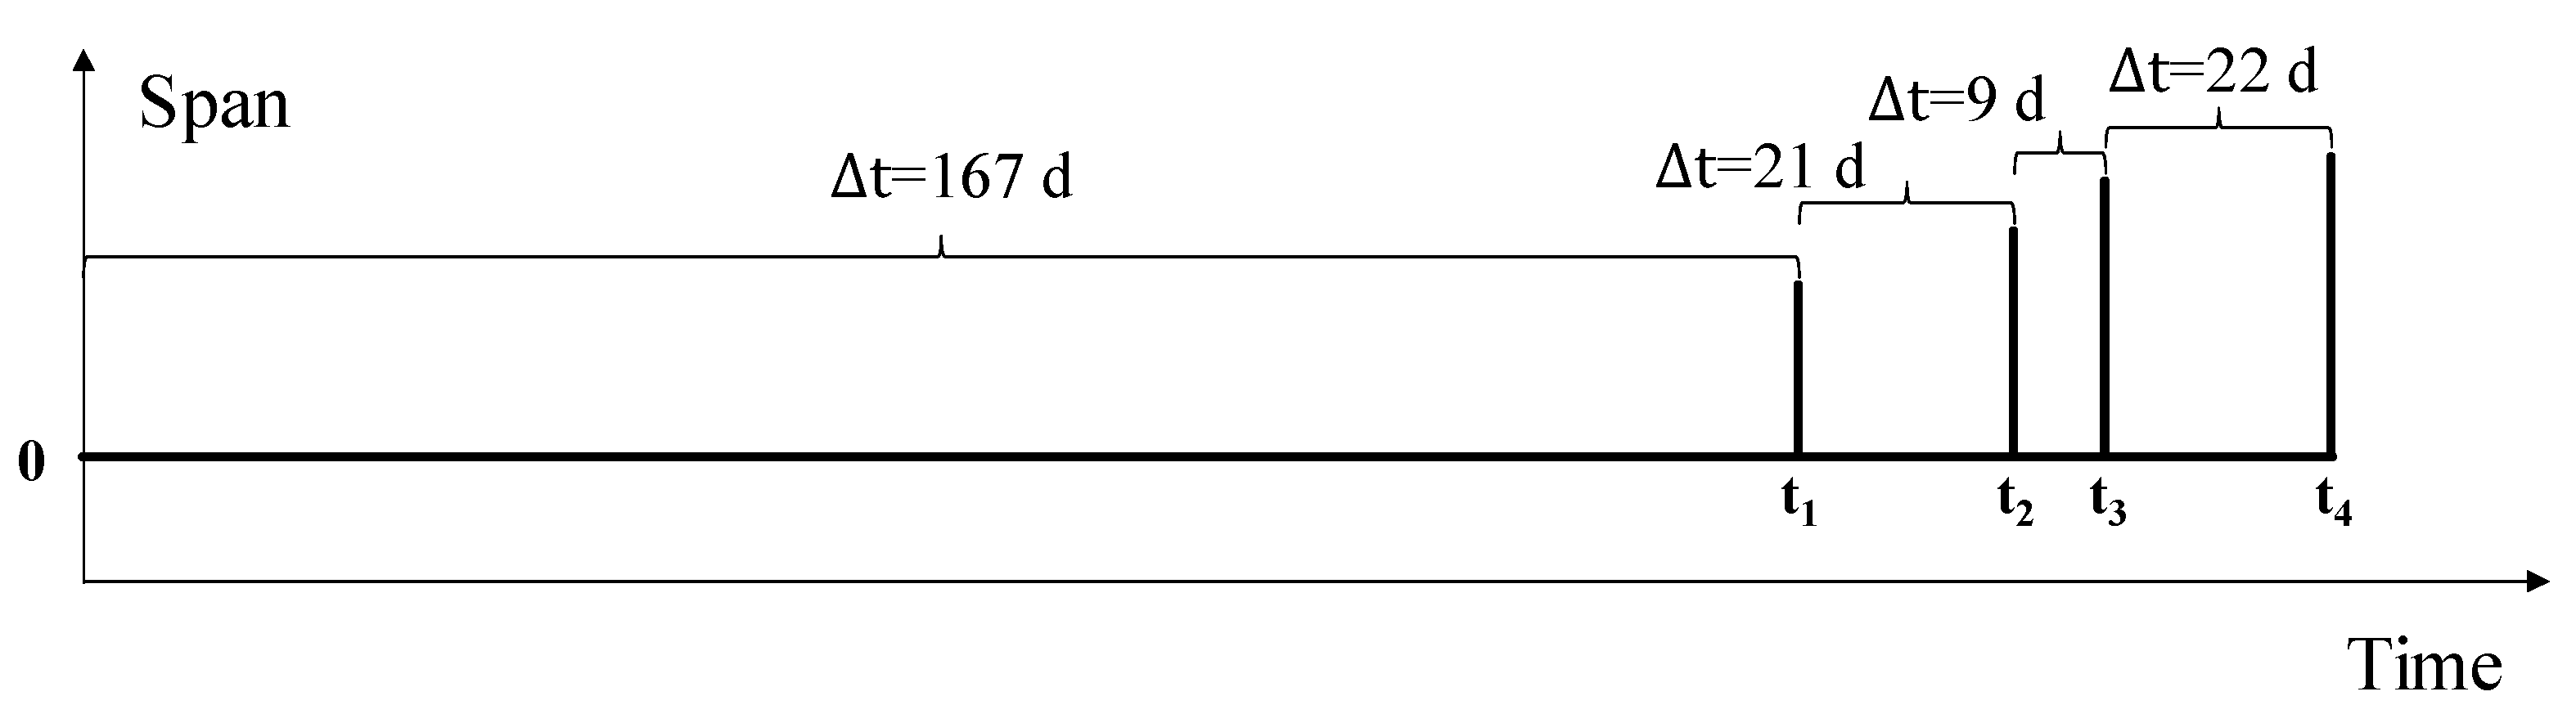
4.1. Data Background
4.2. Time Dimension Early Warning Process
4.3. Time Dimension Warning Results
5. Discussion
6. Conclusions
- (1)
- Engineering background and data preprocessing: We summarized the intrinsic relationship between microseismic monitoring in mining sites and the stability of development production structures, clarified the actual engineering background and overview, identified and selected basic data, key elements, fractal data source sets, and proposed theories and methods.
- (2)
- Design of warning methods for the destruction of temporal energy elements: Based on the demand and activity analysis of the mining site, the macroscopic stability distribution characteristics of the rock mass structure in the mine were mastered. Combining existing data sets, time and energy elements were extracted, and fractal theory and fractal dimensions were used to interpret the fractal field for regional early warning. A practical early warning model was established, which was optimized and upgraded, forming a systematic method and system.
- (3)
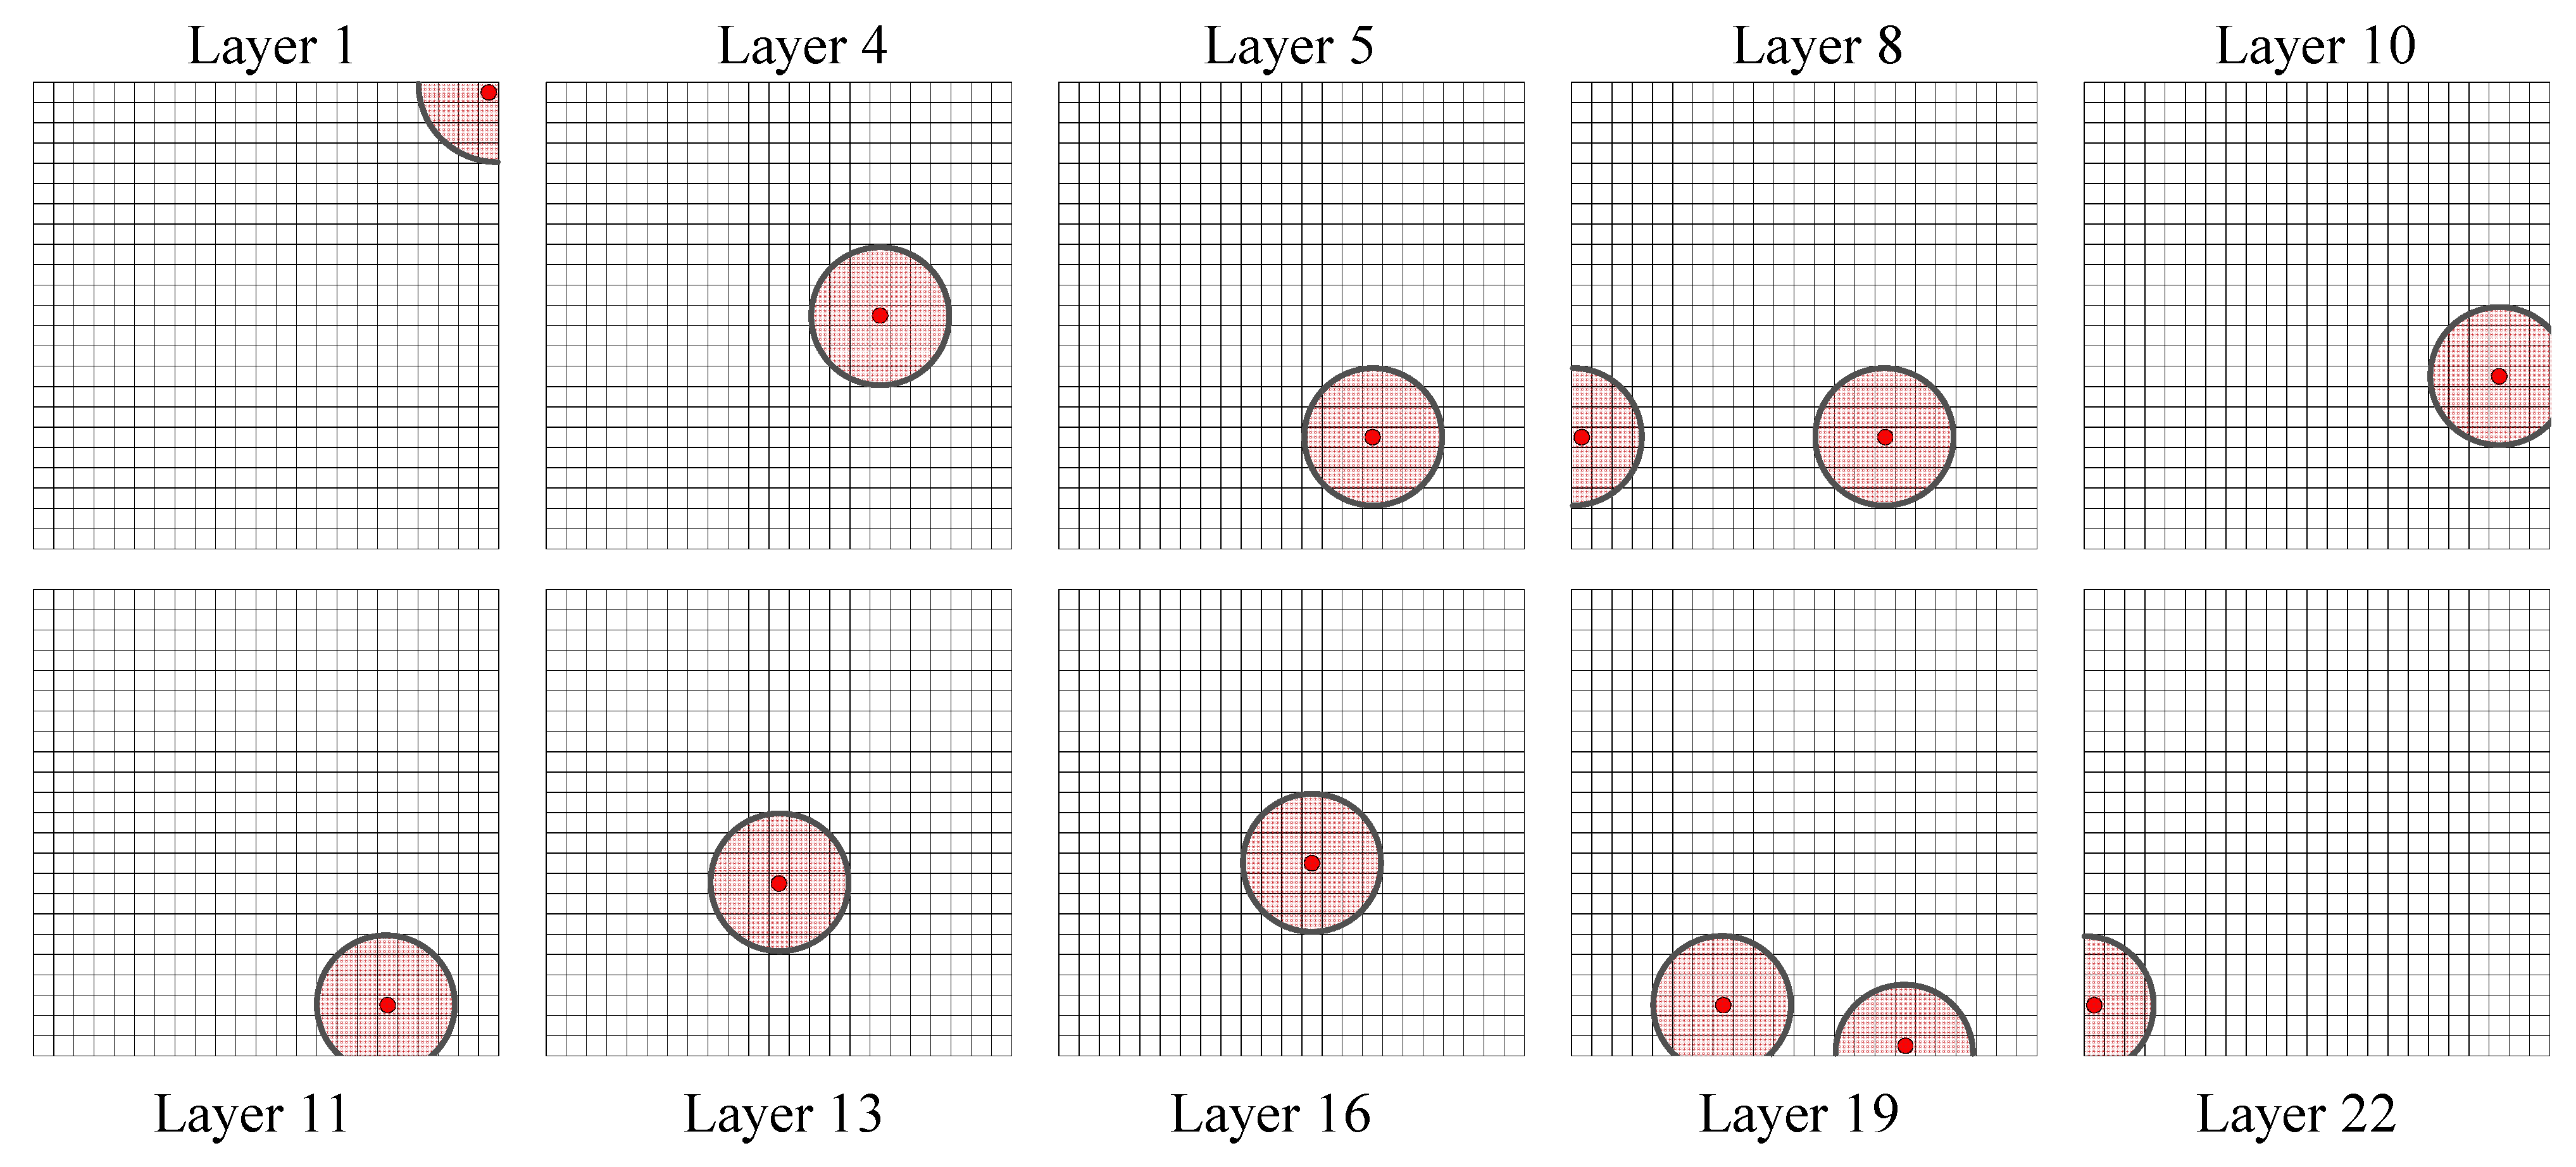
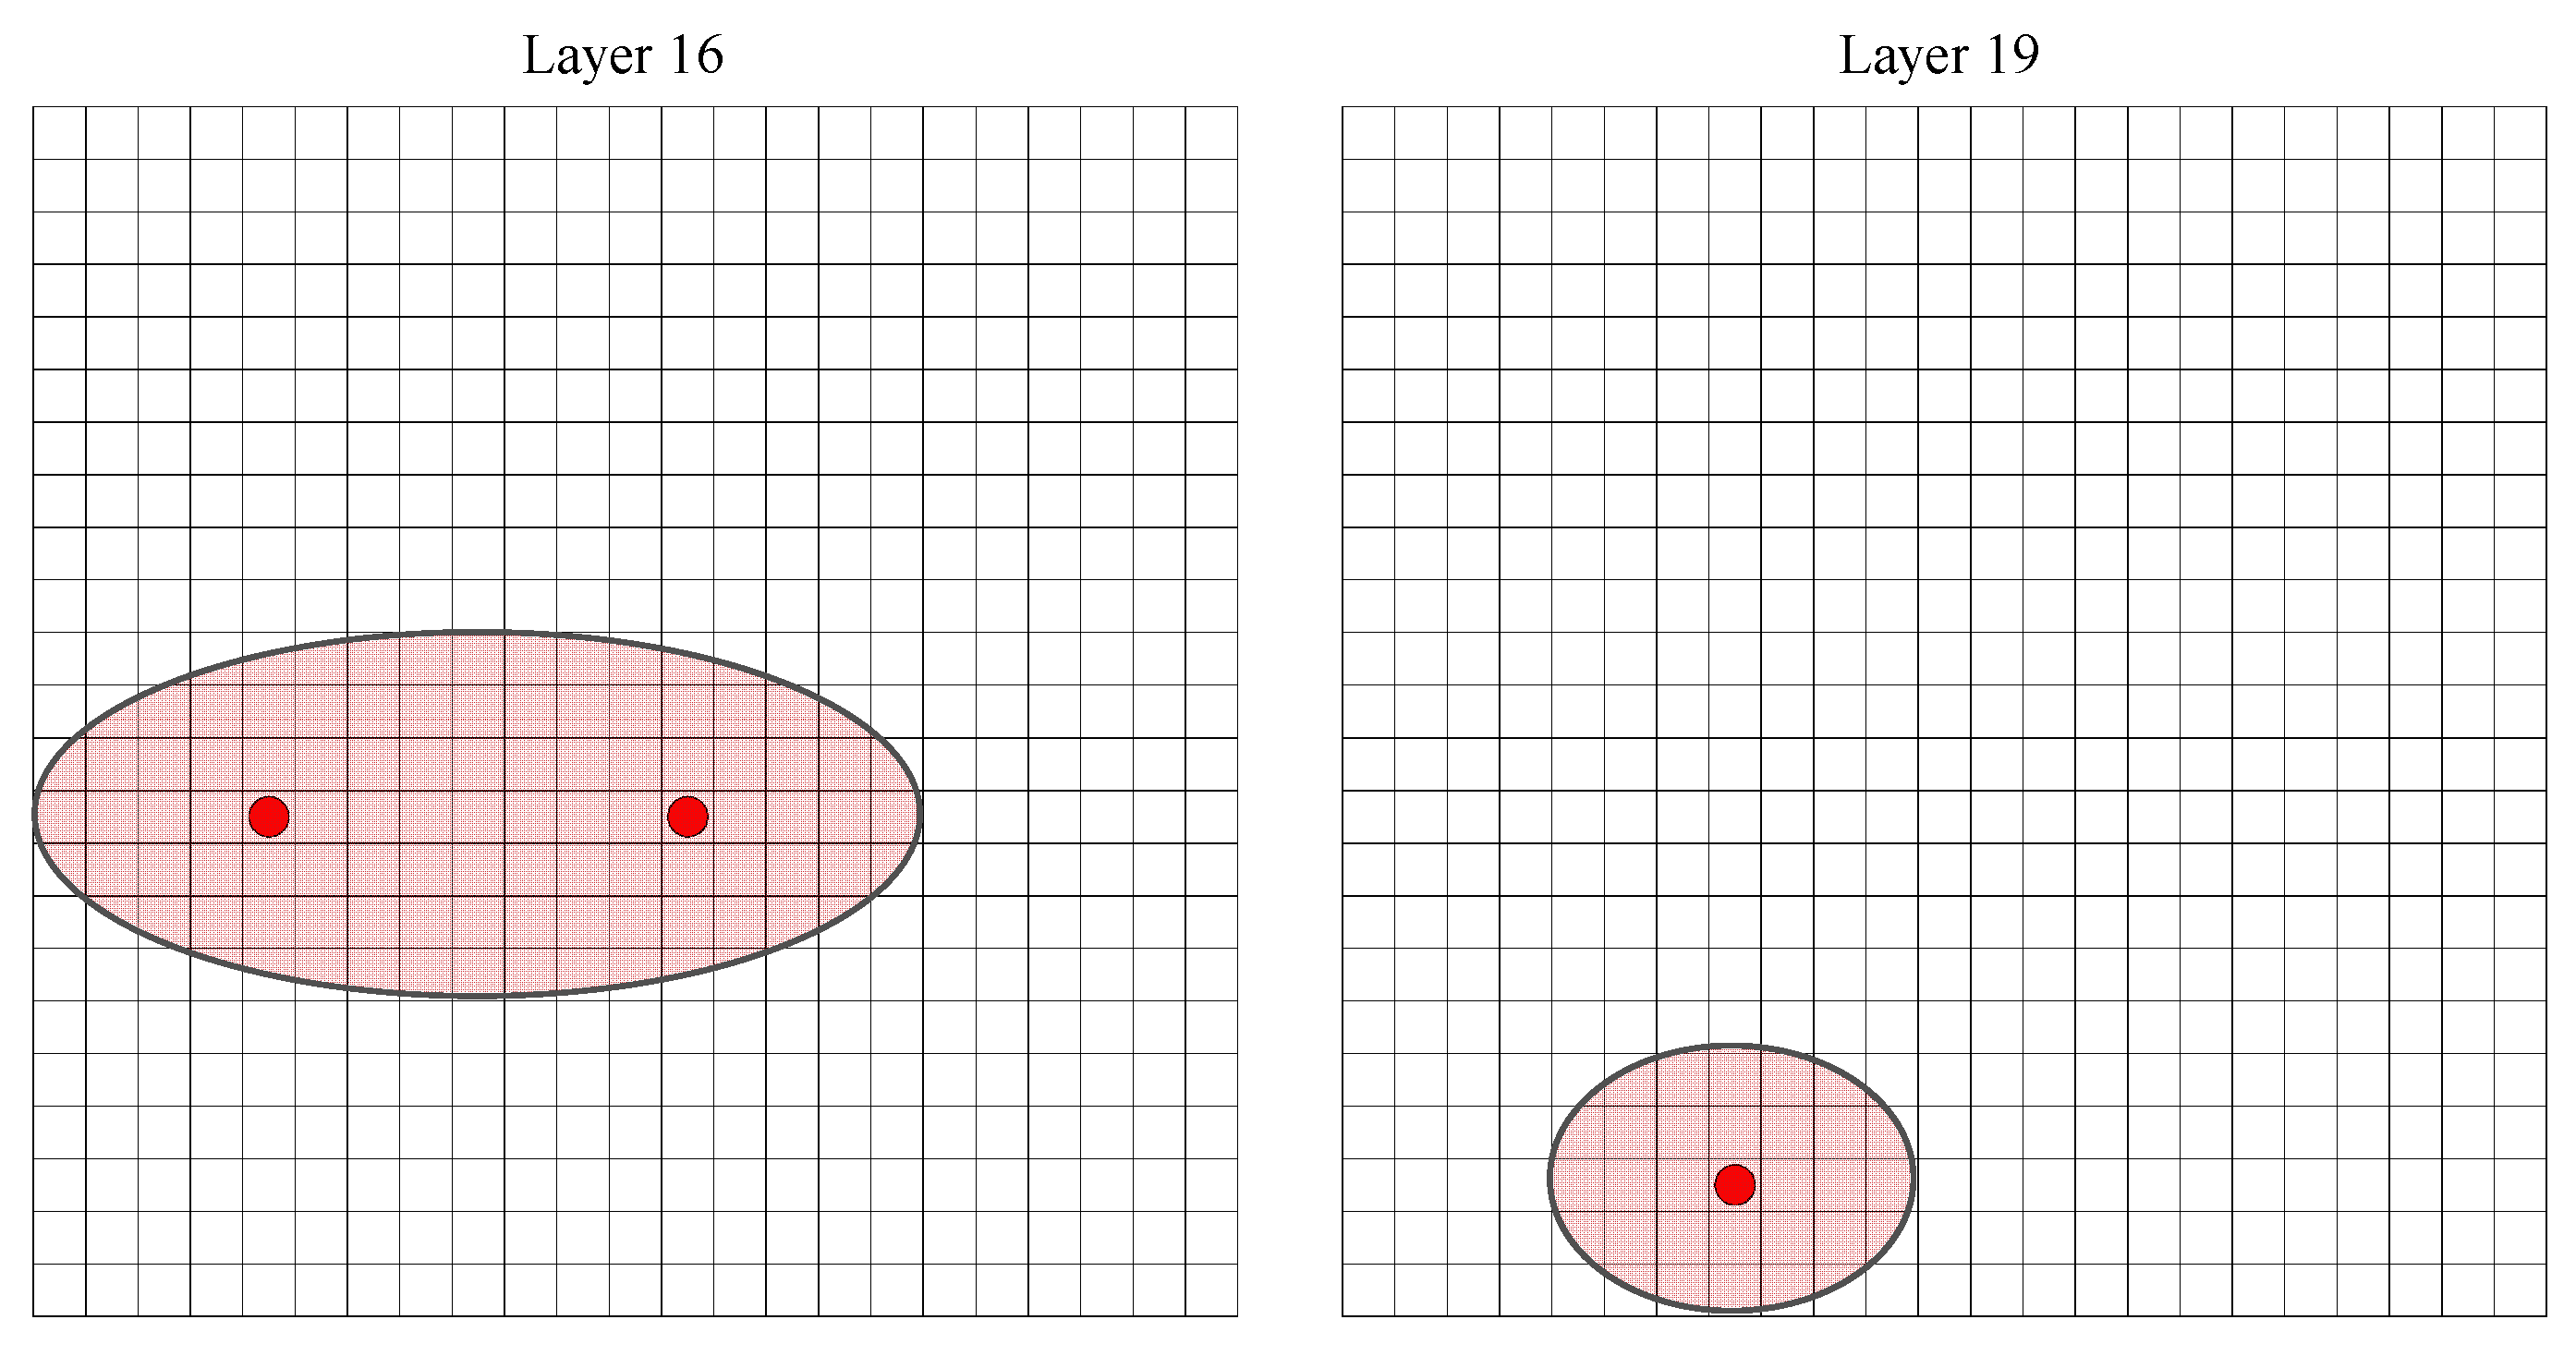
- Fractal analysis and regional damage prediction based on time and space, with time and energy as the core elements, were achieved through the construction of a nested fractal dimension warning method. Mainly through methods such as data interpretation and scheme design, construction of nested analysis models for spatiotemporal and temporal energy dimensions, programming for fractal solution of temporal energy elements, classification of fractal dimension values, and division and identification of temporal energy fractal dimension warning forms, preliminary implementation of temporal energy fractal dimension warning prediction was achieved. After double nested dimension analysis, multiple regional potential clustering areas based on space–time were reasonably delineated, and then the high-level dimension values of adjacent or overlapping regions in the temporal energy dimension were comprehensively determined, to predict and warn of disasters in the area.
Author Contributions
Funding
Data Availability Statement
Conflicts of Interest
References
- Terron-Almenara, J.; Skretting, E.; Holter, K.G. Design of Rock Support in Low Overburden and Hard Rock Conditions with the use of Rock Mass Classification Systems and Numerical Analyses: A Study Based on the Construction of the Hestnes Railway Tunnel, Norway. Rock Mech. Rock Eng. 2024, 57, 1–26. [Google Scholar] [CrossRef]
- Carlà, T.; Gigli, G.; Lombardi, L.; Nocentini, M.; Gracchi, T.; Rossi, G.; Tacconi Stefanelli, C.; Raspini, F.; Fubelli, G.; Casagli, N. Mechanisms of Block Instability at the Toe of a Slowly Deforming Rock Slope. Rock Mech. Rock Eng. 2024, 57, 1543–1563. [Google Scholar] [CrossRef]
- Wei, T.; Chen, G.; Zhu, Z.; Tang, P.; Yan, M. Slope instability mechanism with differential rock mass structure along a fault: A mine landslide from Southwest China. Geomech. Geophys. Geo-Energy Geo-Resour. 2024, 10, 76. [Google Scholar] [CrossRef]
- Chen, Y.; Guo, J.; Dong, L. A Novel Disturbance Stress Direction Identification Method of Rock Mass Using Acoustic Parameters. Rock Mech. Rock Eng. 2024, 57, 8529–8544. [Google Scholar] [CrossRef]
- Hamediazad, F.; Bahrani, N. Evaluation of the Rock Mass Strength for Hard Rock Pillar Design Using Bonded Block Models. Rock Mech. Rock Eng. 2024, 57, 3659–3680. [Google Scholar] [CrossRef]
- Fan, H.; Liu, H.; Li, L.; Wang, X.; Tu, W.; Gao, J.; Yang, G. Weakening mechanism of shear strength of jointed rock mass considering the filling characteristics. Bull. Eng. Geol. Environ. 2024, 83, 224. [Google Scholar] [CrossRef]
- Xu, N.; Xiao, P.; Li, B.; Li, P.; Li, Y.; Zhao, T.; Dong, L. Excavation-induced damage zoning of the underground powerhouse with high geostress based on multiple monitoring methods. Environ. Earth Sci. 2024, 83, 288. [Google Scholar] [CrossRef]
- Fey, C.; Rechberger, C.; Voit, K.; Mair, V.; Zangerl, C. Remote sensing-based deformation monitoring and geological characterisation of an active deep-seated rock slide (Tellakopf/Cima di Tella, South Tyrol, Italy). Bull. Eng. Geol. Environ. 2023, 82, 85. [Google Scholar] [CrossRef]
- Khan, M.; He, X.; Song, D.; Tian, X.; Li, Z.; Xue, Y.; Aslam, K.S. Extracting and Predicting Rock Mechanical Behavior Based on Microseismic Spatio-temporal Response in an Ultra-thick Coal Seam Mine. Rock Mech. Rock Eng. 2023, 56, 3725–3754. [Google Scholar] [CrossRef]
- Zhang, T.; Yang, Y.-L. Occurrence characteristics and treatment technologies of mine goaf in China: A comprehensive review. Environ. Earth Sci. 2024, 83, 441. [Google Scholar] [CrossRef]
- Xu, C.; Yang, R.; Zhao, Z.; Guan, B.; Yang, L.; He, L. Method and Application of Stress Inversion based on Strike, Dip, and Rake Data from Microseismic Focal Mechanisms and Fracture Network. Appl. Geophys. 2024, 21, 1–12. [Google Scholar] [CrossRef]
- Wang, K.; Ma, K.; Tang, C.a.; Liu, H.; Wang, X.; Li, Q. Study on Deep Mining-Induced Strata Behavior Based on the Evolutional Laws of Multiple Indices from Microseismic Monitoring. Rock Mech. Rock Eng. 2023, 56, 6481–6501. [Google Scholar] [CrossRef]
- Malovichko, L. The Effects of Layer-Induced Elastic Anisotropy on Microseismic Monitoring Records in Underground Coal Mines. Pure Appl. Geophys. 2024, 181, 1181–1194. [Google Scholar] [CrossRef]
- Li, W.; Zhu, X.-G.; Xia, H.-C. Microseismic Monitoring of Failure Mechanisms in Extra Thick Coal Seam Surrounding Rock. Geotech. Geol. Eng. 2024, 42, 2403–2423. [Google Scholar] [CrossRef]
- Lenhardt, W.A. Seismicity associated with deep-level mining at WesternDeep Levels Limited. J. South. Afr. Inst. Min. Metall. 1992, 92, 113–120. [Google Scholar]
- Gaul, F.; Eggenreich, S. Installation of a microseismic monitoring system in the Mittersill scheelite mine/Aufbau eines mikroseismischen Überwachungssystems im Mittersiller Scheelit Bergbau. Geomech. Tunn. 2016, 36, 1849–1856. [Google Scholar] [CrossRef]
- Guo, X.; Huangfu, F.; Wang, G.; Zhong, Z.; Wen, X. Construction and application research of microseismic monitoring system for Ashele Copper mine. Min. Metall. Eng. 2019, 39, 29–34. [Google Scholar]
- Li, S.; Yin, X.; Li, A. Application of Multi-Channel Microseismic Monitoring Technology in Monitoring Aftershocks of Large Explosion. Chin. J. Rock Mech. Eng. 2005, A, 4711–4714. [Google Scholar]
- Jiang, F.X. Application of microseismic monitoring technology in monitoring rock fractures in mines. J. Geotech. Eng. 2002, 2, 147–149. [Google Scholar]
- Zhang, L.; Wang, H.; Cai, J.; Zhang, S. Application of Micro-Seismic Monitoring in Post-Fracturing Evaluation of Shale Gas: A Case Study of Well X from Puguang Area, China. Processes 2023, 11, 1863. [Google Scholar] [CrossRef]
- Yang, W.; Jin, X.; Li, S.; Ma, Q. Overview of Seismic Localization Research and Application. Earthq. Eng. Eng. Vib. 2005, 1, 14–20. [Google Scholar] [CrossRef]
- Mandelbrot, B.B. The Fractal Geometry of Nature. Am. J. Phys. 1983, 51, 286. [Google Scholar] [CrossRef]
- Chen, Y. Fractal geometry and earth science. South China Earthq. 1996, 2, 1–7. [Google Scholar]
- Shi, X.J.; Niu, Z.R. Study on fractal dimension of rock fracture section. Sci. Bull. 1991, 7, 557–560. [Google Scholar]
- Zhu, C.; An, Z.; Wang, L.; Yao, D. The fractal characteristics of seismic activity and their significance for earthquake prediction. Earthq. Res. China 1991, 1, 73–86. [Google Scholar]
- Mandelbrot, B.B. How Long Is the Coast of Britain? Statistical Self-Similarity and Fractional Dimension. Science 1967, 156, 636–638. [Google Scholar] [CrossRef]
- Xie, H. The Application and Prospect of Fractal Theory in Mining Science. Sci. Chin. 1996, 2, 5–9. [Google Scholar]
- Hirata, T.; Satoh, T.; Ito, K. Fractal structure of spatial distribution of microfracturing in rock. Geophys. J. R. Astron. Soc. 1987, 90, 369–374. [Google Scholar] [CrossRef]
- Hong, S.Z.; Hong, S.M. Several understandings of the spatiotemporal fractal dimension of earthquakes. Int. Earthq. Dyn. 1991, 3, 25–27. [Google Scholar]
- Hong, S.Z.; Hong, S.M. Several issues to be noted in seismic fractal research. Int. Earthq. Dyn. 1992, 22, 66–71+77. [Google Scholar]
- Xie, H.; Yu, G.; Yang, L. Research on fractal fracture network of mining rock mass. J. Rock Mech. Eng. 1999, 18, 29–33. [Google Scholar]
- Wu, Y.; Tahmasebi, P.; Lin, C.; Zahid, M.A.; Dong, C.; Golab, A.N.; Ren, L. A comprehensive study on geometric, topological and fractal characterizations of pore systems in low-permeability reservoirs based on SEM, MICP, NMR, and X-ray CT experiments. Mar. Pet. Geol. 2019, 103, 12–28. [Google Scholar] [CrossRef]
- Liu, Y.; Yin, G.; Li, M.; Zhang, D.; Deng, B.; Liu, C.; Lu, J. Anisotropic Mechanical Properties and the Permeability Evolution of Cubic Coal Under True Triaxial Stress Paths. Rock Mech. Rock Eng. 2019, 52, 16. [Google Scholar] [CrossRef]
- Kong, X.; Wang, E.; He, X.; Liu, X.; Liu, Q. Cracks evolution and multifractal of acoustic emission energy during coal loading. Geomech. Eng. 2018, 14, 107–113. [Google Scholar]
- Song, H.; Zhao, Y.; Elsworth, D.; Jiang, Y.; Wang, J. Anisotropy of acoustic emission in coal under the uniaxial loading condition. Chaos Solitons Fractals 2020, 130, 109465. [Google Scholar] [CrossRef]
- Zhou, Z.; Zhao, C.; Cai, C.; Zhou, J.; Rui, Y.; Zhang, S.; Wang, Z. Early Warning Method for Energy Dissipation Status and Trend of Microseismic Monitoring/Acoustic Emission Rupture Source. Patent CN112904421A, 4 June 2021. [Google Scholar]
- Zhao, C. Fractal Dimension Characterization of Rock Microseismic Time-Space-Energy Data and Regional Damage Early Warning Research. Ph.D. Thesis, Central South University, Changsha, China, 2024. [Google Scholar]
- Chen, G.; Teng, P.; Zhang, G.; Yang, L.; Li, T.; Lv, P. Fractal characteristics and energy transfer mechanism of coalrock combined body fragments under different loading rates. J. Chongqing Univ. 2022, 45, 115–129. [Google Scholar]
- Mao, H.; Xu, N.; Sun, Y.; Zhou, X.; Ding, X.; Dong, L. Deformation warning of surrounding rock based on fractal dimension of microseismic energy. Hazard Control. Tunn. Undergr. Eng. 2023, 5, 9–20. [Google Scholar]


| No. | Date | Time | Microseismic Event Coordinates (m) | Radiant Energy (J) | PS Wave Radiation Energy Ratio | Richter Magnitude | Seismic Moment (N·M) | Apparent Stress (MPa) | Apparent Volume (m3) | Corner Frequency (Hz) | Source Radius (m) | Number of Triggered Sensors (I) | ||
|---|---|---|---|---|---|---|---|---|---|---|---|---|---|---|
| X | Y | Z | ||||||||||||
| S | 17 July 2019 | 11:23:42 | 217 | 536 | 432 | 125.89 | 0.58 | 1.2 | 7.9 × 10⁸ | 0.04 | 3.4 × 10⁵ | 240 | 29.2 | 4 |
| 2 | 18 July 2019 | 7:59:04 | 303 | 427 | 430 | 15.85 | 1.26 | 1.7 | 3.2 × 10⁸ | 0.02 | 3.7 × 10⁵ | 254 | 30.1 | 5 |
| 3 | 20 July 2019 | 16:31:26 | 419 | 391 | 384 | 2511.89 | 1.12 | 0.6 | 2.0 × 10⁹ | 0.34 | 9.6 × 10⁴ | 294 | 19.2 | 5 |
| 4 | 21 July 2019 | 13:09:23 | 325 | 449 | 411 | 1.26 | 1.11 | 2.4 | 1.3 × 10⁸ | 0 | 5.3 × 10⁵ | 199 | 33.9 | 4 |
| 5 | 21 July 2019 | 23:48:24 | 308 | 431 | 373 | 251.19 | 1.38 | 0.8 | 4.0 × 10⁹ | 0.02 | 3.6 × 10⁶ | 284 | 64.5 | 5 |
| 6 | 3 October 2019 | 18:06:39 | 454 | 412 | 251 | 1995.26 | 1.16 | 0 | 2.5 × 10¹⁰ | 0.02 | 2.0 × 10⁷ | 205 | 113.4 | 6 |
| 7 | 13 October 2019 | 16:46:13 | 269 | 429 | 374 | 251.19 | 0.64 | 0.1 | 2.0 × 10⁹ | 0.04 | 8.8 × 10⁵ | 26 | 40.3 | 4 |
| 8 | 18 October 2019 | 18:35:30 | 264 | 468 | 378 | 3162.28 | 1.97 | 0.4 | 5.0 × 10⁹ | 0.17 | 5.0 × 10⁵ | 240 | 33.4 | 7 |
| 9 | 11 November 2019 | 12:51:03 | 361 | 453 | 345 | 398.11 | 1.17 | 0.5 | 1.3 × 10¹⁰ | 0.01 | 5.7 × 10⁶ | 91 | 111.1 | 6 |
| 10 | 29 December 2019 | 18:39:33 | 418 | 415 | 311 | 19,952.62 | 1.17 | 0.4 | 5.0 × 10¹⁰ | 0.12 | 1.9 × 10⁶ | 156 | 77 | 8 |
| : | ||||||||||||||
| 46 | 12 April 2020 | 8:13:36 | 319 | 440 | 368 | 31.62 | 1.71 | 1.6 | 5.0 × 10⁸ | 0.02 | 5.2 × 10⁵ | 358 | 33.7 | 3 |
| 47 | 12 April 2020 | 10:36:36 | 319 | 447 | 332 | 10 | 1.54 | 1.6 | 1.0 × 10⁹ | 0 | 4.9 × 10⁶ | 26 | 71.1 | 3 |
| 48 | 12 April 2020 | 11:38:42 | 387 | 385 | 283 | 3.98 | 1.11 | 1.8 | 6.3 × 10⁸ | 0 | 6.2 × 10⁶ | 269 | 77.2 | 3 |
| 49 | 22 April 2020 | 3:55:10 | 344 | 426 | 307 | 79.43 | 1.62 | 1.4 | 6.3 × 10⁸ | 0.04 | 2.6 × 10⁵ | 90 | 26.7 | 3 |
| 50 | 22 April 2020 | 12:14:21 | 320 | 463 | 335 | 1258.93 | 0.85 | 0.4 | 7.9 × 10⁹ | 0.04 | 3.2 × 10⁶ | 51 | 62.1 | 5 |
| 51 | 29 April 2020 | 21:27:44 | 298 | 465 | 308 | 31,622.78 | 1.09 | 0.5 | 6.3 × 10¹⁰ | 0.13 | 8.4 × 10⁶ | 171 | 85.4 | 9 |
| 52 | 4 May 2020 | 22:50:23 | 305 | 458 | 351 | 100 | 1.06 | −1.2 | 1.6 × 10⁹ | 0.02 | 1.2 × 10⁶ | 385 | 45.2 | 3 |
| No. | Different Energy Levels | |||||||||||||||
|---|---|---|---|---|---|---|---|---|---|---|---|---|---|---|---|---|
| Stage 1 | Stage 2 | Stage 3 | Stage 4 | |||||||||||||
| 1 | 2 | 3 | 4 | 1 | 2 | 3 | 4 | 1 | 2 | 3 | 4 | 1 | 2 | 3 | 4 | |
| 1 | 0 | 0 | 0 | 0 | 0 | 0 | 0 | 0 | 0 | 0 | 0 | 0 | 0 | 0 | 0 | 0 |
| 2 | 0 | 0 | 0 | 0 | 0 | 0 | 0 | 0 | 0 | 0 | 0 | 0 | 0 | 0 | 0 | 0 |
| 3 | 0 | 0 | 0 | 0 | 0 | 0 | 0 | 0 | 0 | 0 | 0 | 0 | 0 | 0 | 0 | 0 |
| 4 | 0 | 0 | 0 | 0 | 0 | 0 | 0 | 0 | 0 | 0 | 0 | 0 | 0 | 0 | 0 | 0 |
| 5 | 0 | 0 | 0 | 0 | 0 | 0 | 0 | 0 | 0 | 0 | 0 | 0 | 0 | 0 | 0 | 0 |
| 6 | 0 | 0 | 0 | 0 | 0 | 0 | 0 | 0 | 0 | 0 | 0 | 0 | 0 | 0 | 0 | 0 |
| 7 | 1 | 0 | 0 | 0 | 1 | 0 | 0 | 0 | 1 | 0 | 0 | 0 | 1 | 0 | 0 | 0 |
| 8 | 0 | 0 | 0 | 0 | 0 | 0 | 0 | 0 | 1 | 0 | 0 | 0 | 1 | 0 | 0 | 0 |
| 9 | 0 | 0 | 0 | 0 | 0 | 0 | 0 | 0 | 0 | 0 | 0 | 0 | 0 | 0 | 0 | 0 |
| 10 | 0 | 0 | 0 | 0 | 0 | 0 | 0 | 0 | 0 | 0 | 0 | 0 | 0 | 0 | 0 | 0 |
| 11 | 1 | 0 | 0 | 0 | 1 | 0 | 0 | 0 | 1 | 0 | 0 | 0 | 1 | 0 | 0 | 0 |
| 12 | 0 | 0 | 0 | 0 | 0 | 0 | 0 | 0 | 2 | 0 | 0 | 0 | 2 | 0 | 0 | 0 |
| 13 | 0 | 0 | 0 | 0 | 0 | 0 | 0 | 0 | 0 | 0 | 0 | 0 | 0 | 0 | 0 | 0 |
| 14 | 0 | 0 | 0 | 0 | 0 | 0 | 0 | 0 | 0 | 0 | 0 | 0 | 0 | 0 | 0 | 0 |
| 15 | 0 | 0 | 0 | 0 | 0 | 0 | 0 | 0 | 0 | 0 | 0 | 0 | 0 | 0 | 0 | 0 |
| 16 | 1 | 0 | 0 | 0 | 1 | 0 | 0 | 0 | 1 | 0 | 0 | 0 | 1 | 0 | 0 | 0 |
| 17 | 0 | 0 | 0 | 0 | 0 | 0 | 0 | 0 | 0 | 0 | 0 | 0 | 0 | 0 | 0 | 0 |
| 18 | 0 | 0 | 0 | 0 | 0 | 0 | 0 | 0 | 0 | 0 | 0 | 0 | 0 | 0 | 0 | 0 |
| 19 | 0 | 0 | 0 | 0 | 1 | 0 | 0 | 0 | 0 | 0 | 0 | 0 | 0 | 0 | 0 | 0 |
| 20 | 1 | 0 | 0 | 0 | 2 | 0 | 0 | 0 | 0 | 0 | 0 | 0 | 0 | 0 | 0 | 0 |
| 21 | 0 | 0 | 0 | 0 | 1 | 0 | 0 | 0 | 1 | 0 | 0 | 0 | 1 | 0 | 0 | 0 |
| 22 | 0 | 0 | 0 | 0 | 5 | 0 | 0 | 0 | 12 | 0 | 0 | 0 | 13 | 0 | 0 | 0 |
| 23 | 1 | 0 | 0 | 0 | 4 | 0 | 0 | 0 | 5 | 0 | 0 | 0 | 6 | 0 | 0 | 0 |
| 24 | 1 | 0 | 0 | 0 | 1 | 0 | 0 | 0 | 2 | 0 | 0 | 0 | 2 | 0 | 0 | 0 |
| 25 | 0 | 0 | 0 | 0 | 0 | 0 | 0 | 0 | 1 | 0 | 0 | 0 | 1 | 0 | 0 | 0 |
| 26 | 0 | 0 | 0 | 0 | 0 | 0 | 0 | 0 | 2 | 0 | 0 | 0 | 4 | 0 | 0 | 1 |
| 27 | 0 | 0 | 0 | 0 | 1 | 0 | 0 | 0 | 3 | 0 | 0 | 0 | 3 | 0 | 0 | 0 |
| 28 | 0 | 0 | 0 | 0 | 0 | 0 | 0 | 0 | 1 | 0 | 0 | 0 | 1 | 0 | 0 | 0 |
| 29 | 0 | 0 | 0 | 0 | 0 | 0 | 0 | 0 | 0 | 0 | 0 | 0 | 0 | 0 | 0 | 0 |
| 30 | 0 | 0 | 0 | 0 | 0 | 0 | 0 | 0 | 0 | 0 | 0 | 0 | 0 | 0 | 0 | 0 |
| 31 | 0 | 0 | 0 | 0 | 0 | 0 | 0 | 0 | 0 | 0 | 0 | 0 | 0 | 0 | 0 | 0 |
| 32 | 0 | 0 | 0 | 0 | 0 | 0 | 0 | 0 | 0 | 0 | 0 | 0 | 0 | 0 | 0 | 0 |
| 33 | 0 | 0 | 0 | 0 | 0 | 0 | 0 | 0 | 0 | 0 | 0 | 0 | 1 | 0 | 0 | 0 |
| 34 | 0 | 0 | 0 | 0 | 1 | 0 | 0 | 0 | 0 | 0 | 0 | 0 | 0 | 0 | 0 | 0 |
| 35 | 0 | 0 | 0 | 0 | 0 | 0 | 0 | 0 | 1 | 0 | 0 | 0 | 1 | 0 | 0 | 0 |
| 36 | 1 | 0 | 0 | 0 | 1 | 0 | 0 | 0 | 1 | 0 | 0 | 0 | 1 | 0 | 0 | 0 |
| 37 | 0 | 0 | 0 | 0 | 1 | 0 | 0 | 0 | 1 | 0 | 0 | 1 | 1 | 0 | 1 | 0 |
| 38 | 0 | 0 | 0 | 0 | 0 | 0 | 0 | 0 | 4 | 0 | 0 | 0 | 5 | 0 | 0 | 0 |
| 39 | 2 | 0 | 0 | 0 | 2 | 0 | 0 | 0 | 0 | 0 | 0 | 0 | 0 | 0 | 0 | 0 |
| 40 | 0 | 0 | 0 | 0 | 0 | 0 | 0 | 0 | 0 | 0 | 0 | 0 | 0 | 0 | 0 | 0 |
| 41 | 0 | 0 | 0 | 0 | 0 | 0 | 0 | 0 | 0 | 0 | 0 | 0 | 0 | 0 | 0 | 0 |
| 42 | 0 | 0 | 0 | 0 | 0 | 0 | 0 | 0 | 1 | 0 | 0 | 0 | 1 | 0 | 0 | 0 |
| 43 | 0 | 0 | 0 | 0 | 0 | 0 | 0 | 0 | 0 | 0 | 0 | 0 | 0 | 0 | 0 | 0 |
| 44 | 0 | 0 | 0 | 0 | 0 | 0 | 0 | 0 | 0 | 0 | 0 | 0 | 0 | 0 | 0 | 0 |
| 45 | 0 | 0 | 0 | 0 | 0 | 0 | 0 | 0 | 0 | 0 | 0 | 0 | 0 | 0 | 0 | 0 |
| 46 | 0 | 0 | 0 | 0 | 0 | 0 | 0 | 0 | 0 | 0 | 0 | 0 | 0 | 0 | 0 | 0 |
| 47 | 0 | 0 | 0 | 0 | 0 | 0 | 0 | 0 | 0 | 0 | 0 | 0 | 0 | 0 | 0 | 0 |
| 48 | 0 | 0 | 0 | 0 | 0 | 0 | 0 | 0 | 0 | 0 | 0 | 0 | 0 | 0 | 0 | 0 |
| 49 | 1 | 0 | 0 | 0 | 1 | 0 | 0 | 0 | 1 | 0 | 0 | 0 | 1 | 0 | 0 | 0 |
| 50 | 0 | 0 | 0 | 1 | 0 | 0 | 0 | 1 | 0 | 0 | 0 | 0 | 0 | 0 | 0 | 0 |
| 51 | 1 | 0 | 0 | 0 | 1 | 0 | 0 | 0 | 1 | 0 | 0 | 0 | 1 | 0 | 0 | 0 |
| 52 | 0 | 0 | 0 | 0 | 0 | 0 | 0 | 0 | 0 | 0 | 0 | 0 | 0 | 0 | 0 | 0 |
| 53 | 0 | 0 | 0 | 0 | 0 | 0 | 0 | 0 | 0 | 0 | 0 | 0 | 0 | 0 | 0 | 0 |
| 54 | 0 | 0 | 0 | 0 | 0 | 0 | 0 | 0 | 0 | 0 | 0 | 1 | 0 | 0 | 1 | 0 |
| 55 | 0 | 0 | 0 | 0 | 0 | 0 | 0 | 0 | 0 | 0 | 0 | 0 | 0 | 0 | 0 | 0 |
| 56 | 0 | 0 | 0 | 0 | 0 | 0 | 0 | 0 | 0 | 0 | 0 | 0 | 0 | 0 | 0 | 0 |
| 57 | 0 | 0 | 0 | 0 | 0 | 0 | 0 | 0 | 0 | 0 | 0 | 0 | 0 | 0 | 0 | 0 |
| 58 | 0 | 0 | 0 | 0 | 0 | 0 | 0 | 0 | 0 | 0 | 0 | 0 | 0 | 0 | 0 | 0 |
| 59 | 0 | 0 | 0 | 0 | 0 | 0 | 0 | 0 | 0 | 0 | 0 | 0 | 0 | 0 | 0 | 0 |
| 60 | 0 | 0 | 0 | 0 | 0 | 0 | 0 | 0 | 0 | 0 | 0 | 0 | 0 | 0 | 0 | 0 |
| 61 | 0 | 0 | 0 | 0 | 0 | 0 | 0 | 0 | 0 | 0 | 0 | 0 | 0 | 0 | 0 | 0 |
| 62 | 0 | 0 | 0 | 0 | 0 | 0 | 0 | 0 | 0 | 0 | 0 | 0 | 0 | 0 | 0 | 0 |
| 63 | 0 | 0 | 0 | 0 | 0 | 0 | 0 | 0 | 0 | 0 | 0 | 0 | 0 | 0 | 0 | 0 |
| 64 | 0 | 0 | 0 | 0 | 0 | 0 | 0 | 0 | 0 | 0 | 0 | 0 | 0 | 0 | 0 | 0 |
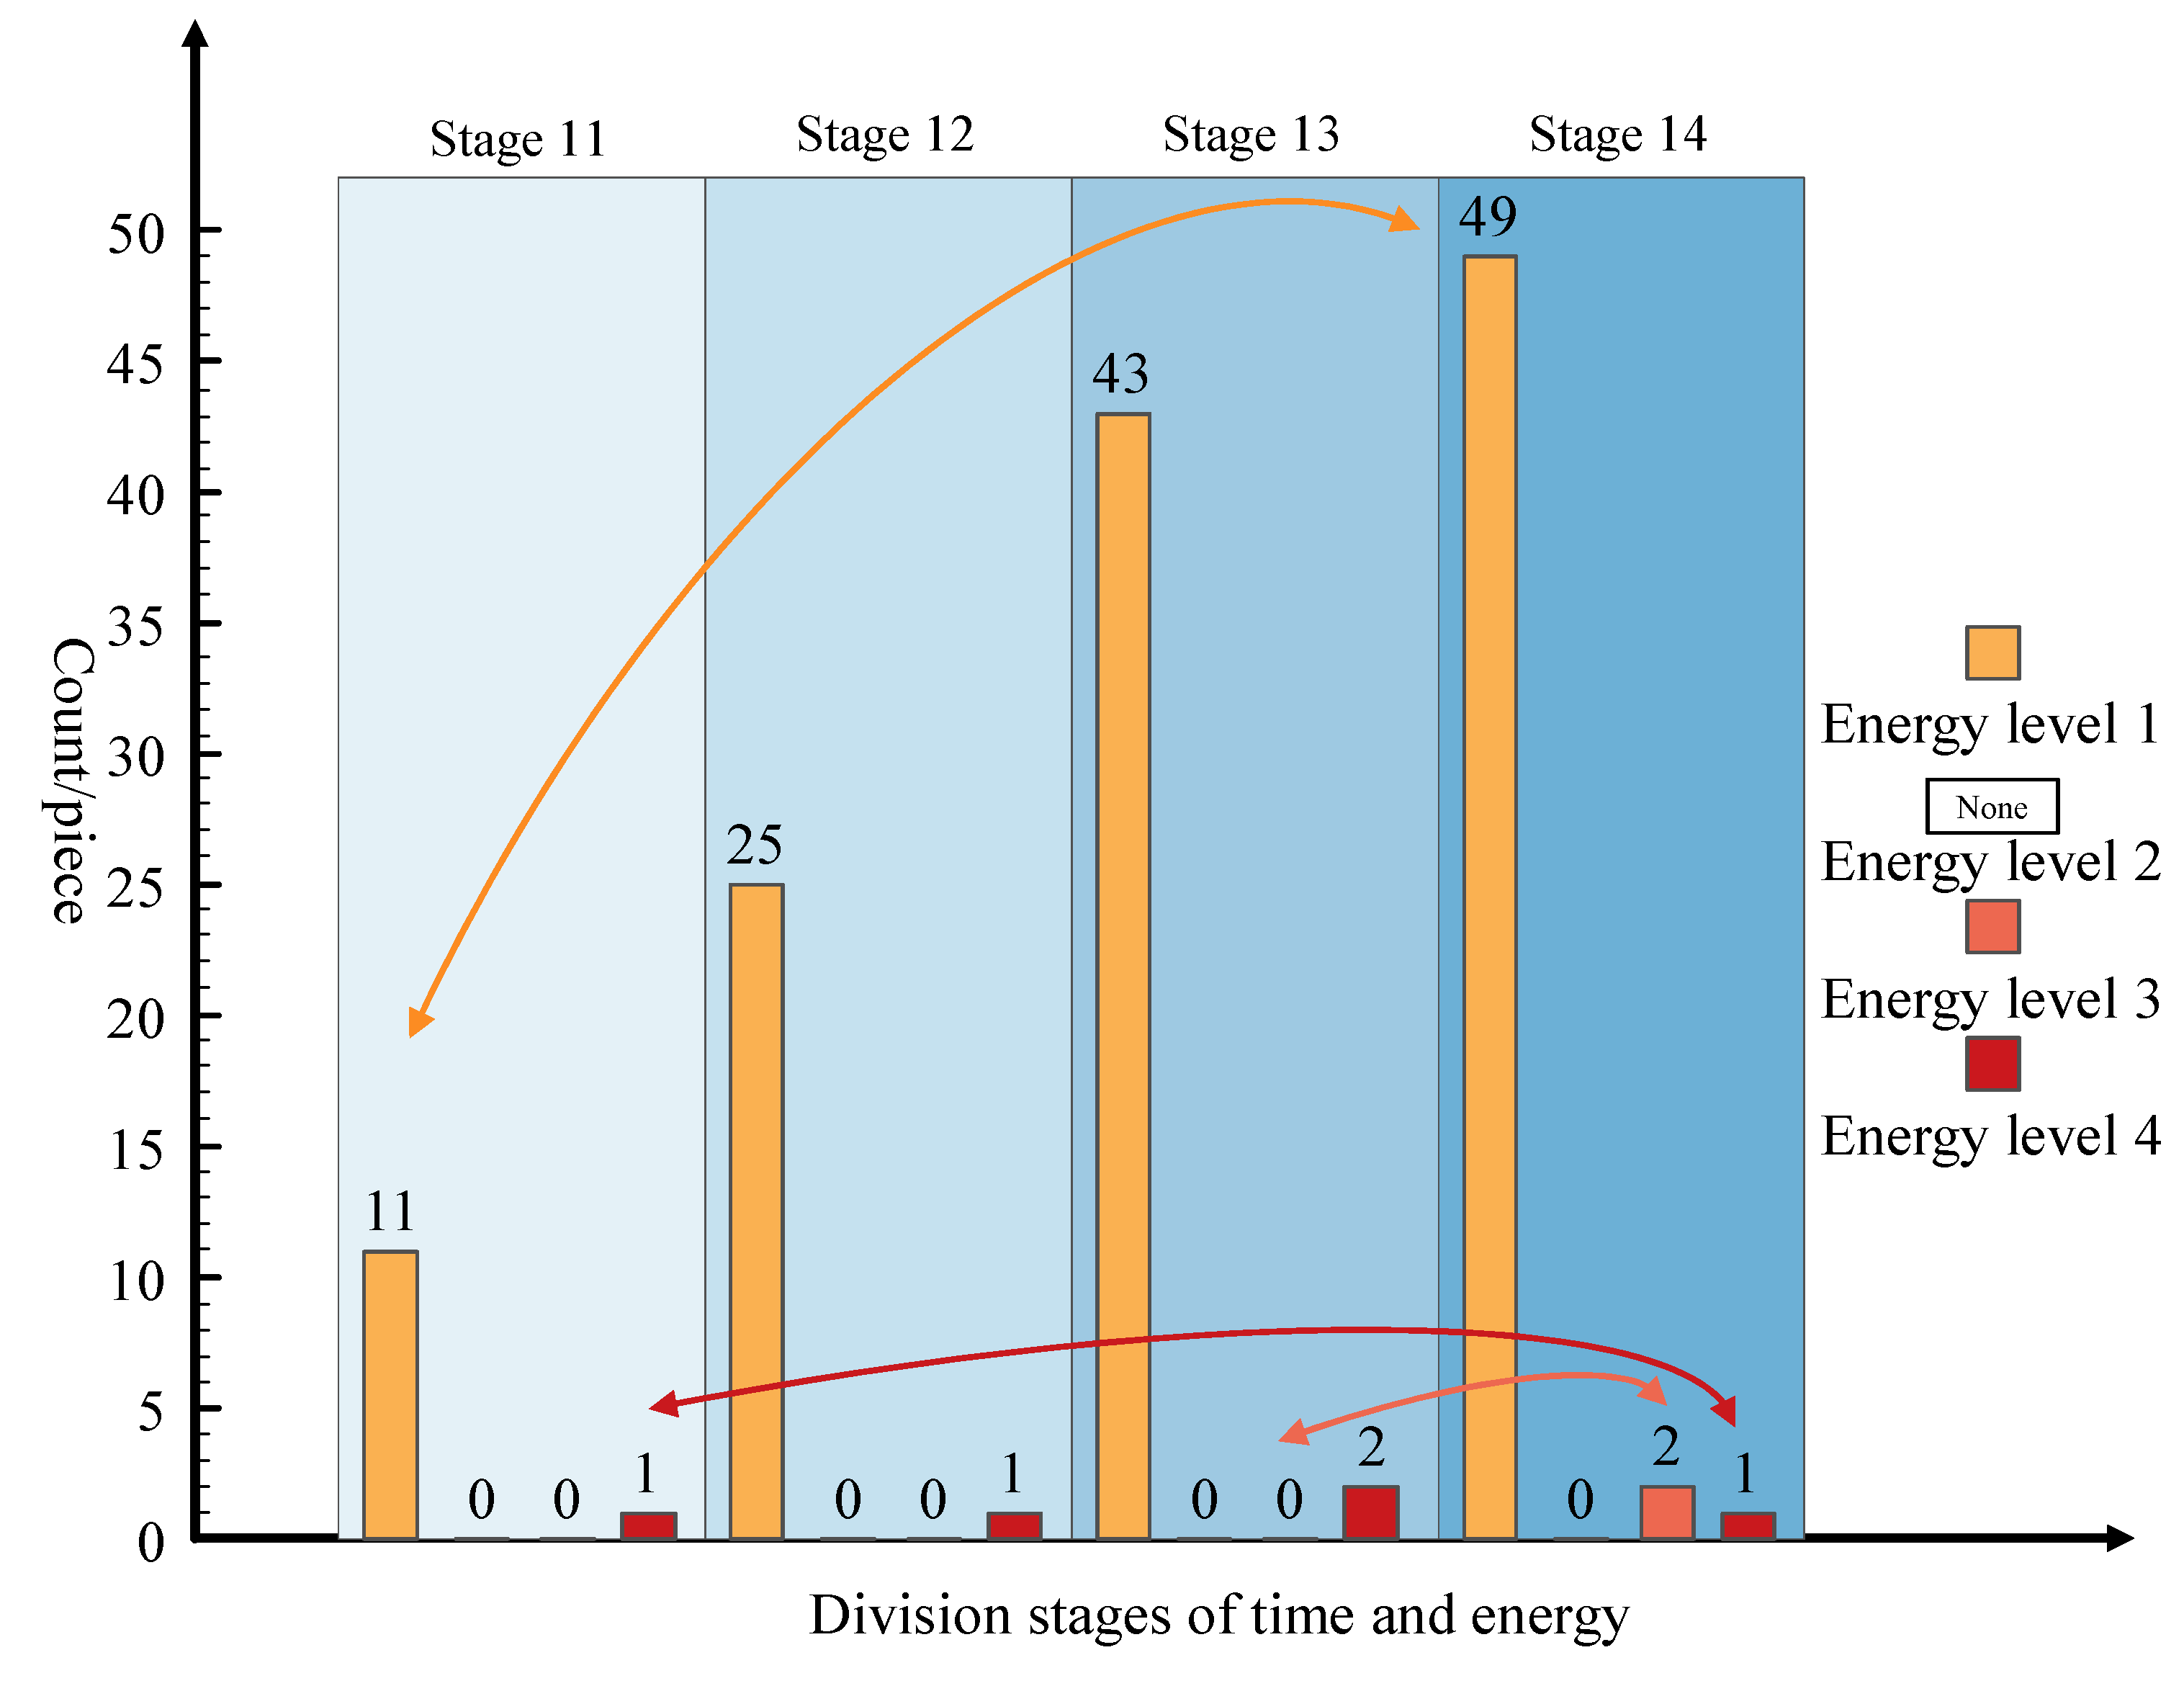
| Totals | 11 | 0 | 0 | 1 | 25 | 0 | 0 | 1 | 43 | 0 | 0 | 2 | 49 | 0 | 2 | 1 |
| No. | Warning Unit Number | Classification of Fractal Dimension Values | Number of Rectangular Units per Layer | Layers | Number | Rows | Columns |
|---|---|---|---|---|---|---|---|
| 1 | 529 | D | 529 | 1 | 0 | 23 | 23 |
| 2 | 2409 | D | 529 | 4 | 293 | 12 | 17 |
| 3 | 2799 | D | 529 | 5 | 154 | 6 | 16 |
| 4 | 4370 | D | 529 | 8 | 138 | 6 | 0 |
| 5 | 4386 | D | 529 | 8 | 154 | 6 | 16 |
| 6 | 5518 | D | 529 | 10 | 228 | 9 | 21 |
| 7 | 5906 | D | 529 | 11 | 87 | 3 | 18 |
| 8 | 7096 | D | 529 | 13 | 219 | 9 | 12 |
| 9 | 8707 | D | 529 | 16 | 243 | 10 | 13 |
| 10 | 10068 | D | 529 | 19 | 17 | 1 | 17 |
| 11 | 10128 | D | 529 | 19 | 77 | 3 | 8 |
| 12 | 11708 | D | 529 | 22 | 70 | 3 | 1 |
| No. | Warning Unit Number | Classification of Fractal Dimension Values | Number of Units per Layer | Layers | Number | Rows | Columns |
|---|---|---|---|---|---|---|---|
| 1 | 3986 | d | 529 | 7 | 283 | 12 | 7 |
| 2 | 8699 | d | 529 | 16 | 235 | 10 | 5 |
| 3 | 10173 | d | 529 | 19 | 122 | 5 | 7 |
| 4 | 10128 | d | 529 | 19 | 77 | 3 | 8 |
| Time–Energy Alert Number | Warning Unit Number | Layers | Number | Rows | Columns |
|---|---|---|---|---|---|
| 1 | 8707 | 16 | 243 | 10 | 13 |
| 8699 | 16 | 235 | 10 | 5 | |
| 2 | 10128 | 19 | 77 | 3 | 8 |
Disclaimer/Publisher’s Note: The statements, opinions and data contained in all publications are solely those of the individual author(s) and contributor(s) and not of MDPI and/or the editor(s). MDPI and/or the editor(s) disclaim responsibility for any injury to people or property resulting from any ideas, methods, instructions or products referred to in the content. |
© 2025 by the authors. Licensee MDPI, Basel, Switzerland. This article is an open access article distributed under the terms and conditions of the Creative Commons Attribution (CC BY) license (https://creativecommons.org/licenses/by/4.0/).
Share and Cite
Zhao, C.; Fu, S.; Wang, Z.; Chi, M.; Huang, Y. Fractal Dimension Warning via Microseismic Time–Energy Data During Rock Mass Failure. Fractal Fract. 2025, 9, 174. https://doi.org/10.3390/fractalfract9030174
Zhao C, Fu S, Wang Z, Chi M, Huang Y. Fractal Dimension Warning via Microseismic Time–Energy Data During Rock Mass Failure. Fractal and Fractional. 2025; 9(3):174. https://doi.org/10.3390/fractalfract9030174
Chicago/Turabian StyleZhao, Congcong, Shigen Fu, Zhen Wang, Mingbo Chi, and Yinghua Huang. 2025. "Fractal Dimension Warning via Microseismic Time–Energy Data During Rock Mass Failure" Fractal and Fractional 9, no. 3: 174. https://doi.org/10.3390/fractalfract9030174
APA StyleZhao, C., Fu, S., Wang, Z., Chi, M., & Huang, Y. (2025). Fractal Dimension Warning via Microseismic Time–Energy Data During Rock Mass Failure. Fractal and Fractional, 9(3), 174. https://doi.org/10.3390/fractalfract9030174