
Obtaining and Characterizing New Types of Materials Based on Low-Density Polyethylene and Thermoplastic Starch


 ,
,  ,
,  ,
,
Abstract
:1. Introduction
2. Experimental
2.1. Materials
2.2. Obtaining Thermoplastic Starch (TPS)
2.3. Obtaining Mixtures and Test Samples
2.4. Specimen Characterization
3. Results and Discussion
3.1. Physical–Mechanical Properties
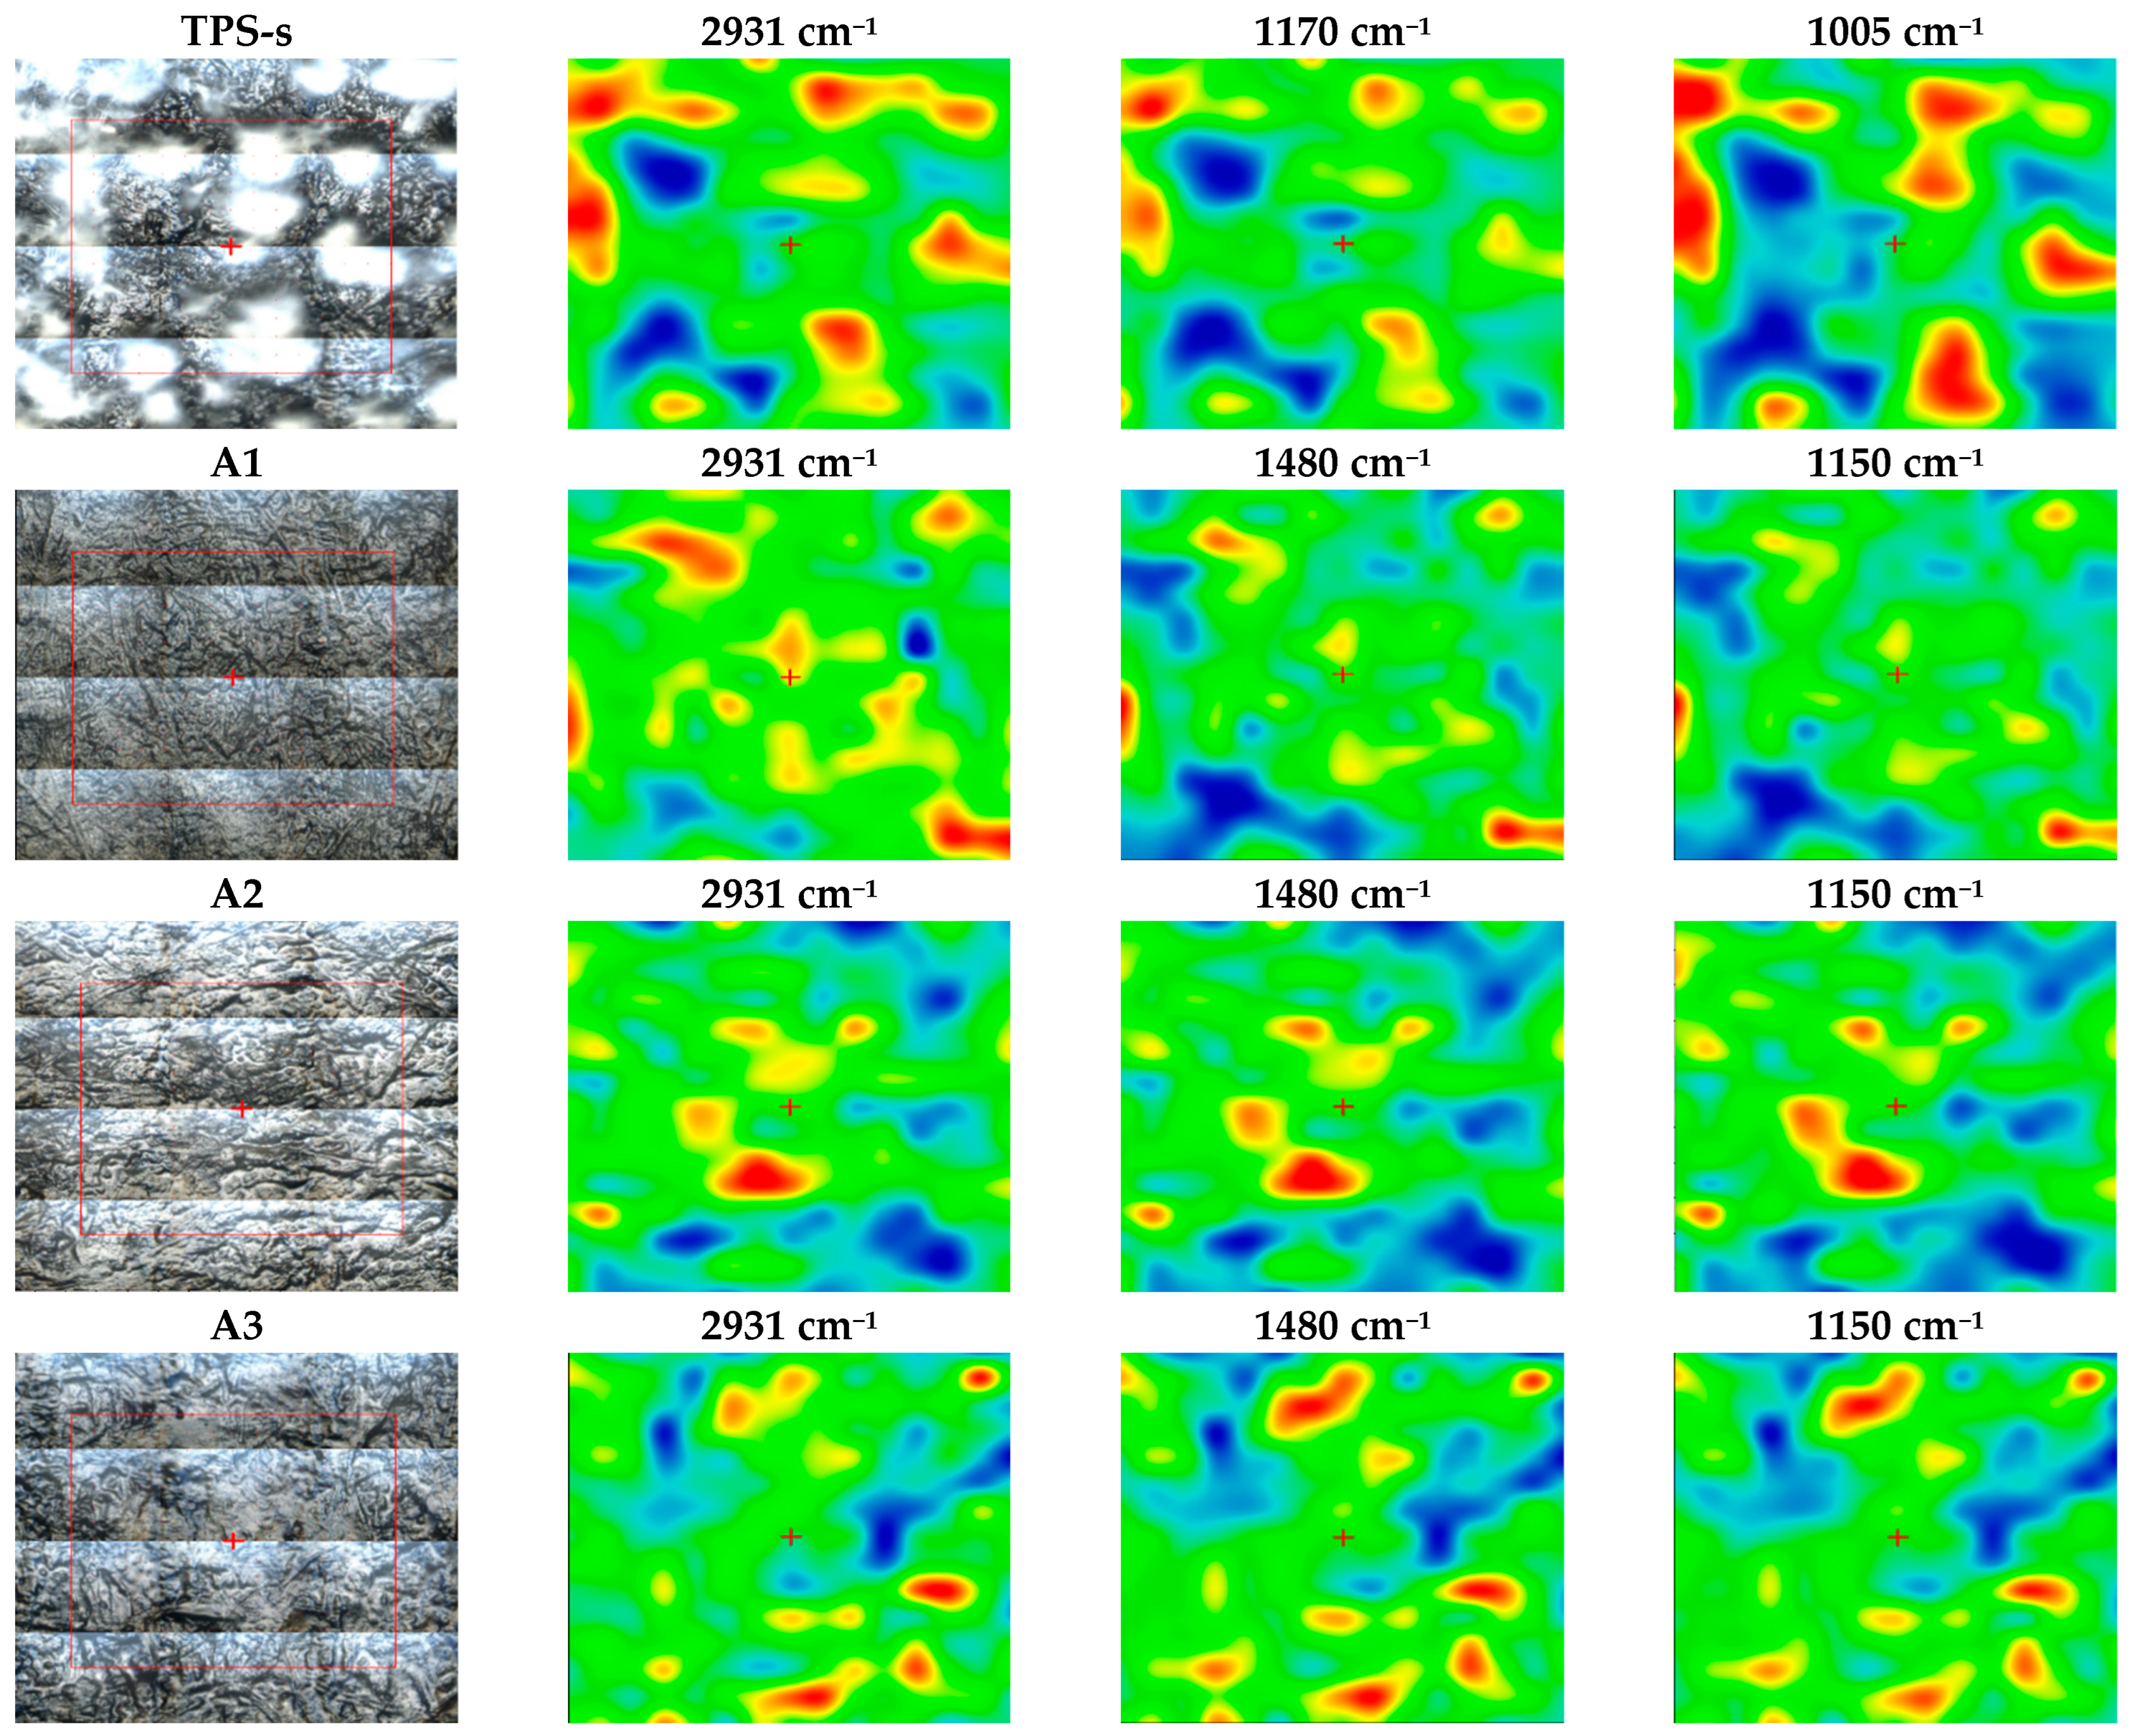
3.2. FTIR Spectra Analysis
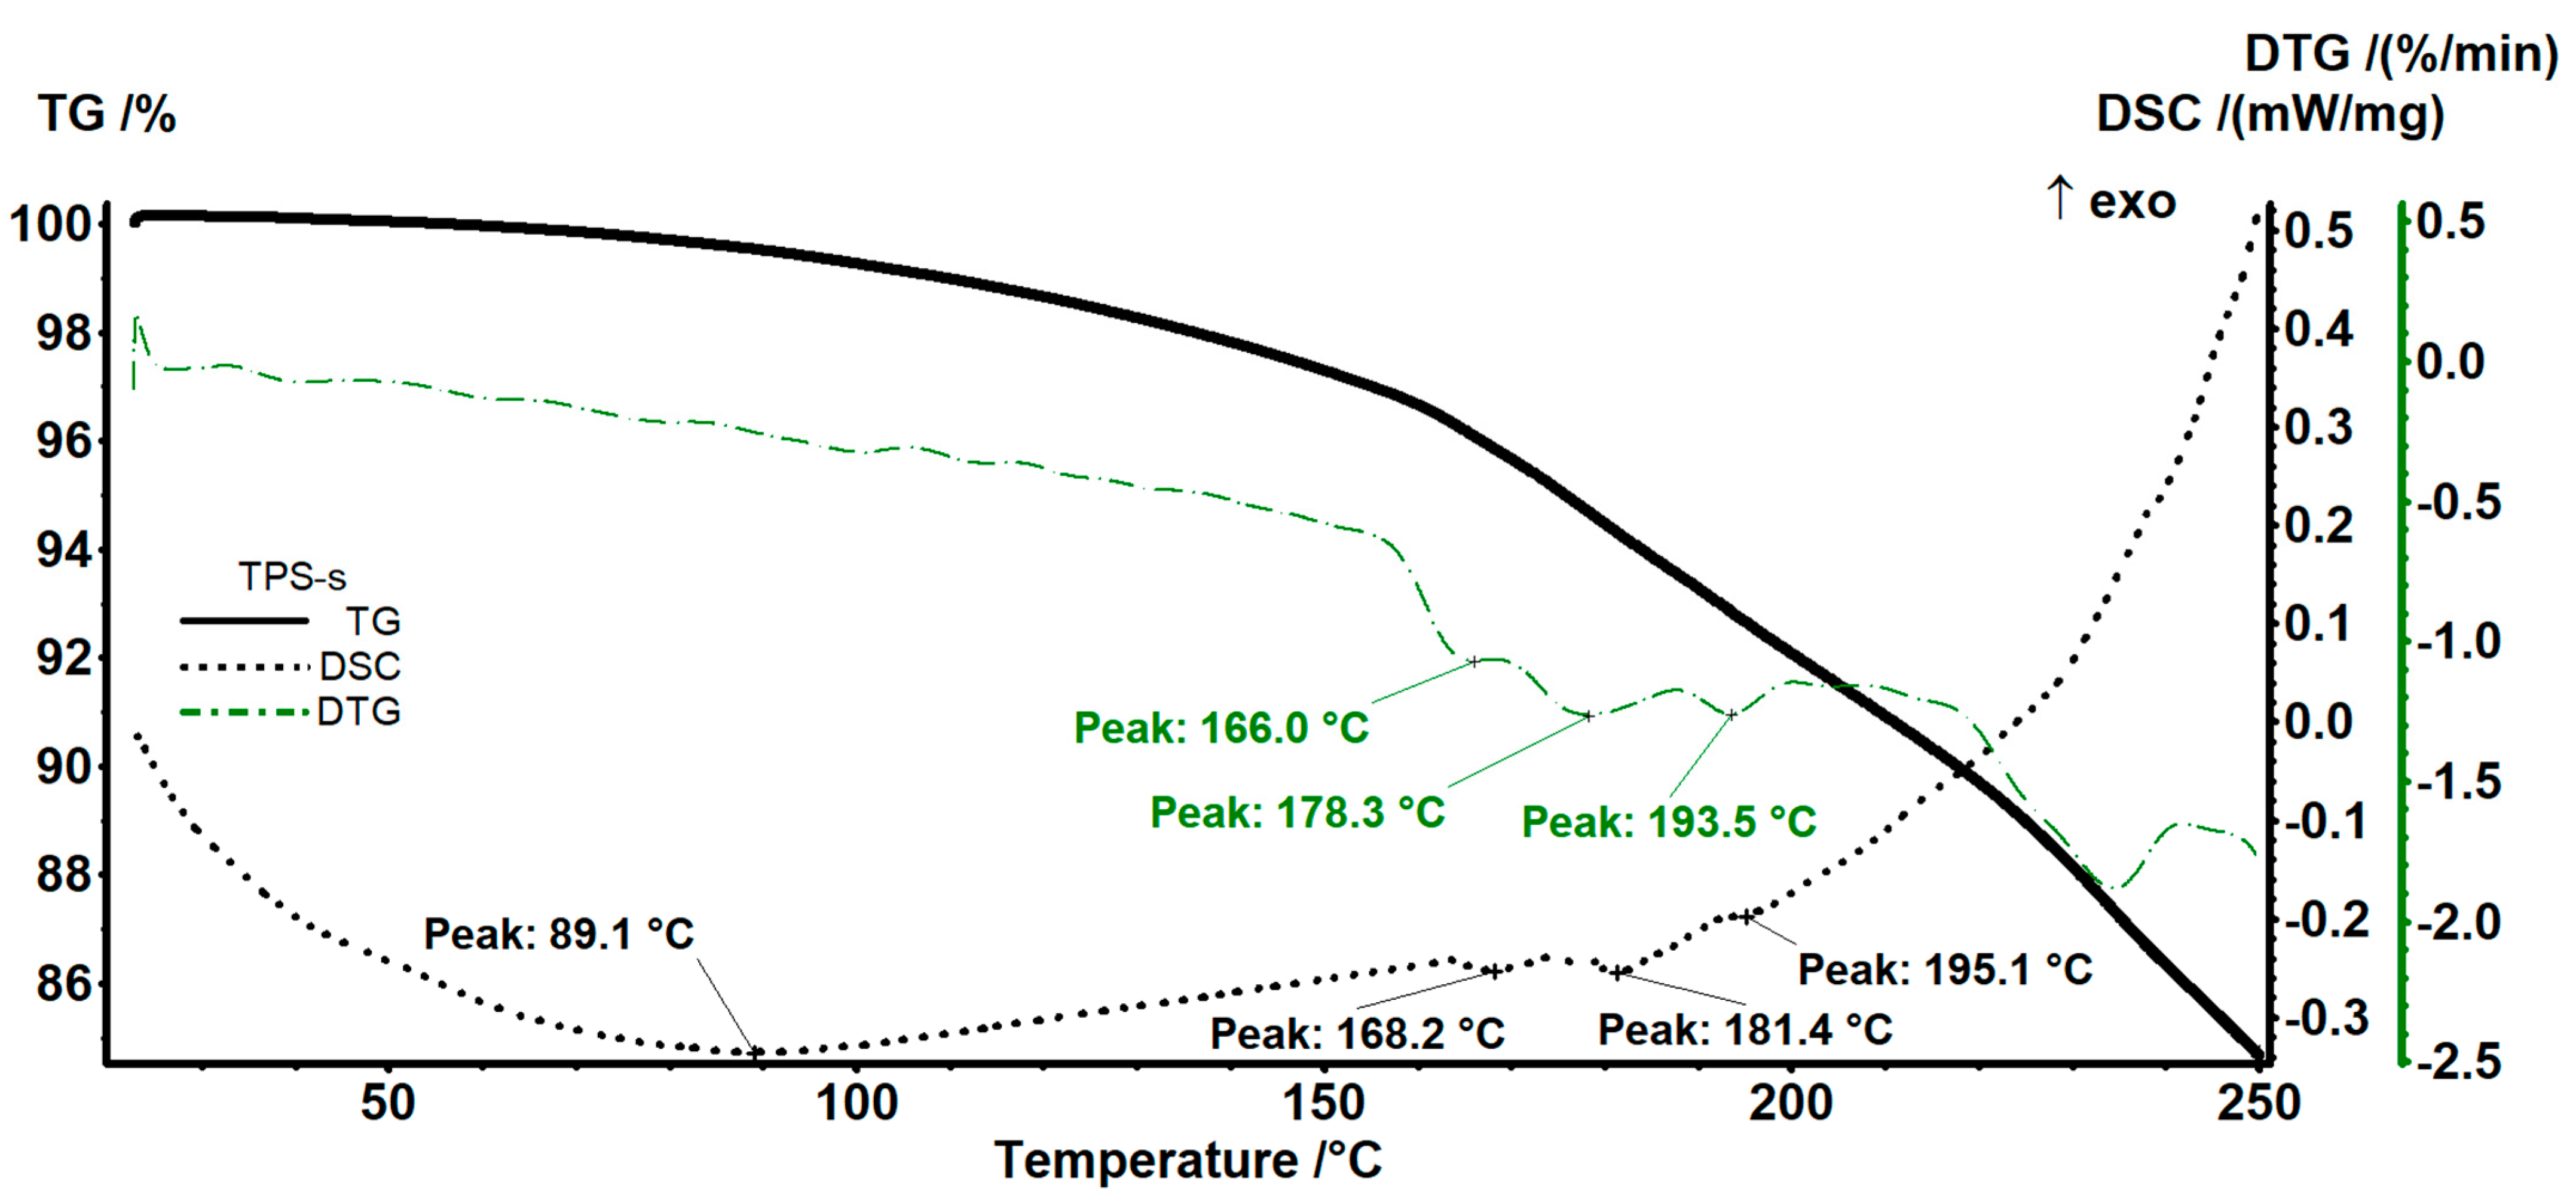
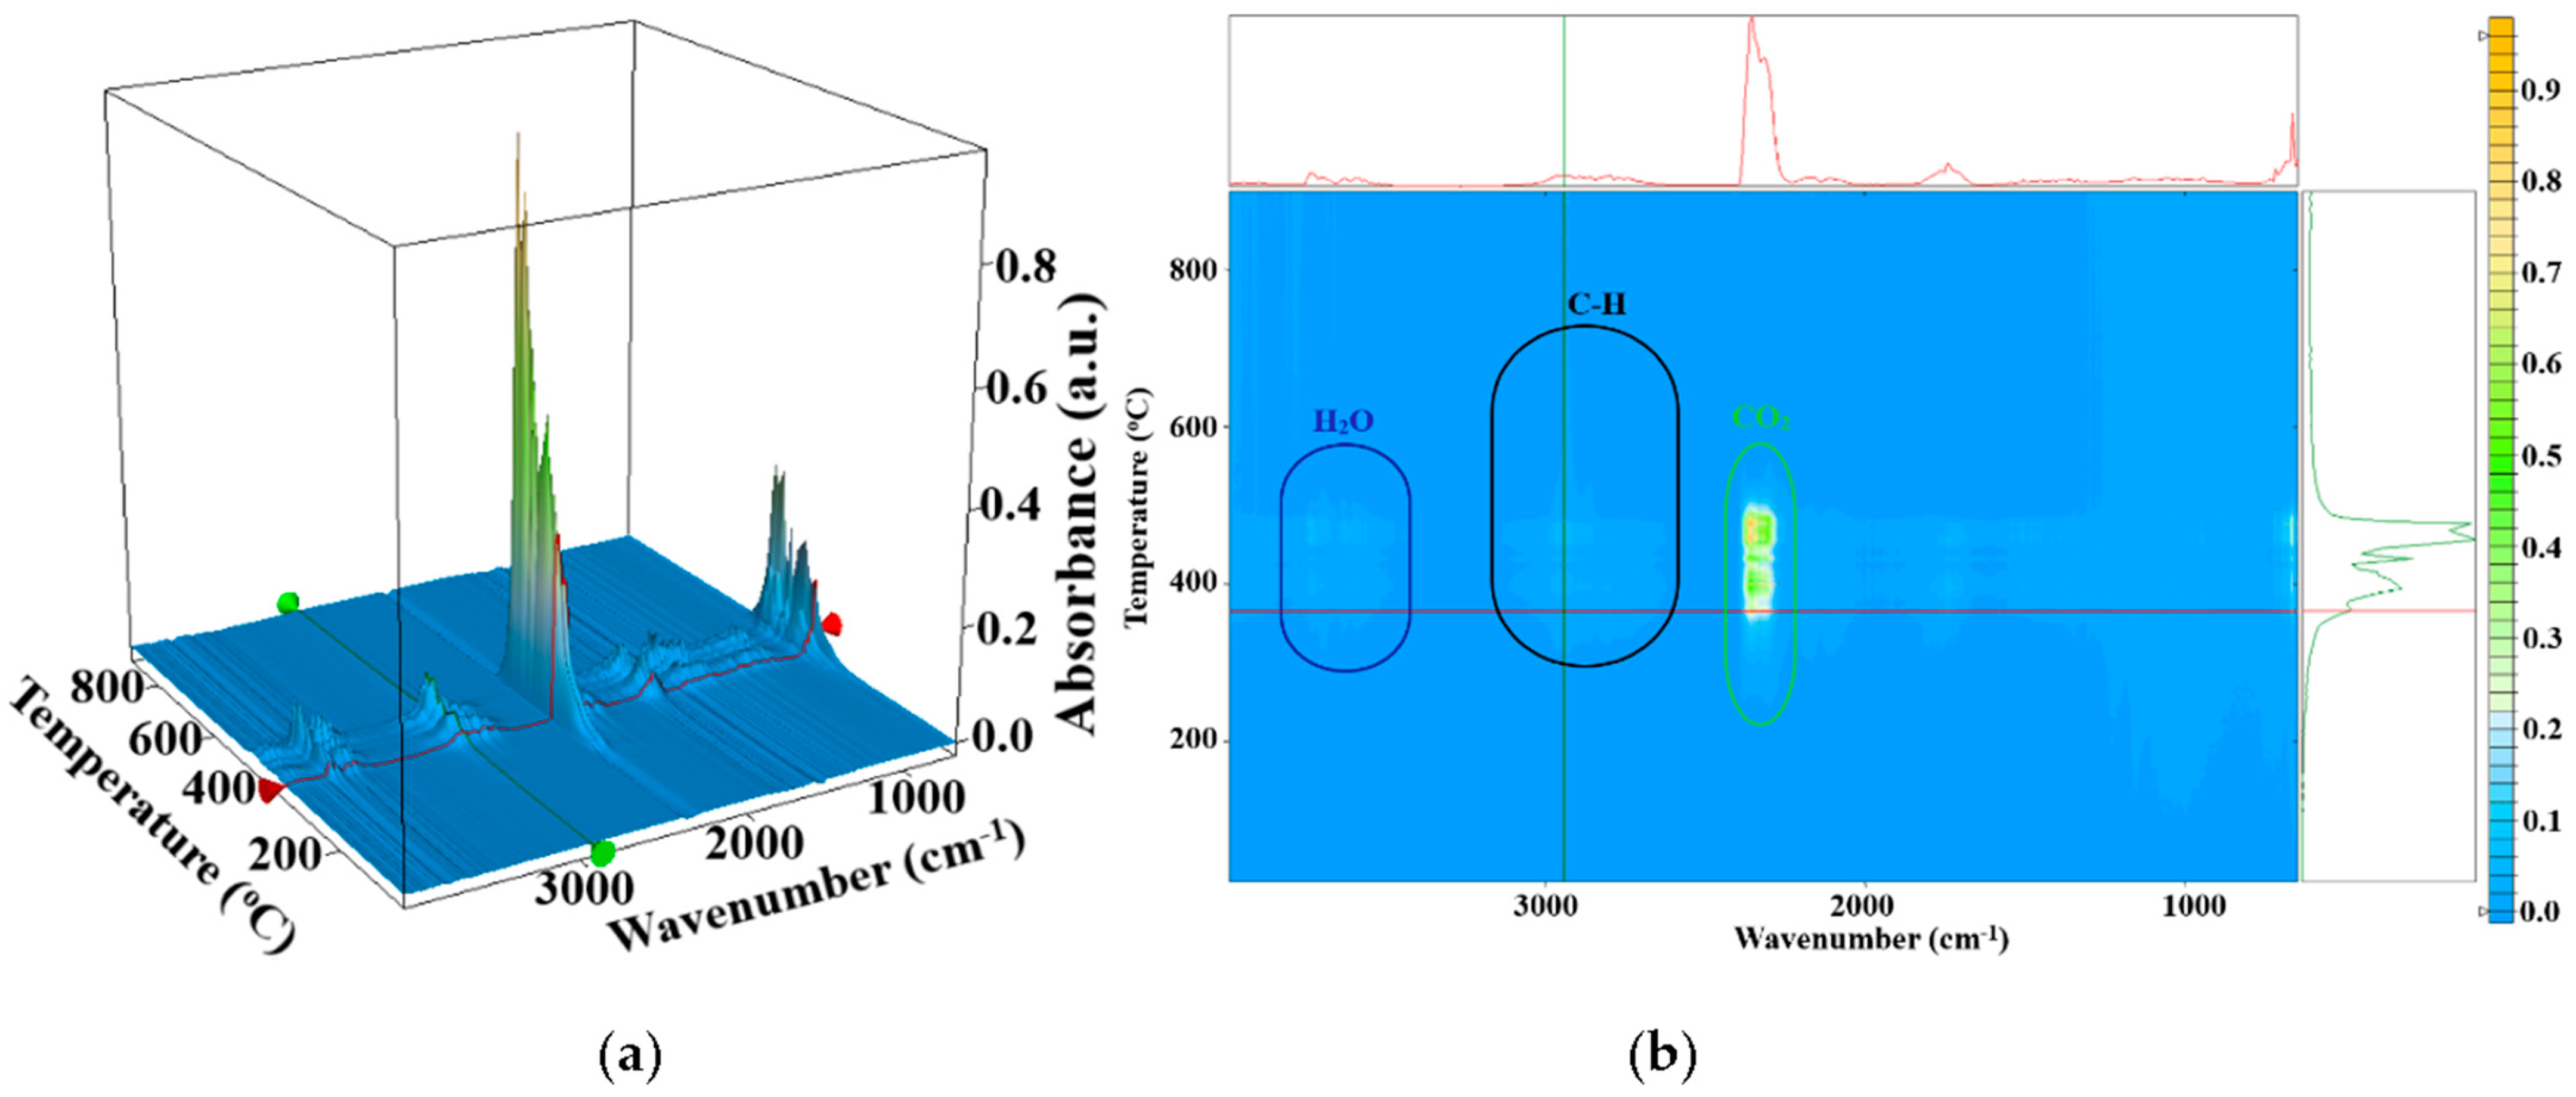
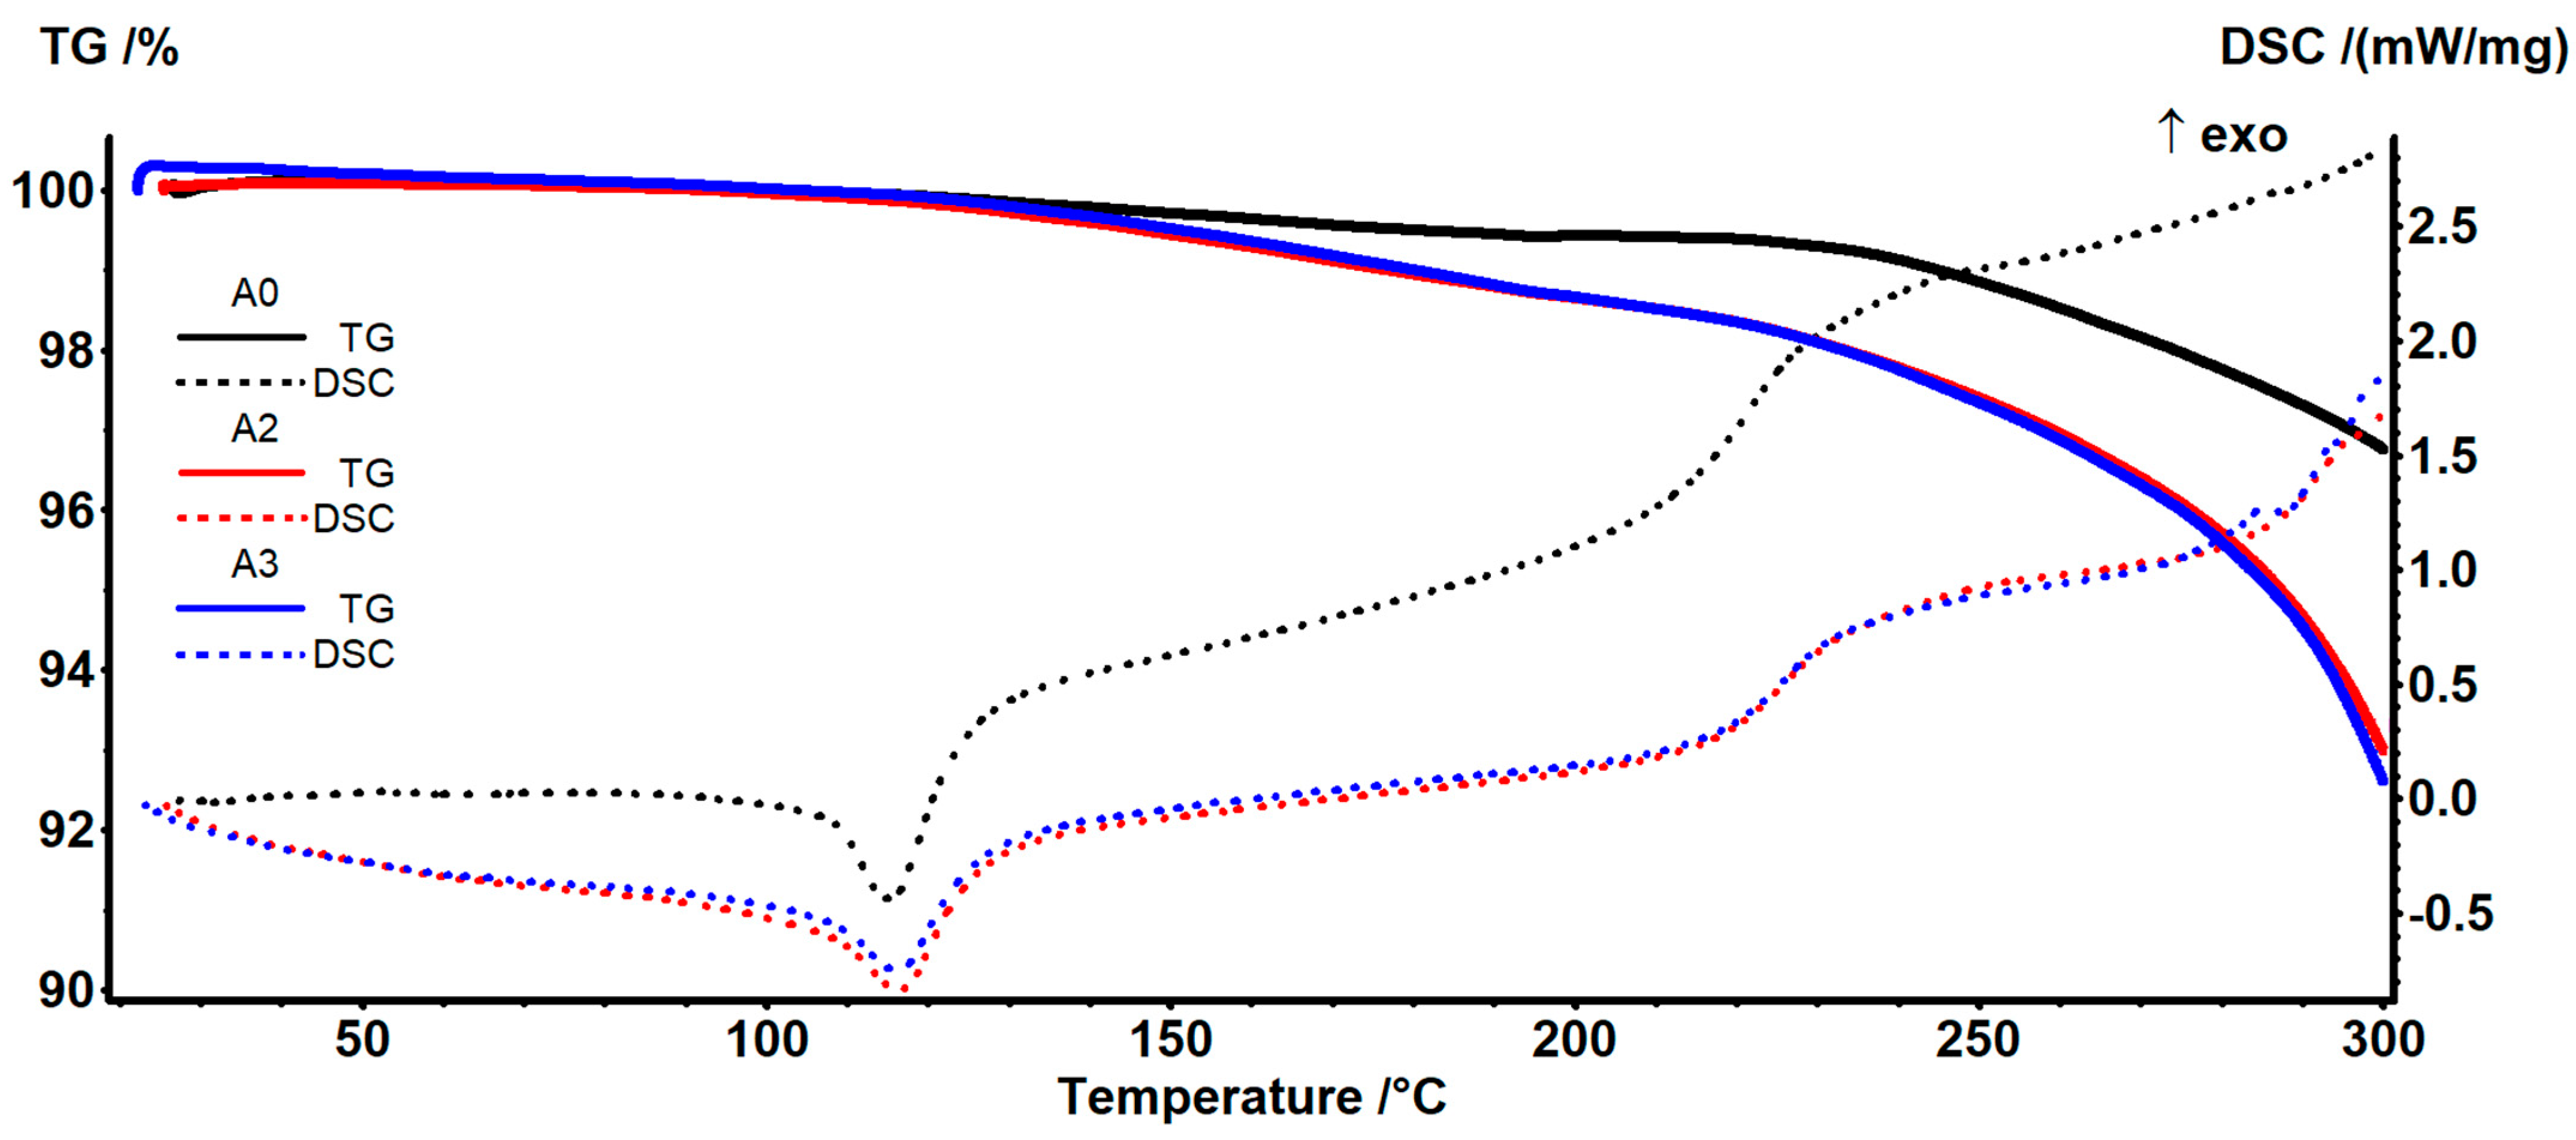
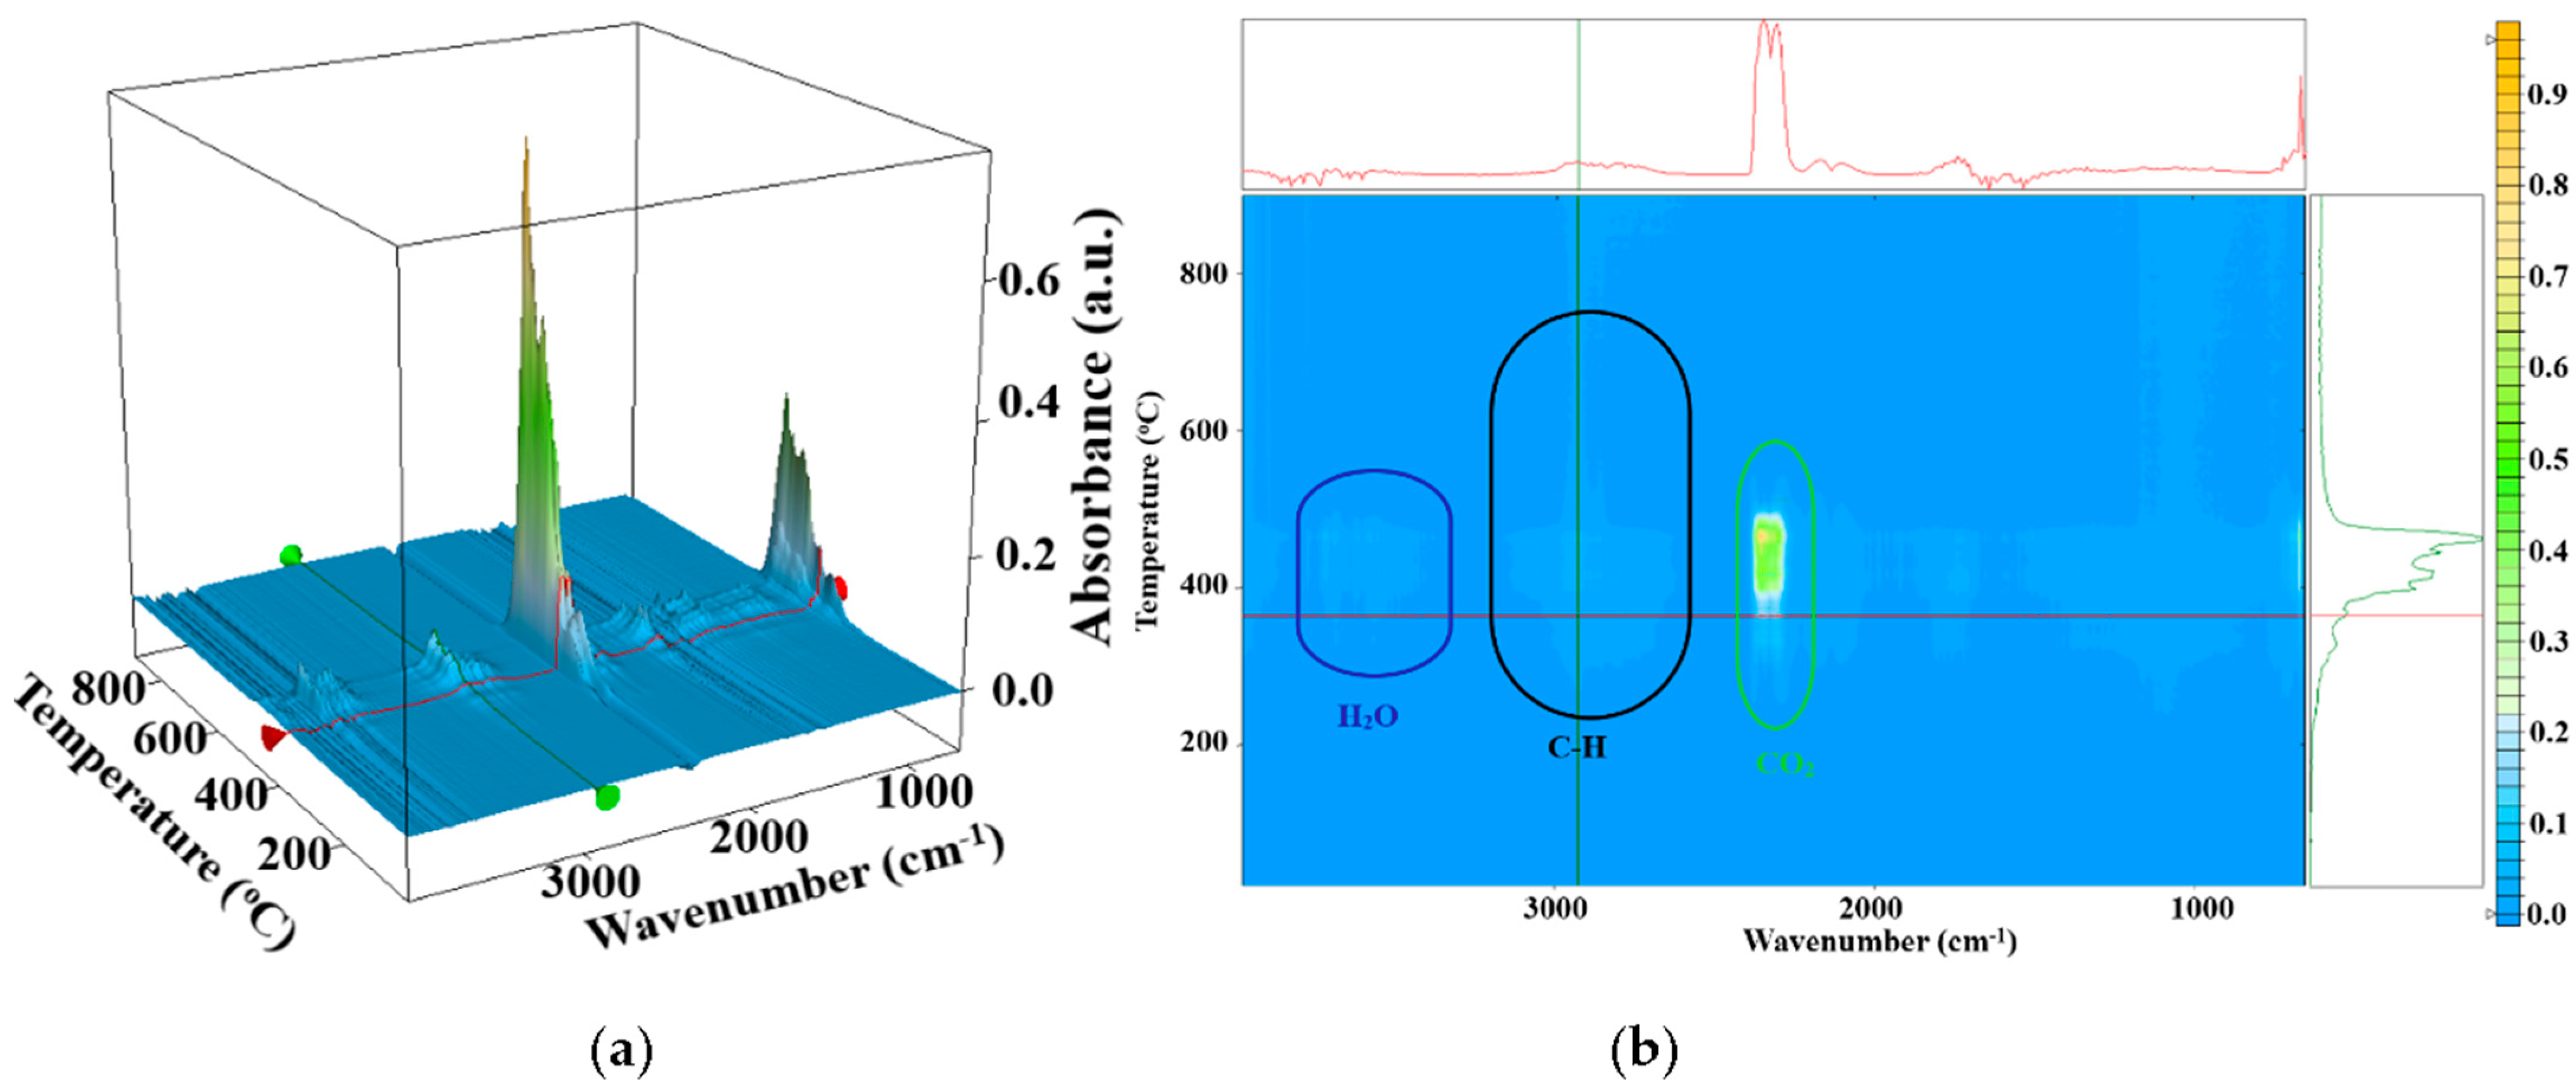
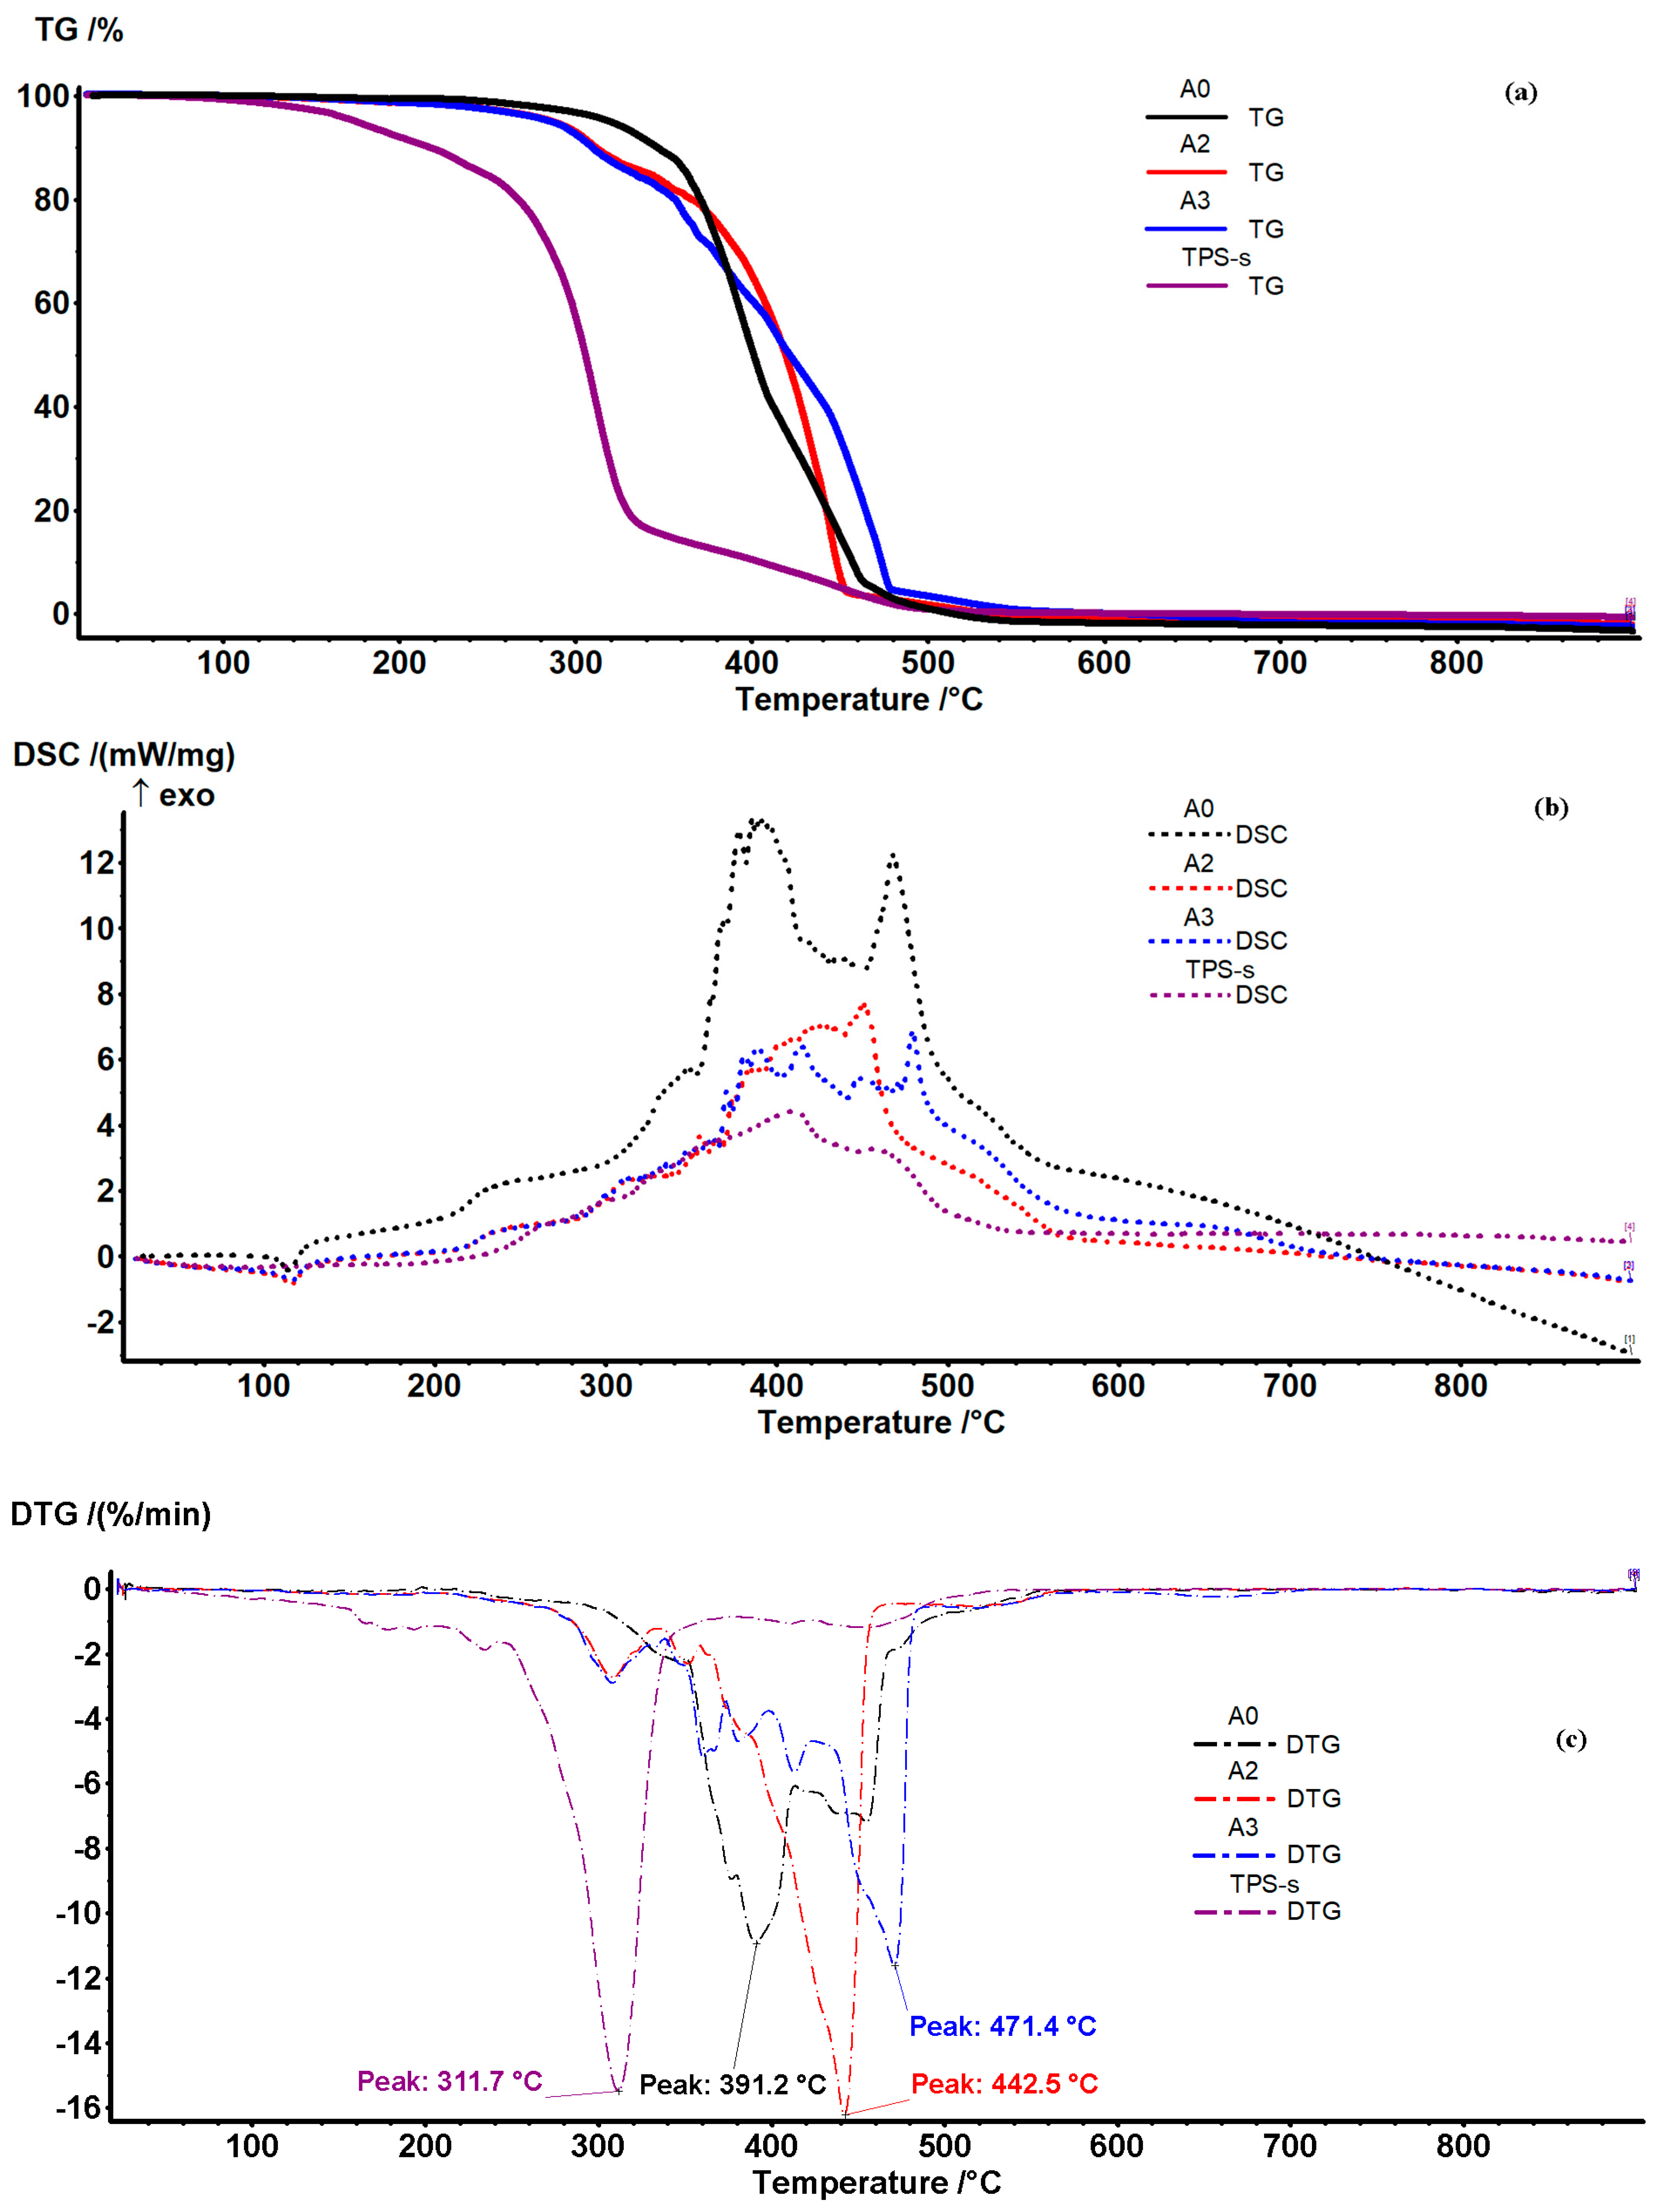
3.3. Complex Thermal Analysis TG-DSC-FTIR
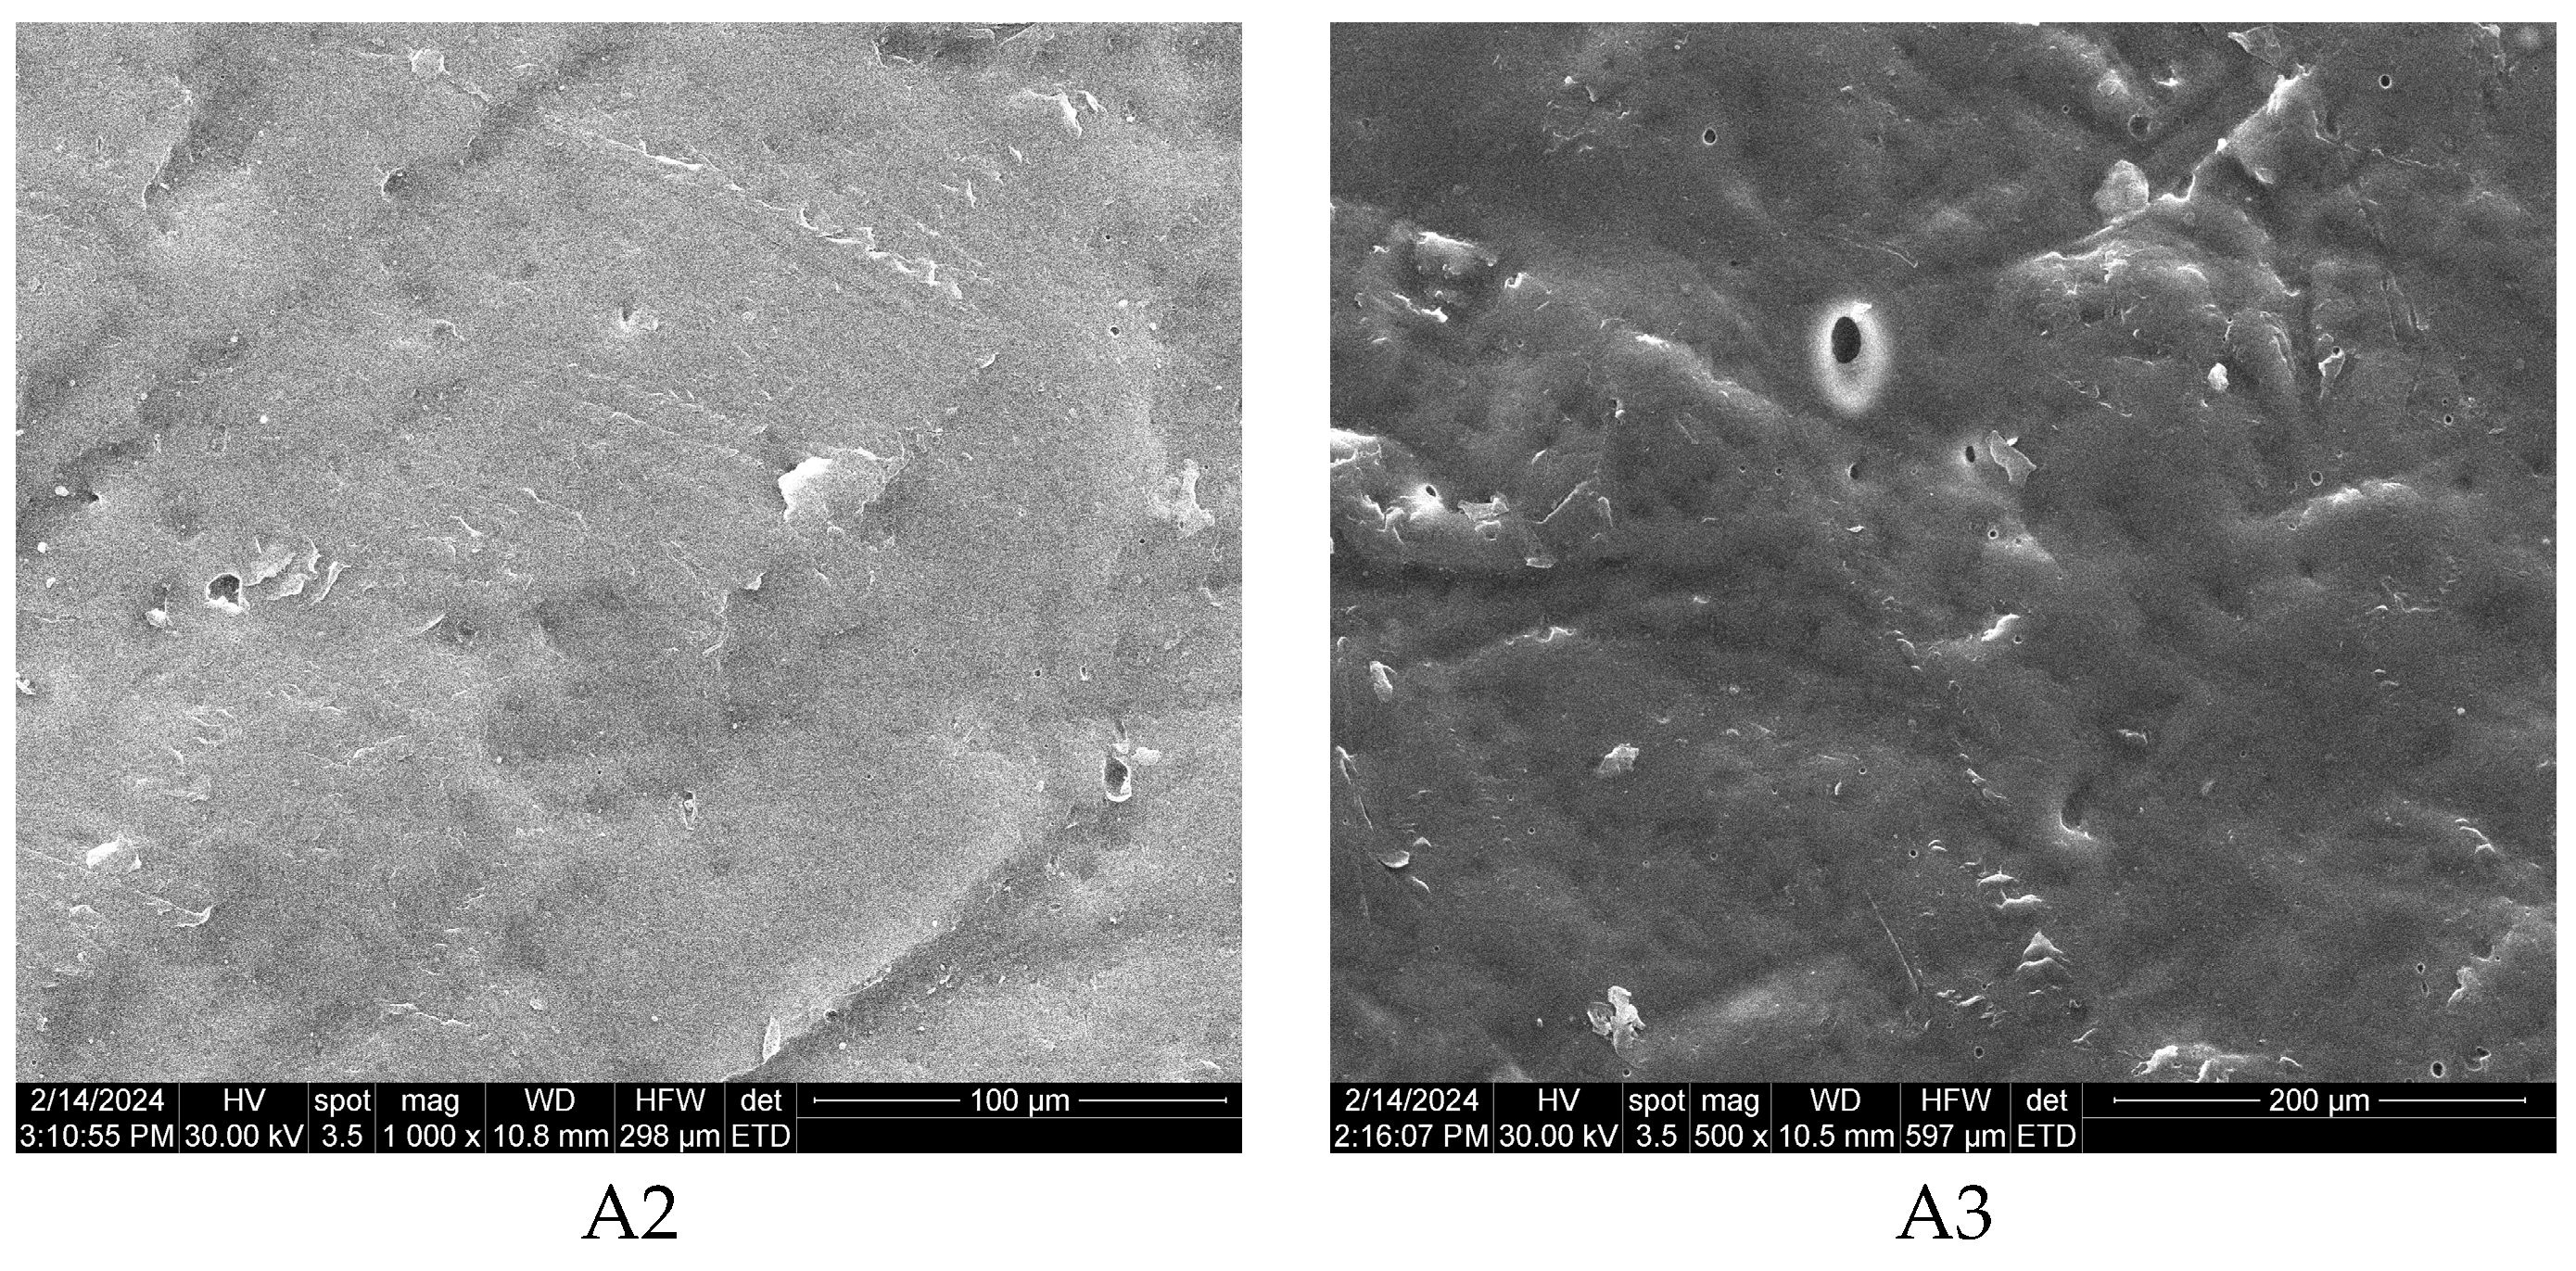
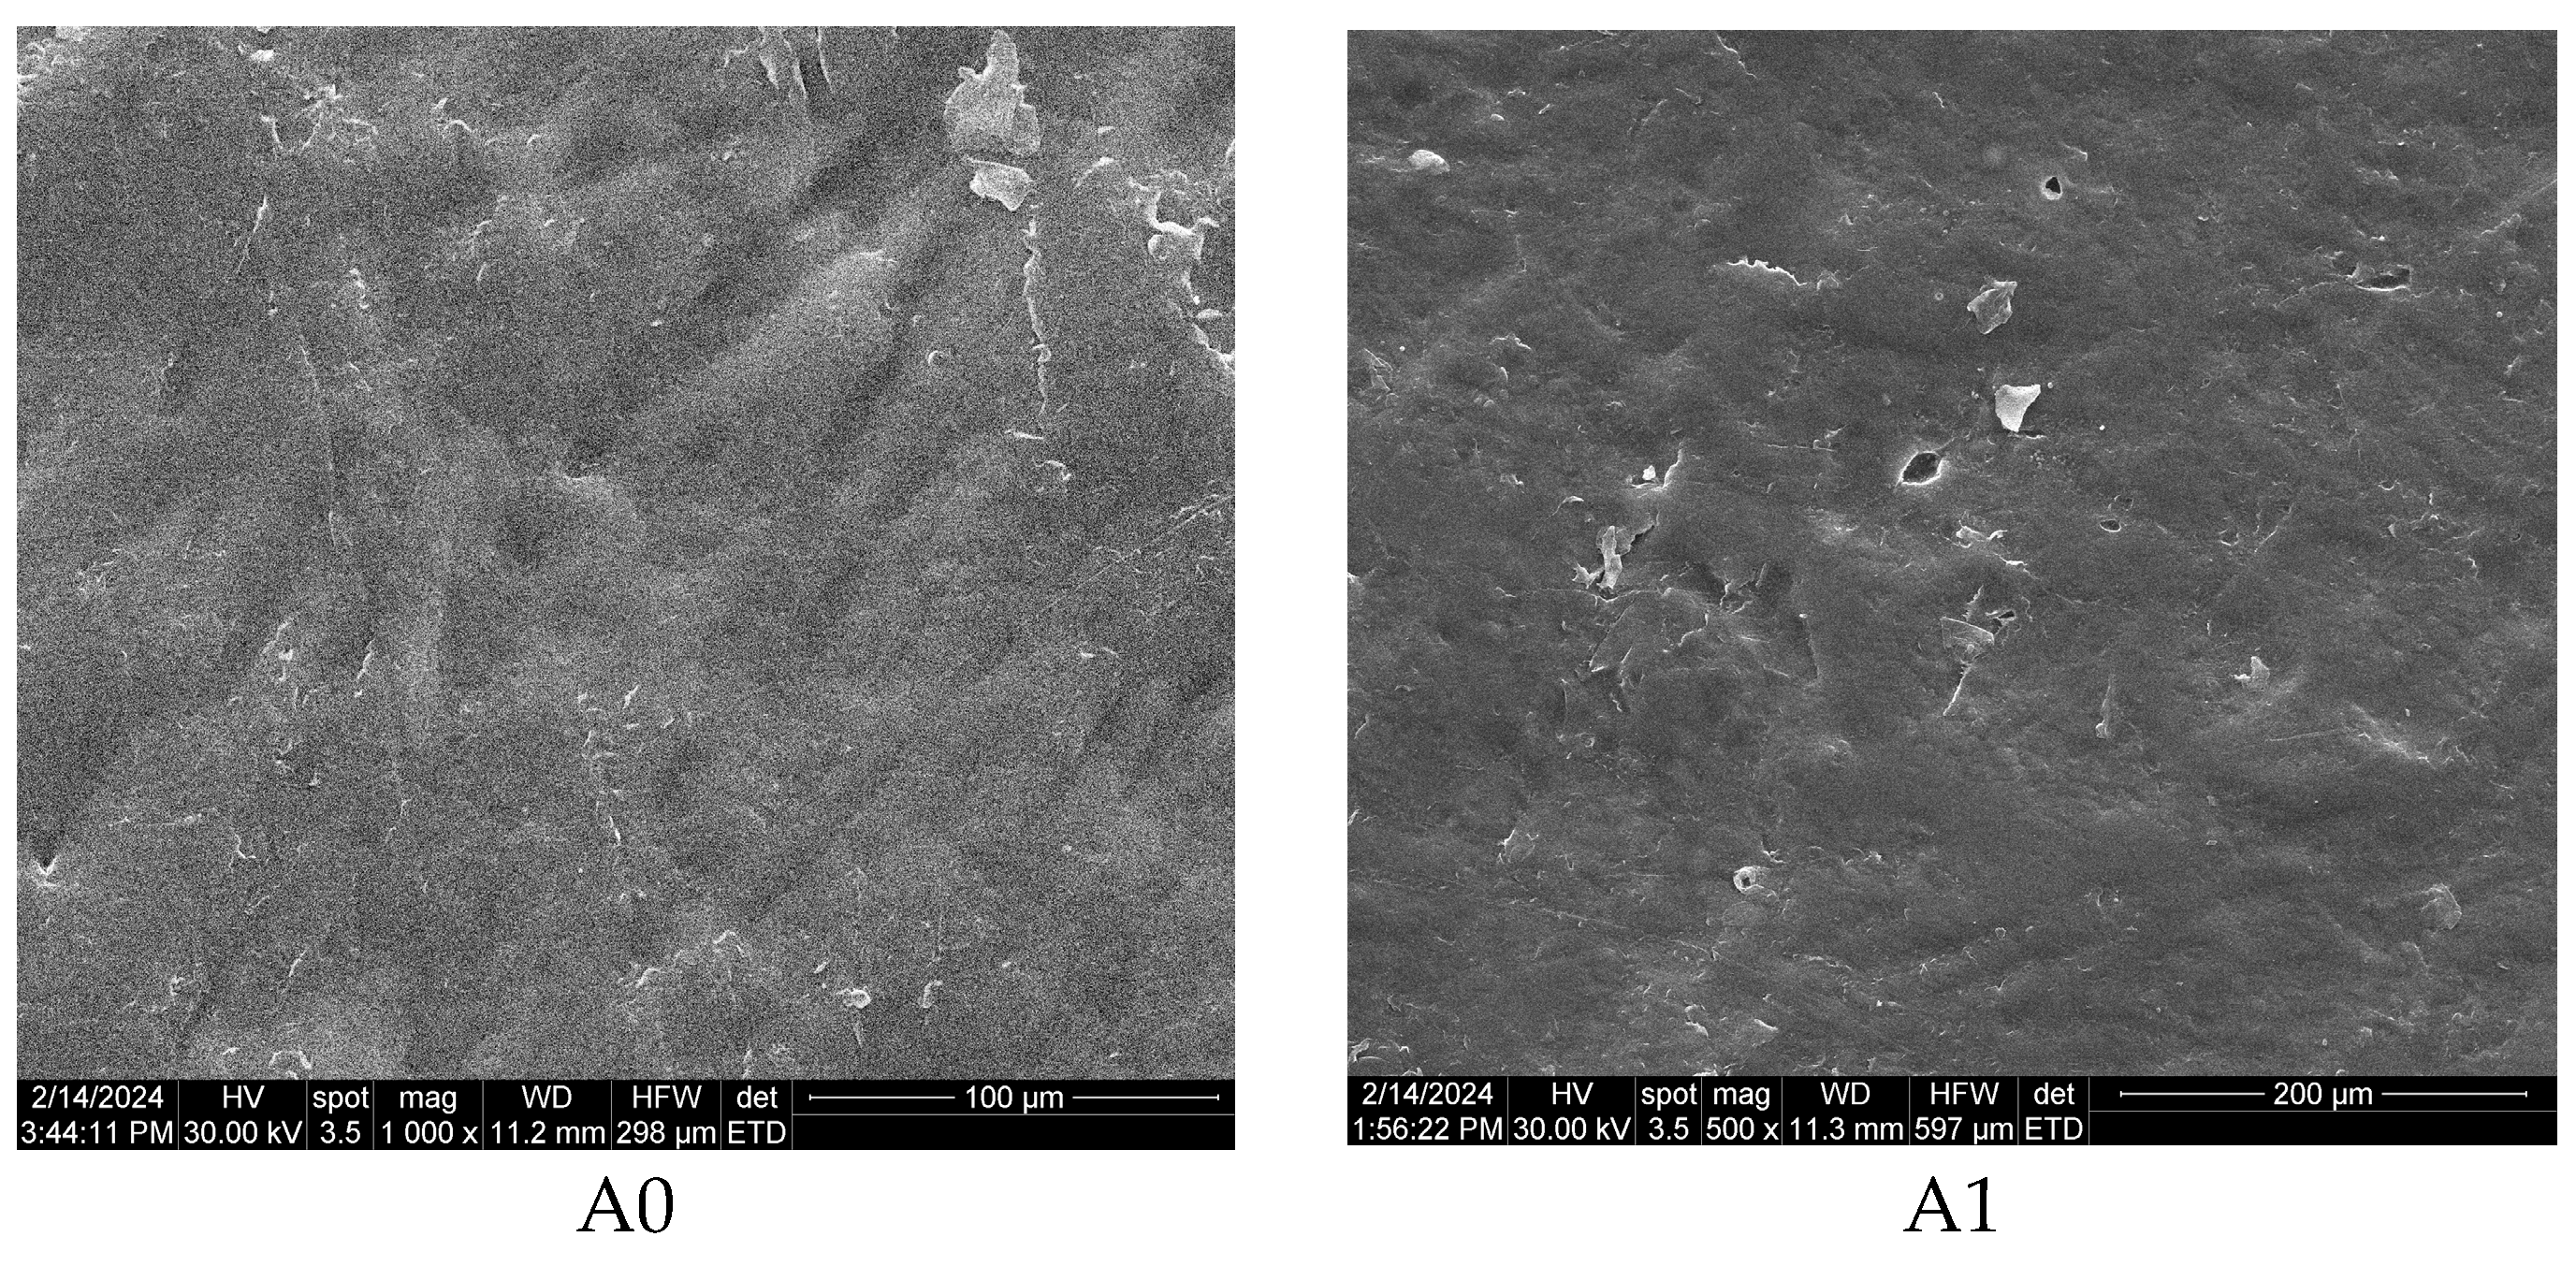
3.4. Scanning Electron Microscopy—SEM
4. Conclusions
Author Contributions
Funding
Data Availability Statement
Conflicts of Interest
References
- Motelica, L.; Ficai, D.; Oprea, O.C.; Ficai, A.; Andronescu, E. Smart food packaging designed by nanotechnological and drug delivery approaches. Coatings 2020, 10, 806. [Google Scholar] [CrossRef]
- Motelica, L.; Ficai, D.; Ficai, A.; Oprea, O.C.; Kaya, D.A.; Andronescu, E. Biodegradable antimicrobial food packaging: Trends and perspectives. Foods 2020, 9, 1438. [Google Scholar] [CrossRef]
- Zdanowicz, M. Influence of herbal extract on physicochemical properties of thermoplastic starch films. Polymers 2024, 16, 64. [Google Scholar] [CrossRef] [PubMed]
- Rodriguez-Gonzalez, F.J.; Ramsay, B.A.; Favis, B.D. High performance ldpe/thermoplastic starch blends: A sustainable alternative to pure polyethylene. Polymer 2003, 44, 1517–1526. [Google Scholar] [CrossRef]
- Park, D.I.; Dong, Y.Z.; Wang, S.Z.; Lee, S.J.; Choi, H.J. Rheological characteristics of starch-based biodegradable blends. Polymers 2023, 15, 1953. [Google Scholar] [CrossRef] [PubMed]
- Amin, A.M.M.; Sauid, S.M.; Hamid, K.H.K.; Musa, M. Biodegradation behaviour of thermoplastic starch films derived from starch under controlled composting condition. IOP Conf. Ser. Mater. Sci. Eng. 2018, 358, 012050. [Google Scholar] [CrossRef]
- Jeziorska, R.; Szadkowska, A.; Studzinski, M.; Chmielarek, M.; Spasowka, E. Morphology and selected properties of modified potato thermoplastic starch. Polymers 2023, 15, 1762. [Google Scholar] [CrossRef] [PubMed]
- Tavares, L.; Sousa, L.R.; da Silva, S.M.; Lima, P.S.; Oliveira, J.M. Moisture sorption isotherms and thermodynamic properties of biodegradable polymers for application in food packaging industry. Polymers 2023, 15, 1634. [Google Scholar] [CrossRef] [PubMed]
- Teran, J.L.L.; Maldonado, E.V.C.; Rangel, J.D.A.; Otazo, J.P.; Rico, M.I.B.; Xie, F. Development of antibacterial thermoplastic starch with natural oils and extracts: Structural, mechanical and thermal properties. Polymers 2024, 16, 180. [Google Scholar] [CrossRef]
- Said, N.S.; Olawuyi, I.F.; Lee, W.Y. Tailoring pectin-pla bilayer film for optimal properties as a food pouch material. Polymers 2024, 16, 712. [Google Scholar] [CrossRef]
- Bangar, S.P.; Whiteside, W.S.; Ashogbon, A.O.; Kumar, M. Recent advances in thermoplastic starches for food packaging: A review. Food Packag. Shelf 2021, 30, 100743. [Google Scholar] [CrossRef]
- Lara, S.C.; Salcedo, F. Gelatinization and retrogradation phenomena in starch/montmorillonite nanocomposites plasticized with different glycerol/water ratios. Carbohyd. Polym. 2016, 151, 206–212. [Google Scholar] [CrossRef]
- Tessanan, W.; Phinyocheep, P.; Amornsakchai, T. Sustainable materials with improved biodegradability and toughness from blends of poly(lactic acid), pineapple stem starch and modified natural rubber. Polymers 2024, 16, 232. [Google Scholar] [CrossRef] [PubMed]
- Radfar, R.; Hosseini, H.; Farhoodi, M.; Srednicka-Tober, D.; Ghasemi, I.; Fathi, M.; Khaneghah, A.M. Factors affecting mechanical properties of low-density polyethylene (ldpe)/starch blends: A review. Carpathian J. Food Sci. Technol. 2020, 12, 6–26. [Google Scholar]
- Grgic, D.K.; Miloloza, M.; Bulatovic, V.O.; Ukic, S.; Slouf, M.; Gajdosova, V. Screening the efficacy of a microbial consortium of bacteria and fungi isolated from different environmental samples for the degradation of ldpe/tps films. Separations 2023, 10, 79. [Google Scholar] [CrossRef]
- Nituica, M.; Oprea, O.; Stelescu, M.D.; Sonmez, M.; Georgescu, M.; Alexandrescu, L.; Motelica, L. Polymeric biocomposite based on thermoplastic polyurethane (tpu) and protein and elastomeric waste mixture. Materials 2023, 16, 5279. [Google Scholar] [CrossRef] [PubMed]
- Li, G.; Favis, B.D. Morphology development and interfacial interactions in polycaprolactone/thermoplastic-starch blends. Macromol. Chem. Phys. 2010, 211, 321–333. [Google Scholar] [CrossRef]
- Raquez, J.M.; Nabar, Y.; Narayan, R.; Dubois, P. In situ compatibilization of maleated thermoplastic starch/polyester melt-blends by reactive extrusion. Polym. Eng. Sci. 2008, 48, 1747–1754. [Google Scholar] [CrossRef]
- Mohanty, S.; Nayak, S. Starch based biodegradable pbat nanocomposites: Effect of starch modification on mechanical, thermal, morphological and biodegradability behavior. Int. J. Plast. Technol. 2009, 13, 163–185. [Google Scholar] [CrossRef]
- Ni, Z.B.; Shi, J.A.; Li, M.Y.; Lei, W.; Yu, W.W. Fdm 3d printing and soil-burial-degradation behaviors of residue of astragalus particles/thermoplastic starch/poly(lactic acid) biocomposites. Polymers 2023, 15, 2382. [Google Scholar] [CrossRef]
- Huneault, M.A.; Li, H.B. Morphology and properties of compatibilized polylactide/thermoplastic starch blends. Polymer 2007, 48, 270–280. [Google Scholar] [CrossRef]
- Rodriguez-Gonzalez, F.J.; Virgilio, N.; Ramsay, B.A.; Favis, B.D. Influence of melt drawing on the morphology of one- and two-step processed ldpe/thermoplastic starch blends. Adv. Polym. Tech. 2003, 22, 297–305. [Google Scholar] [CrossRef]
- Taguet, A.; Huneault, M.A.; Favis, B.D. Interface/morphology relationships in polymer blends with thermoplastic starch. Polymer 2009, 50, 5733–5743. [Google Scholar] [CrossRef]
- Dewi, R.; Sylvia, N.; Zulnazri; Riza, M. Melt flow index (mfi) analysis of sago based thermoplastic starch blend with polypropylene and polyethylene. Mater. Today Proc. 2023, 87, 396–400. [Google Scholar] [CrossRef]
- Hong, S.I.; Wang, L.F.; Rhim, J.W. Preparation and characterization of nanoclays-incorporated polyethylene/thermoplastic starch composite films with antimicrobial activity. Food Packag. Shelf 2022, 31, 100784. [Google Scholar] [CrossRef]
- Carvalho, B.O.; Gonçalves, L.P.C.; Mendonça, P.V.; Pereira, J.P.; Serra, A.C.; Coelho, J.F.J. Replacing harmful flame retardants with biodegradable starch-based materials in polyethylene formulations. Polymers 2023, 15, 4078. [Google Scholar] [CrossRef] [PubMed]
- Fortelny, I.; Juza, J. The effects of copolymer compatibilizers on the phase structure evolution in polymer blends—A review. Materials 2021, 14, 7786. [Google Scholar] [CrossRef]
- Parameswaranpillai, J.; Thomas, S.; Grohens, Y. Polymer Blends: State of the Art, New Challenges, and Opportunities; Wiley-VCH Verlag GmbH & Co. KgaA: Hoboken, NJ, USA, 2014. [Google Scholar]
- Willett, J.L. Mechanical-properties of ldpe granular starch composites. J. Appl. Polym. Sci. 1994, 54, 1685–1695. [Google Scholar] [CrossRef]
- Prinos, J.; Bikiaris, D.; Theologidis, S.; Panayiotou, C. Preparation and characterization of ldpe/starch blends containing ethylene/vinyl acetate copolymer as compatibilizer. Polym. Eng. Sci. 1998, 38, 954–964. [Google Scholar] [CrossRef]
- Huneault, M.A.; Li, H.B. Preparation and properties of extruded thermoplastic starch/polymer blends. J. Appl. Polym. Sci. 2012, 126, E96–E108. [Google Scholar] [CrossRef]
- Mazerolles, T.; Heuzey, M.C.; Soliman, M.; Martens, H.; Kleppinger, R.; Huneault, M.A. Development of co-continuous morphology in blends of thermoplastic starch and low-density polyethylene. Carbohyd. Polym. 2019, 206, 757–766. [Google Scholar] [CrossRef] [PubMed]
- Li, G.; Sarazin, P.; Orts, W.J.; Imam, S.H.; Favis, B.D. Biodegradation of thermoplastic starch and its blends with poly(lactic acid) and polyethylene: Influence of morphology. Macromol. Chem. Phys. 2011, 212, 1147–1154. [Google Scholar] [CrossRef]
- Tena-Salcido, C.S.; Rodriguez-Gonzalez, F.J.; Mendez-Hernandez, M.L.; Contreras-Esquivel, J.C. Effect of morphology on the biodegradation of thermoplastic starch in ldpe/tps blends. Polym. Bull. 2008, 60, 677–688. [Google Scholar] [CrossRef]
- Sabetzadeh, M.; Bagheri, R.; Masoomi, M. Study on ternary low density polyethylene/linear low density polyethylene/thermoplastic starch blend films. Carbohyd. Polym. 2015, 119, 126–133. [Google Scholar] [CrossRef] [PubMed]
- Martins, P.C.; Latorres, J.M.; Martins, V.G.; Machado, A.V. Effect of starch nanocrystals addition on the physicochemical, thermal, and optical properties of low-density polyethylene (ldpe) films. Polym. Eng. Sci. 2022, 62, 1786–1796. [Google Scholar] [CrossRef]
- Nouri, M.; Mehrabzadeh, M. Studies on rheological behaviour of ldpe/epdm blends using a torque rheometer. Iran. Polym. J. 1996, 5, 237–241. [Google Scholar]
- Zaman, H.; Beg, M.D.H. Study on binary low-density polyethylene (ldpe)/thermoplastic sago starch (tps) blend composites. Prog. Appl. Sci. Technol. 2021, 11, 53–65. [Google Scholar]
- Rosa, D.S.; Guedes, C.G.F.; Pedroso, A.G. Gelatinized and nongelatinized corn starch/poly(epsilon-caprolactone) blends: Characterization by rheological, mechanical and morphological properties. Polimeros 2004, 14, 181–186. [Google Scholar] [CrossRef]
- Majid, R.A.; Ismail, H.; Taib, R.M. Effects of pe-g-ma on tensile properties, morphology and water absorption of ldpe/thermoplastic sago starch blends. Polym.-Plast. Technol. 2009, 48, 919–924. [Google Scholar] [CrossRef]
- Güney, O.; Bilici, I.; Dogan, D.; Metin, A.U. Mechanical and thermal properties of recycled polyethylene/surface treated hemp fiber bio-composites. Polym. Compos. 2023, 44, 4976–4992. [Google Scholar] [CrossRef]
- ISO37; Rubber, Vulcanized or Thermoplastic—Determination of Tensile Stress-Strain Properties. ISO: Geneva, Switzerland, 2017. Available online: https://standards.iteh.ai/catalog/standards/sist/6a945c64-8670-4205-98c7-6db5bd780201/iso-37-2017 (accessed on 5 March 2024).
- ISO34-1; Rubber, Vulcanized or Thermoplastic—Determination of Tear Strength. Part 1 Trouser, Angle and Crescent Test Pieces. ISO: Geneva, Switzerland, 2015. Available online: https://standards.iteh.ai/catalog/standards/sist/a2b8314d-13fd-46cb-aad6-44293c0246a2/iso-34-1-2015 (accessed on 5 March 2024).
- ISO868; Plastics and Ebonite—Determination of Indentation Hardness by Means of a Durometer (Shore Hardness). ISO: Geneva, Switzerland, 2003. Available online: https://standards.iteh.ai/catalog/standards/sist/b00a2780-f641-4857-8bb1-eb0d574b4af3/iso-868-2003 (accessed on 5 March 2024).
- ISO4662; Rubber, Vulcanized or Thermoplastic—Determination of Rebound Resilience. ISO, 2017. Available online: https://standards.iteh.ai/catalog/standards/sist/7b982f0b-3f32-4680-a24e-366e7de34bbd/iso-4662-2017 (accessed on 5 March 2024).
- ISO1133; Plastics—Determination of the Melt Mass-Flow Rate (mfr) and Melt Volume-Flow Rate (mvr) of Thermoplastics. Part 1 Standard Method. ISO: Vernier, Geneva. Available online: https://standards.iteh.ai/catalog/standards/sist/77dcf130-b606-4799-9315-a824a7f841ce/iso-1133-1-2022 (accessed on 5 March 2024).
- Pham, N.T.H. Characterization of low-density polyethylene and ldpe-based/ethylene-vinyl acetate with medium content of vinyl acetate. Polymers 2021, 13, 2352. [Google Scholar] [CrossRef] [PubMed]
- Liang, X.B.; Ito, M.; Nakajima, K. Reinforcement mechanism of carbon black-filled rubber nanocomposite as revealed by atomic force microscopy nanomechanics. Polymers 2021, 13, 3922. [Google Scholar] [CrossRef] [PubMed]
- Robertson, C.G.; Hardman, N.J. Nature of carbon black reinforcement of rubber: Perspective on the original polymer nanocomposite. Polymers 2021, 13, 538. [Google Scholar] [CrossRef] [PubMed]
- Stelescu, D.M.; Airinei, A.; Homocianu, M.; Fifere, N.; Timpu, D.; Aflori, M. Structural characteristics of some high density polyethylene/epdm blends. Polym. Test. 2013, 32, 187–196. [Google Scholar] [CrossRef]
- Fonseca-García, A.; Osorio, B.H.; Aguirre-Loredo, R.Y.; Calambas, H.L.; Caicedo, C. Miscibility study of thermoplastic starch/polylactic acid blends: Thermal and superficial properties. Carbohyd. Polym. 2022, 293, 119744. [Google Scholar] [CrossRef] [PubMed]
- Paluch, M.; Ostrowska, J.; Tynski, P.; Sadurski, W.; Konkol, M. Structural and thermal properties of starch plasticized with glycerol/urea mixture. J. Polym. Environ. 2022, 30, 728–740. [Google Scholar] [CrossRef]
- Motelica, L.; Vasile, B.-S.; Ficai, A.; Surdu, V.-A.; Ficai, D.; Oprea, O.C.; Andronescu, E.; Mustățea, G.; Ungureanu, E.L.; Dobre, A.A. Antibacterial activity of zinc oxide nanoparticles loaded with essential oils. Pharmaceutics 2023, 15, 2470. [Google Scholar] [CrossRef] [PubMed]
- Smith, B.C. The infrared spectra of polymers ii: Polyethylene. Spectroscopy 2021, 36, 24–29. [Google Scholar] [CrossRef]
- Depan, D.; Chirdon, W.; Khattab, A. Morphological and chemical analysis of low-density polyethylene crystallized on carbon and clay nanofillers. Polymers 2021, 13, 1558. [Google Scholar] [CrossRef]
- Agosti, E.; Zerbi, G.; Ward, I.M. Structure of the skin and core of ultradrawn polyethylene films by vibrational spectroscopy. Polymer 1992, 33, 4219–4229. [Google Scholar] [CrossRef]
- Painter, P.C.; Havens, J.; Hart, W.W.; Koenig, J.L. Fourier-transform ir spectroscopic investigation of polyethylene single-crystals.1. Fine-structure of ch2 rocking mode. J. Polym. Sci. Pol. Phys. 1977, 15, 1237–1249. [Google Scholar] [CrossRef]
- Huang, J.B.; Hong, J.W.; Urban, M.W. Attenuated total reflectance fourier-transform infrared studies of crystalline amorphous content on polyethylene surfaces. Polymer 1992, 33, 5173–5178. [Google Scholar] [CrossRef]
- Fontana, L.; Santoro, M.; Bini, R.; Vinh, D.Q.; Scandolo, S. High-pressure vibrational properties of polyethylene. J. Chem. Phys. 2010, 133, 204502. [Google Scholar] [CrossRef] [PubMed]
- Roy, S.; De, P.P. Use of ldpe as matrix material in rubber sample preparation for ir analysis. Polym. Test. 1992, 11, 3–11. [Google Scholar] [CrossRef]
- Leroy, L.; Stoclet, G.; Lefebvre, J.M.; Gaucher, V. Mechanical behavior of thermoplastic starch: Rationale for the temperature-relative humidity equivalence. Polymers 2022, 14, 2531. [Google Scholar] [CrossRef] [PubMed]
- Liu, P.; Yu, L.; Wang, X.Y.; Li, D.; Chen, L.; Li, X.X. Glass transition temperature of starches with different amylose/amylopectin ratios. J. Cereal. Sci. 2010, 51, 388–391. [Google Scholar] [CrossRef]
- Poh, L.; Wu, Q.; Chen, Y.D.; Narimissa, E. Characterization of industrial low-density polyethylene: A thermal, dynamic mechanical, and rheological investigation. Rheol. Acta 2022, 61, 701–720. [Google Scholar] [CrossRef]
- Wunderlich, B. Appendix—Athas Table of Thermal Properties of Linear Macromolecules; Academic Press: London, UK, 1990; pp. 417–431. [Google Scholar]
- Suslova, T.N.; Salakhov, I.I.; Nikonorova, V.N.; Gilaeva, G.V.; Trifonova, O.M. Biodegradation features of composite materials based on high-density polyethylene and starch. Microbiology 2023, 92, 695–703. [Google Scholar] [CrossRef]


| Material | Producer | Role | Characteristics |
|---|---|---|---|
| Low-density polyethylene (LDPE) TIPOLEN MF 243-51 | MOL Petrochemicals Co., Ltd., Tiszaújváros, Hungary | Polymer matrix | MFR—Melt Mass Flow Rate (190 °C, 2.16 kg) 20 g/10 min; density: 0.922 g/cm3; Vicat softening temperature 90 °C |
| Soluble starch from potatoes | Lach-Ner, Neratovice Czech Republic | Organic filler | Water insoluble substances 0.28%, loss on drying (105 °C) 17.52% |
| Glycerol | Lach-Ner, Neratovice, Czech Republic | Plasticizer | Acidity 0.02%, density 1.26 g/cm3 |
| Sorbitol | Thermo Scientific, Brno, Czech Republic | Plasticizer | D-sorbitol 97% |
| Citric acid anhydrous | Reanal Laborvegyszer Kft., Budapest, Hungary | Compatibilizing agent | C8H8O7, molecular weight of 192.13 g/mol, purity 99.8%, sulphate ash < 0.02%, chlorides (Cl) < 0.0005%, sulphates (SO4) < 0.02%, oxalates (C2O4) < 0.05% |
| LDPE-g-AM Admer NF 468E | Mitsui Chemicals Europe GmbH, Düsseldorf, Germany | Compatibilizing agent | Density 0.92 g/cm3, melting point 120 °C |
| EPDM Rubber Nordel 47130 | Dupont Elastomer, Wilmington, DE, USA | Elastomer | Containing 67% (wt) ethylene and 4.9% (wt) 5-ethylidene-2-norbornene; Degree of crystallinity 9%, density 0.97 g/cm3; carbon black amount: 28% Mw = 308,000; Tc = 8 °C |
| Ingredients | Sample Code | |||
|---|---|---|---|---|
| A0 | A1 | A2 | A3 | |
| LDPE, (g) | 260 | 235 | 225 | 200 |
| TPS-s, (g) | - | 25 | 25 | 25 |
| LDPE-g-AM, (g) | - | - | 10 | 10 |
| EPDM, (g) | - | - | - | 25 |
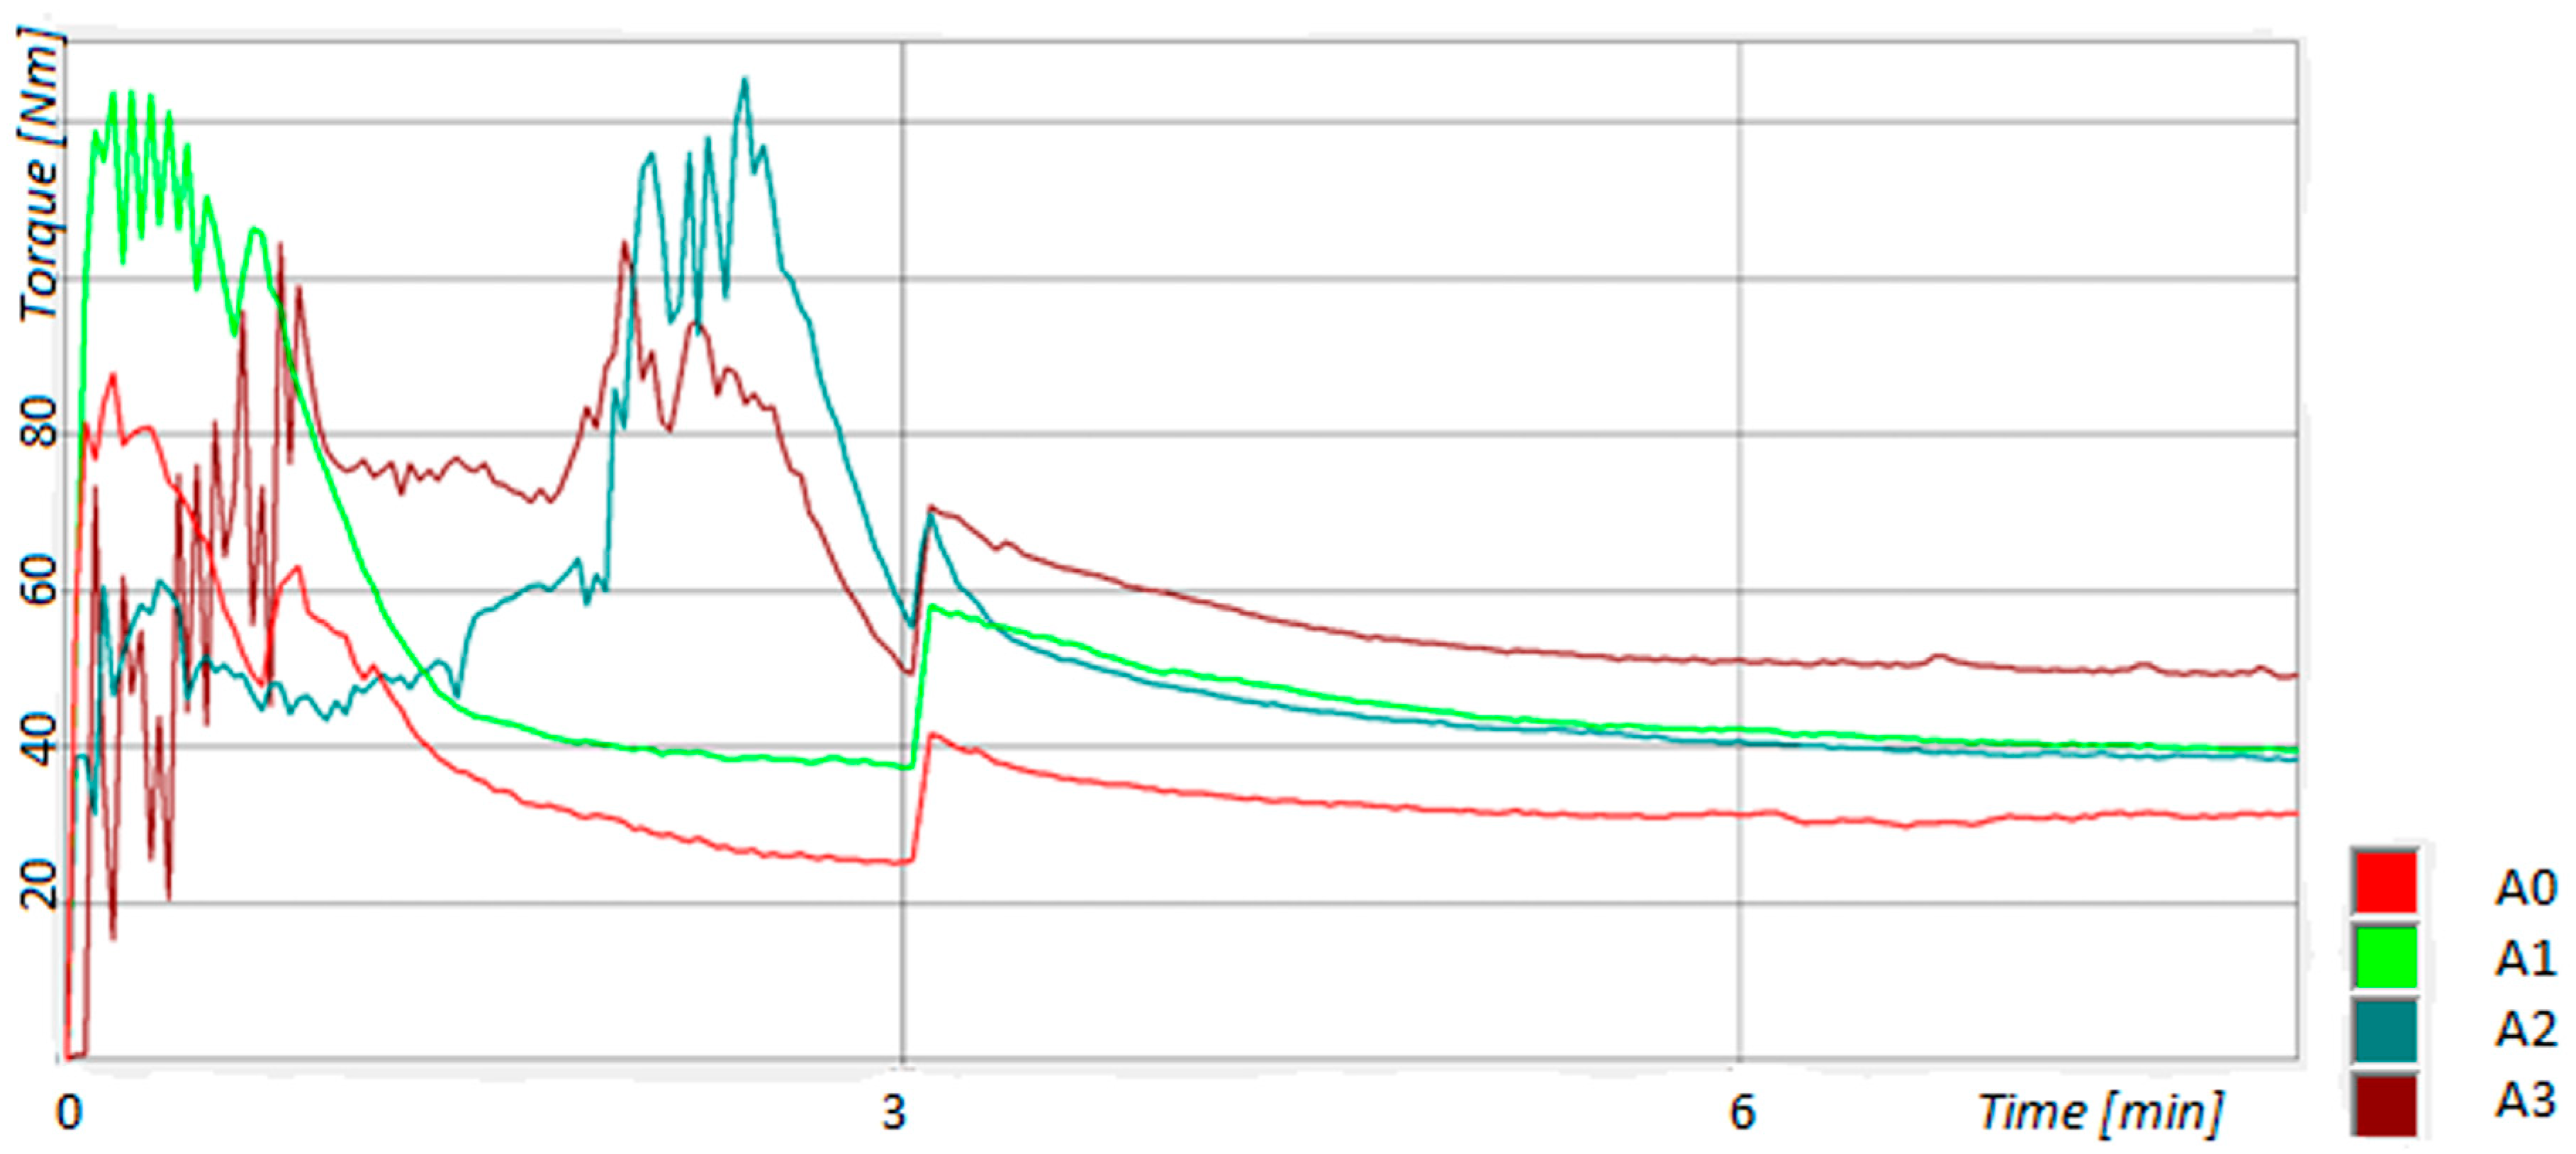
| Sample Code | Specific Energy, [kNm/g] | Torque Variation Range, [Nm] | Temperature Variation Range, [°C] |
|---|---|---|---|
| A0 | 0.4 | 31.7–87.9 | 105–153 |
| A1 | 0.7 | 37.6–124 | 103–155 |
| A2 | 0.7 | 36.9–113.3 | 92–154 |
| A3 | 0.8 | 47.5–104.5 | 80–159 |
| Characteristics | Sample Code | ||||
|---|---|---|---|---|---|
| TPS-s | A0 | A1 | A2 | A3 | |
| Rebound resilience, % | - | 18.0 ± 0.33 | 16.0 ± 0.58 | 16.0 ± 0.58 | 16.0 ± 0.58 |
| Tensile strength, N/mm2 | 4.25 ± 0.04 | 15.4 ± 0.67 | 13.36 ± 0.16 | 14.24 ± 0.17 | 11.29 ± 0.05 |
| Elongation at break, % | 40 ± 4.41 | 100.0 ± 2.89 | 60.0 ±2.89 | 80.0 ± 2.89 | 40.0 ± 0.58 |
| Tearing strength, N/mm | 20.5 ± 0.26 | 99.9 ± 4.45 | 55.6 ± 4.73 | 78.1 ± 1.67 | 61.0 ± 4.69 |
| Hardness, °Sh D | 31 ± 0.58 | 59 ± 0.33 | 56 ± 0.33 | 55 ± 0.33 | 53 ± 0.58 |
| MFI at 200 °C and 2.16 kg, g/10 min | - | 29.8 ± 017 | 26.1 ± 0.17 | 22.9 ± 0.97 | 14.9 ± 0.21 |
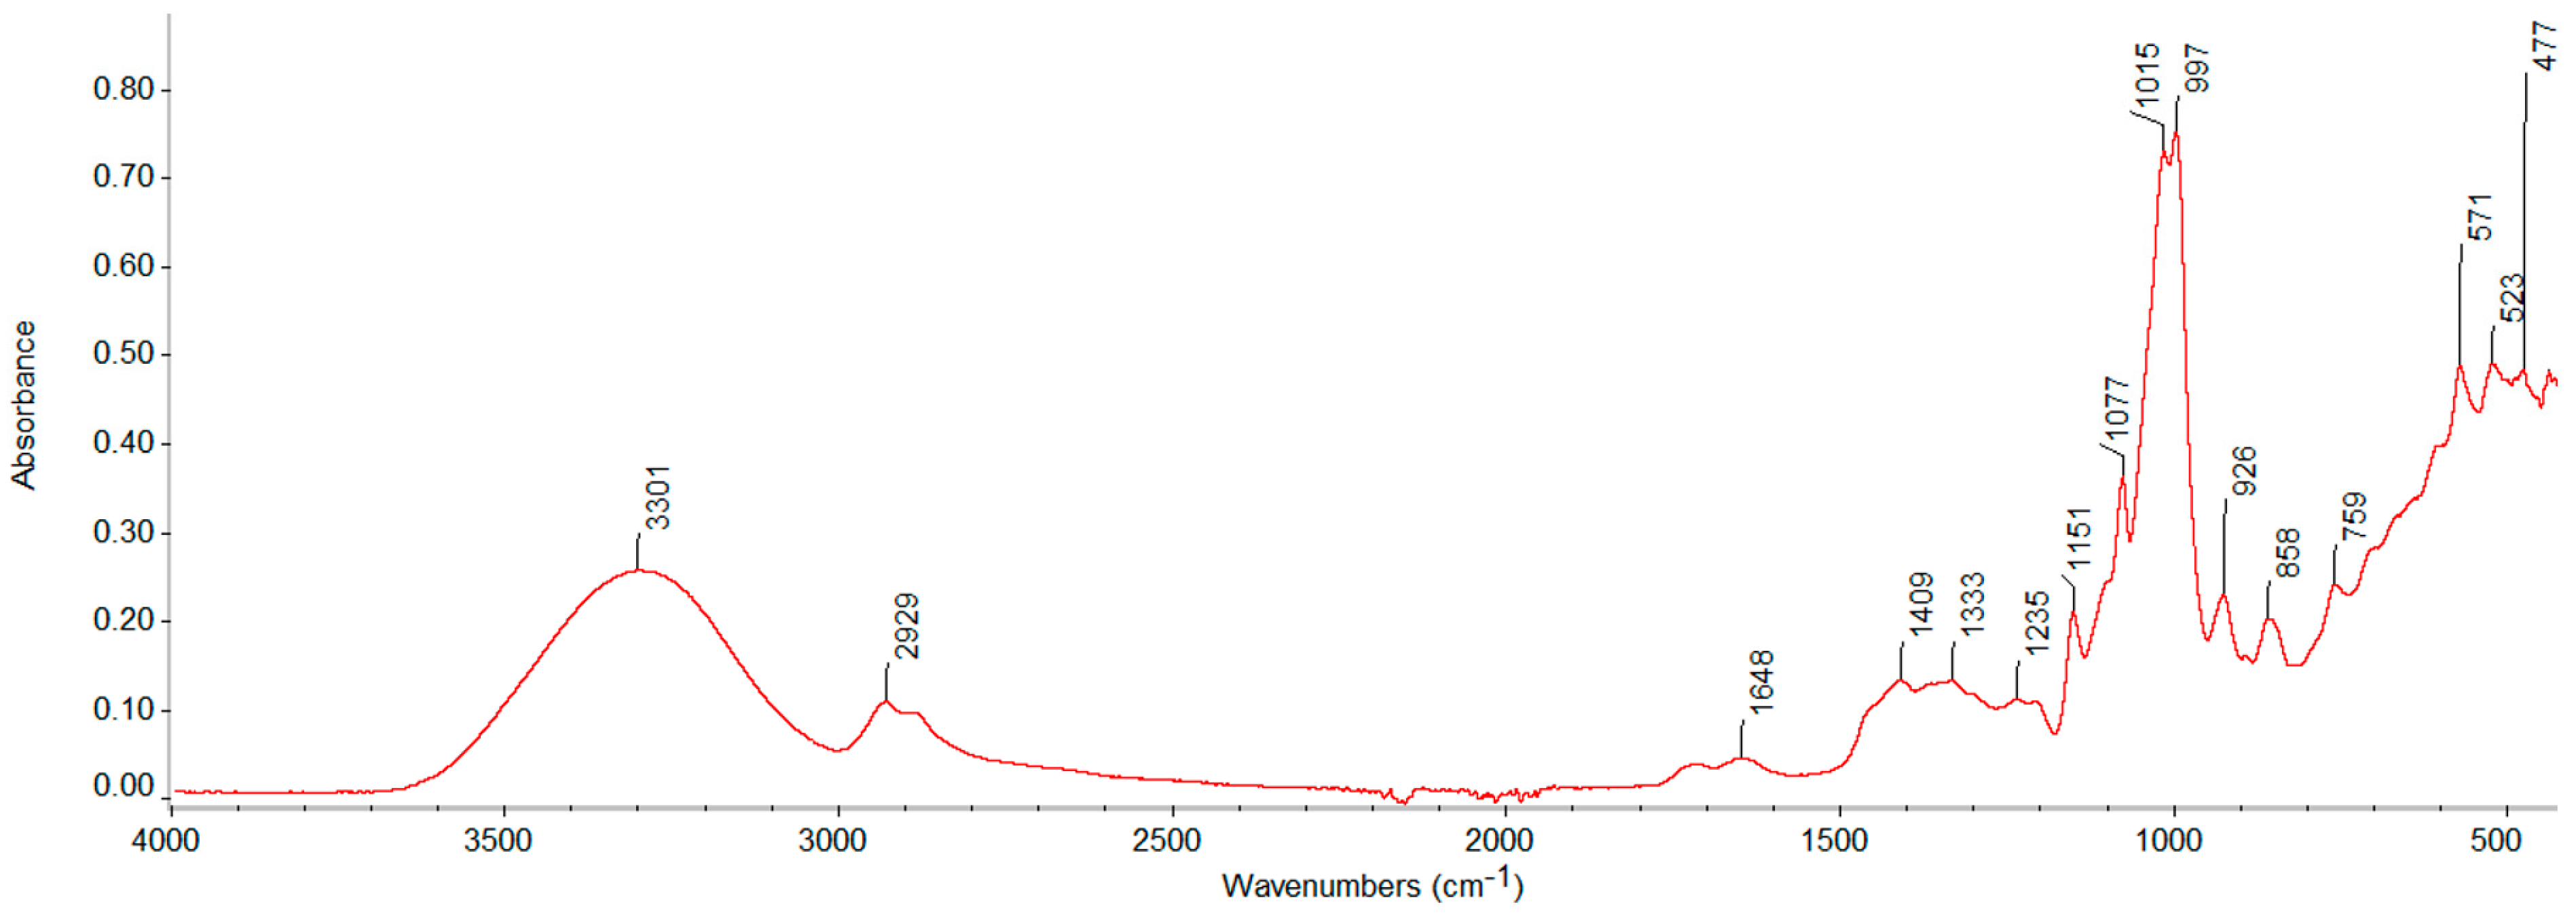
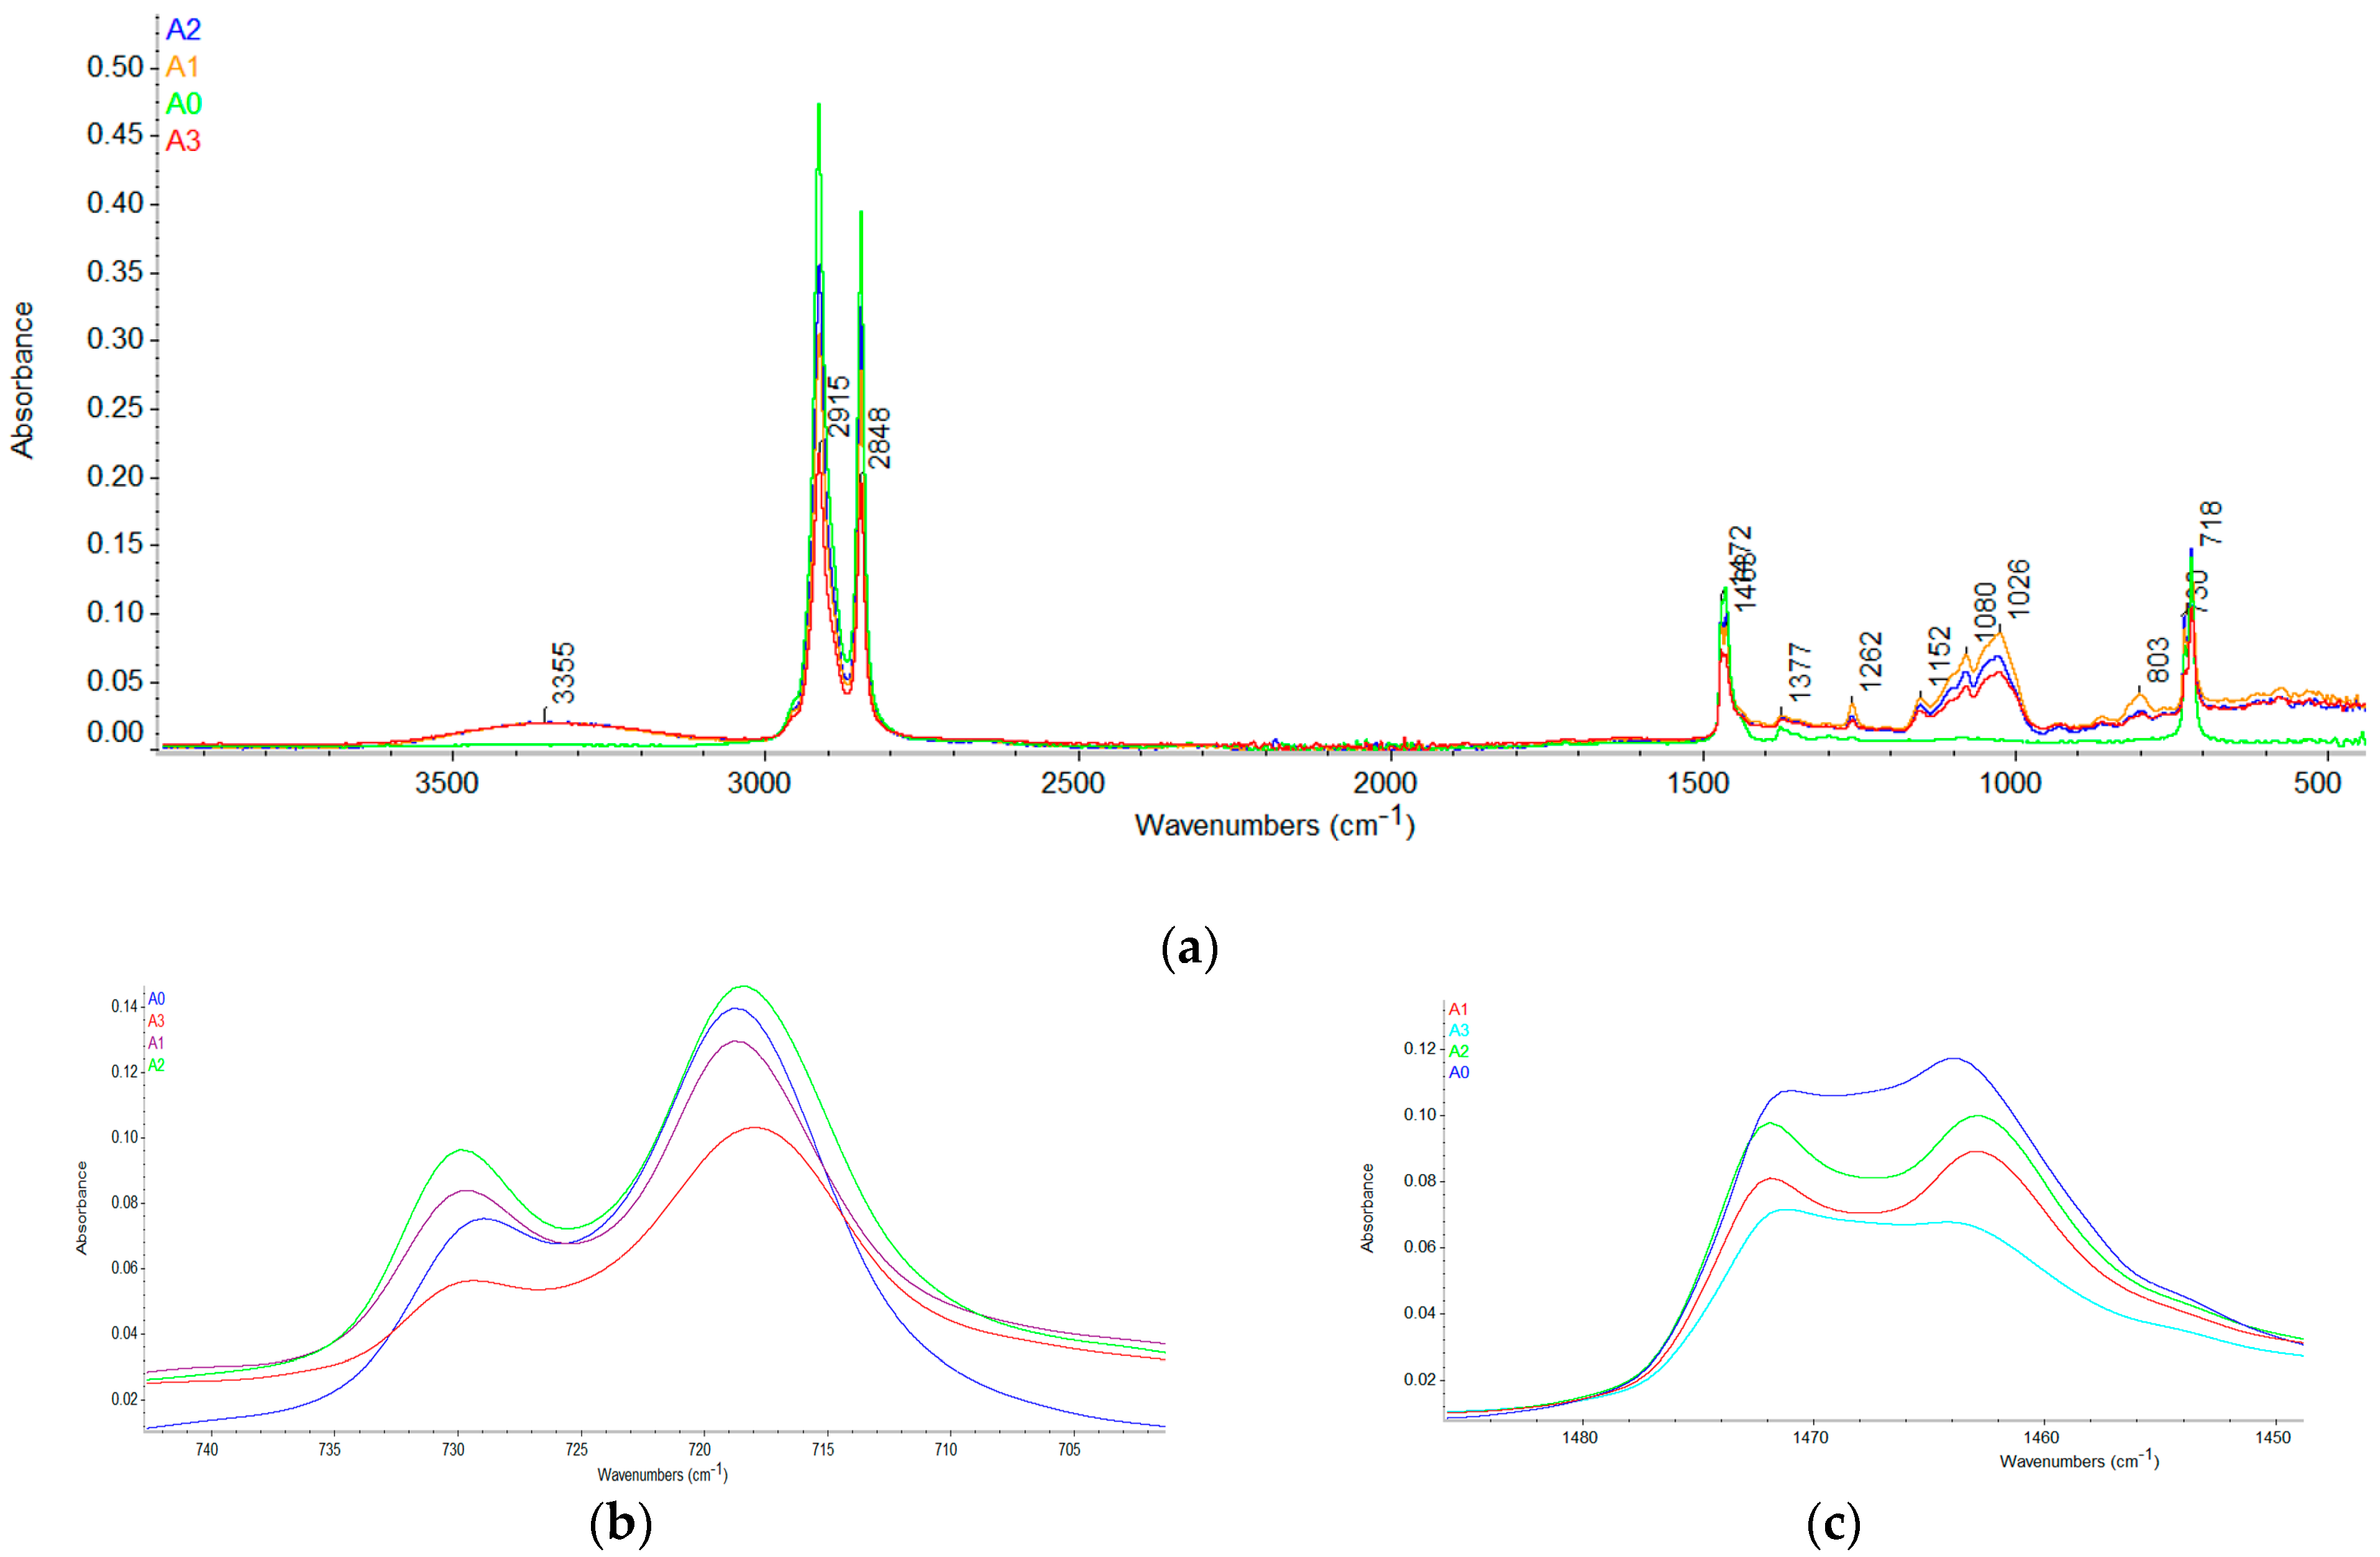
| Group Frequency (cm−1) | Functional Group/Assignment |
|---|---|
| 3299–3359 | O–H, hydroxyl group, H-bonded OH stretch (from TPS-s) |
| 2915–2929 | methylene asym/sym stretch (from starch, LDPE, EPDM) |
| 2848 | methyl asym/sym stretch (from starch, LDPE, EPDM) |
| 1471–1472 | Crystalline bending methylene (CH2) |
| 1463–1464 | Amorphous bending methylene (CH2) |
| 1333–1413 | tertiary alcohol, OH bend, methylene C–H bend, trimethyl or tert-butyl (multiplet) |
| 1262 | Primary or secondary, OH in-plane bend |
| 1010–1170 | primary, secondary, tertiary alcohols, C–O stretch, C–O–C, cyclic ethers, large rings, C–O stretch, C–O–C, alkyl-substituted ether, C–O stretch |
| 926–1024 | Cyclohexane ring vibrations (from starch) |
| 730 | Crystalline rock methylene (CH2) |
| 718–719 | Amorphous rock methylene (CH2) |
| Sample | T5% | T10% | Tdmax | Tm | ΔHm | Crystallinity Degree |
|---|---|---|---|---|---|---|
| TPS-s thermoplastic starch | 176 °C | 218 °C | 311.7 °C | - | - | - |
| A0 (PE) | 319 °C | 346 °C | 391.2 °C | 107.8 °C | −78.20 J/g | 26.68% |
| A2 | 287 °C | 312 °C | 442.5 °C | 107.0 °C | −74.23 J/g | 29.28% |
| A3 | 286 °C | 310 °C | 471.4 °C | 106.7 °C | −67.56 J/g | 29.98% |
Disclaimer/Publisher’s Note: The statements, opinions and data contained in all publications are solely those of the individual author(s) and contributor(s) and not of MDPI and/or the editor(s). MDPI and/or the editor(s) disclaim responsibility for any injury to people or property resulting from any ideas, methods, instructions or products referred to in the content. |
© 2024 by the authors. Licensee MDPI, Basel, Switzerland. This article is an open access article distributed under the terms and conditions of the Creative Commons Attribution (CC BY) license (https://creativecommons.org/licenses/by/4.0/).
Share and Cite
Stelescu, M.D.; Oprea, O.-C.; Motelica, L.; Ficai, A.; Trusca, R.-D.; Sonmez, M.; Nituica, M.; Georgescu, M. Obtaining and Characterizing New Types of Materials Based on Low-Density Polyethylene and Thermoplastic Starch. J. Compos. Sci. 2024, 8, 134. https://doi.org/10.3390/jcs8040134
Stelescu MD, Oprea O-C, Motelica L, Ficai A, Trusca R-D, Sonmez M, Nituica M, Georgescu M. Obtaining and Characterizing New Types of Materials Based on Low-Density Polyethylene and Thermoplastic Starch. Journal of Composites Science. 2024; 8(4):134. https://doi.org/10.3390/jcs8040134
Chicago/Turabian StyleStelescu, Maria Daniela, Ovidiu-Cristian Oprea, Ludmila Motelica, Anton Ficai, Roxana-Doina Trusca, Maria Sonmez, Mihaela Nituica, and Mihai Georgescu. 2024. "Obtaining and Characterizing New Types of Materials Based on Low-Density Polyethylene and Thermoplastic Starch" Journal of Composites Science 8, no. 4: 134. https://doi.org/10.3390/jcs8040134
APA StyleStelescu, M. D., Oprea, O.-C., Motelica, L., Ficai, A., Trusca, R.-D., Sonmez, M., Nituica, M., & Georgescu, M. (2024). Obtaining and Characterizing New Types of Materials Based on Low-Density Polyethylene and Thermoplastic Starch. Journal of Composites Science, 8(4), 134. https://doi.org/10.3390/jcs8040134