

Investigating the Influence of Fiber Content and Geometry on the Flexural Response of Fiber-Reinforced Cementitious Composites

Abstract
:1. Introduction
2. Materials and Methods
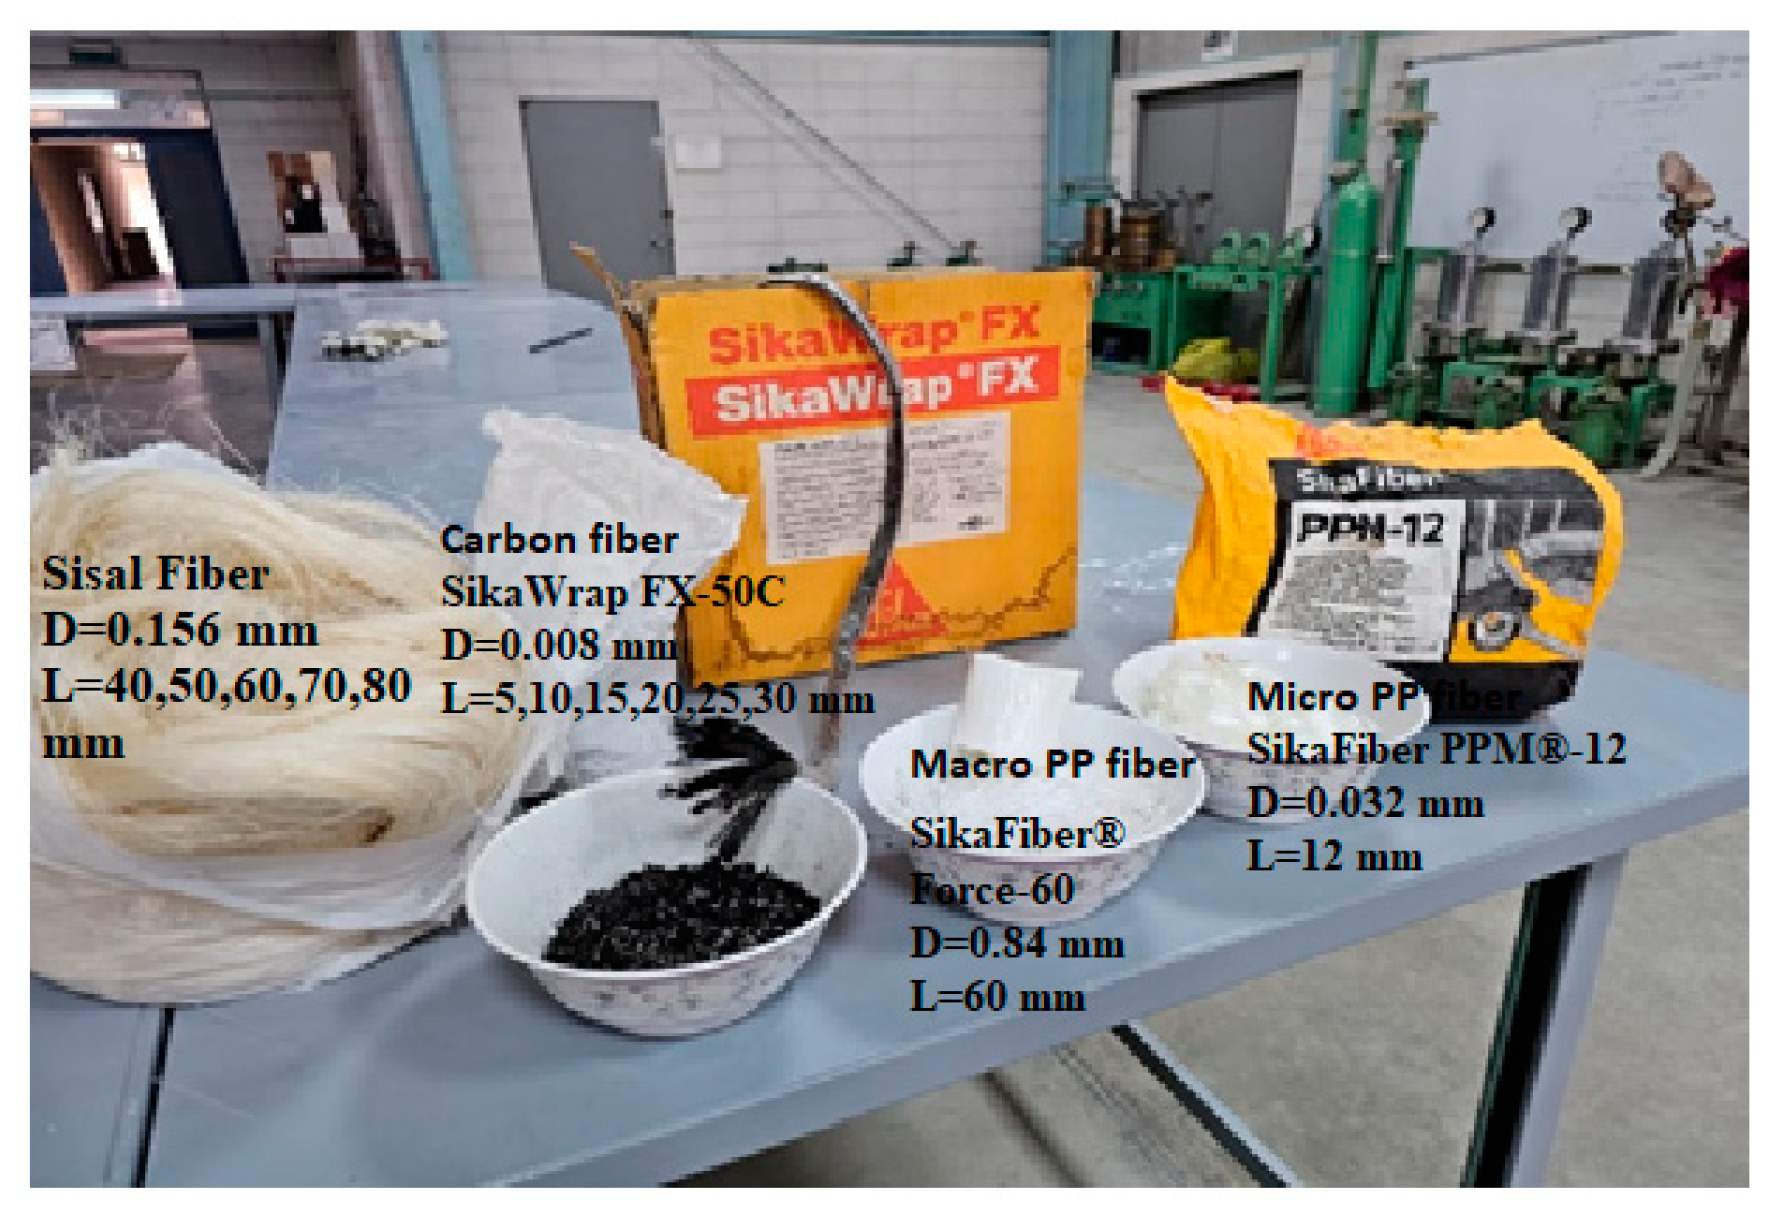
2.1. Materials
2.2. Mix Proportions and Preparation of Samples
2.3. Test Variables and Specimens
2.3.1. Flowability
2.3.2. Compressive Strength
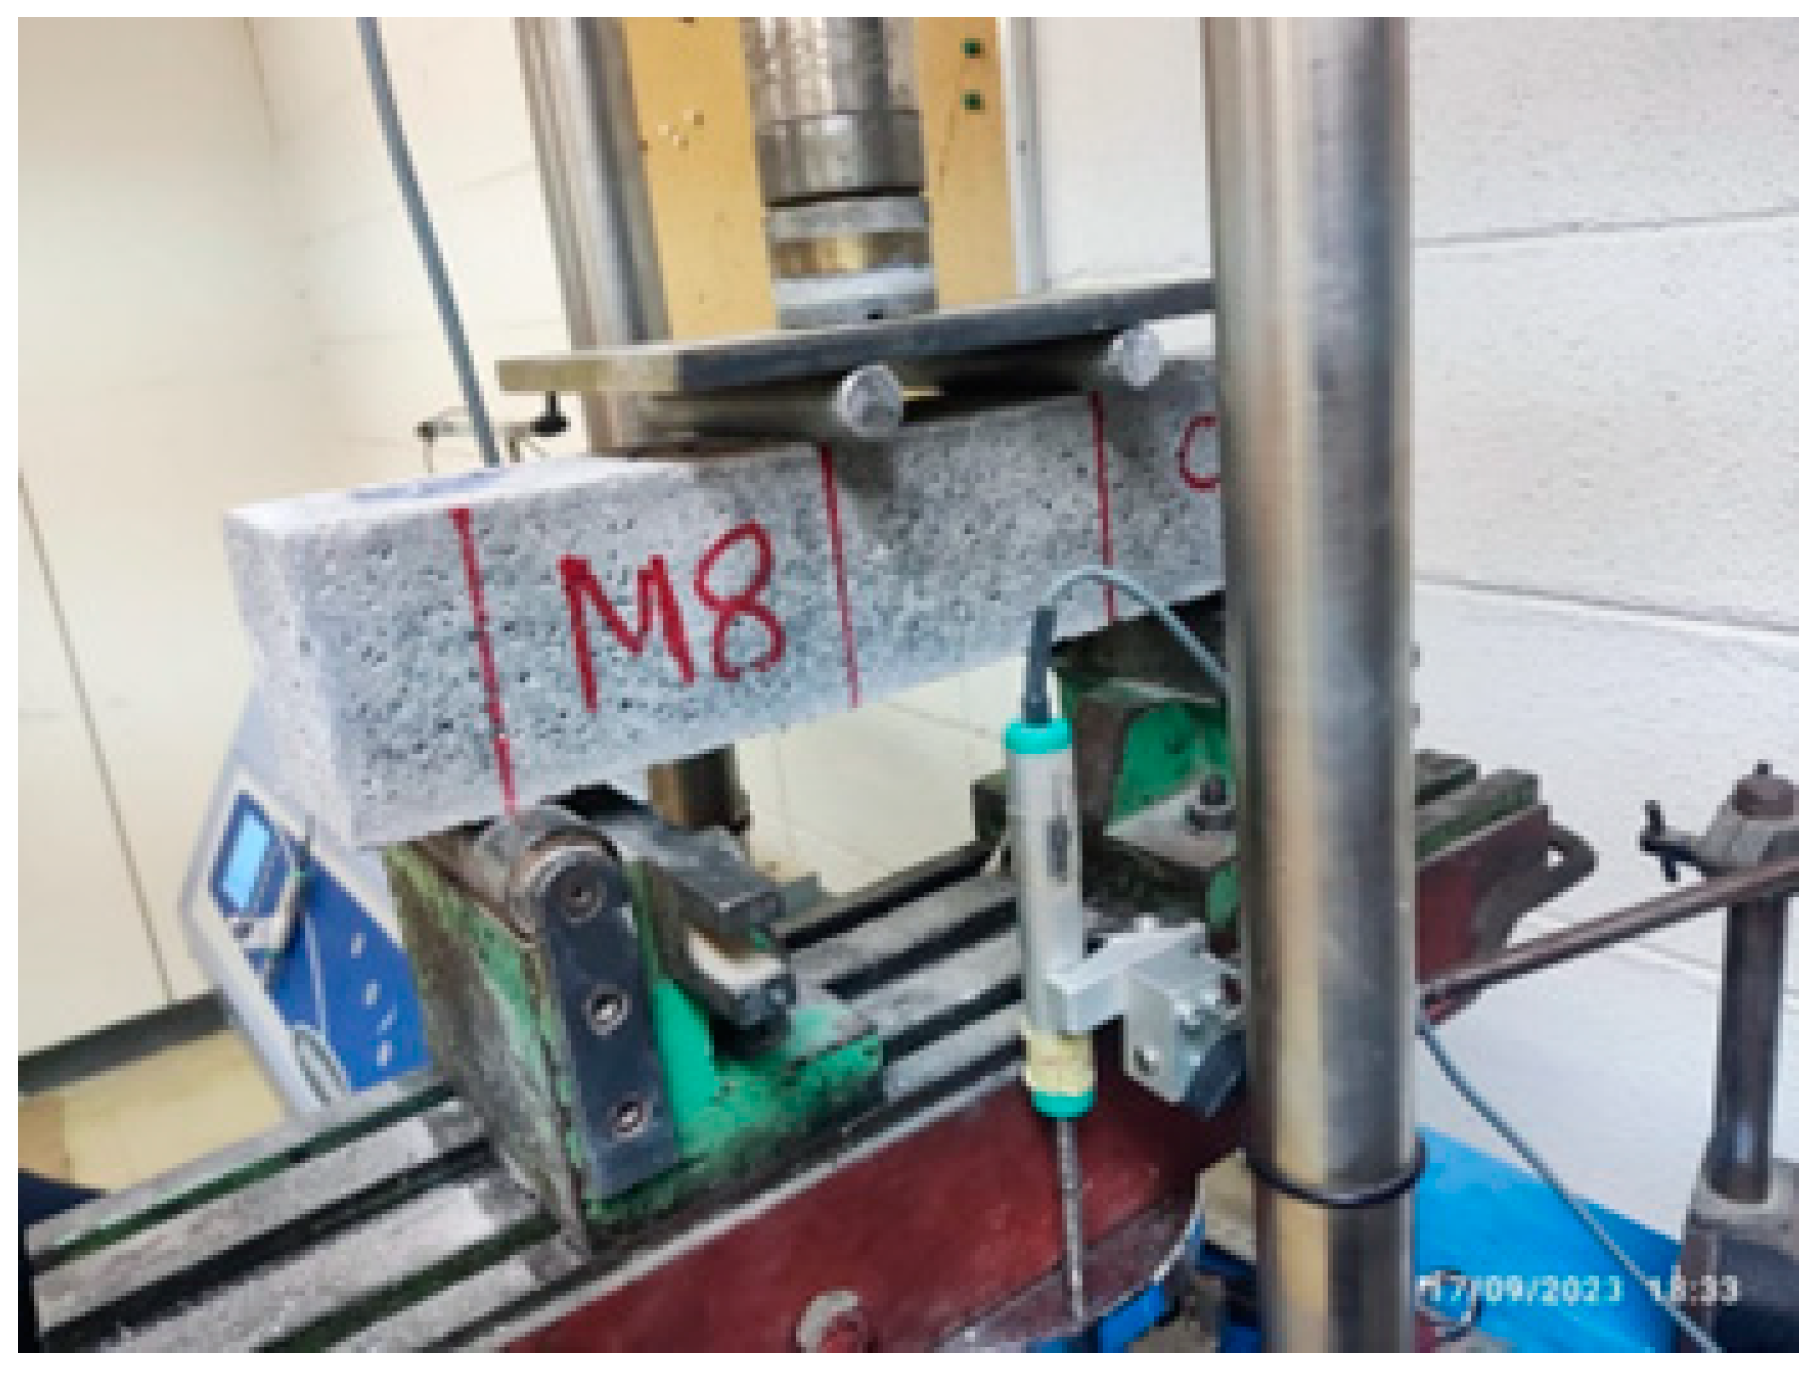
2.3.3. Flexural Strength
3. Results
3.1. Flowability
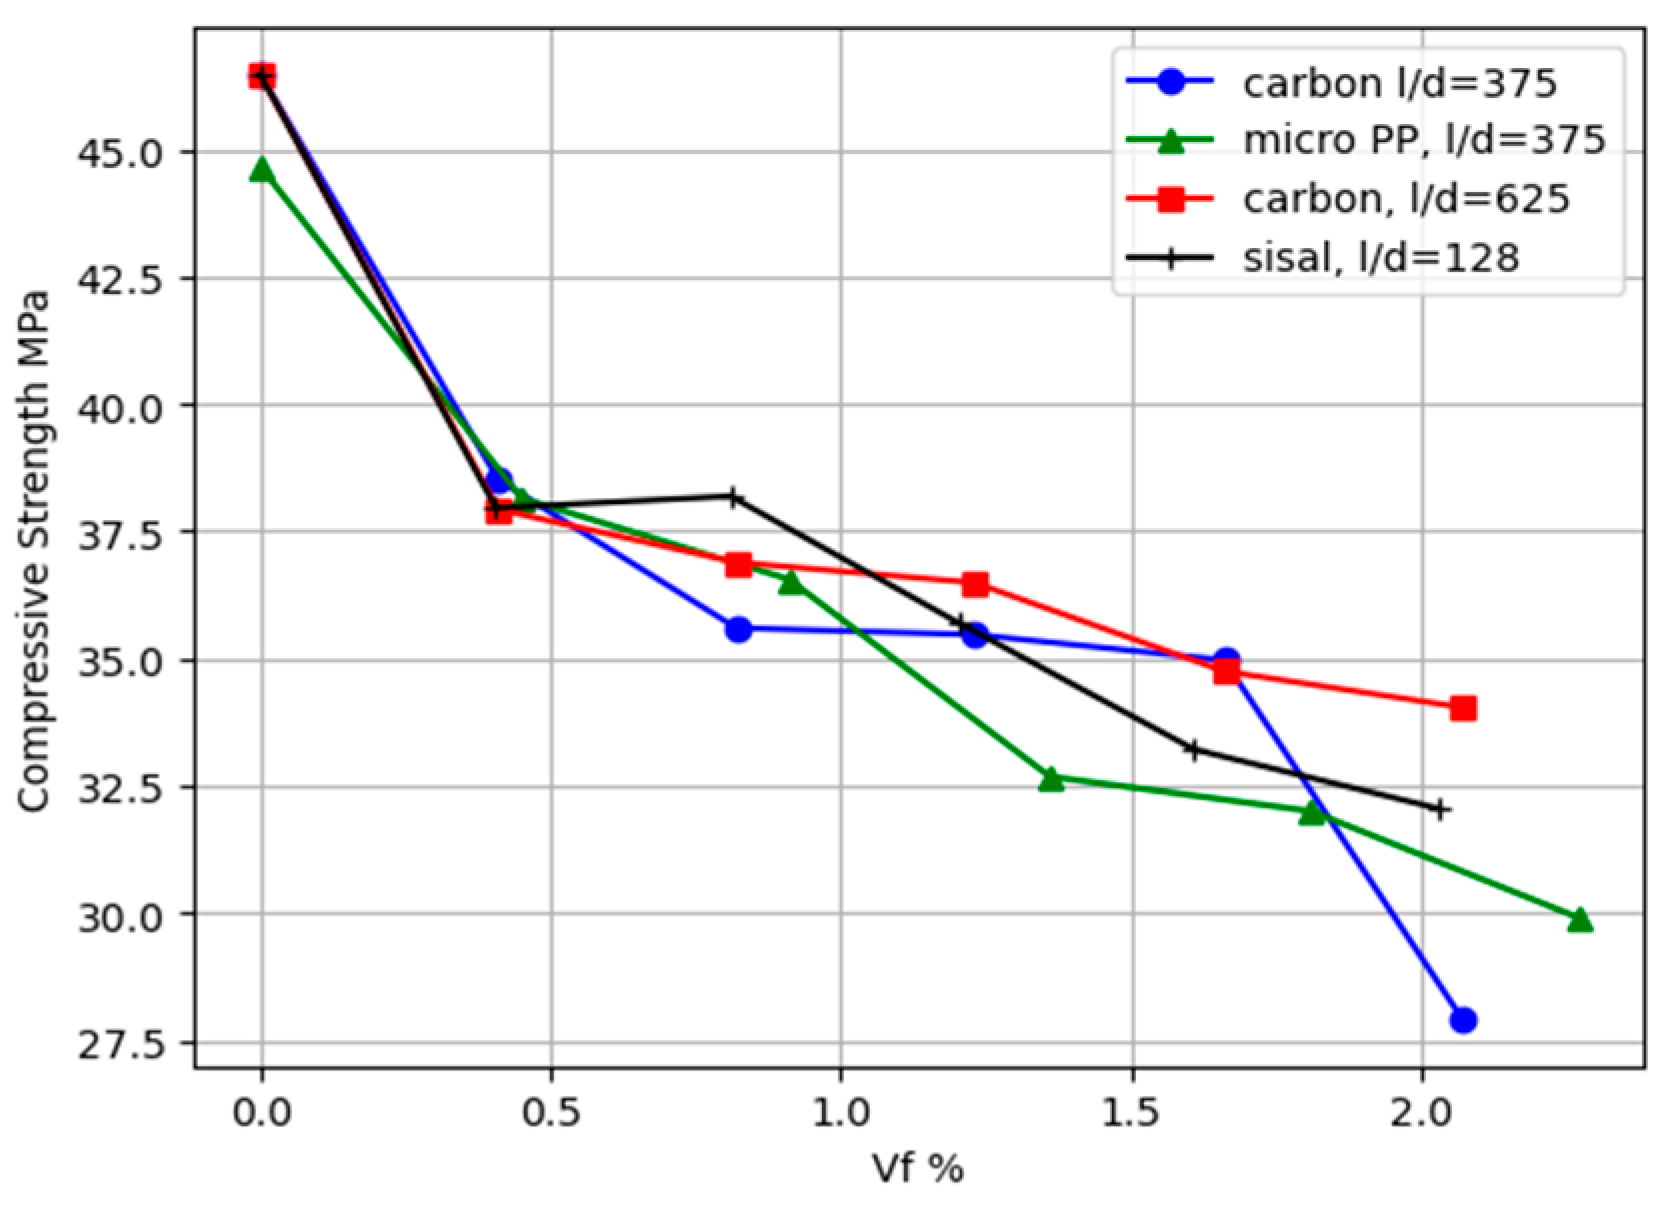
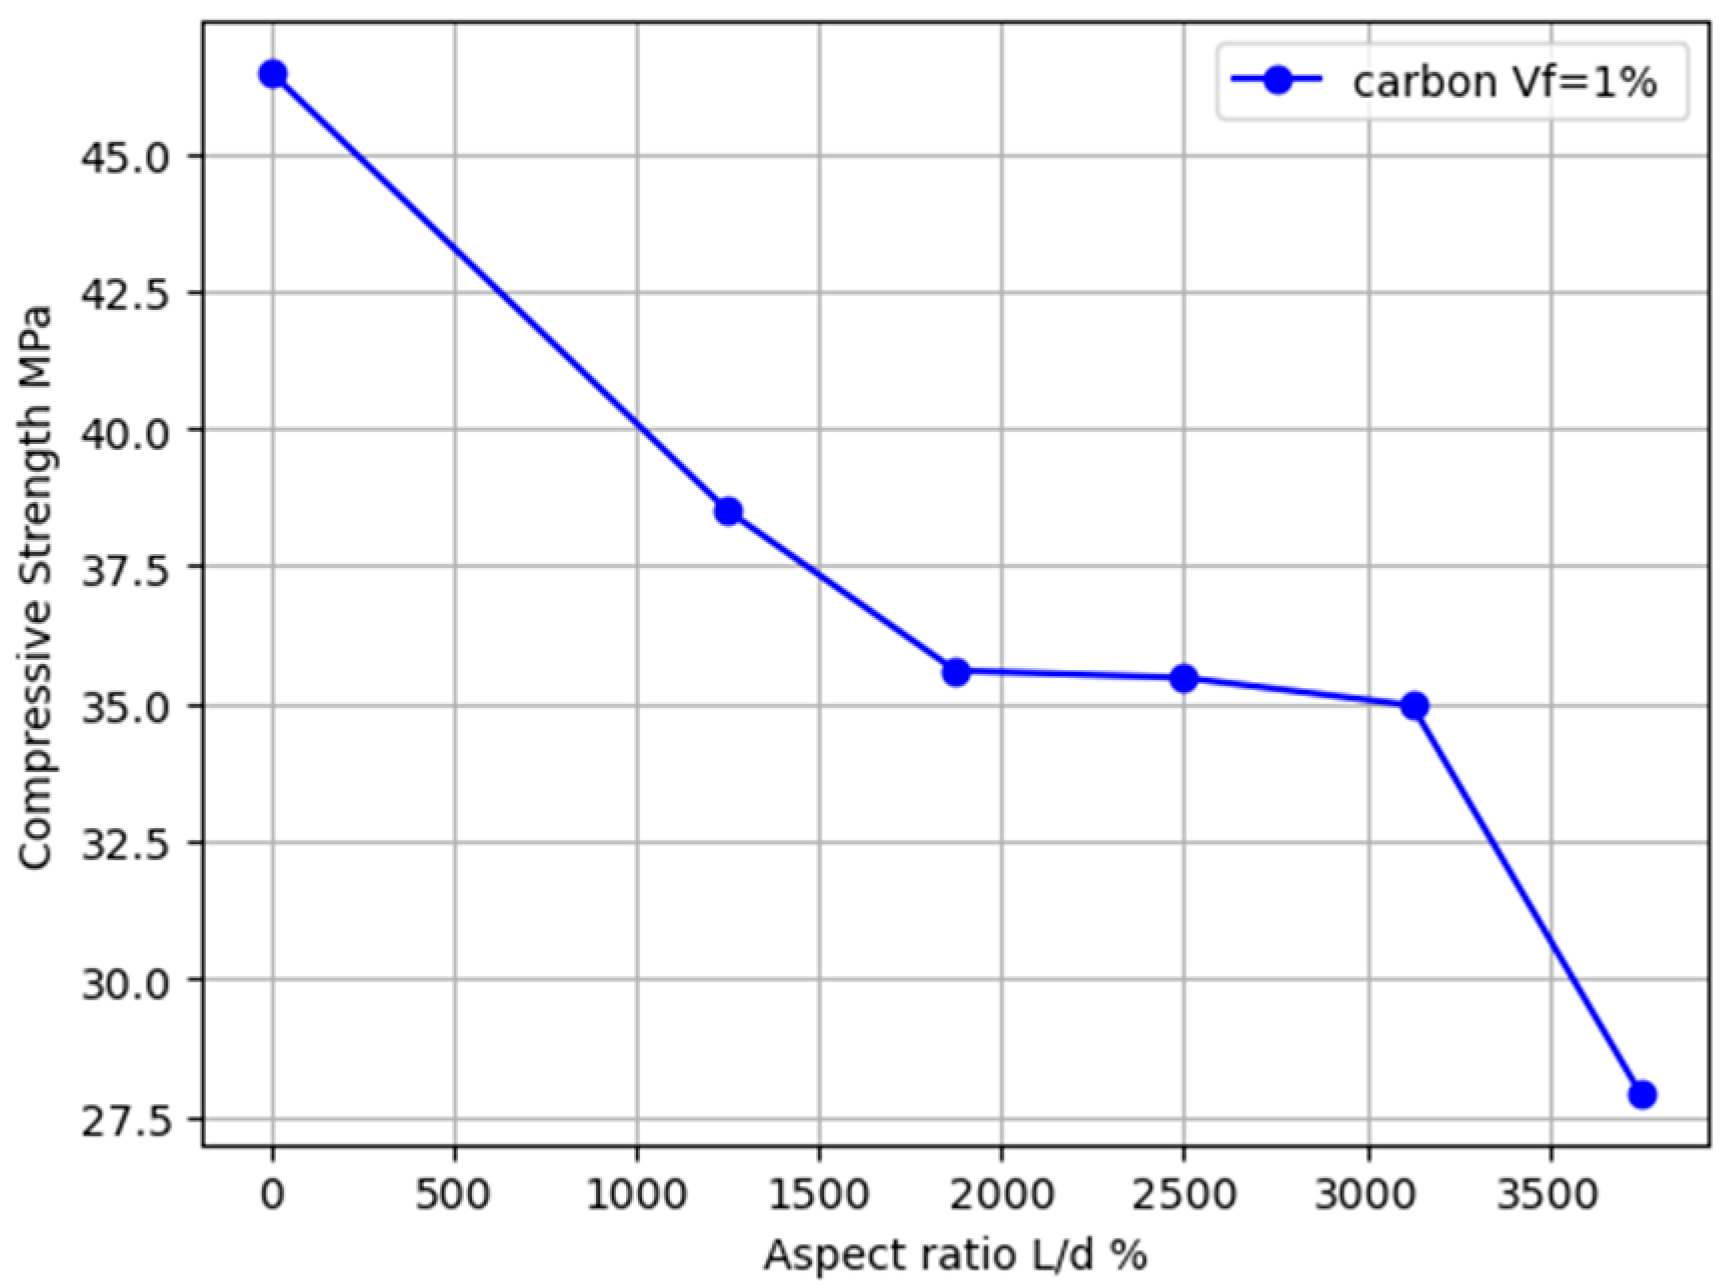
3.2. Compressive Strength
3.3. Equivalent Elastic Bending Stress versus Deflection
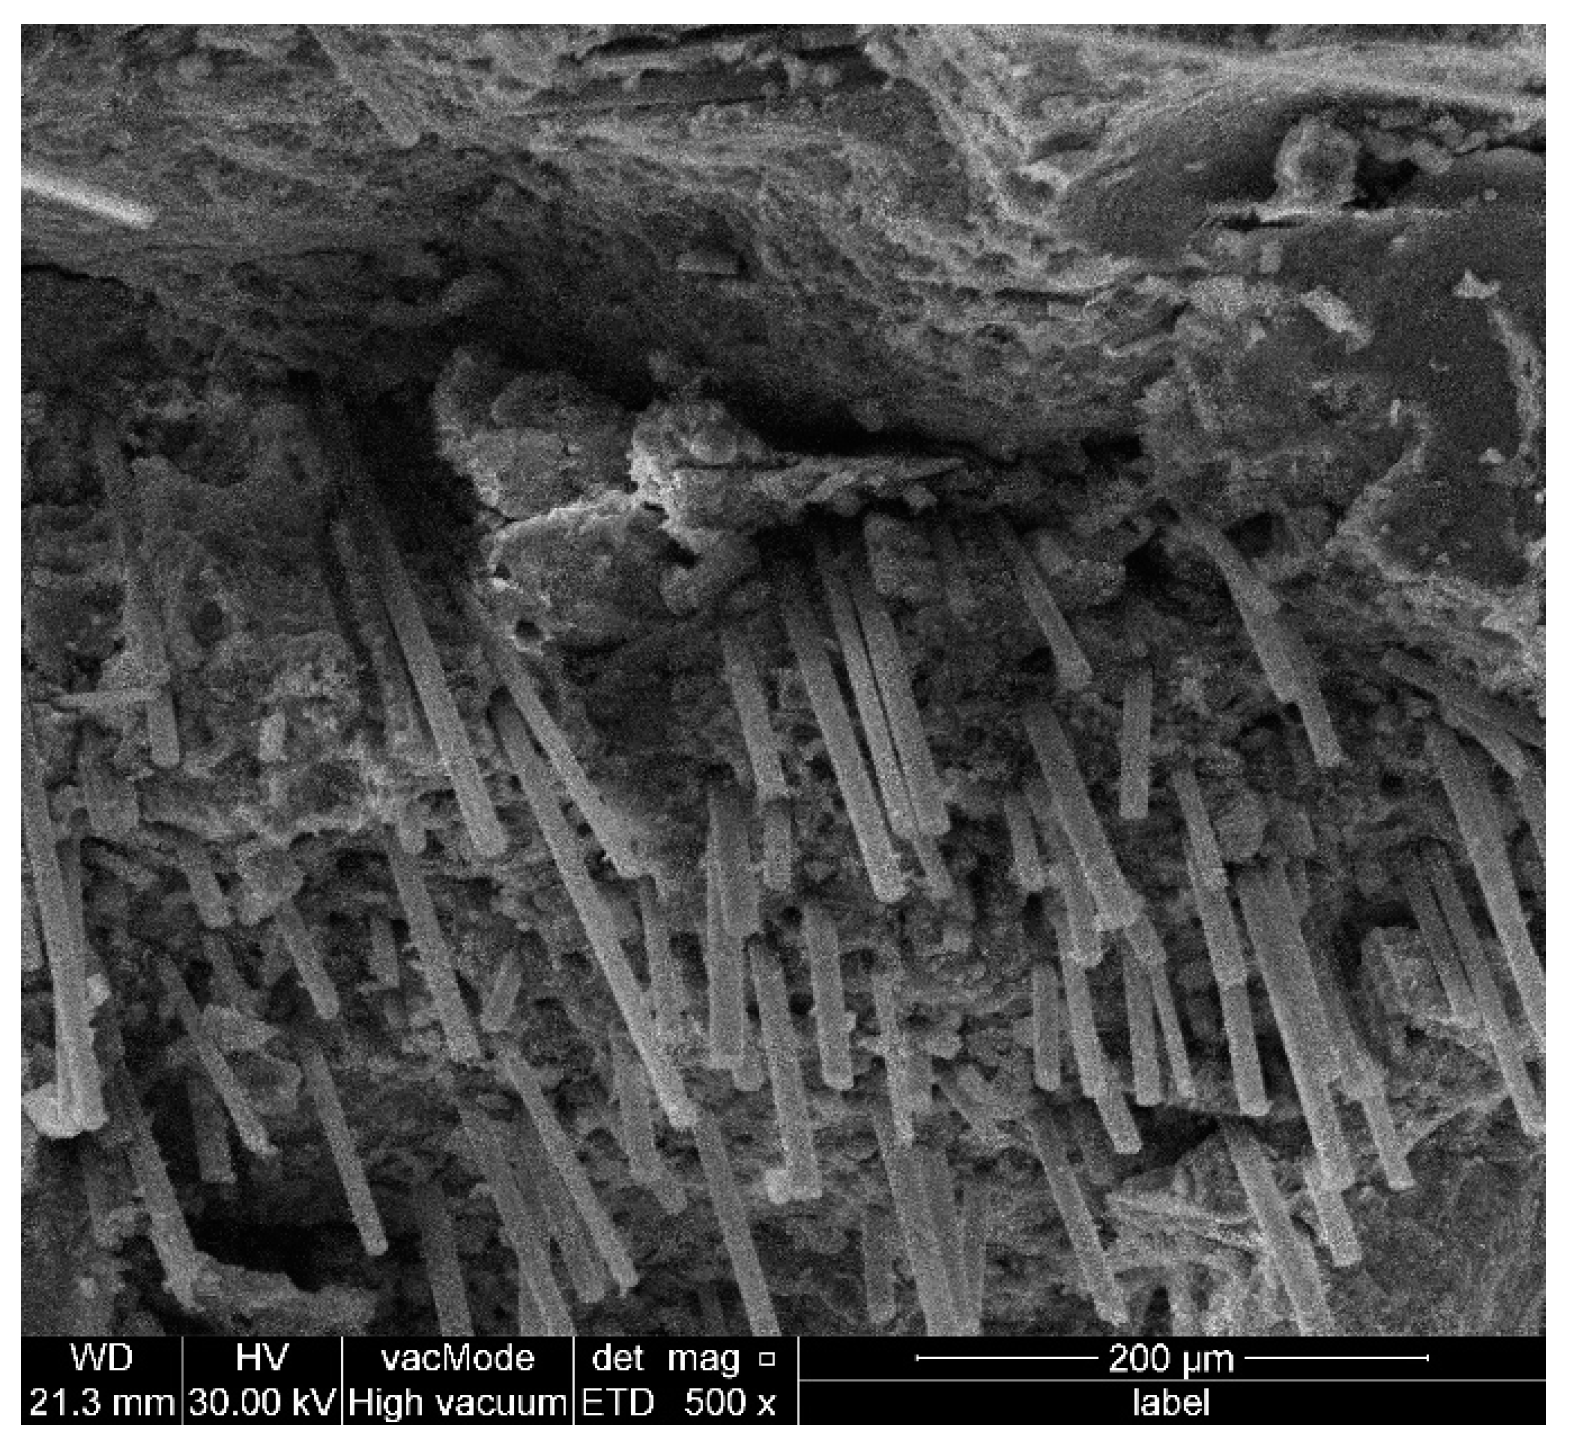
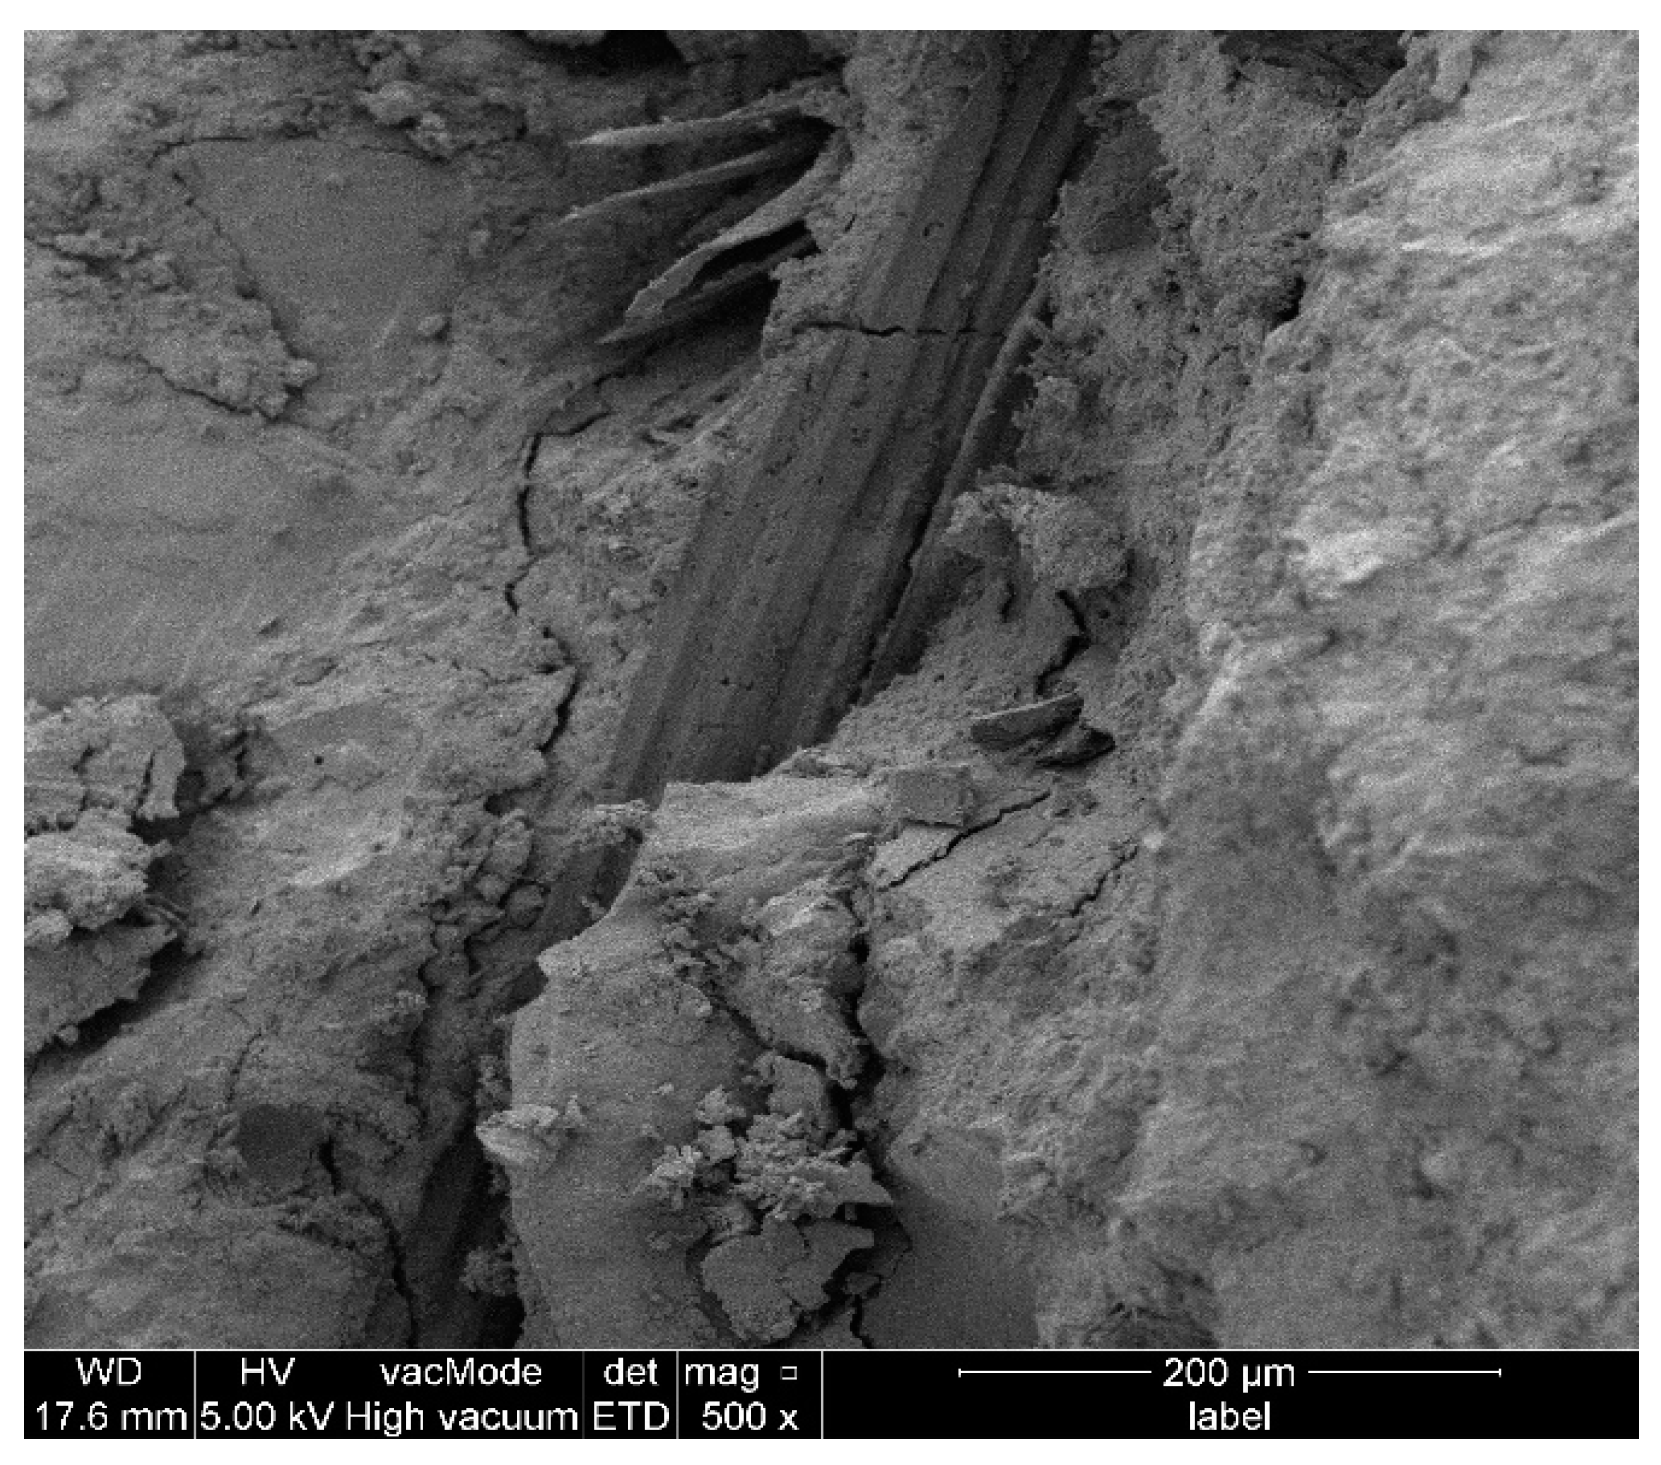
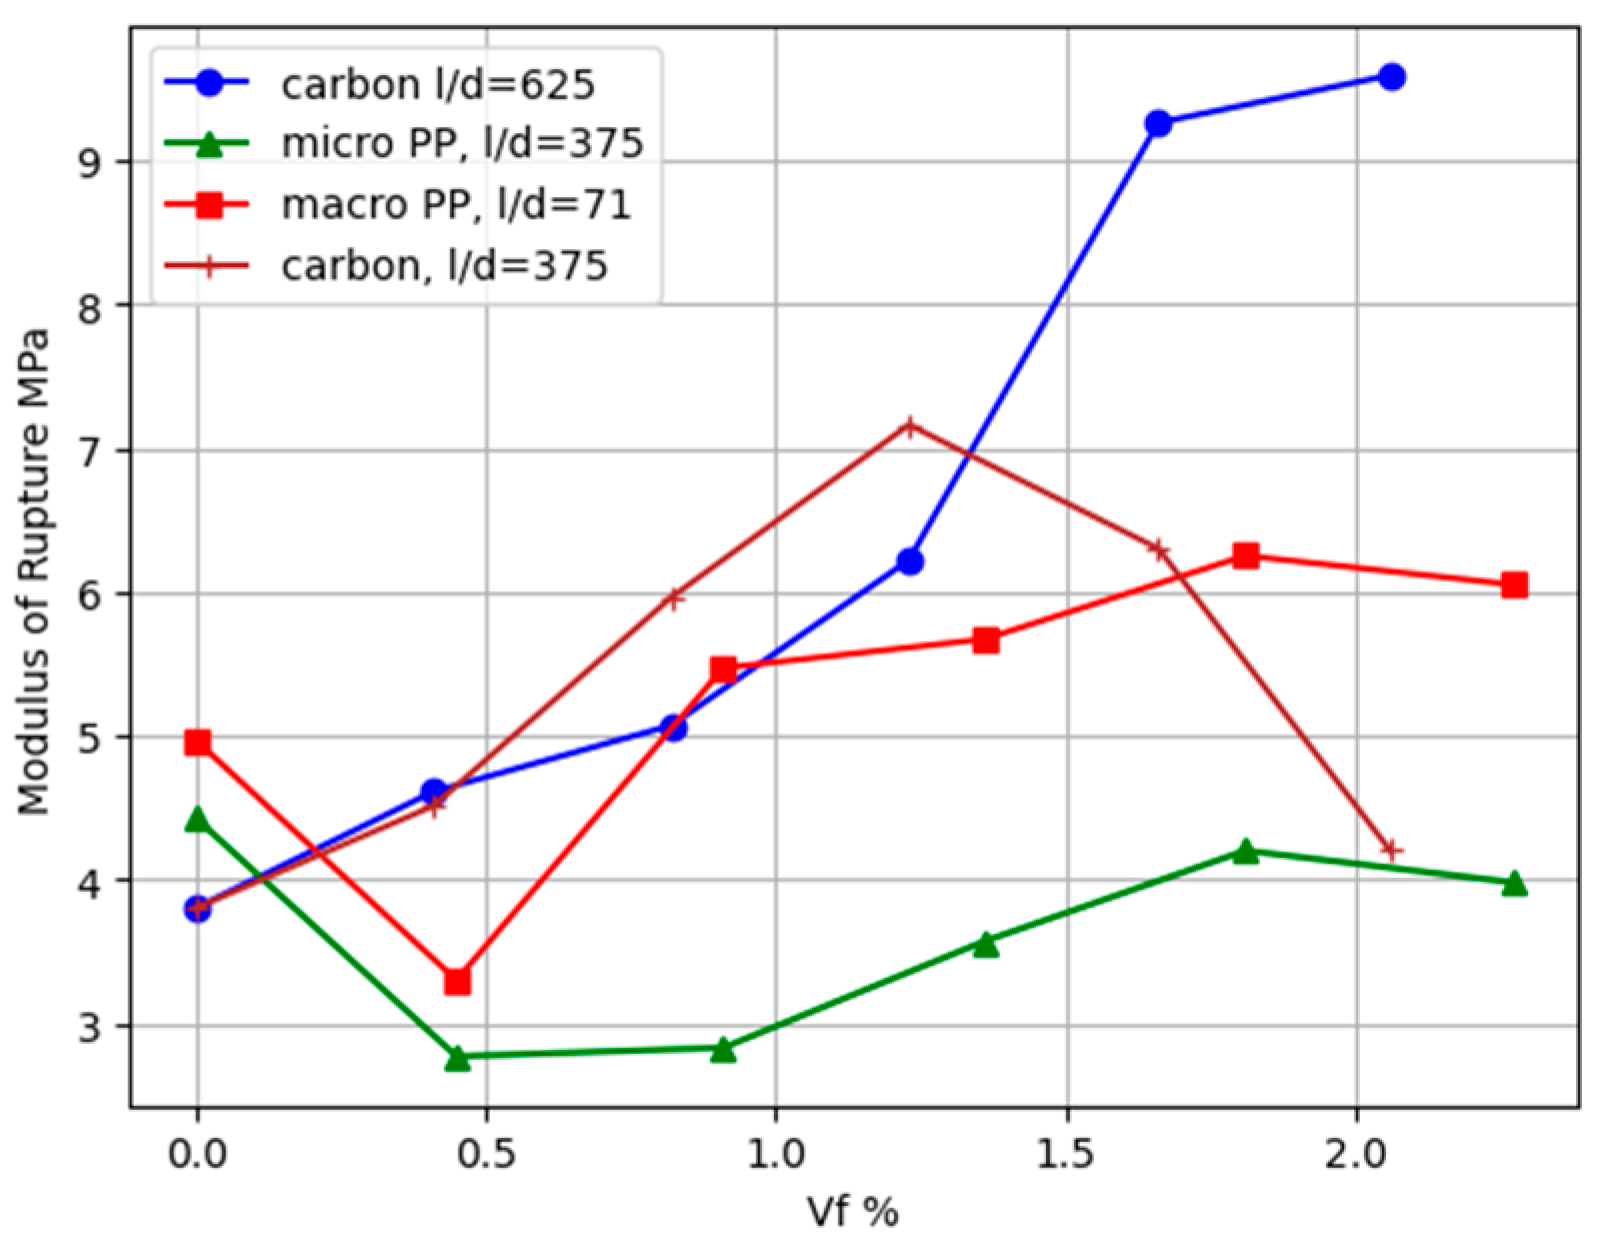
3.4. Modulus of Rupture
4. Conclusions
- Carbon fiber composites have greater flexural strength but poorer ductility than polypropylene. The stress behavior varies greatly depending on the fiber type and aspect ratio, affecting the composite’s mechanical performance.
- Increasing the fiber volume reduced the compressive strength by 20% for carbon fibers at 1.66% and decreased it by 15% for polypropylene fibers at a volume fraction of 1.81%; beyond this point, the compressive strength decreased notably.
- Adding additional fibers improved the peak load deflection in composites reinforced with carbon and macro-polypropylene fibers. However, the composites containing micro-polypropylene and natural sisal fibers had nearly the same or lower first cracking load and less deflection in comparison with the fiber-less cementitious matrix, despite the fact that they enhanced the toughness.
- Carbon fibers with an aspect ratio of 625 increased the modulus of rupture by about three times at a volume fraction of more than 1.66% compared with the cementitious matrix without fibers.
- Macro-polypropylene at a volume fraction greater than 0.8% contributed to deflection-hardening behavior, which was attributed to the higher interfacial bond strength between fibers, whereas micro-PP fibers with higher aspect ratios tended to display deflection softening following cracking at all volume fractions.
- According to the results and the model for predicting the ratio of the modulus of rupture to the first cracking strength, the role of the increase in the volume fraction was much greater than the role of the aspect ratio in enhancing the properties of the composite.
Funding
Data Availability Statement
Acknowledgments
Conflicts of Interest
References
- Ravikumar, C.S.; Ramasamy, V.; Thandavamoorthy, T.S. Effect of Fibers In Concrete Composites. Int. J. Appl. Eng. Res. 2015, 10, 419–430. [Google Scholar]
- Hao, Y.; Shi, C.; Bi, Z.; Lai, Z.; She, A.; Yao, W. Recent Advances in Properties and Applications of Carbon Fiber-Reinforced Smart Cement-Based Composites. Materials 2023, 16, 2552. [Google Scholar] [CrossRef]
- Tabatabaei, Z.S.; Volz, J.S.; Gliha, B.P.; Keener, D.I. Development of Long Carbon Fiber-Reinforced Concrete for Dynamic Strengthening. J. Mater. Civ. Eng. 2013, 25, 1446–1455. [Google Scholar] [CrossRef]
- Talikoti, R.; Kandekar, S. Strength and Durability Study of Concrete Structures Using Aramid-Fiber-Reinforced Polymer. Fibers 2019, 7, 11. [Google Scholar] [CrossRef]
- Yazıcı, Ş.; İnan, G.; Tabak, V. Effect of aspect ratio and volume fraction of steel fiber on the mechanical properties of SFRC. Constr. Build. Mater. 2015, 21, 1250–1253. [Google Scholar] [CrossRef]
- Soufeiani, L.; Raman, S.N.; Jumaat, M.Z.; Bin Alengaram, U.J.; Ghadyani, G.; Mendis, P. Influences of the volume fraction and shape of steel fibers on fiber-reinforced concrete subjected to dynamic loading—A review. Eng. Struct. 2016, 124, 405–417. [Google Scholar] [CrossRef]
- Soylu, N.; Bingöl, A.F. Research on effect of the quantity and aspect ratio of steel fibers on compressive and flexural strength of SIFCON. Chall. J. Struct. Mech. 2019, 5, 29. [Google Scholar] [CrossRef]
- Liu, T.; Yang, Y.; Chen, Z.; Li, Y.; Bai, R. Optimization of fiber volume fraction to enhance reinforcing efficiency in hybrid fiber reinforced strain hardening cementitious composite. Cem. Concr. Compos. 2020, 113, 103704. [Google Scholar] [CrossRef]
- Mashrei, M.A.; Ali, A.S.; Alaa, M.M. Effects of Polypropylene Fibers on Compressive and Flexural Strength of Concrete Material. Int. J. Civ. Eng. Technol. 2018, 9, 2208–2217. [Google Scholar]
- Maksum, M.; Alrasyid, H.; Irmawan, M.; Piscesa, B. Effect of steel fiber volume fraction to the tensile splitting strength of concrete cylinder. IOP Conf. Ser. Mater. Sci. Eng. 2020, 930, 012058. [Google Scholar] [CrossRef]
- ACI Committee 544. Report on Fiber Reinforced Concrete, ACI 544.1R-96 (Reapproved 2009), American Concrete Institute. 2001. Available online: https://www.studocu.com/pe/document/universidad-peruana-de-ciencias-aplicadas/construccion-i/aci-report-aci-committee-544/54183586 (accessed on 22 August 2024).
- Musmar, M. Tensile strength of steel fiber reinforced concrete. Contemp. Eng. Sci. 2013, 6, 225–237. [Google Scholar] [CrossRef]
- Banthia, N.; Trottier, J. Test Methods for Fexural Toughness Characterization of Fiber Reinforced Concrete: Some Concerns and a Proposition. Eng. Mater. Sci. 1995, 92, 48–57. [Google Scholar] [CrossRef]
- Naaman, A.E.; Reinhardt, H.E. Chapter Characterization of High Performance Fiber Reinforced Cement Composites–HPFRCC, 1st ed.; Naaman, A.E., Reinhardt, H.W., Eds.; CRC Press: London, UK, 1996. [Google Scholar] [CrossRef]
- Alrawashdeh, A.; Eren, O. Mechanical and physical characterization of steel fiber reinforced self-compacting concrete: Different aspect ratios and volume fractions of fibers. Results Eng. 2022, 13, 100335. [Google Scholar] [CrossRef]
- Yoo, D.-Y.; Yoon, Y.-S. A Review on Structural Behavior, Design, and Application of Ultra-High-Performance Fiber-Reinforced Concrete. Int. J. Concr. Struct. Mater. 2016, 10, 125–142. [Google Scholar] [CrossRef]
- Lee, S.K.; Oh, T.; Banthia, N.; Yoo, D.-Y. Optimization of fiber aspect ratio for 90 MPa strain-hardening geopolymer composites (SHGC) with a tensile strain capacity over 7.5%. Cem. Concr. Compos. 2023, 139, 105055. [Google Scholar] [CrossRef]
- Lin, C.; Kanstad, T.; Jacobsen, S.; Ji, G. Bonding property between fiber and cementitious matrix: A critical review. Constr. Build. Mater. 2023, 378, 131169. [Google Scholar] [CrossRef]
- Amin, A.; Gilbert, R.I. Steel Fiber-Reinforced Concrete Beams-Part II: Strength, Ductility and Design. ACI Struct. J. 2019, 116, 113–123. [Google Scholar] [CrossRef]
- Lee, Y.; Kang, S.-T.; Kim, J.-K. Pullout behavior of inclined steel fiber in an ultra-high strength cementitious matrix. Constr. Build. Mater. 2010, 24, 2030–2041. [Google Scholar] [CrossRef]
- RILEM TC 162-TDF Test and design methods for steel fibre reinforced concre. Mater. Struct./M 2000, 33, 75–81.
- Singh, H. Steel Fiber Reinforced Concrete; Springer: Singapore, 2017; pp. 1–181. [Google Scholar] [CrossRef]
- ASTM C128-15; Standard Test Method for Relative Density (Specific Gravity) and Absorption of Fine Aggregate. ASTM Book of Standards. ASTM International: West Conshohocken, PA, USA, 2015; Volume 4.02. [CrossRef]
- ASTM C 1437–07; Standard Test Method for Flow of Hydraulic Cement Mortar. ASTM Book of Standards. ASTM International: West Conshohocken, PA, USA, 2007; Volume 4.01.
- ASTM C109/C109M-08; Standard Test Method for Compressive Strength of Hydraulic Cement Mortars (Using 2-in. or [50-mm] Cube Specimens). ASTM Book of Standards. ASTM International: West Conshohocken, PA, USA, 2009; Volume 4.01.
- ASTM C1018-97; Standard Test Method for Flexural Toughness and First-Crack Strength of Fiber-Reinforced Concrete (Using Beam With Third-Point Loading). ASTM Book of Standards. ASTM International: West Conshohocken, PA, USA, 2017; Volume 4.05.
- Abd Elmoaty, A.E.M.; Morsy, A.M.; Harraz, A.B. Effect of Fiber Type and Volume Fraction on Fiber Reinforced Concrete and Engineered Cementitious Composite Mechanical Properties. Buildings 2022, 12, 2108. [Google Scholar] [CrossRef]
- Başsürücü, M.; Fenerli, C.; Kina, C.; Akbaş, Ş.D. Effect of Fiber Type, Shape and Volume Fraction on Mechanical and Flexural Properties of Concrete. J. Sustain. Constr. Mater. Technol. 2022, 7, 158–171. [Google Scholar] [CrossRef]
- Li, Y.-F.; Huang, Y.-R.; Syu, J.-Y.; Tsai, Y.-K.; Huang, C.-H. A study on mechanical behavior of Kevlar fiber reinforced concrete under static and high-strain rate loading. Int. J. Prot. Struct. 2023, 14, 407–437. [Google Scholar] [CrossRef]
- Naaman, A.E. What Do Fibers Do To Concrete: Part I Key Mechanical Properties. In Fiber Reinforced Cement and Concrete Composites; Techno Press 3000: Sarasota, FL, USA, 2018; pp. 89–91. [Google Scholar]
- ASTM C1609/C1609M-12; Standard Test Method for Flexural Performance of Fiber-Reinforced Concrete (Using Beam With Third-Point Loading)1. ASTM Book of Standards. ASTM International: West Conshohocken, PA, USA, 2009; Volume 4.05.
- Naaman, A.E. High Performance Fiber Reinforced Cement Composites. In High-Performance Construction Materials; World Scientific: Singapore, 2008; pp. 91–153. [Google Scholar] [CrossRef]
- Yoo, D.-Y.; Kim, S.; Park, G.-J.; Park, J.-J.; Kim, S.-W. Effects of fiber shape, aspect ratio, and volume fraction on flexural behavior of ultra-high-performance fiber-reinforced cement composites. Compos. Struct. 2017, 174, 375–388. [Google Scholar] [CrossRef]
- Naaman, A.E. Modeling Tension. In Fiber Reinforced Cement and Concrete Composites; Techno Press 3000: Sarasota, FL, USA, 2018; pp. 464–472. [Google Scholar]
- Ramakrishna, G.; Sundararajan, T. Impact strength of a few natural fiber reinforced cement mortar slabs: A comparative study. Cem. Concr. Compos. 2005, 27, 547–553. [Google Scholar] [CrossRef]
- Li, B.; Xu, L.; Shi, Y.; Chi, Y.; Liu, Q.; Li, C. Effects of fiber type, volume fraction and aspect ratio on the flexural and acoustic emission behaviors of steel fiber reinforced concrete. Constr. Build. Mater. 2018, 181, 474–486. [Google Scholar] [CrossRef]


| Sieve Size (mm) | % Passing | Physical Properties |
|---|---|---|
| 5 | 100 | Bulk specific gravity (SSD): 2.69 |
| 2.36 | 99 | Water absorption: 1.3% |
| 1.18 | 68 | Moisture content (stock): 1.0% |
| 0.6 | 51 | Fineness modulus: 2.64 |
| 0.30 | 15 | |
| 0.15 | 3 |
| Oxides | MgO | Al2O3 | SiO2 | P2O5 | Sulfur | K2O | CaO | TiO2 | Fe2O3 | Sr | Zr |
|---|---|---|---|---|---|---|---|---|---|---|---|
| Percent | 3.967 | 25.077 | 60.160 | 0.250 | 0.249 | 0.542 | 3.57 | 0.203 | 5.51 | 0.18 | 0.151 |
| Group No. | Mix Designation | w/b | Type of Fiber | Volume Fraction Vf % | Weight /Batch (kg/m3) | Aspect Ratio L/d |
|---|---|---|---|---|---|---|
| 1 | G1M0 | 0.60 | None | 0.0 | 0.00 | 0 |
| G1M1 | 0.60 | Carbon | 0.41 | 7.47 | 625 | |
| G1M2 | 0.60 | Carbon | 0.82 | 14.94 | 625 | |
| G1M3 | 0.60 | Carbon | 1.23 | 22.41 | 625 | |
| G1M4 | 0.60 | Carbon | 1.66 | 30.29 | 625 | |
| G1M5 | 0.60 | Carbon | 2.06 | 37.59 | 625 | |
| 2 | G2M6 | 0.60 | Carbon | 1.00 | 18.23 | 1250 |
| G2M7 | 0.60 | Carbon | 1.00 | 18.23 | 1875 | |
| G2M8 | 0.60 | Carbon | 1.00 | 18.23 | 2500 | |
| G2M9 | 0.60 | Carbon | 1.00 | 18.23 | 3125 | |
| G2M10 | 0.60 | Carbon | 1.00 | 18.23 | 3750 | |
| 3 | G3M11 | 0.60 | Carbon | 0.41 | 7.47 | 375 |
| G3M12 | 0.60 | Carbon | 0.82 | 14.94 | 375 | |
| G3M13 | 0.60 | Carbon | 1.23 | 22.41 | 375 | |
| G3M14 | 0.60 | Carbon | 1.66 | 30.29 | 375 | |
| G3M15 | 0.60 | Carbon | 2.06 | 37.59 | 375 | |
| 4 | G4M16 | 0.55 | Plain | 0 | 0 | 0 |
| G4M17 | 0.55 | PP (Micro) | 0.45 | 4.09 | 375 | |
| G4M18 | 0.55 | PP (Micro) | 0.91 | 8.28 | 375 | |
| G4M19 | 0.55 | PP (Micro) | 1.36 | 12.37 | 375 | |
| G4M20 | 0.55 | PP (Micro) | 1.81 | 16.47 | 375 | |
| G4M21 | 0.55 | PP (Micro) | 2.27 | 20.65 | 375 | |
| 5 | G5M22 | 0.55 | Plain | 0 | 0 | 0 |
| G5M23 | 0.55 | PP (Macro) | 0.45 | 4.09 | 71 | |
| G5M24 | 0.55 | PP (Macro) | 0.91 | 8.28 | 71 | |
| G5M25 | 0.55 | PP (Macro) | 1.36 | 12.37 | 71 | |
| G5M26 | 0.55 | PP (Macro) | 1.81 | 16.47 | 71 | |
| G5M27 | 0.55 | PP (Macro) | 2.27 | 20.65 | 71 | |
| 6 | G6M28 | 0.60 | Sisal | 0.406 | 27 | 128 |
| G6M29 | 0.60 | Sisal | 0.811 | 53 | 128 | |
| G6M30 | 0.60 | Sisal | 1.206 | 79 | 128 | |
| G6M31 | 0.60 | Sisal | 1.609 | 106 | 128 | |
| G6M32 | 0.60 | Sisal | 2.027 | 133 | 128 | |
| 7 | G6M33 | 0.60 | Sisal | 1.44 | 95 | 256 |
| G6M34 | 0.60 | Sisal | 1.44 | 95 | 320 | |
| G6M35 | 0.60 | Sisal | 1.44 | 95 | 384 | |
| G6M36 | 0.60 | Sisal | 1.44 | 95 | 448 | |
| G6M37 | 0.60 | Sisal | 1.44 | 95 | 512 |
Disclaimer/Publisher’s Note: The statements, opinions and data contained in all publications are solely those of the individual author(s) and contributor(s) and not of MDPI and/or the editor(s). MDPI and/or the editor(s) disclaim responsibility for any injury to people or property resulting from any ideas, methods, instructions or products referred to in the content. |
© 2024 by the author. Licensee MDPI, Basel, Switzerland. This article is an open access article distributed under the terms and conditions of the Creative Commons Attribution (CC BY) license (https://creativecommons.org/licenses/by/4.0/).
Share and Cite
Bzeni, D.K. Investigating the Influence of Fiber Content and Geometry on the Flexural Response of Fiber-Reinforced Cementitious Composites. J. Compos. Sci. 2024, 8, 347. https://doi.org/10.3390/jcs8090347
Bzeni DK. Investigating the Influence of Fiber Content and Geometry on the Flexural Response of Fiber-Reinforced Cementitious Composites. Journal of Composites Science. 2024; 8(9):347. https://doi.org/10.3390/jcs8090347
Chicago/Turabian StyleBzeni, Dillshad Khidhir. 2024. "Investigating the Influence of Fiber Content and Geometry on the Flexural Response of Fiber-Reinforced Cementitious Composites" Journal of Composites Science 8, no. 9: 347. https://doi.org/10.3390/jcs8090347