Article

Compliance-Based Determination of Fatigue Design Curves for Elastomeric Adhesive Joints

by
Pedro Henrique Evangelista Fernandes
1,2,
Christof Nagel
1,
Andreas Wulf
1,
Vinicius Carrillo Beber
1,* and
Bernd Mayer
1,2
1
Fraunhofer Institute for Manufacturing Technology and Advanced Materials IFAM, 28359 Bremen, Germany
2
Faculty 4-Production Engineering, University of Bremen, 28359 Bremen, Germany
*
Author to whom correspondence should be addressed.
Eng 2023, 4(4), 2615-2639; https://doi.org/10.3390/eng4040150
Submission received: 20 July 2023 / Revised: 10 October 2023 / Accepted: 11 October 2023 / Published: 16 October 2023
(This article belongs to the Special Issue REPER Recent Materials Engineering Performances)

Abstract

:
A compliance-based method for the determination of fatigue design curves for elastomeric adhesive joints is developed and validated. Fatigue experiments are conducted on elastomeric adhesives (a polyurethane and a silane-modified polymer) under different stress ratios (R = 0.1/0.5/−1) and conditions (23 °C/50% r.h. and 40 °C/60% r.h.). The investigation focused on butt and thick adherent shear test joints. Fatigue tests are recorded with cameras to identify the stages of crack initiation and propagation. For each fatigue test, the stiffness and compliance per cycle are calculated until final failure. The proposed method identifies a transition point that distinguishes regions under stable and unstable compliance growth. Fatigue design curves are then built based on the transition point and on the number of cycles to reach different degrees of initial stiffness (90%, 80%, 70% and 60%). The failure ratio, i.e., the lifetime for reaching a given approach divided by the total lifetime, is introduced to evaluate the data in terms of average values and standard deviation. The results indicate that the proposed method can yield fatigue design curves with a high coefficient of determination (accuracy) and high failure ratio (avoiding over-conservative design). Moreover, the method is robust, as the failure ratio for different adhesives, stress ratios, conditions and geometries is highly consistent.

1. Introduction

Elastomeric adhesives have been investigated in the past few years in many industries (e.g., automotive, railway, naval) due to their advantages, which include deformation compensation, high flexibility, vibration absorption and improved fatigue behaviour [1,2]. As typical mechanical properties, elastomeric materials present a high failure strain, non-linear (hyperelastic) behaviour and low elastic modulus [3].
Part of the applications of elastomeric adhesive joints involves components that are subjected to cyclic loading [4,5,6]. One of the consequences of cyclic loading is the weakening of the structure, in other words, damage and material property degradation in a cumulative manner [7]. Typically, the fatigue lifetime of a material can be divided into two phases: crack initiation and crack propagation [8]. While structural rigid adhesive joints (e.g., epoxies) show a predominant lifetime under fatigue for crack initiation [9], elastomeric adhesive joints, in contrast, have a predominant lifetime under the crack propagation state [10,11]. In this regard, the high tear propagation strength of elastomers is critical in terms of safety, as the damaged elastomeric joint under crack propagation might be repaired before the catastrophic joint failure [12,13].
Furthermore, for elastomeric adhesives, as the initiation phase might begin in an earlier portion of the lifetime [14], the consideration of only the crack initiation might lead to an over-conservative design. In this regard, the concept of compliance (i.e., inverse of the stiffness) has been introduced for elastomeric materials as a method to measure the evolution of damage during fatigue loading [15,16].
The fatigue design consists of the proper dimensioning of adhesive joints to withstand cyclic loading under a predetermined lifetime (or even an infinite lifetime) [17,18]. Considering the stress–life approach [19], it is necessary to have a fatigue design curve (an SN curve) that will provide the correlation between the lifetime and a stress variable (which is related to the loading). However, the definition of lifetime might vary according to the type of material under consideration. For instance, some structures are designed to withstand a given lifetime against crack initiation, where others might be designed to withstand both initiation and propagation [17].
Fatigue design curves are determined experimentally and provide the foundation for the determination of the fatigue lifetime under cyclic loading. In this respect, many authors have measured fatigue design curves for adhesives, but the vast majority have focused on structural adhesives [9,20,21,22,23]. The investigations with elastomeric adhesives have either been limited to one geometry [11,12,16] or have approached the lifetime as a whole without differentiating the initiation/propagation phases [5,24,25].
Therefore, an understanding of how elastomeric adhesive joints behave during fatigue loading can be fundamental for the determination of fatigue design curves that extend their service time without compromising the safety of the desired application.
The current research work presents a compliance-based method for the determination of fatigue design curves for elastomeric adhesive joints. The method is derived from fatigue experiments with two different elastomeric adhesives (a polyurethane and a silane-modified polymer) subjected to varied stress ratios (R = 0.1/0.5/−1). The adhesive joints considered are butt and thick adherent shear test geometries with tests at room temperature (23 °C/50% r.h.) and 40 °C/60% r.h. The novelty of this approach is that, to the authors’ knowledge, no previous work has used compliance as a method for generating fatigue design curves for elastomeric adhesives.
An analysis of the pictures during cyclic loading is conducted to identify the crack initiation phases in the two types of joints. The stiffness and compliance per cycle are calculated until total sample rupture. The region where an unstable increase in the compliance is identified, defining the point of transition. During the fatigue tests, the number of cycles to reach the transition point is compared to the number of cycles to reach different degrees of stiffness reduction (90%, 80%, 70% and 60% in initial stiffness). Fatigue design curves are built for the number of cycles of each one of the described approaches, and the quality of the data is assessed through the R-squared values. Finally, the “failure ratio” concept is introduced to evaluate the data in terms of the average values and standard deviation of each approach independently of the stress ratio, joint geometry or temperature applied.

2. Fatigue: Loading, Stiffness and Compliance

2.1. Fatigue Loading

In the most elementary case of oscillatory stress, the stress σ moves over time t within fixed limits, which are formed on one side by the upper stress σ m a x and on the other by the lower stress σ m i n .
The stress amplitude σ a , mean stress σ m and stress ratio R are defined as:
σ a = σ m a x σ m i n 2  
σ m = σ m a x + σ m i n 2 = 1 + R 1 R σ a
R = σ m i n σ m a x
A fundamental form of representing the fatigue behaviour of a material is by means of SN curves [21,26]. In such a plot, the stress amplitude σ a is related to the number of cycles to failure N in a logarithm form with log σ a , 0 and k w being constants according to Equation (4):
log σ a = log σ a , 0 1 k w log N
SN curves have been used as the inputs for the lifetime prediction of adhesive joints for several failure criteria. Unfortunately, the SN curves alone cannot provide information about crack/damage/compliance development that leads to the material’s final rupture. In the case that the structure experiences unpredicted loads or if the designer plans to reuse them in a different work condition, further information regarding the performance of the joint is required.

2.2. Definition of Stiffness and Compliance

Fatigue causes a structure to experience weakening. In the work of Lemaitre [27], the concept of strain equivalence is introduced where a damage variable is presented. The damage is then related to the progression of the weakening in the sample under fatigue by measuring the degradation of sample stiffness as a spring under a load. By applying an external cyclic load at each cycle F N , the corresponding variation in the displacement u N can be measured. The stiffness as a function of each cycle K N , Equation (5), was calculated by dividing the variation in the force by the variation in the local displacement due to fatigue u N f a t :
K N = F N u N f a t
The amplitude compliance per cycle J a ( N ) , i.e., the inverse of the stiffness, is another important parameter when related to the study of fatigue. Several works [15,16] have reported a relationship between the damage experienced by a structure per cycle with its compliance value. The compliance per cycle can be defined as the following:
J a ( N ) = 1 K N

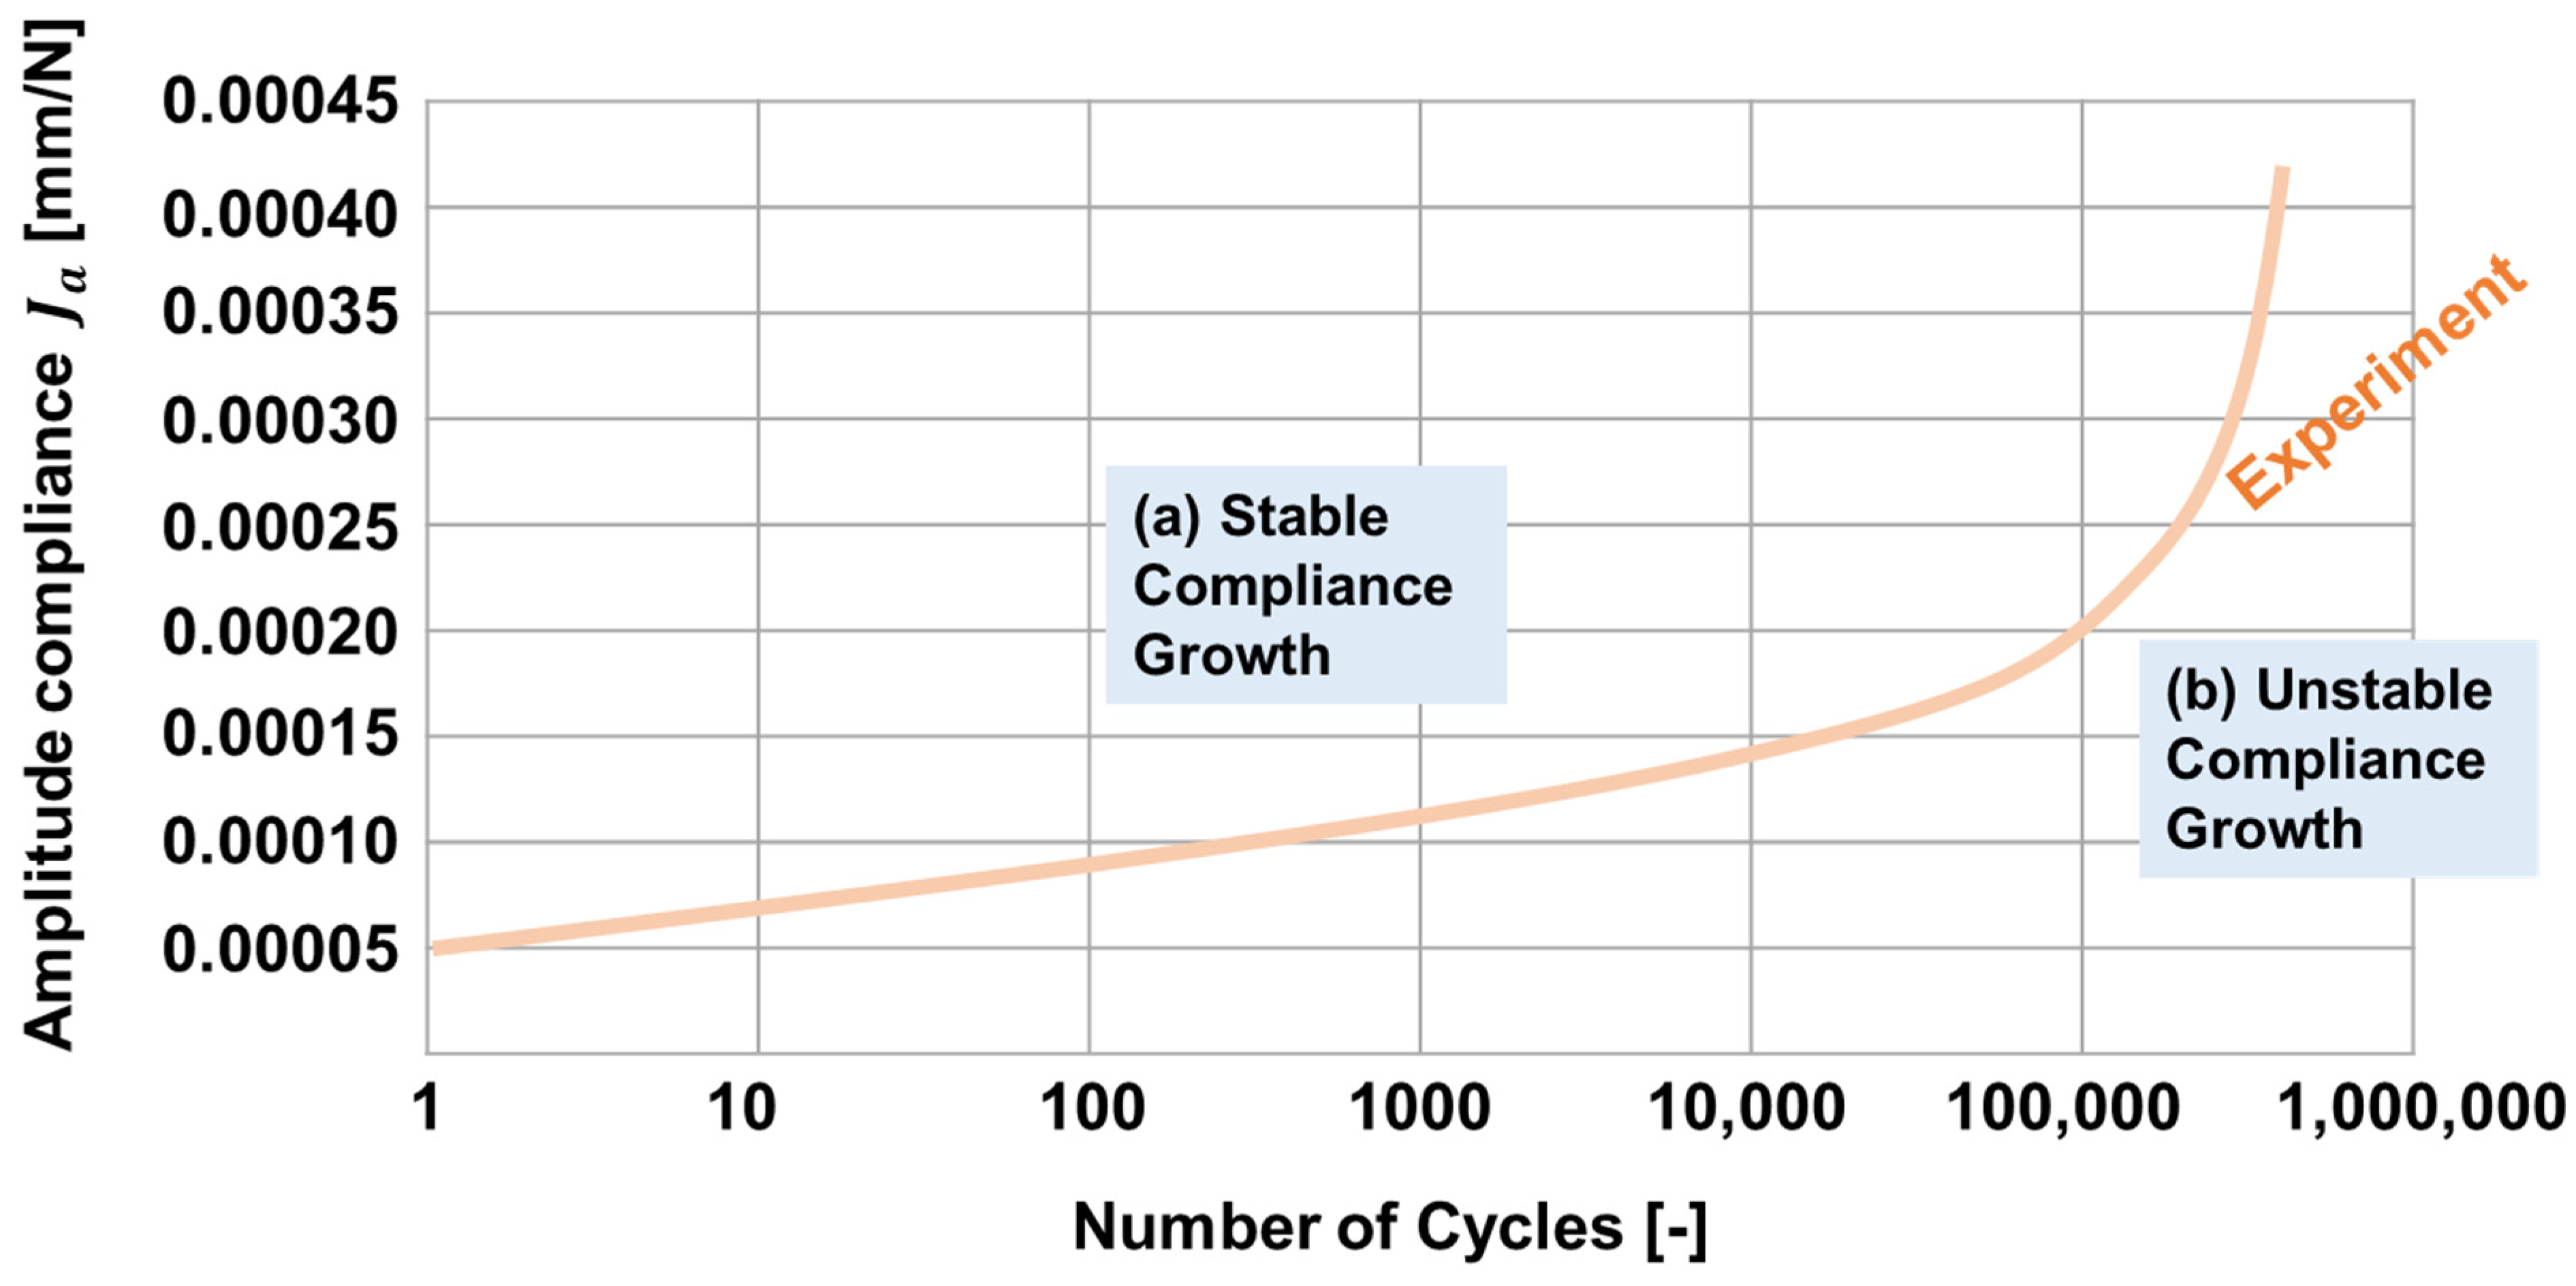
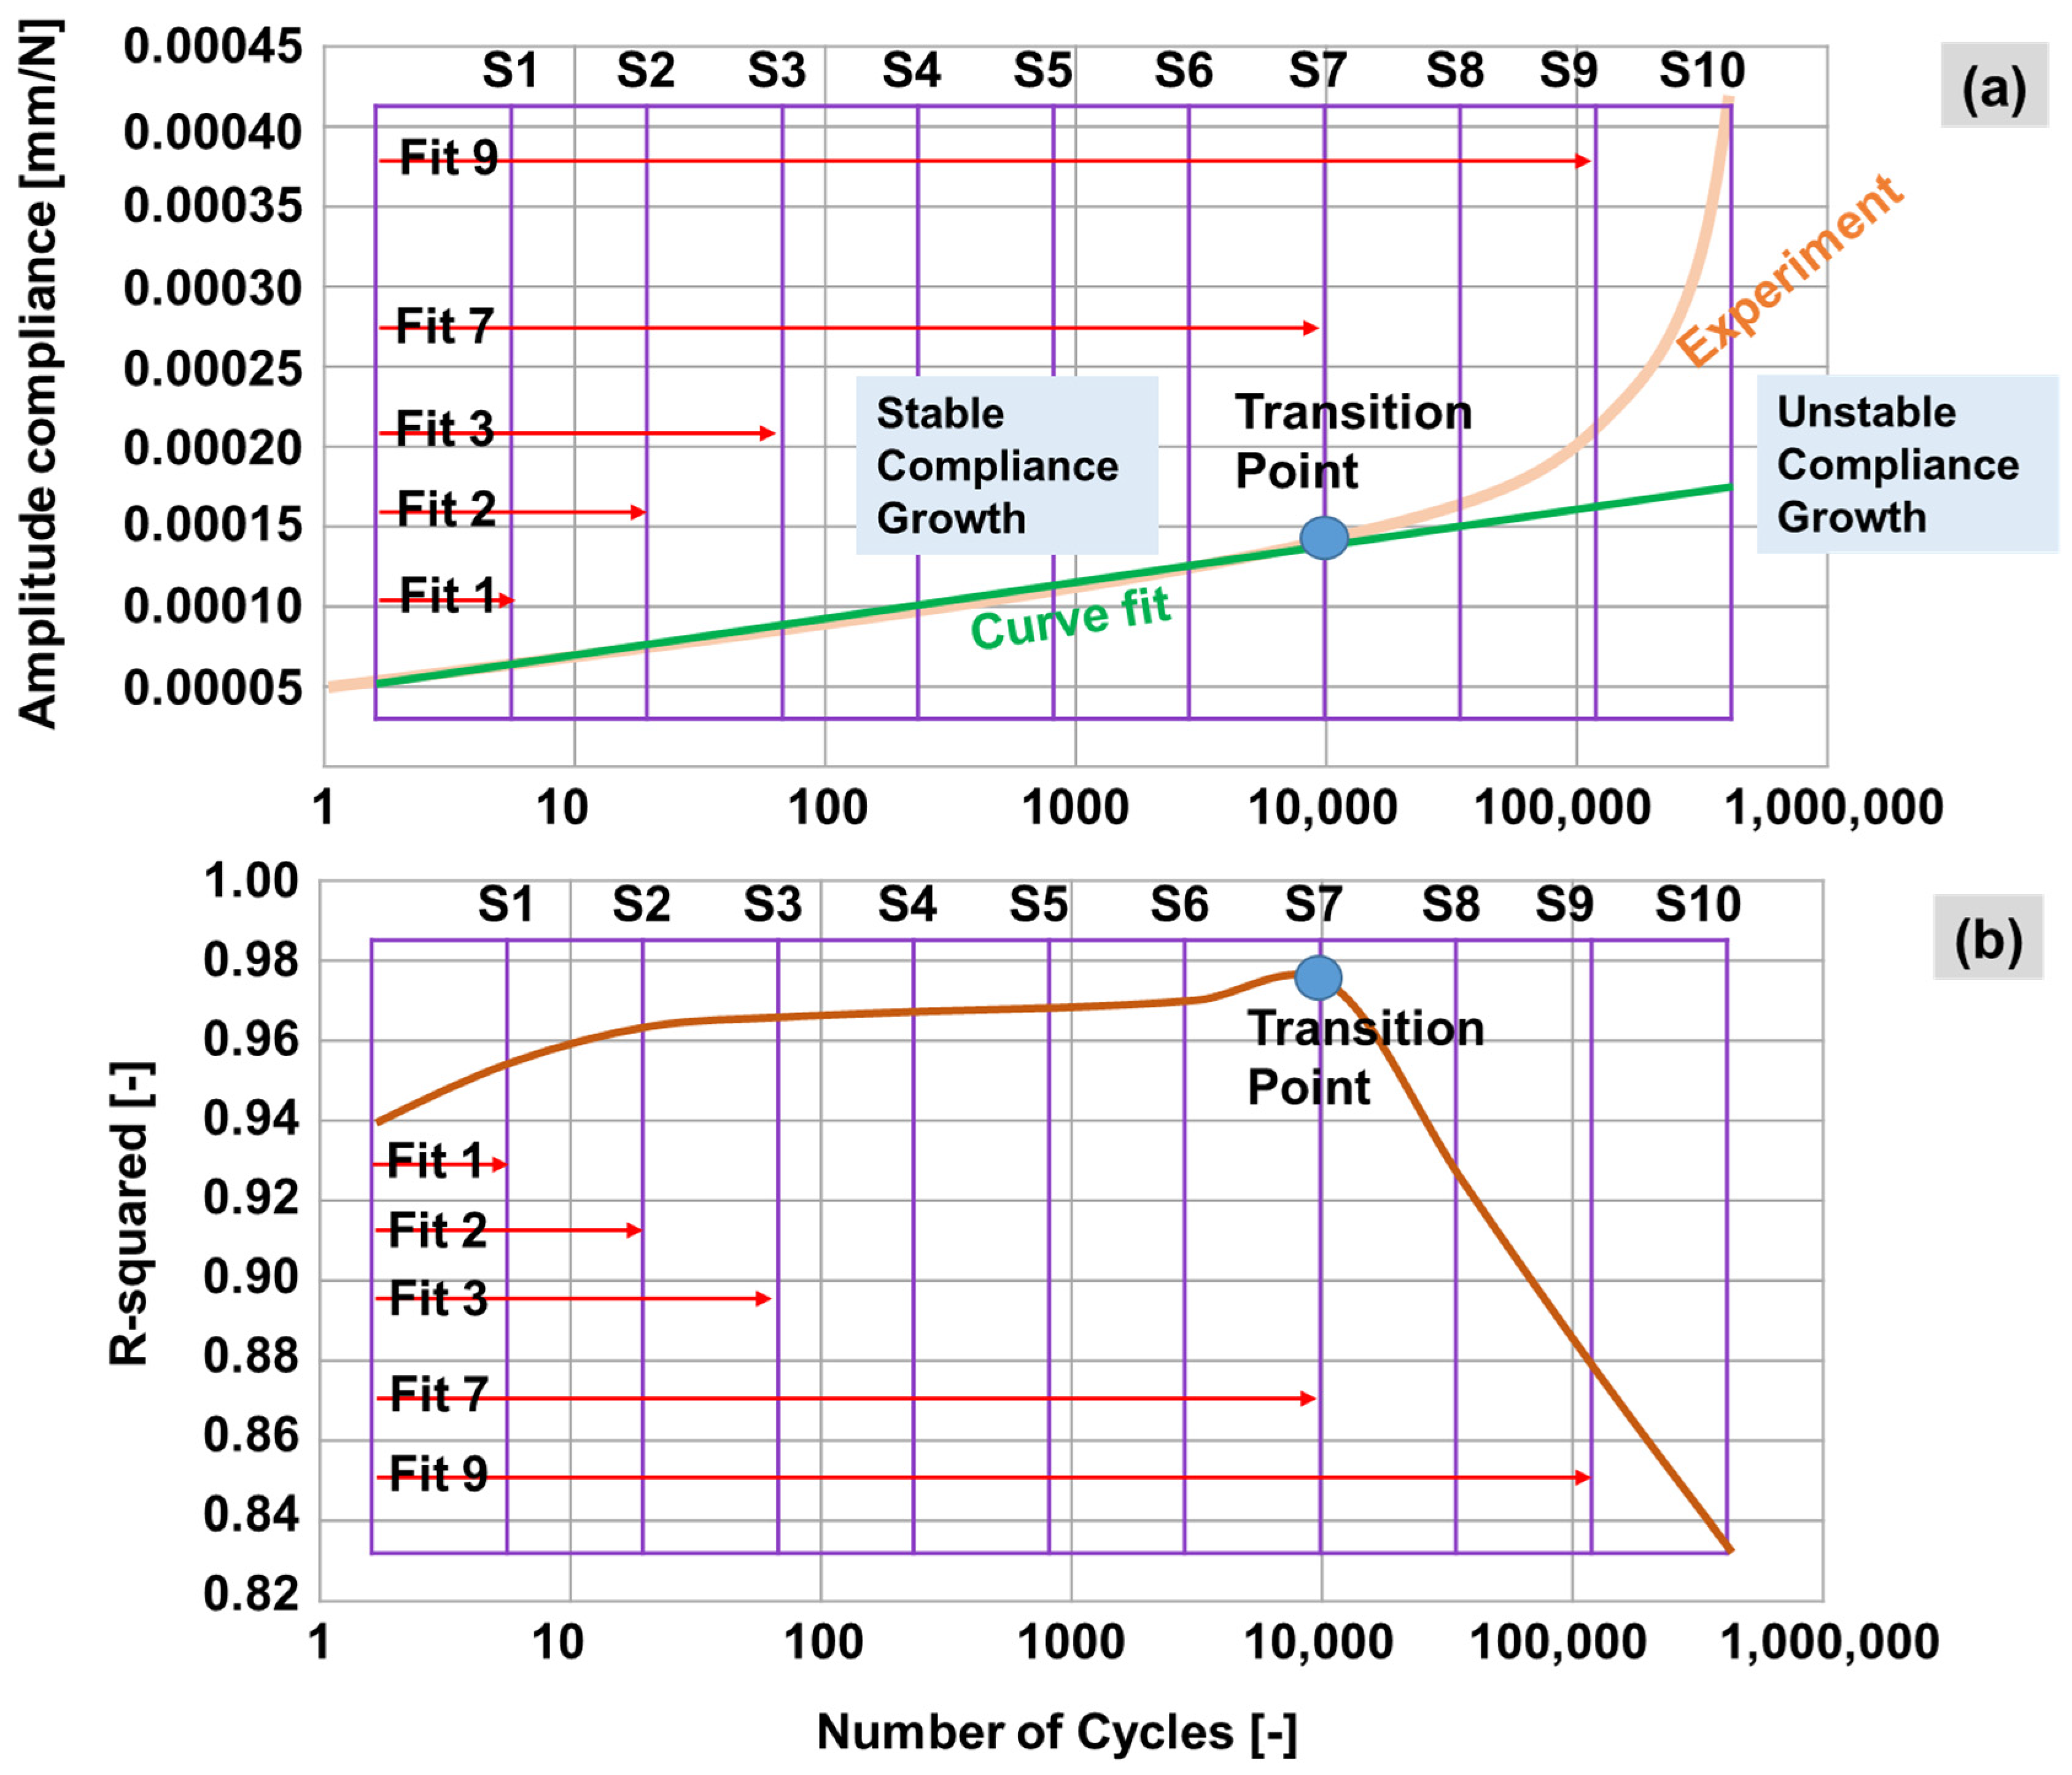
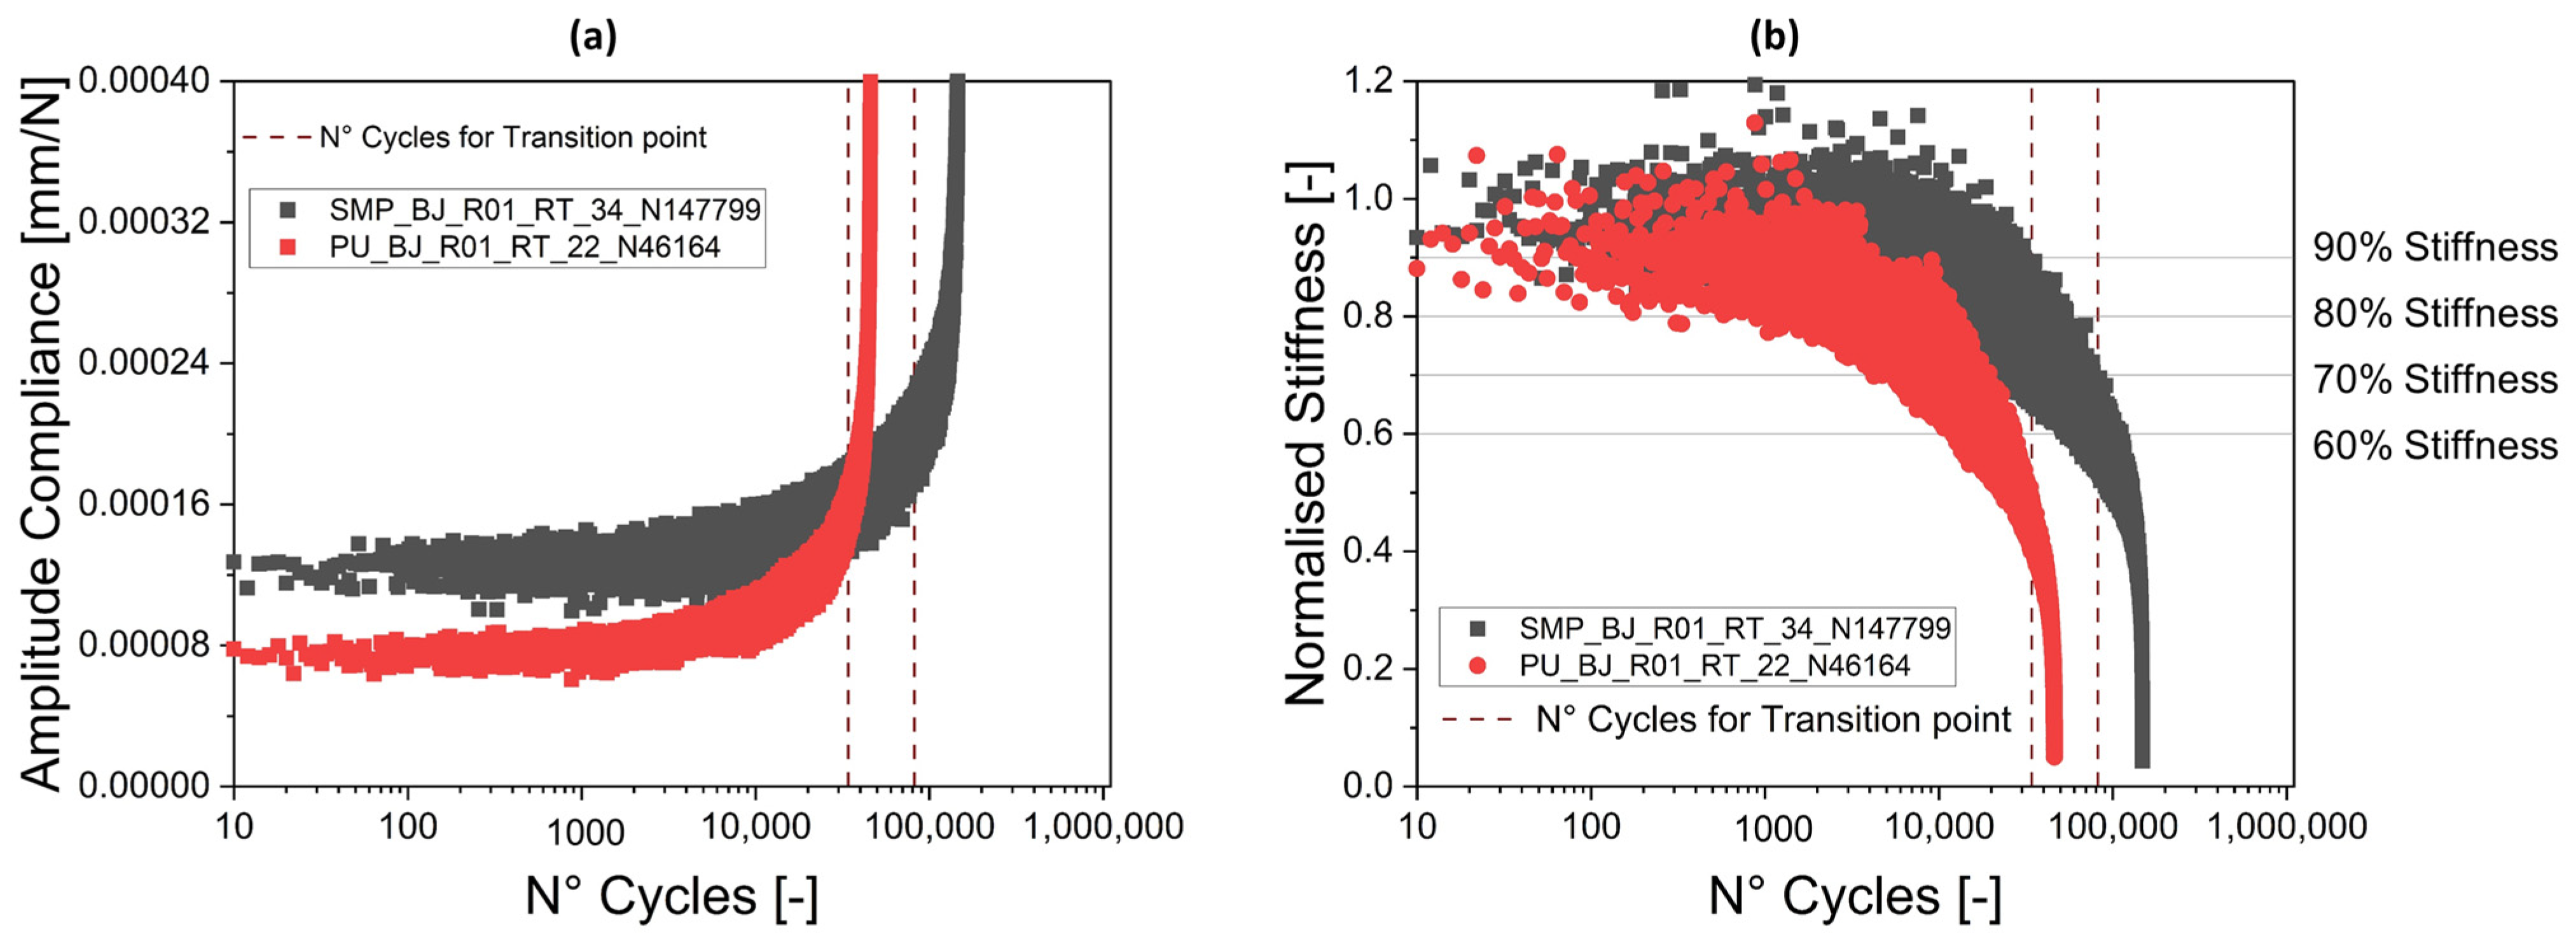
2.3. Stable versus Unstable Compliance Growth

Çavdar et al. [16] observed an inflexion point where the amplitude compliance has a sudden spurt of growth. They called this inflexion a transition point, which by visual assessment was correlated to crack initiation and the start of crack propagation.
In the work of Boutar et al. [11], cyclic fatigue tests were carried out on polyurethane adhesive joints. There, a relationship was shown between the crack propagation mode and the applied load, indicating that the weakening of the specimen is also a function of the stress state. As described by Costa et al. [28], the growth rate of the compliance decreases due to the strain-energy release rate and is inversely related to the crack length. H. Lorenz et al. [29], in their work on filled elastomer blends, defined a region for stable crack growth and a region for unstable crack growth by comparison with the Paris–Erdogan equation.
Along with the previously described correlation between compliance, crack propagation and fatigue testing, the following distinct regions can be identified: Figure 1a shows where stable compliance growth can be found, and Figure 1b shows where unstable compliance growth takes place. The region of stable compliance growth can be identified as the region in which the linear relationship between the number of cycles (in log scale) and amplitude compliance can be constructed. The moment this relationship is no longer linear, the region of unstable compliance growth begins. The determination of these two regions will be discussed in more detail in Section 4.

3. Experimental Methodology

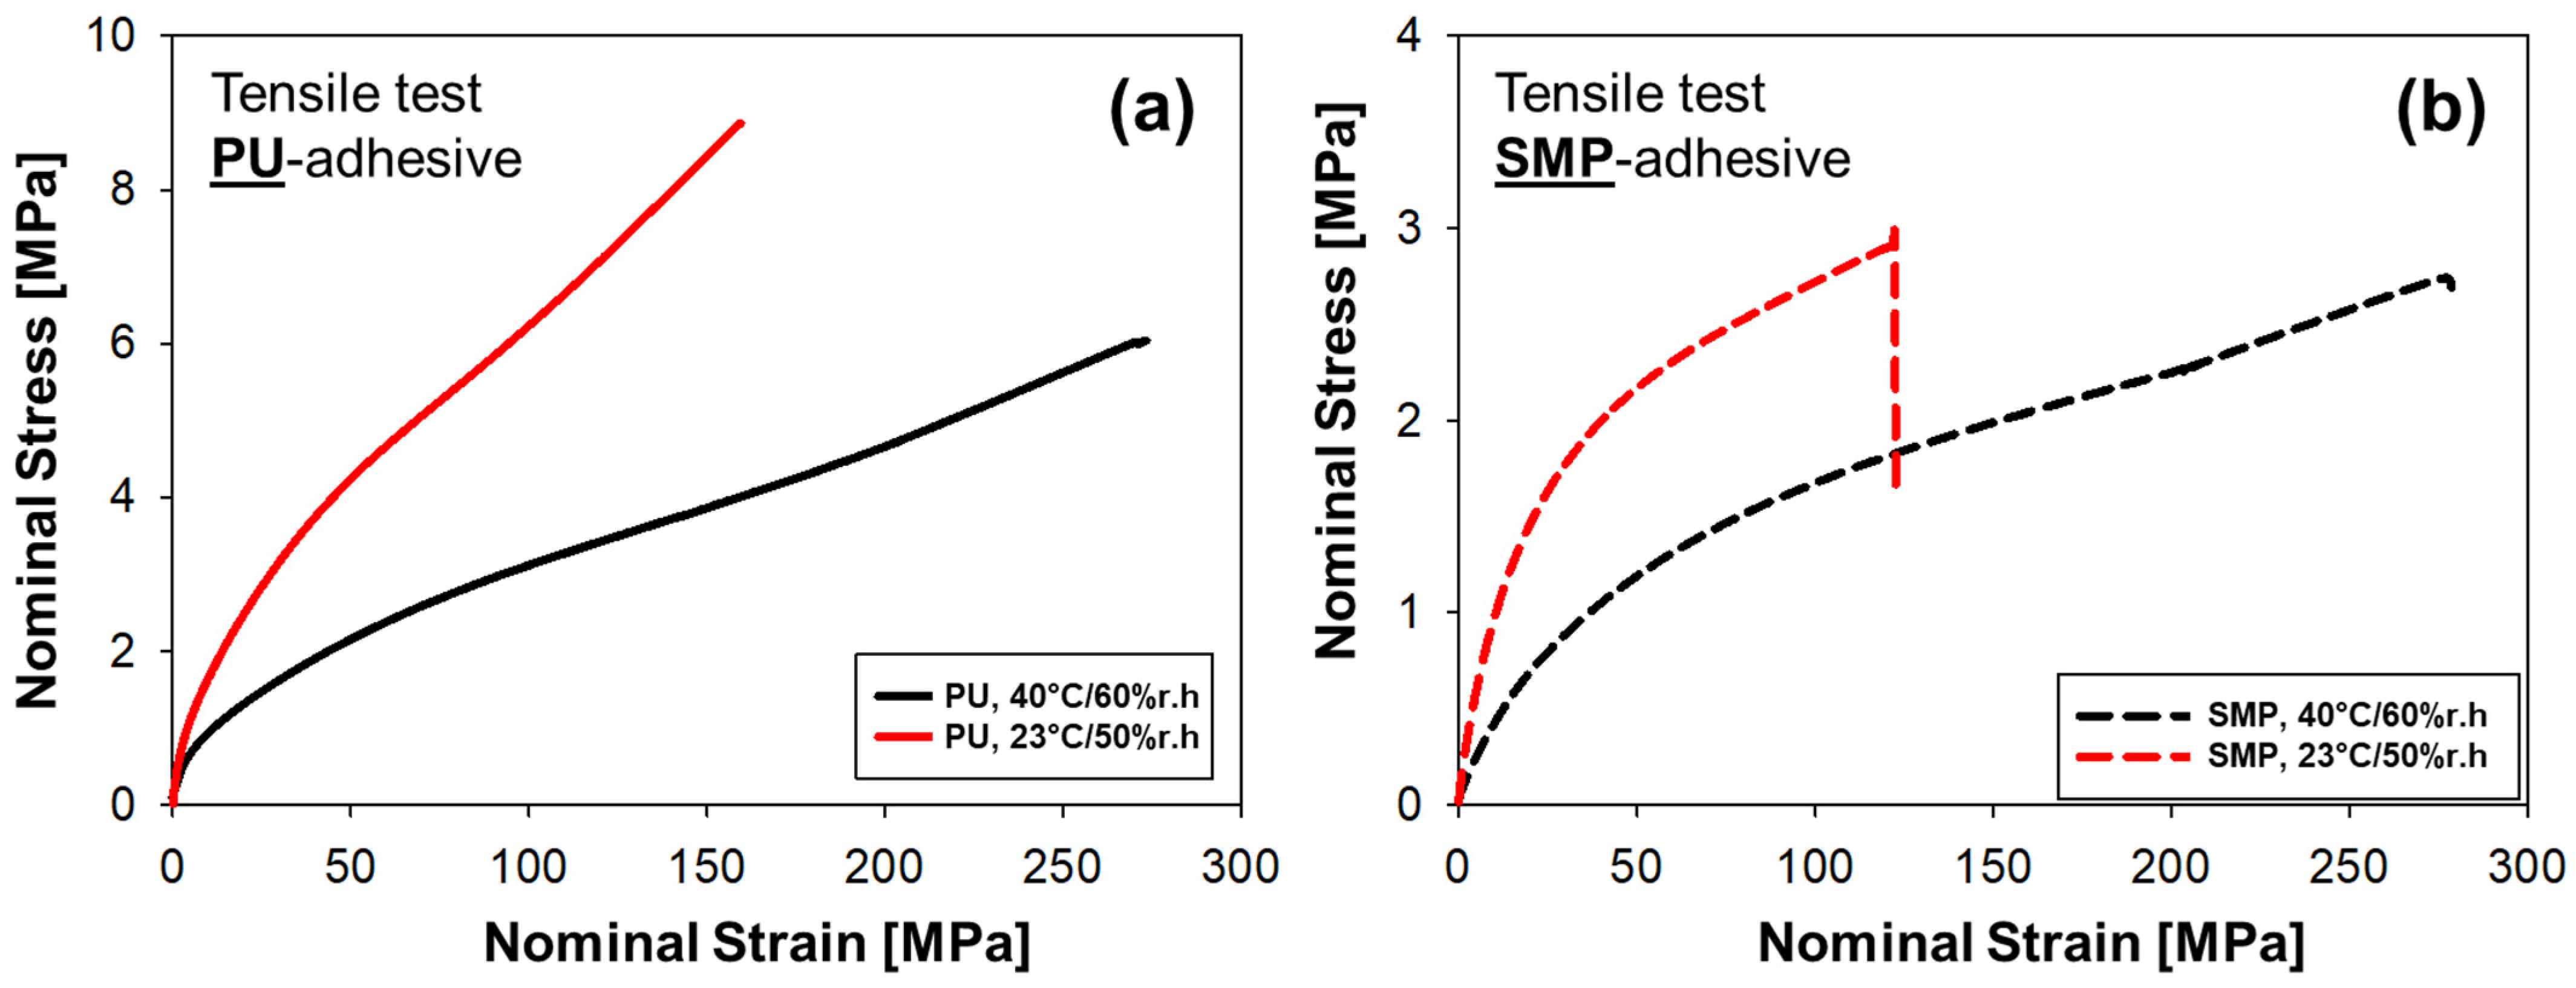
3.1. Adhesive and Joint Types

Two types of elastomer adhesive systems commonly used in the railway and automotive industries are investigated: a polyurethane adhesive (PU) and silane-modified polymer adhesive (SMP). The elastomeric PU and SMP adhesives used in this research can be described as “glazing systems” that are specifically engineered to facilitate the quick and effective bonding of windshields in the automotive aftermarket as well as within original equipment manufacturing (OEM), bus, coach, train construction and various segments of the transportation industry [30].
One of the best properties that both adhesives show is reparability [31], a key advantage in terms of safety design. However, while polyurethanes consist of isocyanate-terminated polymers [32] with polyaddition cure, SMPs were developed as an isocyanate-free alternative, consisting of silane-terminated polyether blocked with a cross-linker through poly-condensation [33]. An adhesive characterization of both adhesives was performed through quasi-static tests of pure adhesive specimens according to DIN 6701-3 [34] at 23 °C/50% r.h. and 40 °C/60% r.h. Both adhesives exhibit strong non-linearity (hyperelasticity) that is typical of elastomeric materials, as one can observe in Figure 2.
Both adhesives were bonded into two types of joints: butt joint and TAST (thick adherend shear test) joint. The use of different geometries is related to the generation of distinct stress states: the butt joint presents a predominant tensile stress, whereas the TAST joint presents a predominant shear stress.
For butt joints, experimental tests have shown that the failure takes place from the inside to the outside of the adhesive cross-section. On the other hand, experiments with the TAST joint have shown that the failure starts from the external borders of the geometries. This behaviour is due to the edge effect (concentration points) that leads to the adhesive layer suffering higher peak stresses in the edges [14]. The use of geometries that lead to different stress distributions is fundamental to understand their failure patterns.
For the adhesive joints, the substrates were made of the aluminium alloy EN AW 6082 (AlMgSi). An epoxy primer coating for metals was applied on the substrates to improve adhesion. For both adhesive systems, prior to bonding, the substrates were cleaned with solvent, and then, a liquid primer was applied. Since both adhesives were moisture-curing systems, the diffusion of moisture from the ambient air into the bonded joint played an important role. Each adhesive system had different curing times (two weeks for the PU and four weeks for the SMP). For each type of adhesive joint geometry, a corresponding bonding device was used to ensure the correct geometry parameters (e.g., adhesive layer thickness, overlap length) until the adhesive joints were fully cured [14]. The dimensions of the joint are given in Figure 3 with both joints having a thick nominal adhesive layer of d a d h = 5 mm.

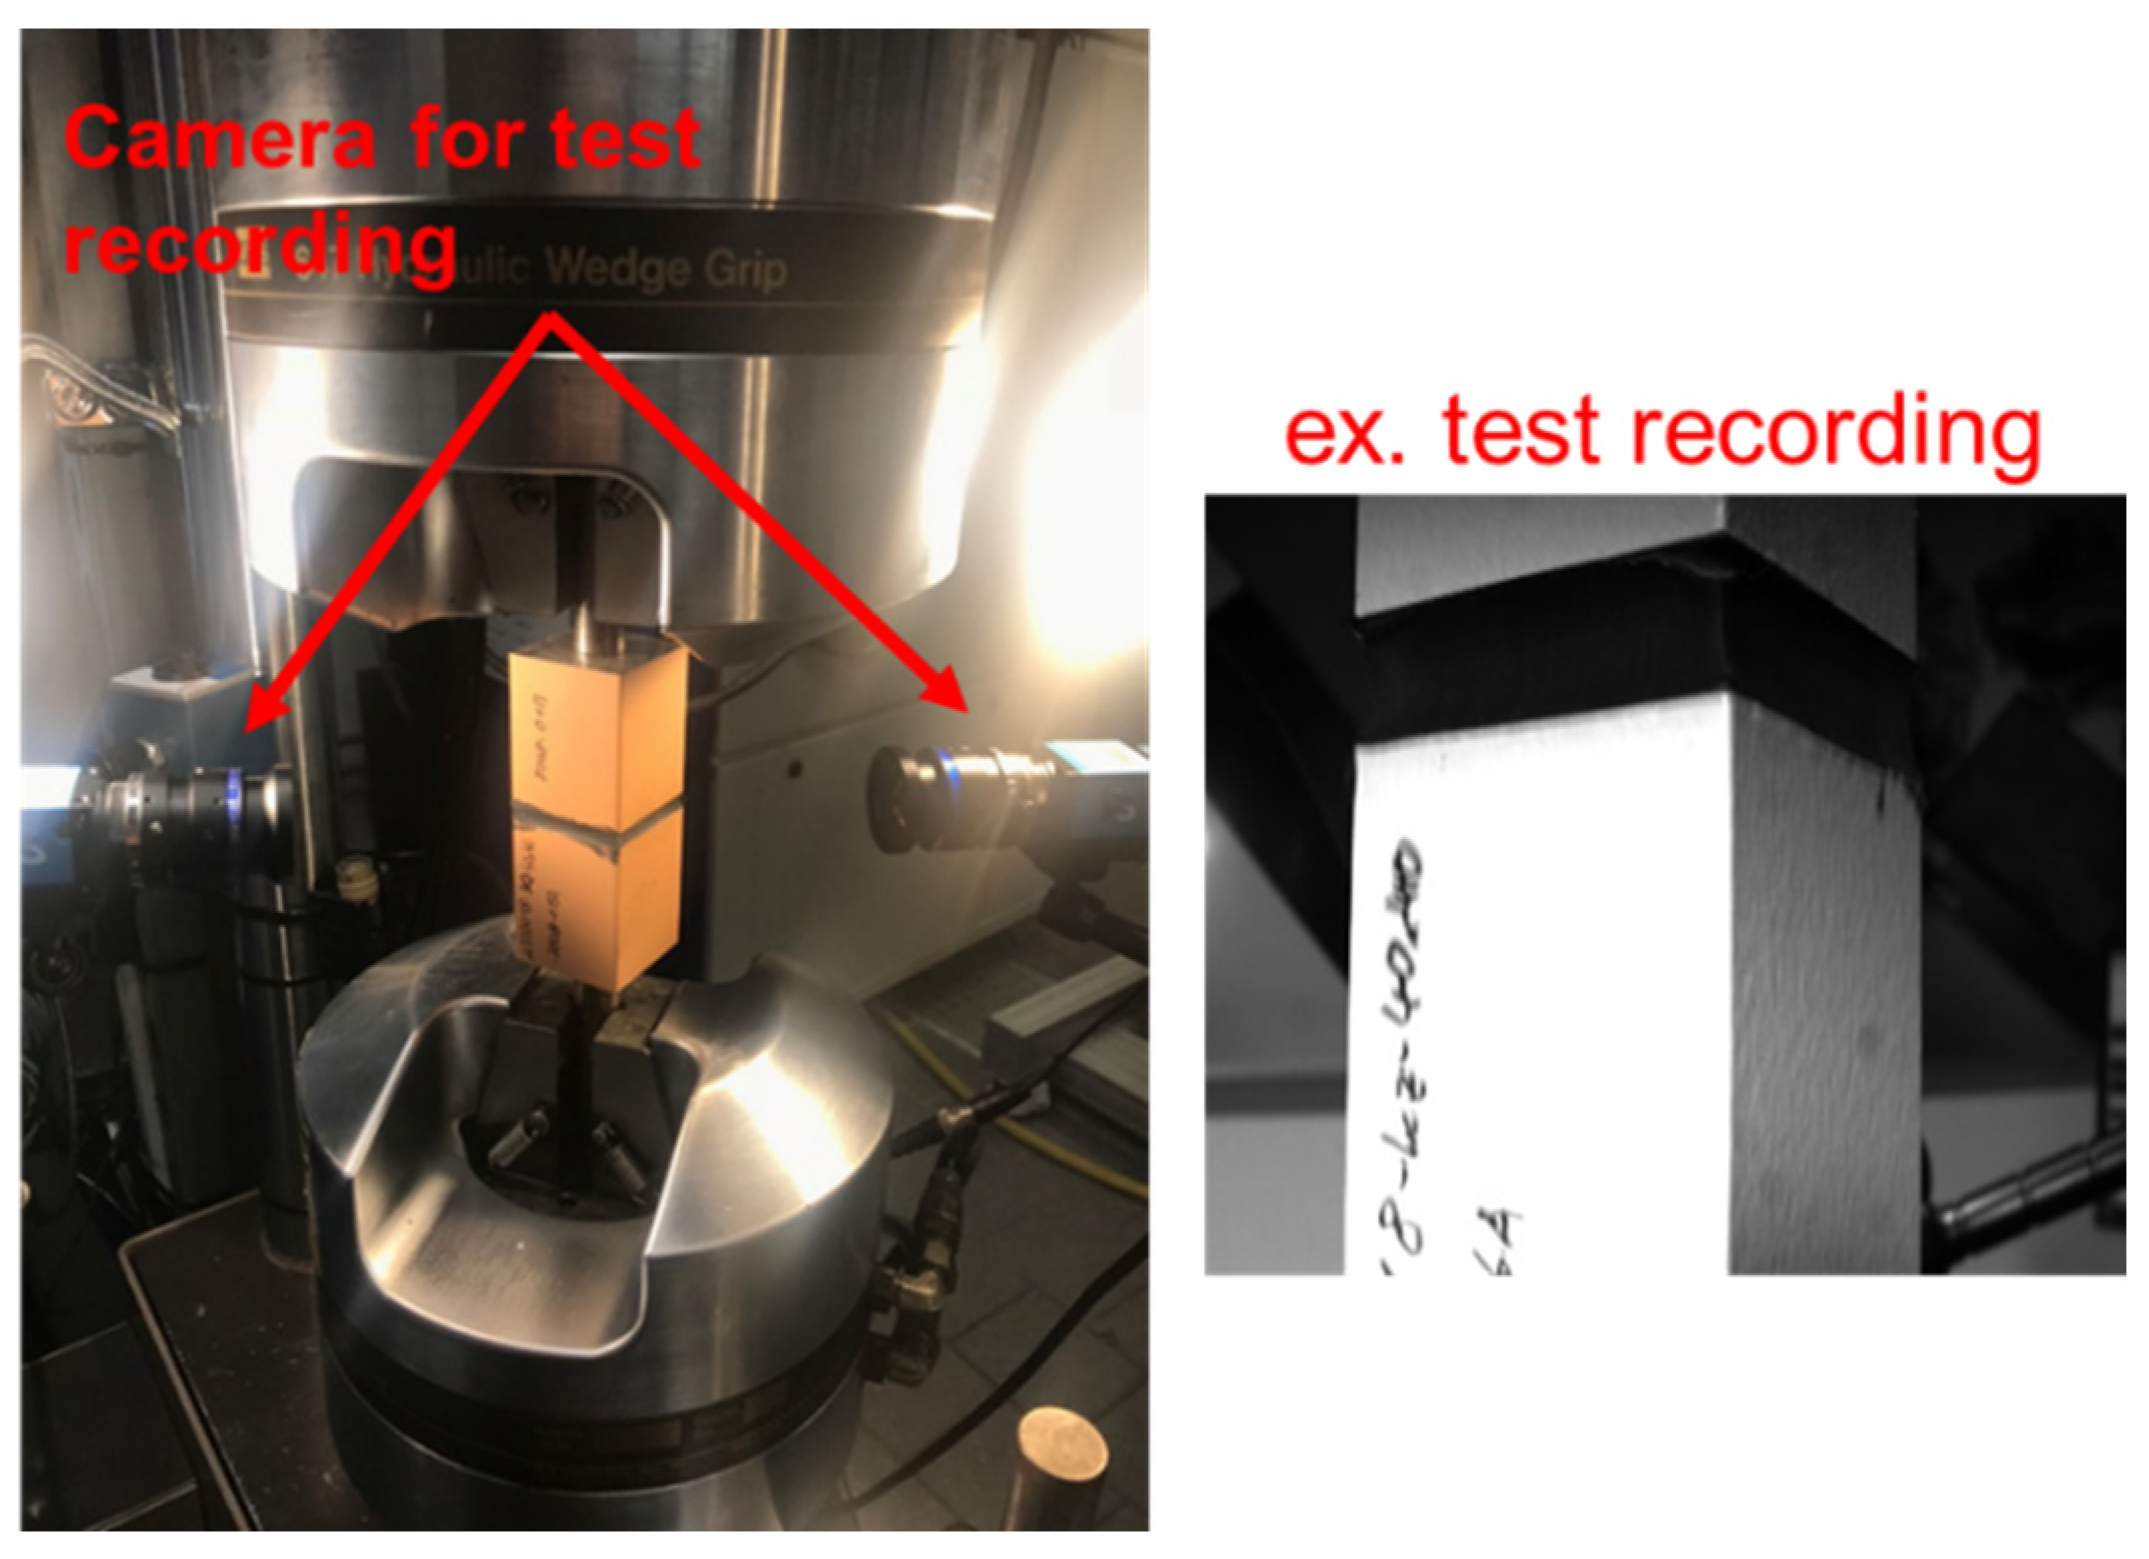
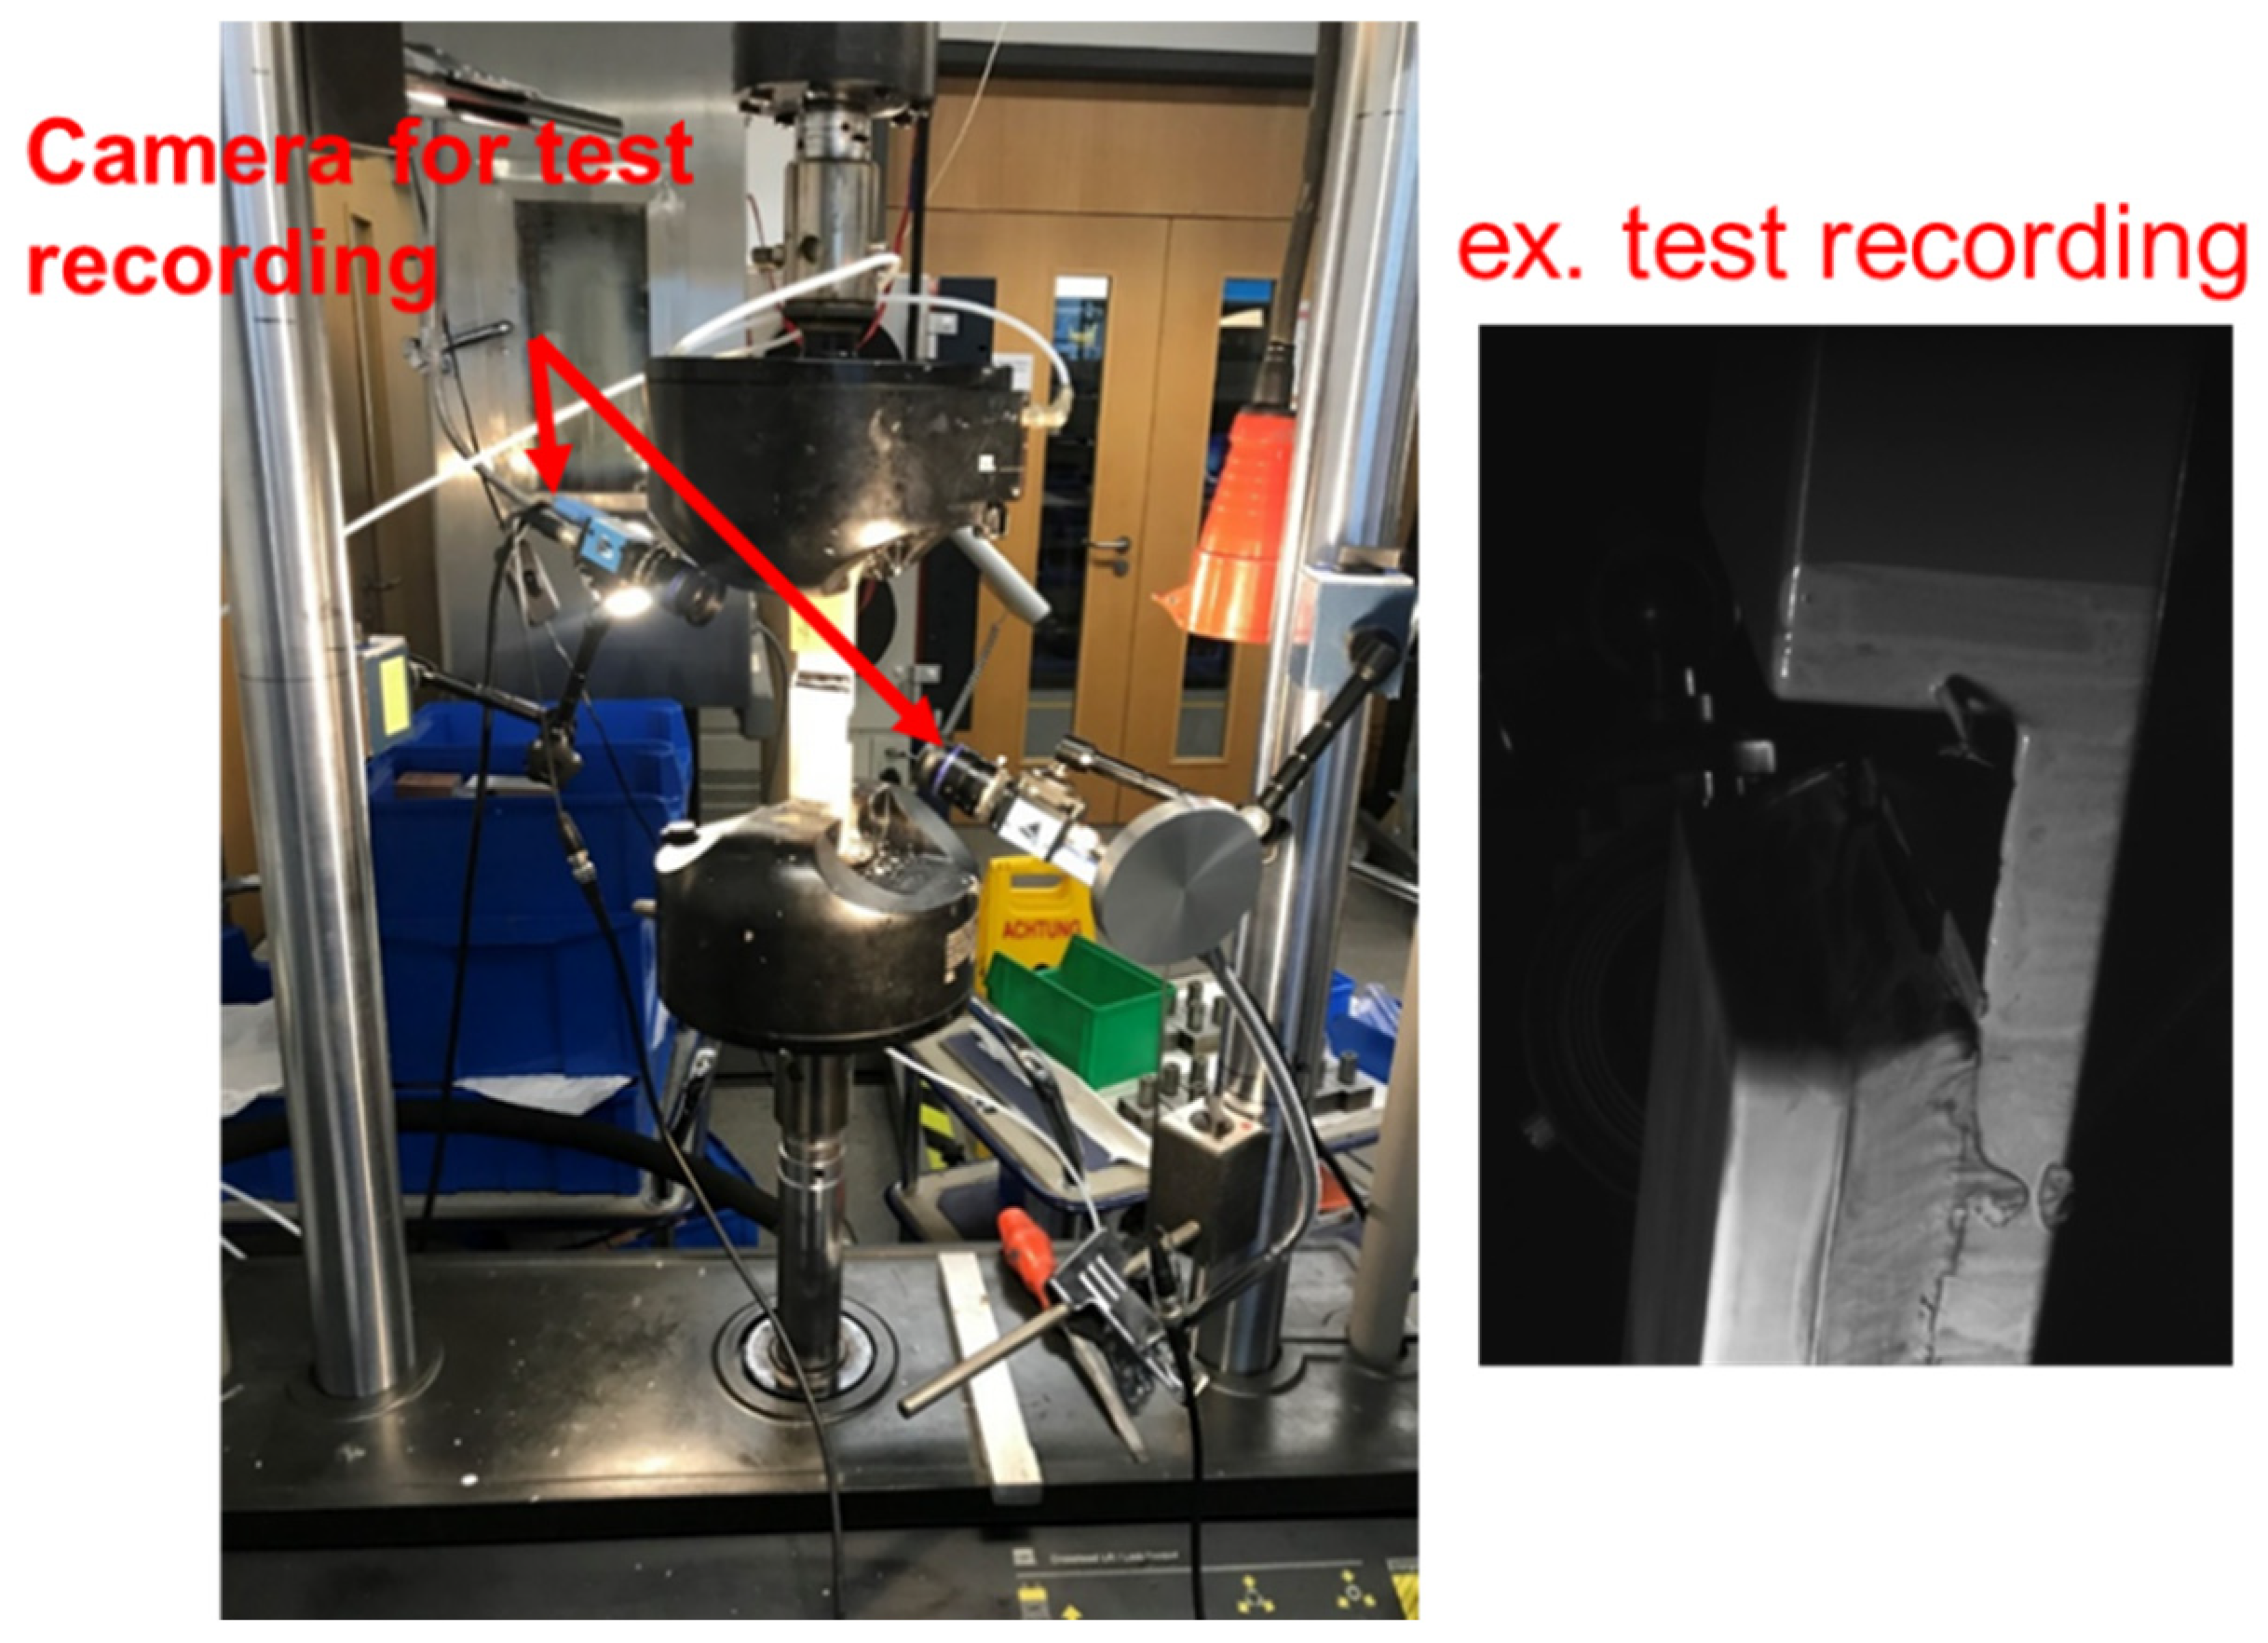
3.2. Fatigue Testing

In Table 1, a test sequence list is shown for the PU and SMP adhesives for each variation in joint, stress ratio and environmental conditions. The fatigue tests were performed in a servo-hydraulic machine, where a sinusoidal loading with stress ratios of R = 0.1, 0.5 (tensile–tensile loading) and R = −1 (tensile–compressive loading) were applied with a frequency of 7 Hz.
To carry out these tests under the conditions of 40 °C/60% r.h, the servo-hydraulic machine was connected to a climate chamber. Before carrying out the fatigue tests at 40 °C/60% r.h, the samples were placed in the climate chamber for a minimum of 4 weeks to ensure that the adhesive layer reached a fully saturated moisture content. This experimental setup resulted in the measurement of a total of 22 SN curves.
Throughout each test cycle, the force and displacement values (maximum and minimum) were recorded, allowing for the calculation of the stiffness and compliance per cycle. To visually monitor the tests, two cameras were positioned on each side of the adhesive joint, as shown in Figure 4 (butt joint) and Figure 5 (TAST joint).

4. Proposed Method for the Determination of the Unstable Compliance Growth Region

As described in Section 2.3, two distinguished regions can be related to the behaviour of the sample under cyclic loading: (i) a region of stable compliance growth and (ii) a region of unstable compliance growth. For a fatigue design, it is key to maximize the possible design lifetime while being safe and conservative. Therefore, the determination of the transition point between these two different fatigue behaviours presents a solution for an optimal fatigue design.
The proposed method relies on a recursive fitting procedure in Python, an extension of a method proposed by Çavdar et al. [16], to determine the transition point that separates the region of stable compliance growth from the region of unstable compliance growth. As shown in Figure 6a, the lifetime is iteratively divided into sub-rectangles of equal width (S1, S2…). Then, linear fitting procedures (Fit 1, Fit 2, …, Fit n) with increasing width (green curve) are carried out to fit the experimental data (orange curve) until the limit of the sub-rectangle using Equation (7):
J a N = J 0 + A 0 log N
where J 0 and A 0 are model constants.
In Figure 6b, the corresponding coefficient of determination (R-squared) to each fit is plotted to the respective sub-rectangle. The fit parameters and R-squared values are stored as an indicator of the goodness of the fit. The point that separates the region of stable compliance growth from the region of unstable compliance growth represents the position of the sub-rectangle in which the values of the coefficient of determination do not reach any other maximum.

5. Experimental Results

5.1. Implementation

The objectives of this investigation are the following: (a) to analyse the degradation pattern of stiffness in the PU and SMP joints with respect to lifetime, stress ratio and applied stress state; (b) to compare the fatigue design curves between different degrees of stiffness reduction (90%, 80%, 70% and 60%) and the transition point with regards to scatter and R-squared values; and (c) to evaluate the consistency of each approach by calculating the “failure ratio” for each method while combining butt and TAST joint sample data.
Figure 7 shows a flowchart that illustrates the study design. For each unique combination of fatigue tests, which includes adhesive type, joint type, stress rate and environmental condition, three distinct sets of data will be collected: (i) SN curves specific to the given test combination; (ii) load and displacement values recorded for each sample subjected to testing within that combination; and (iii) image recordings taken at regular intervals throughout the testing cycles for each sample within that combination. Once the parameters, such as stiffness and amplitude compliance, have been computed, it is possible to determine the number of cycles associated with each degree of stiffness reduction. By using the compliance method, the number of cycles linked to the transition point can also be determined.
At the same time, along with the cycle counts for each approach, the SN curves are built to consider the cycle counts for each approach. In addition, it is possible to acquire images corresponding to these cycle counts for each approach. As a result, a statistical analysis can be carried out for each SN curve generated for each approach, which allows for the calculation of the “failure ratio” for each fatigue sample. Finally, the images obtained will visually represent the failure patterns observed for each sample and each approach.
The “failure ratio” can be defined as follows:
F a i l u r e   r a t i o = N °   C y c l e s   a c c o r d i n g   t o   a p p r o a c h   N °   C y c l e s   f o r   t o t a l   f a i l u r e  

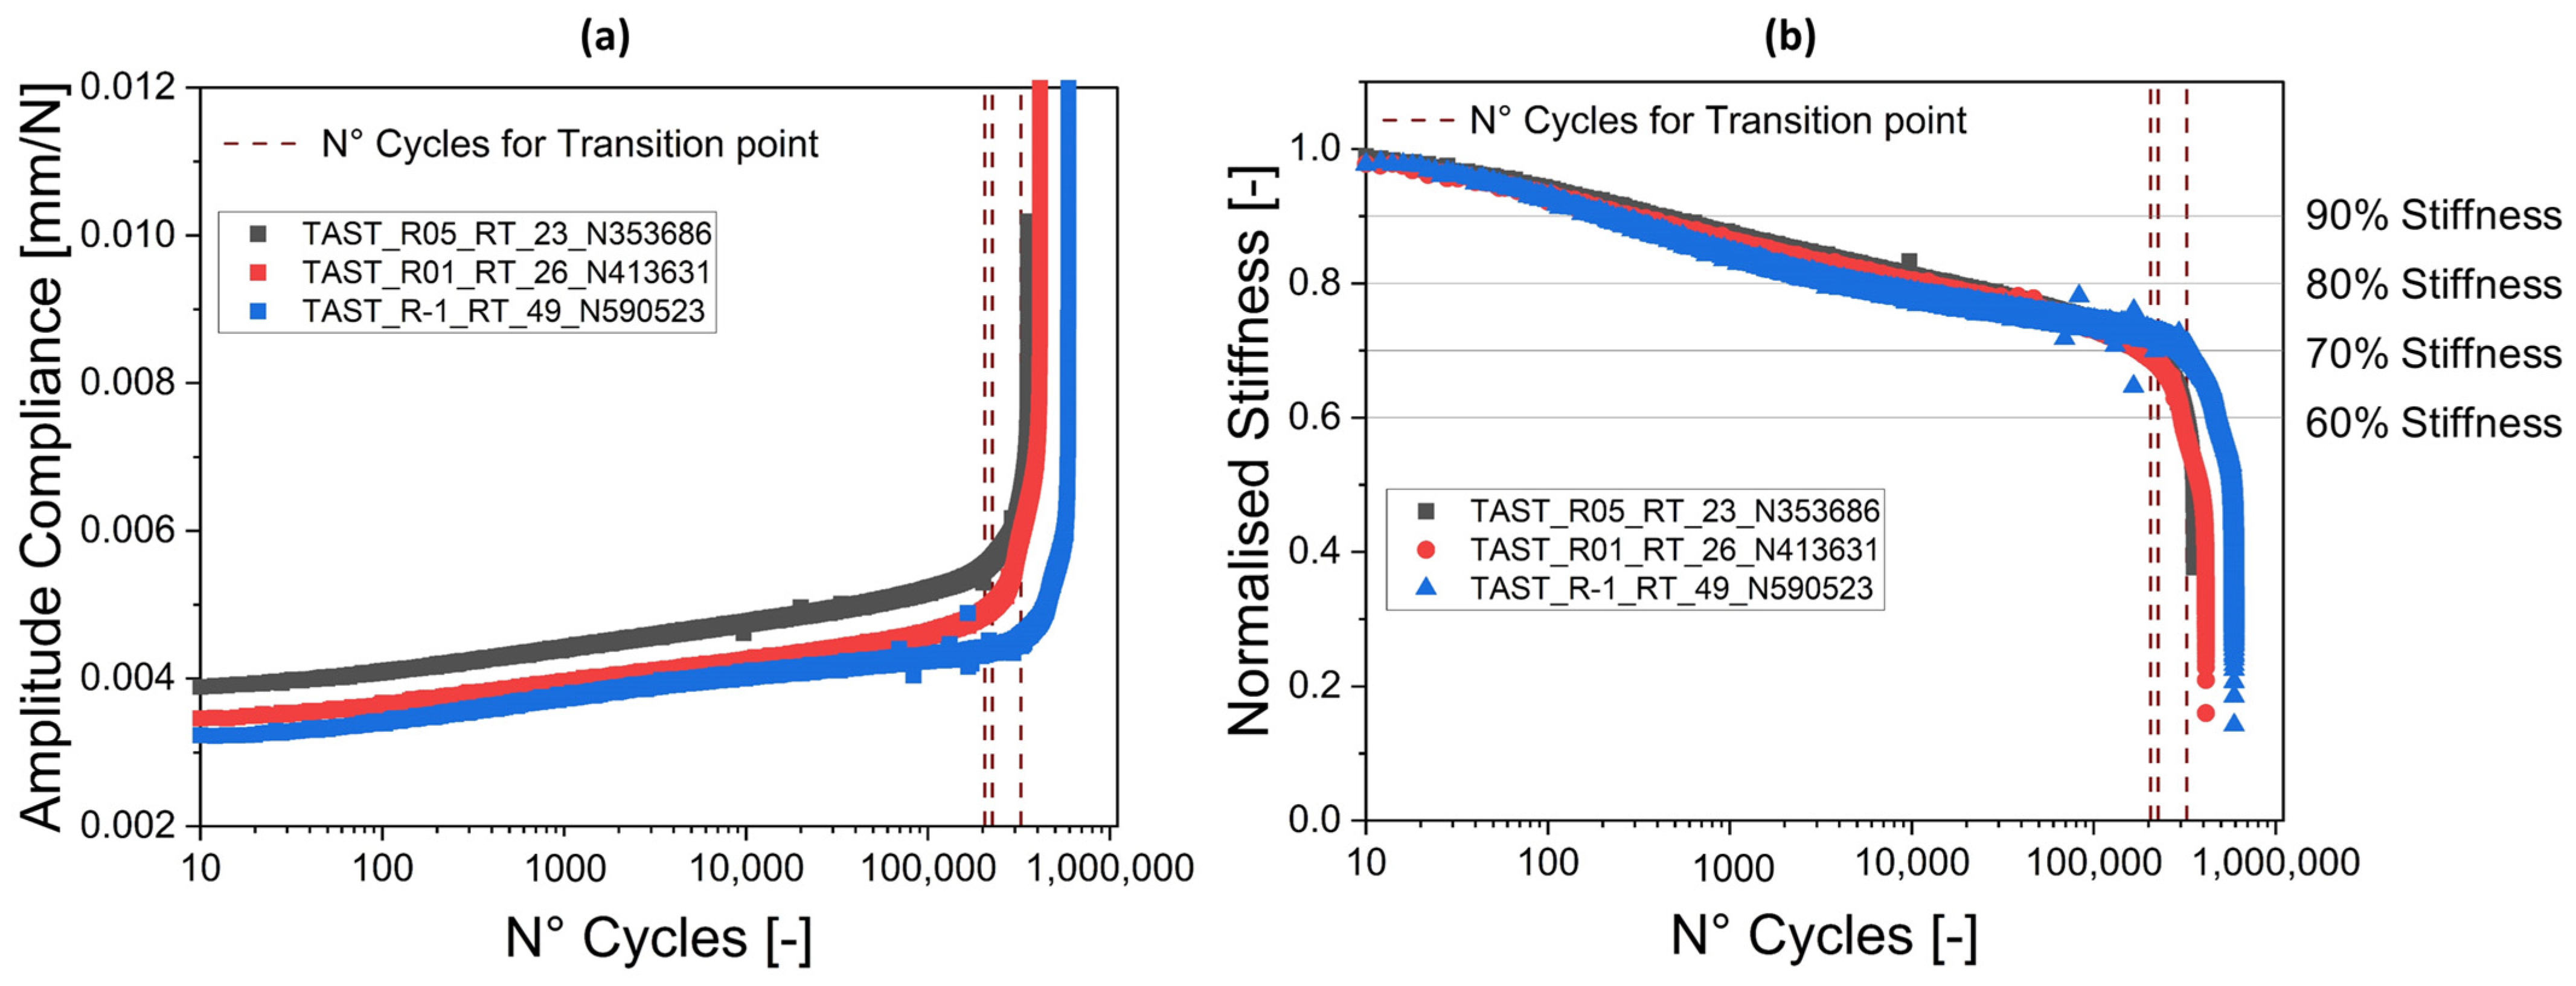
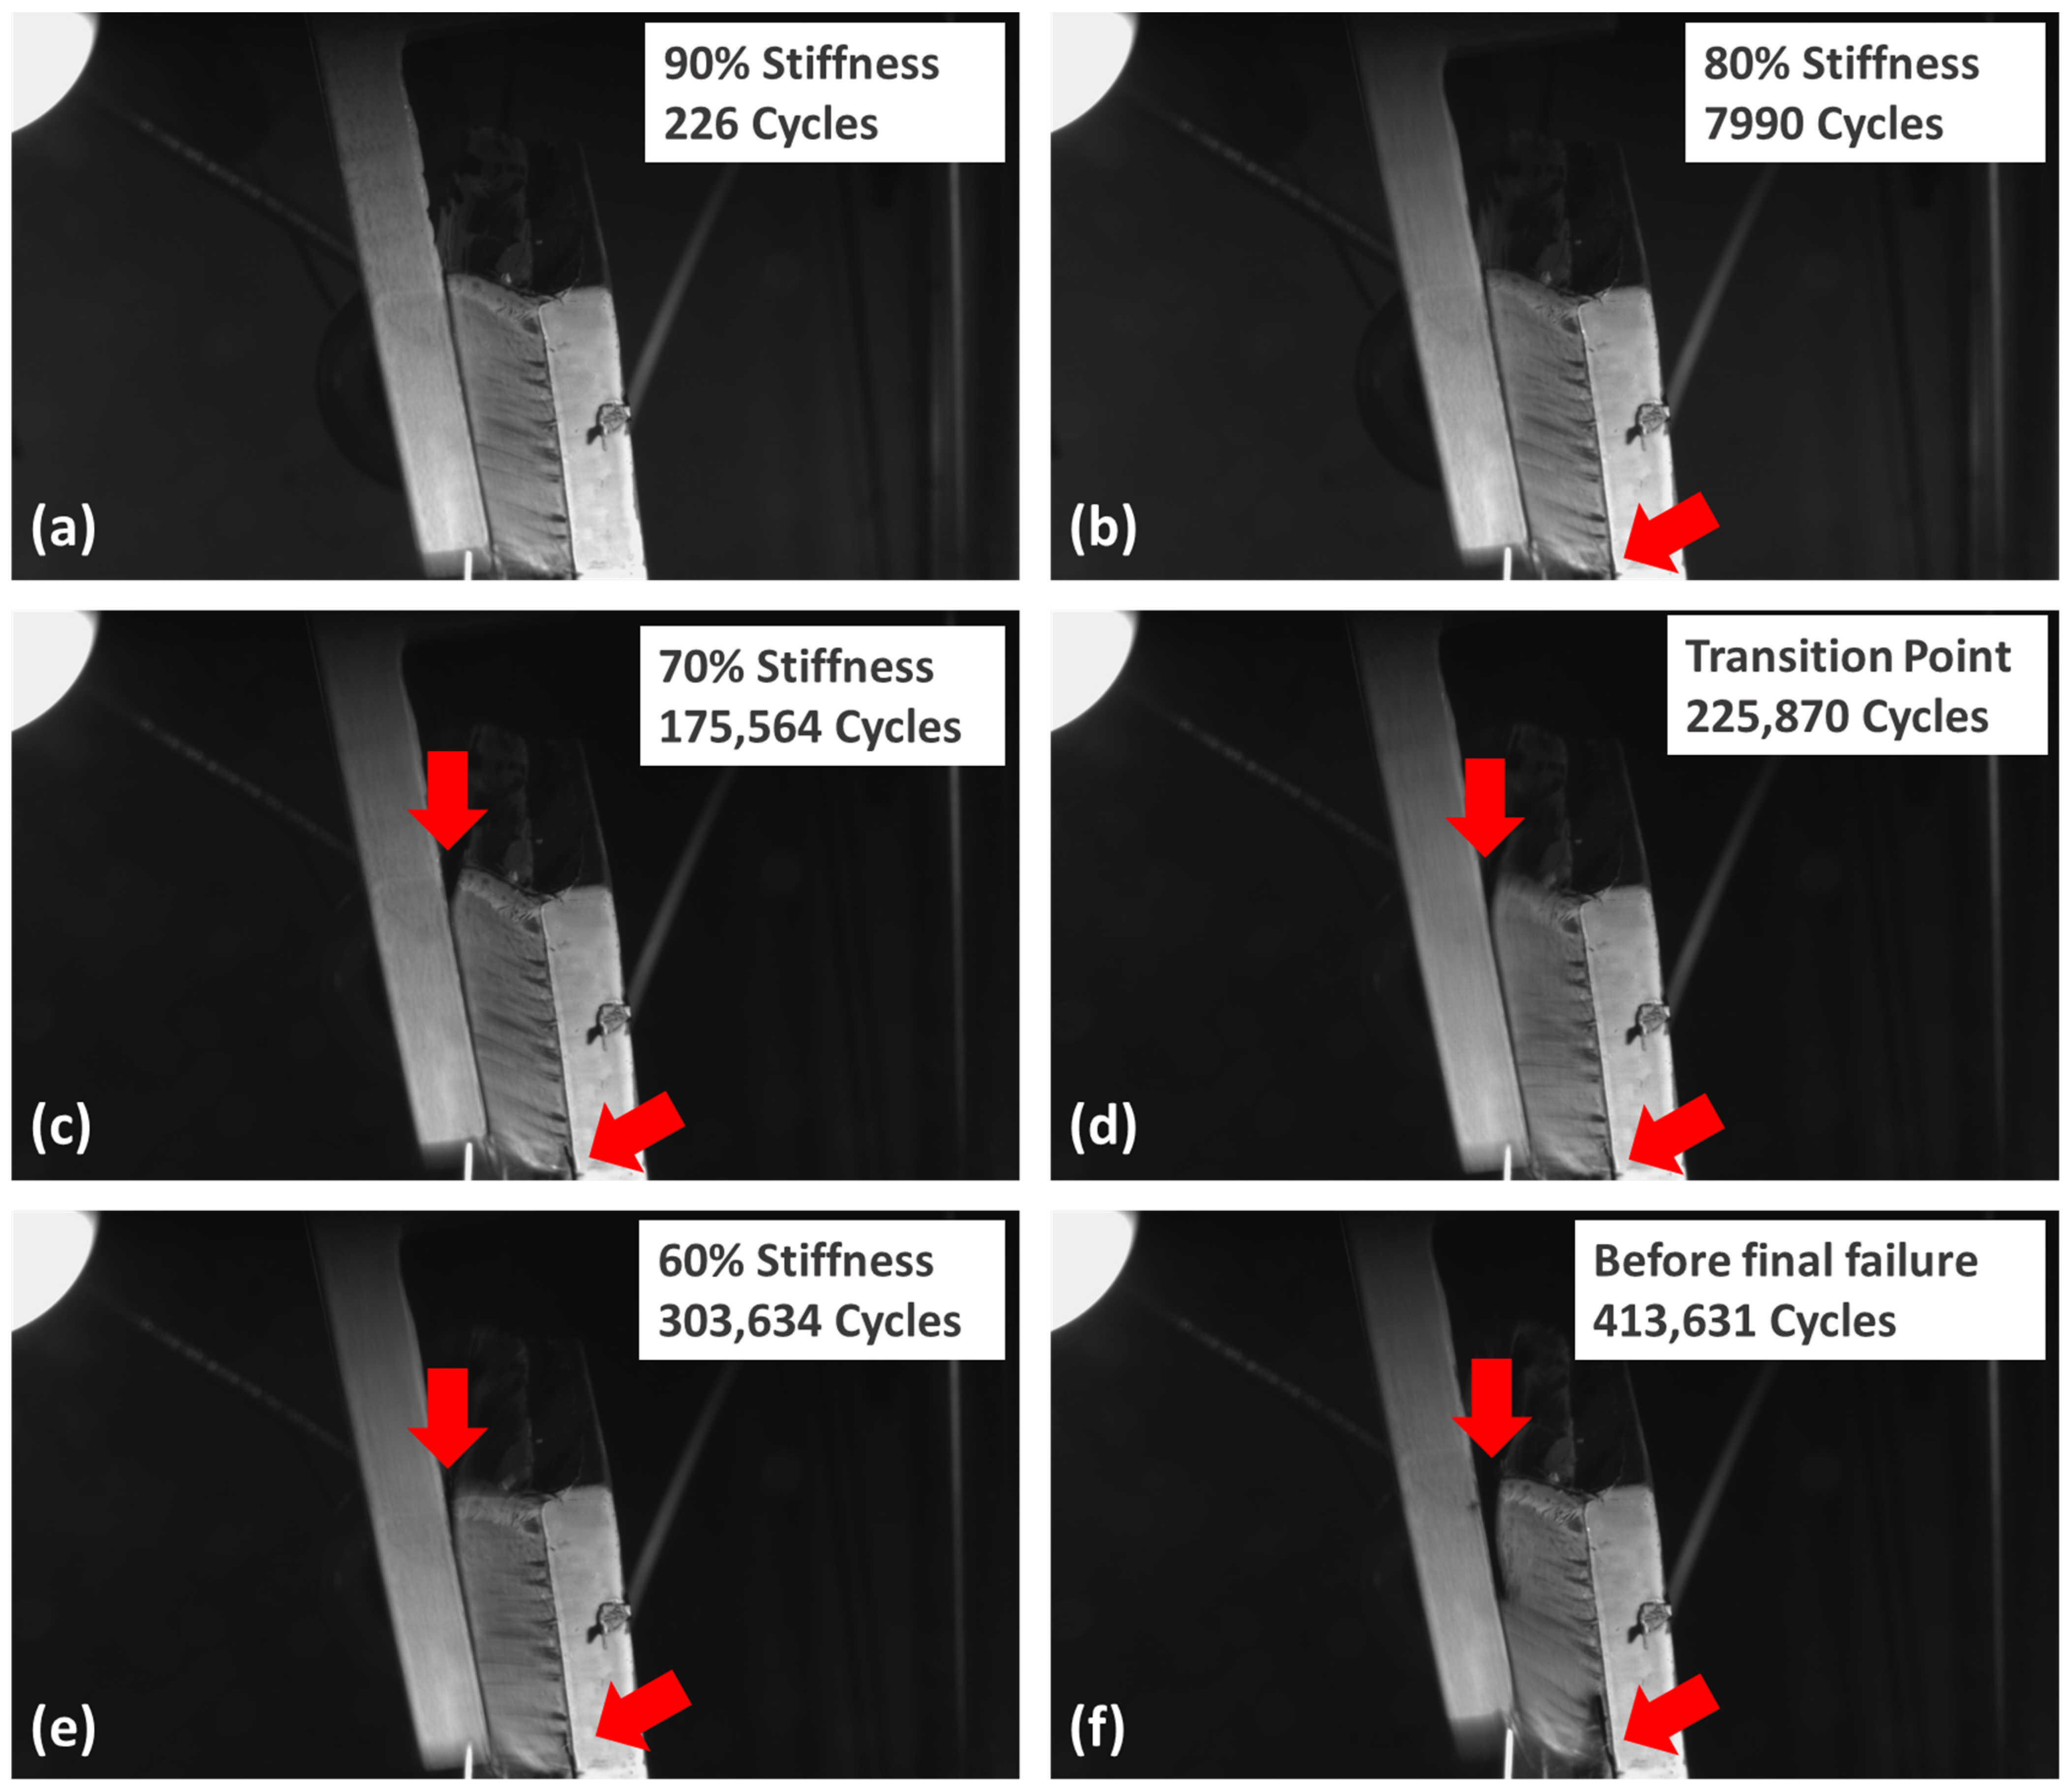
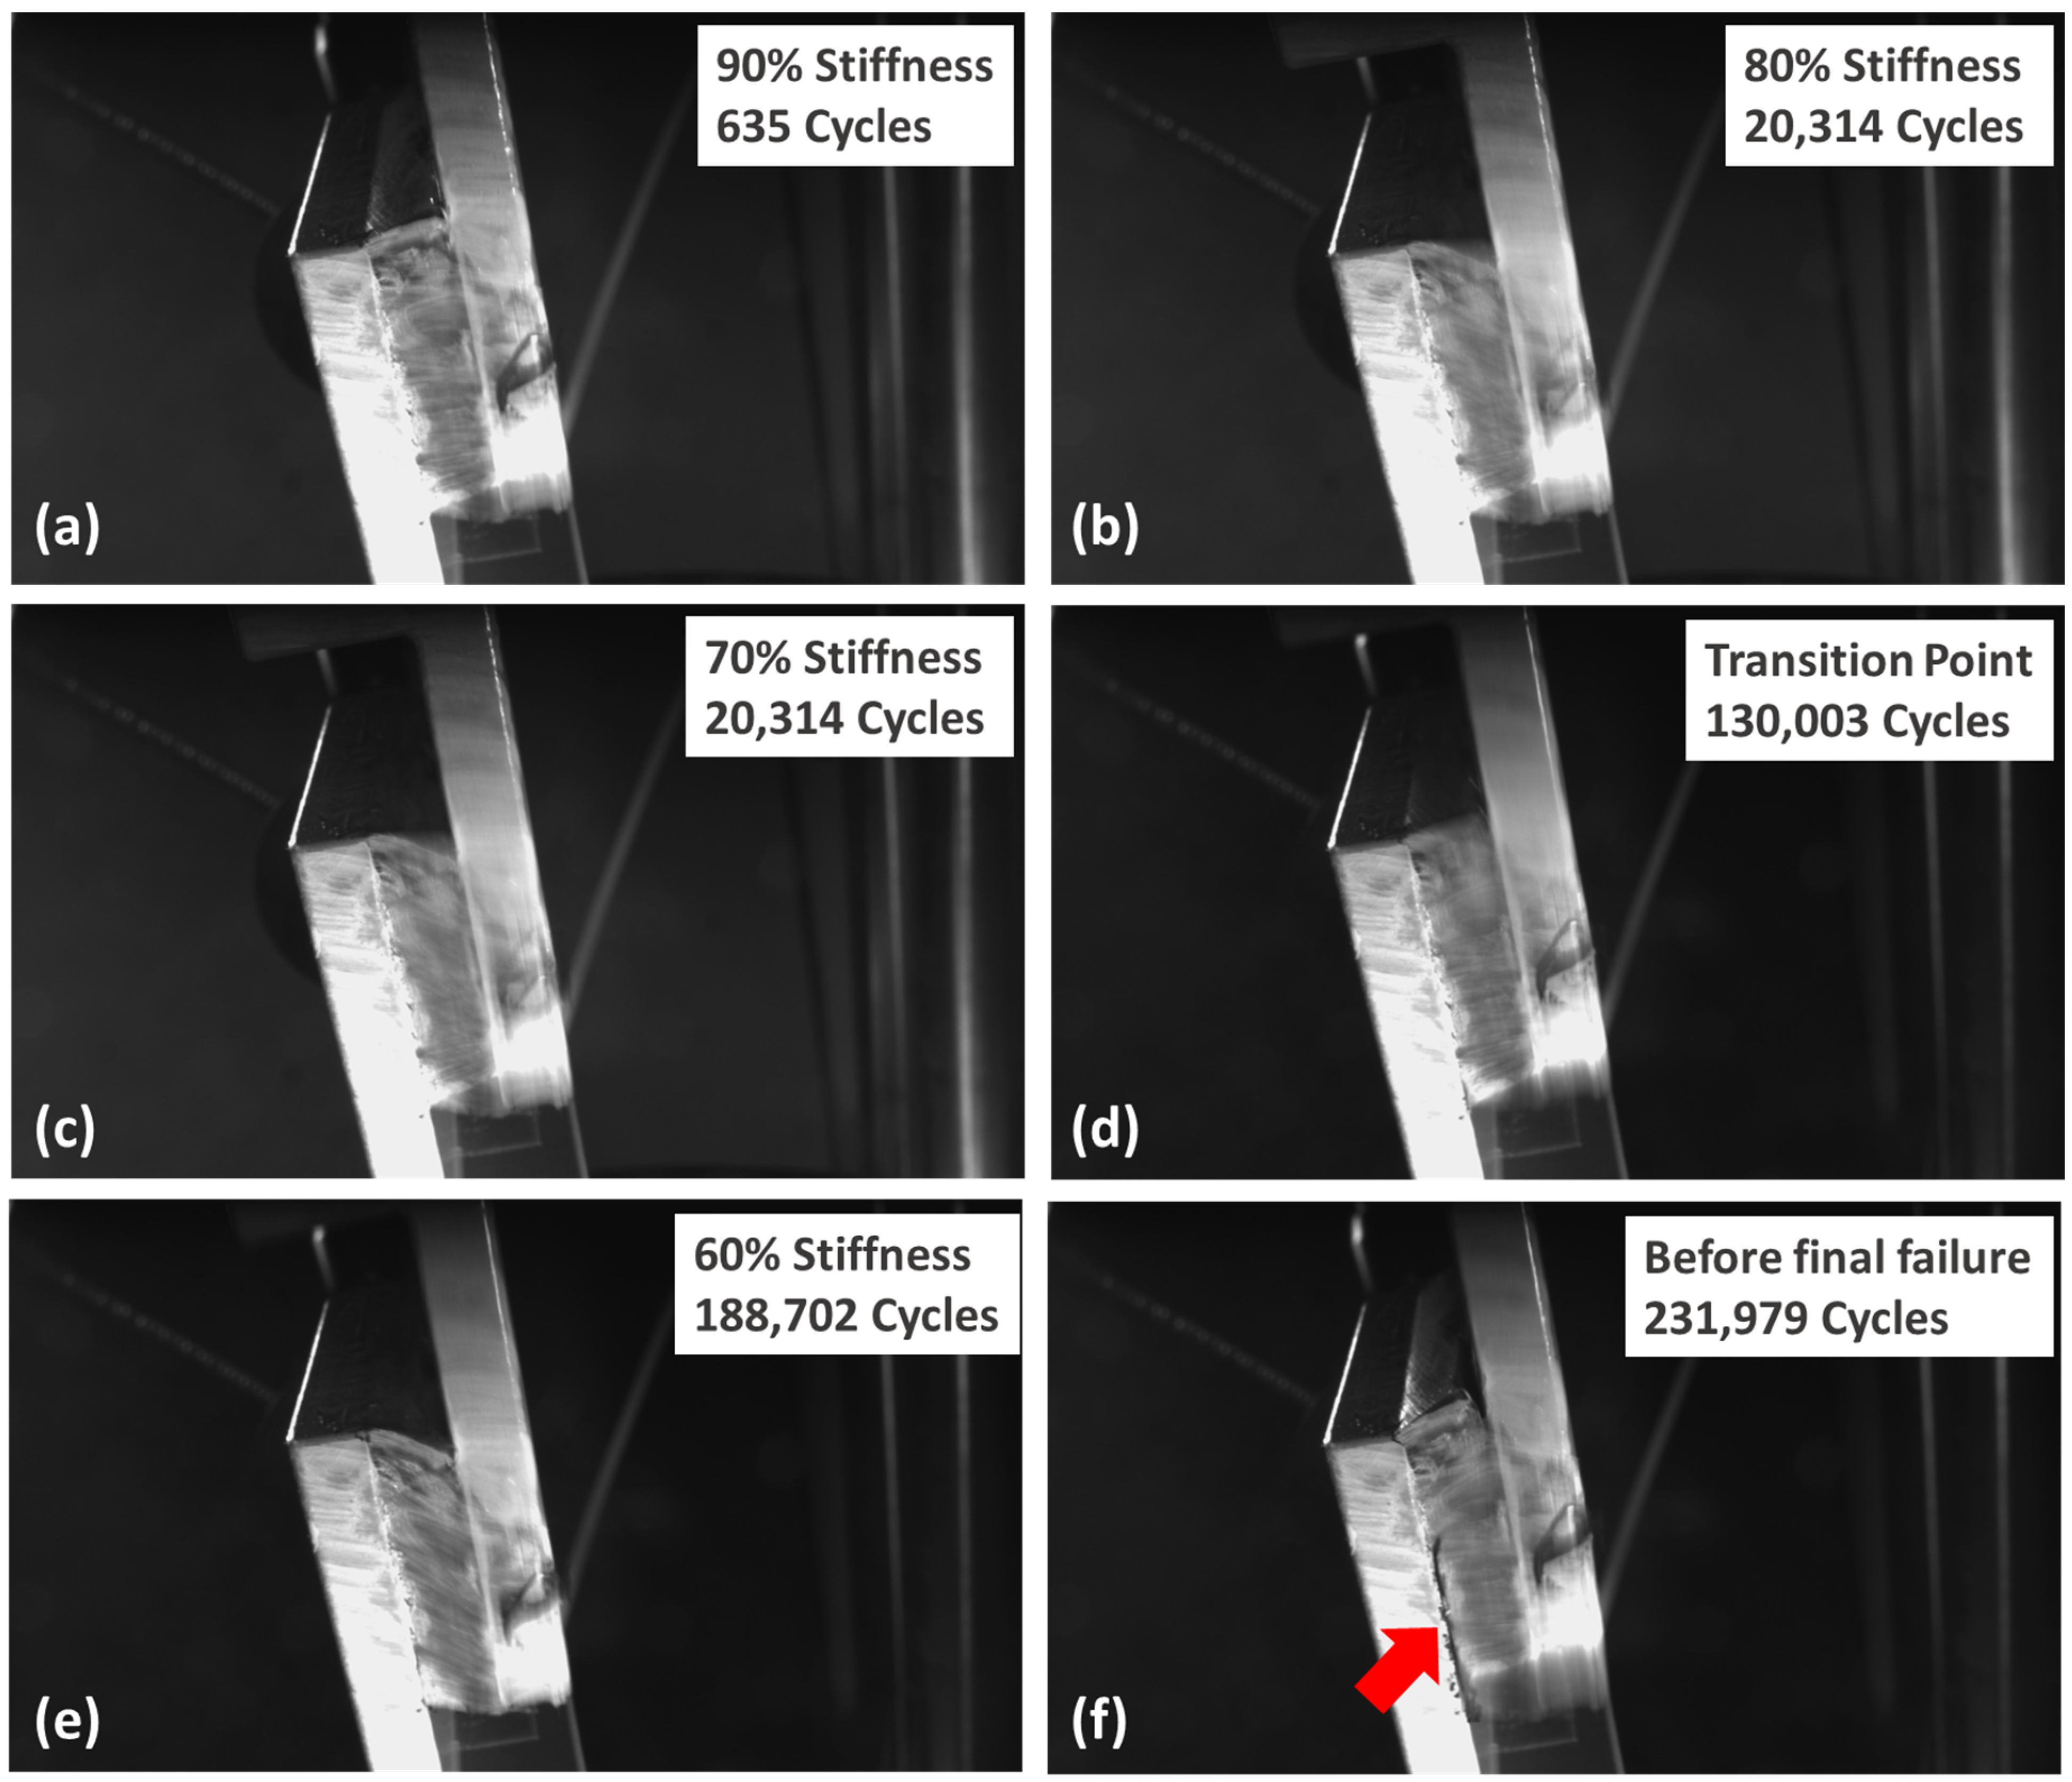
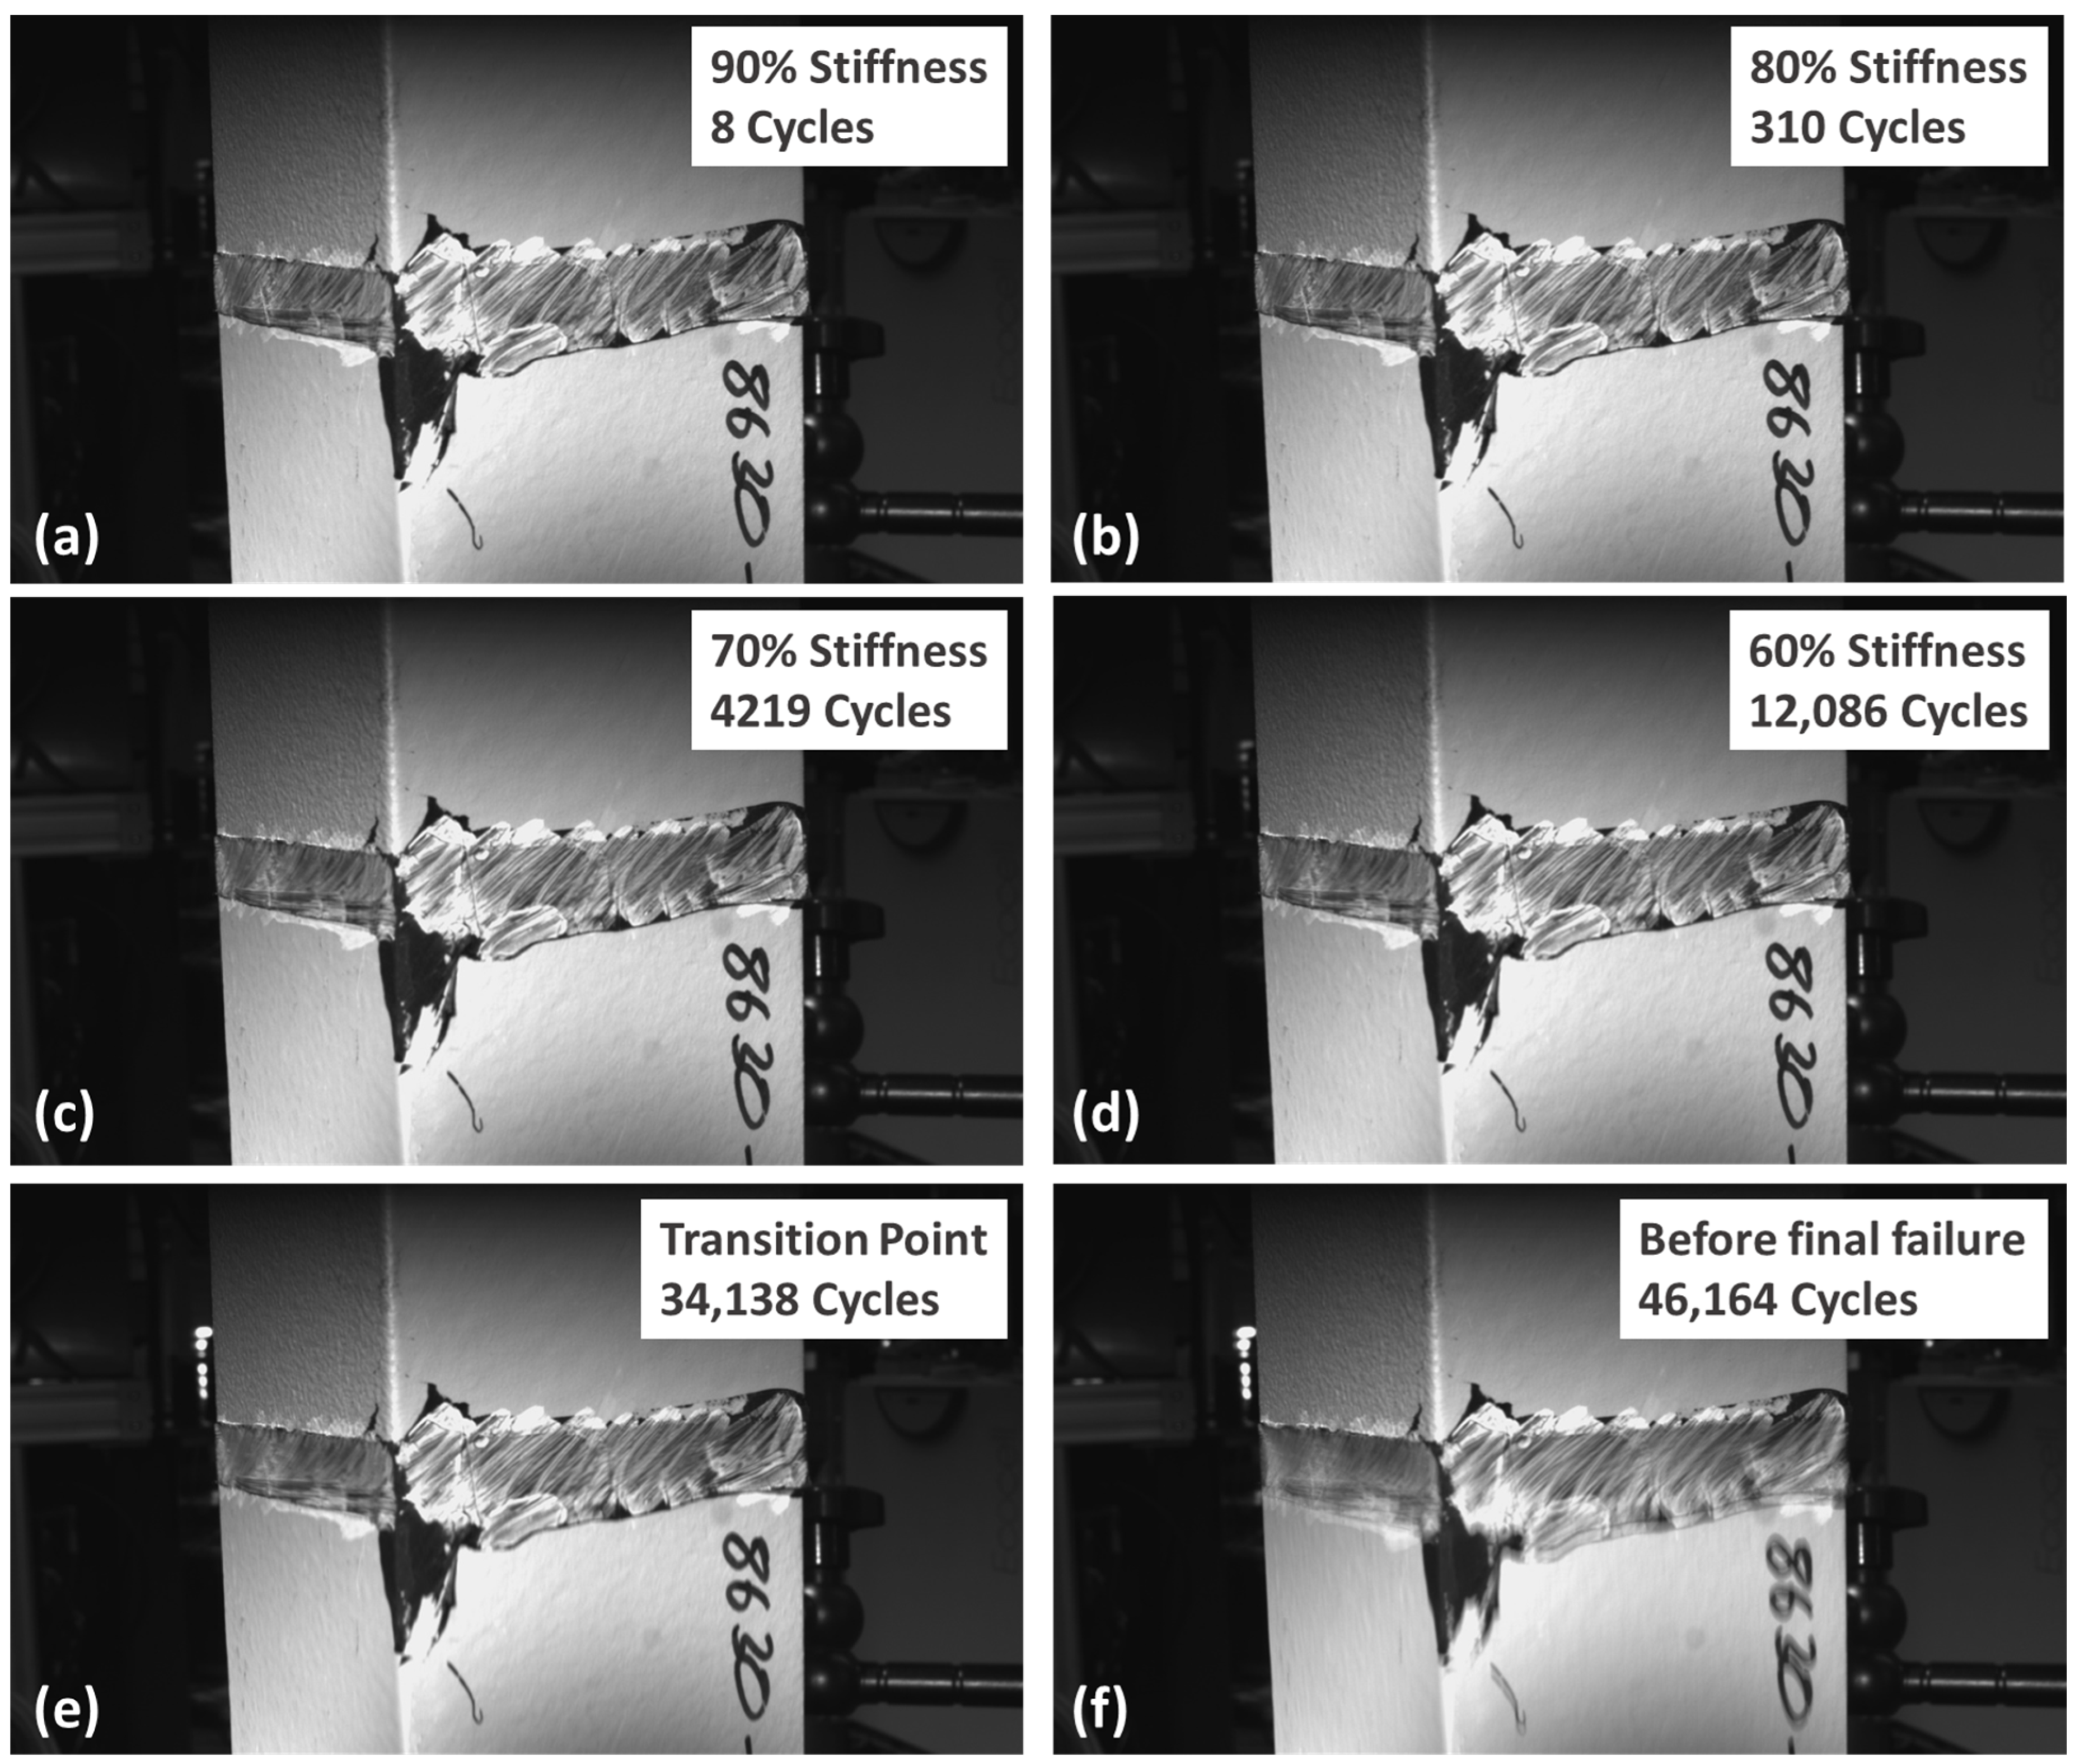
5.2. TAST Joint: Stiffness Degradation versus Picture Analysis

In accordance with Section 2.2, the current study calculated both stiffness and amplitude compliance for each cycle in all fatigue tests. Figure 8 presents selected results for the TAST joint in relation to the PU adhesive for R = 0.1/0.5/−1 at room temperature (23 °C/50% r.h.). To facilitate the comparison among all samples on the same graph, stiffness was normalised using Equation (9):
N o r m a l i s e d   S t i f f n e s s = K N K i n i t i a l
In Figure 8a, vertical reference lines have been implemented to illustrate the point at which the transition from stable compliance growth to unstable compliance growth (known as the transition point) occurs as the number of cycles increases. This was performed using the method described in Section 4. In Figure 8b, the normalised stiffness was plotted against the number of cycles. Horizontal reference lines were used to indicate the points at which each degree of stiffness reduction (90%, 80%, 70% and 60%) was reached. The vertical reference lines, related to the transition point, were used later in Figure 8b to facilitate the comparison between the stiffness reduction degree approaches and the transition point.
In Figure 9a–f, Figure 10a–f and Figure 11a–f, test images depict the number of cycles associated with 90%, 80% and 70% of initial stiffness, the division line from compliance fit (N° cycles for transition point), 60% of initial stiffness and before final failure for the R = 0.1/0.5/−1 tests, respectively. Red arrows highlight the cracks that are occurring in the samples during testing.
In all the samples, it was observed that the initial stiffness reached 90% of its original value in a small number of cycles, coinciding with the occurrence of cracks in the corners of the TAST joint structure. This finding is in line with the results reported in reference [11], which also showed that, for elastomeric materials, the dominant factor leading to material failure occurs during crack propagation due to their high tear strength. Furthermore, it was seen that, in the region of approximately 60% of the initial stiffness, degradation began to occur rapidly, indicating a less safe region for design purposes.
The same methodology was applied in relation to the SMP adhesive. Fatigue tests were performed for R = 0.1/0.5/−1 at an ambient temperature of 23 °C and 50% relative humidity, and representative results are shown in Figure 12.
In Figure 13, Figure 14 and Figure 15a–f, the test images show the number of cycles associated with 90%, 80% and 70% of initial stiffness, the compliance split line fits, 60% of initial stiffness and before final failure for the R = 0.1/0.5/−1 tests, respectively.
Similar to the PU adhesive, for the SMP adhesive with positive mean stresses (R = 0.1 and 0.5) with already 90% of the initial stiffness, cracks are already found in the overlap ends of the joint. For R = −1, the crack is not so easily visible but is noticeable near the final failure.

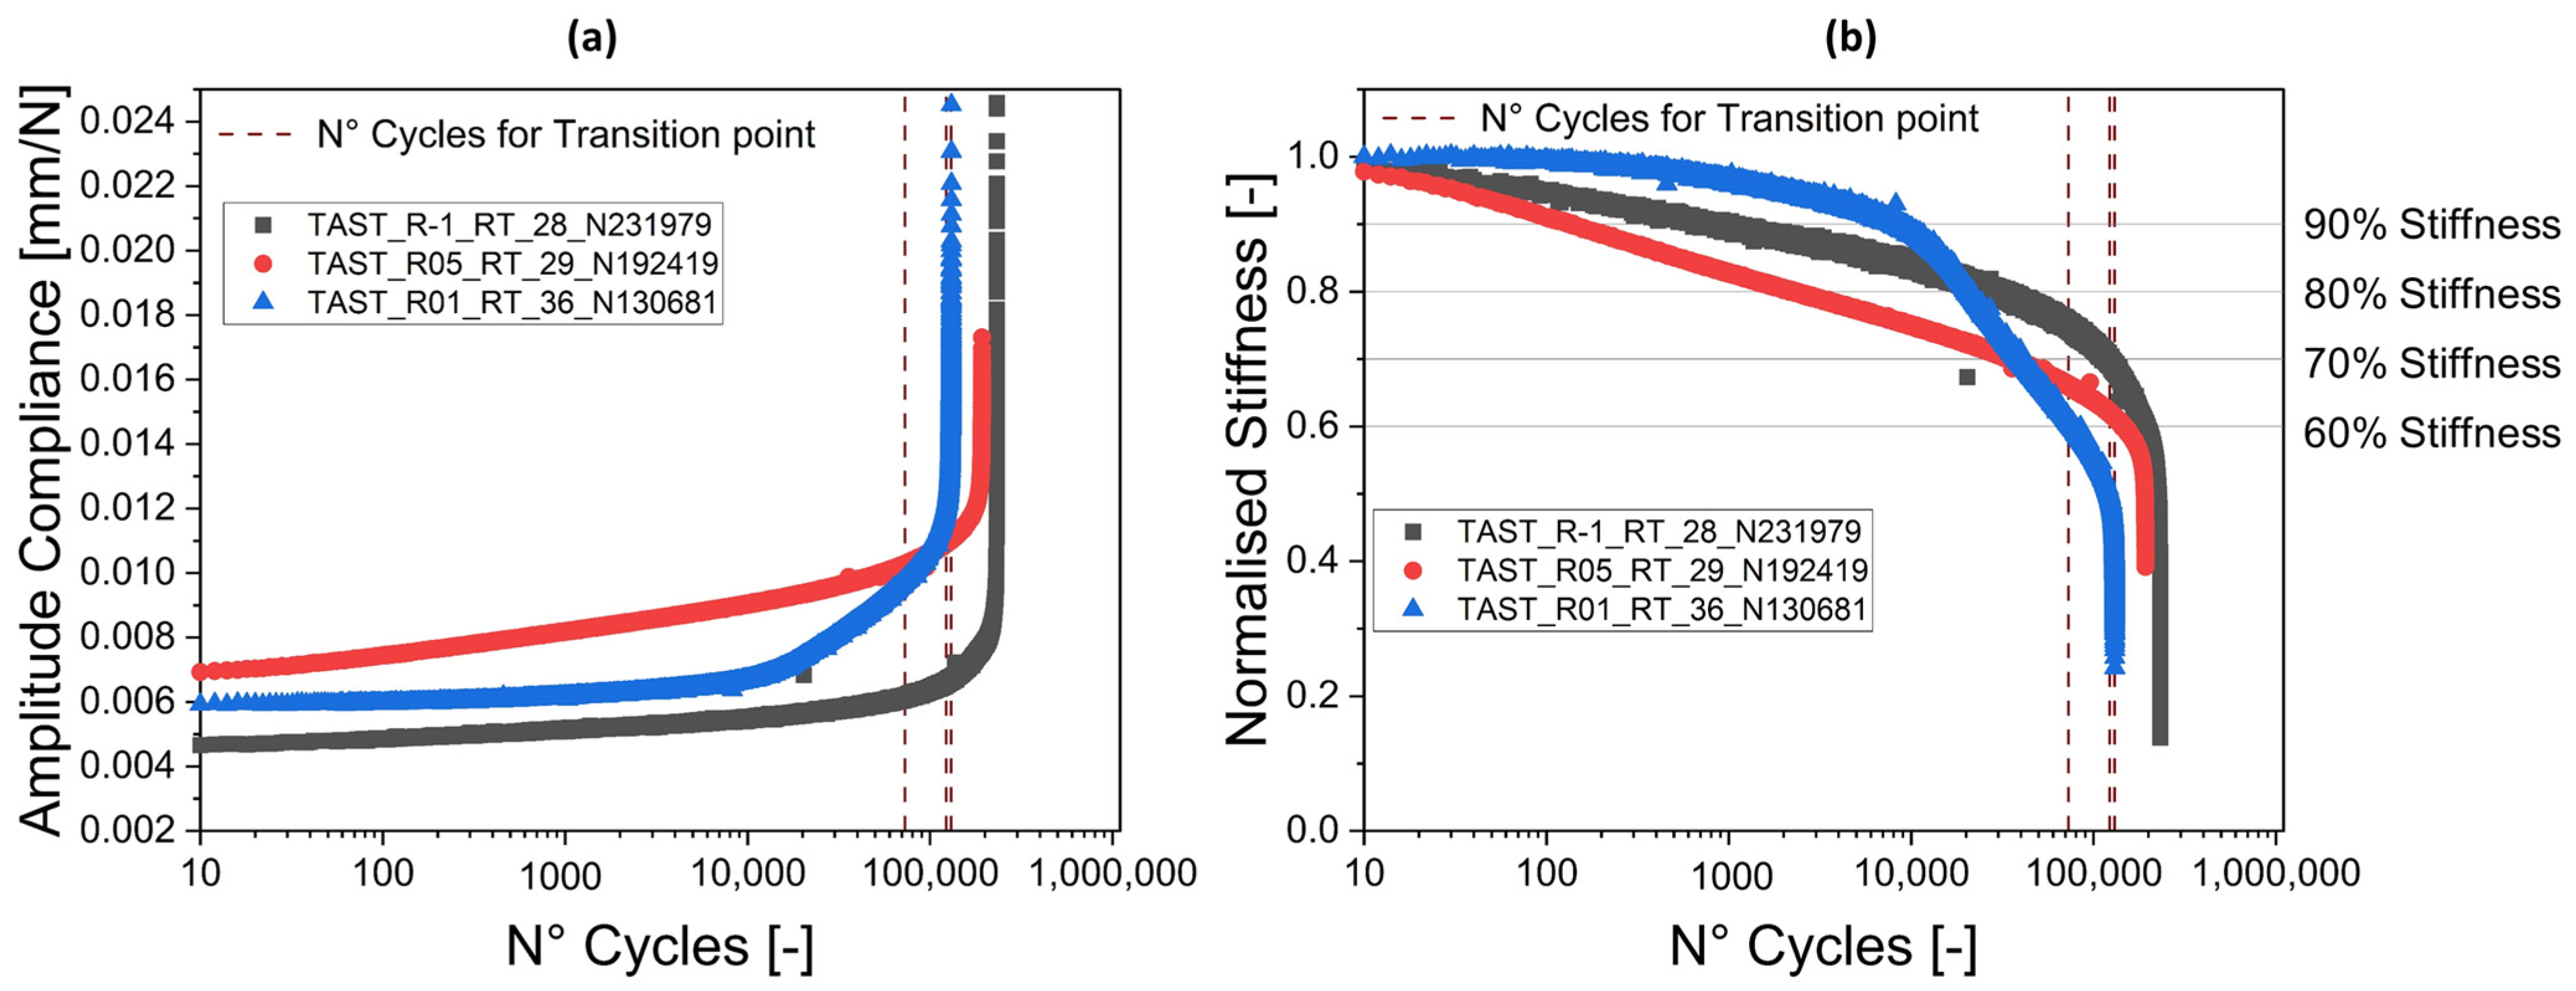
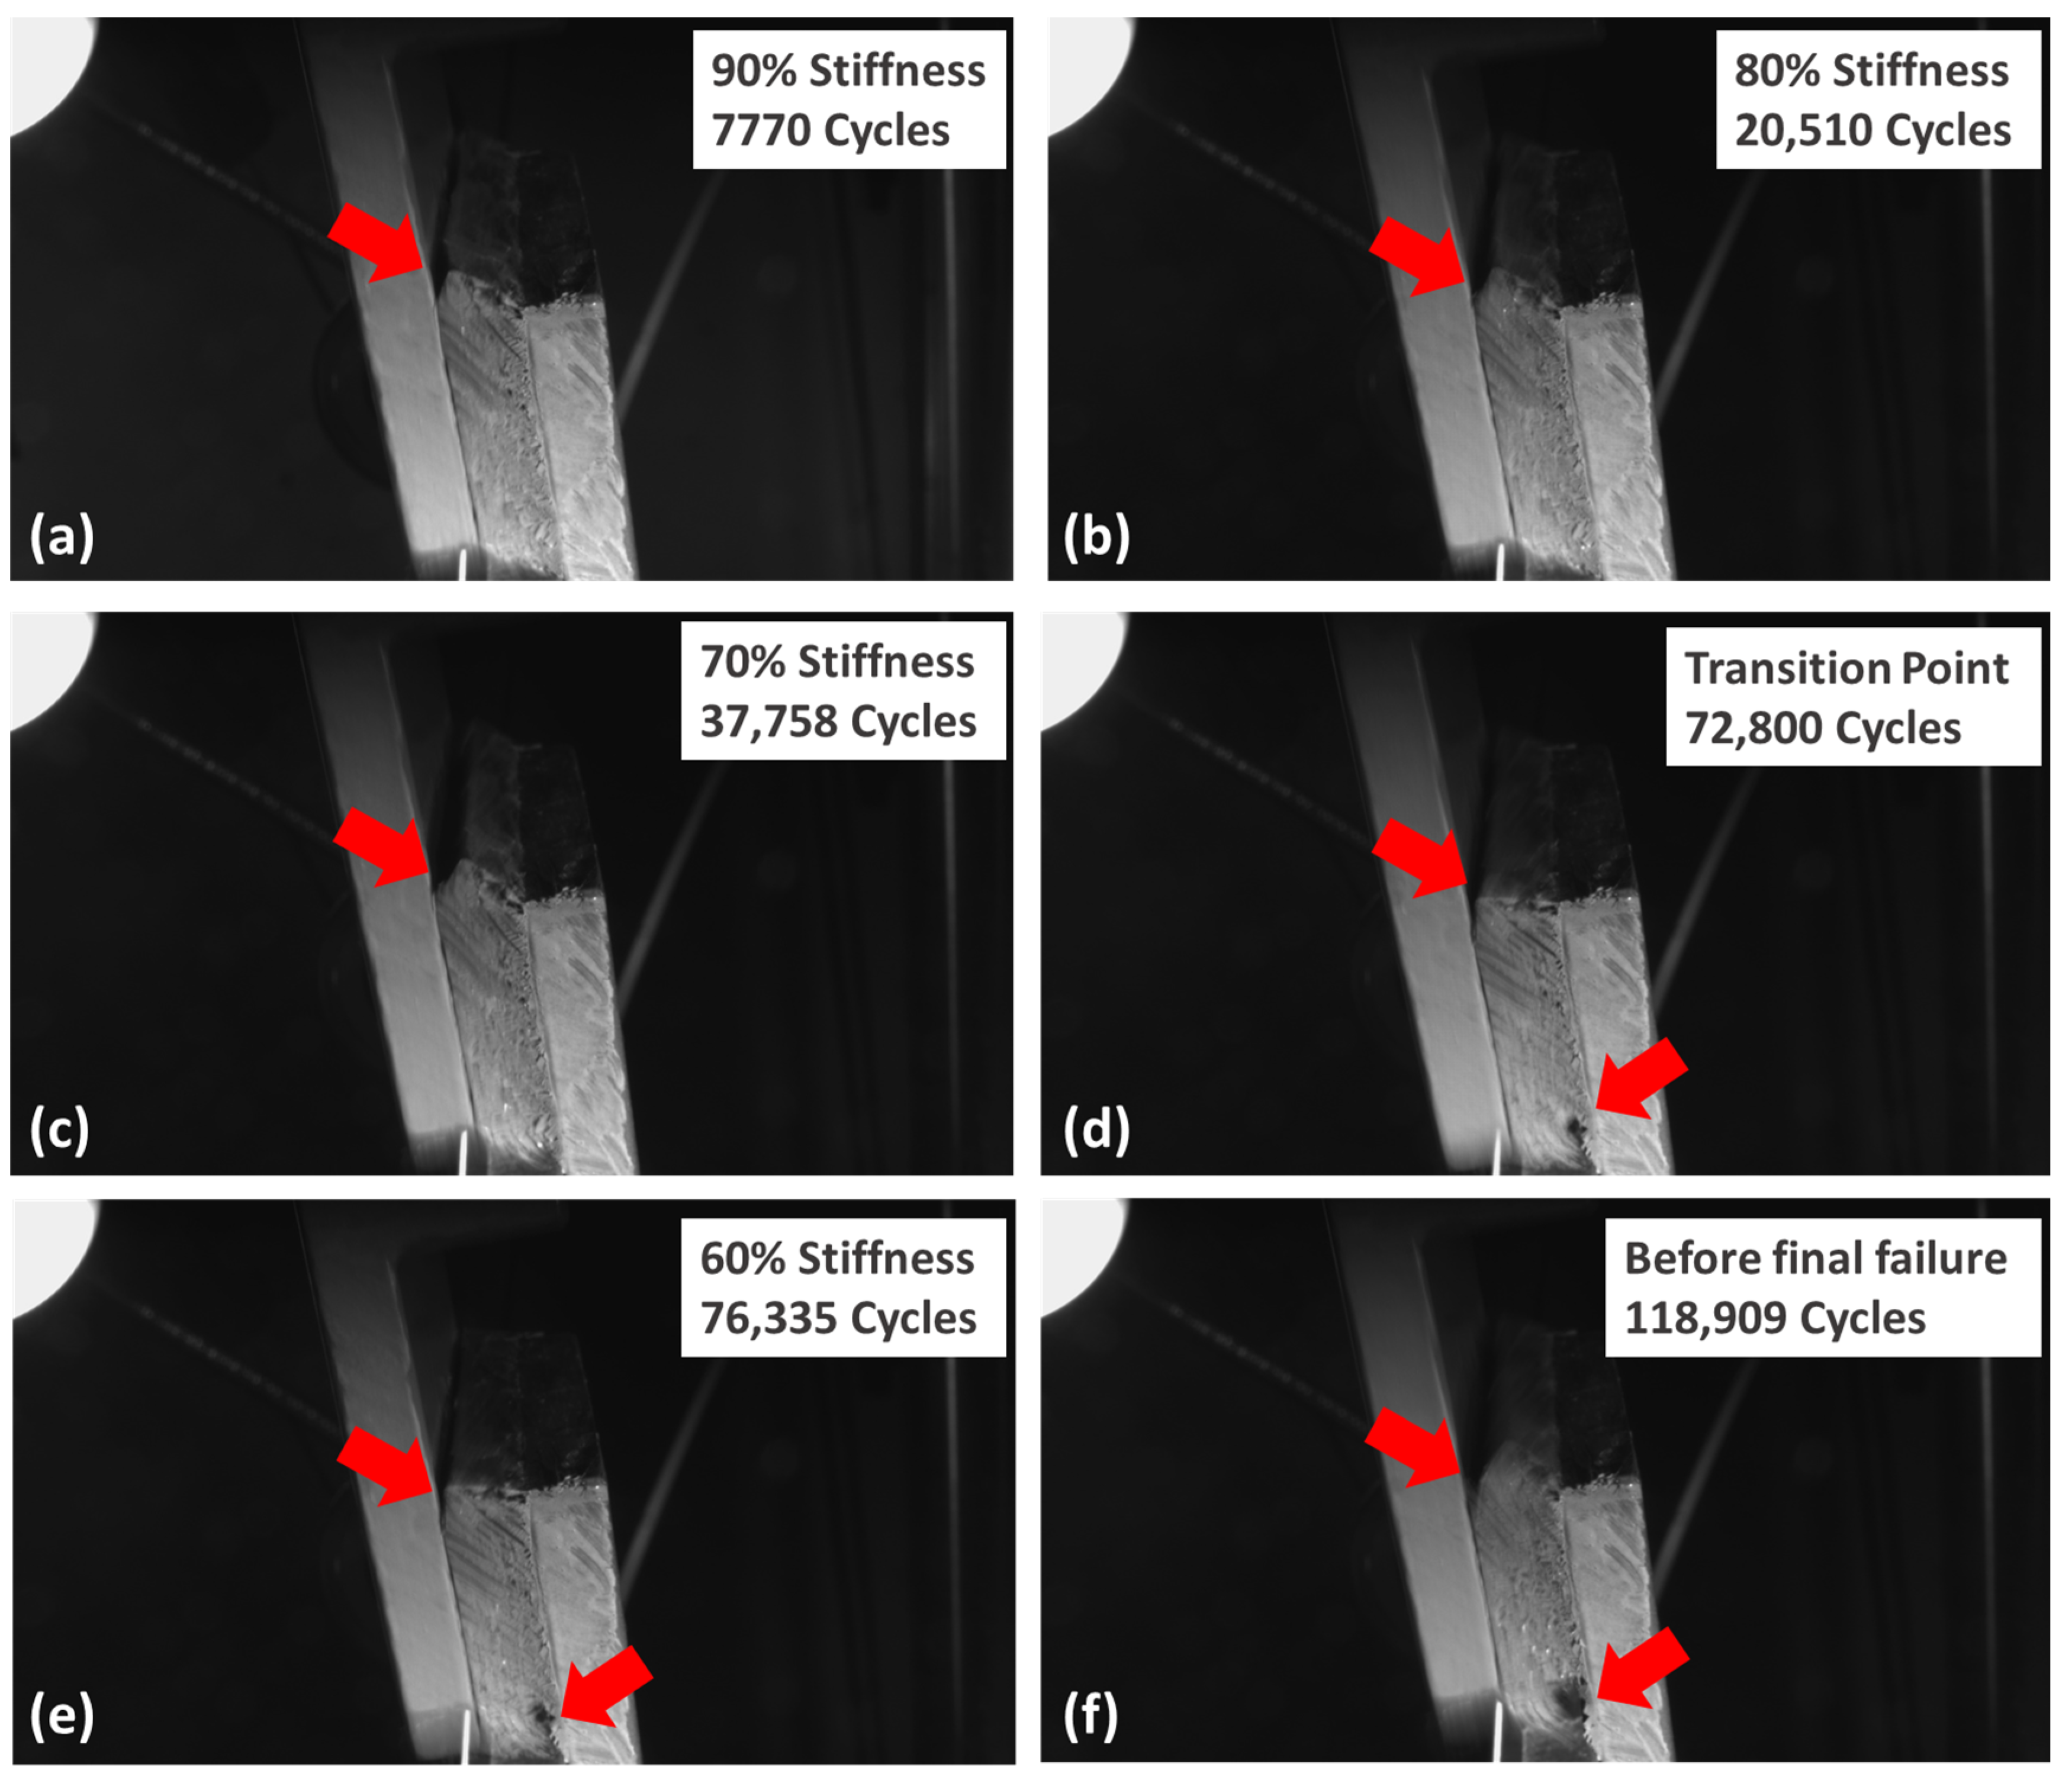
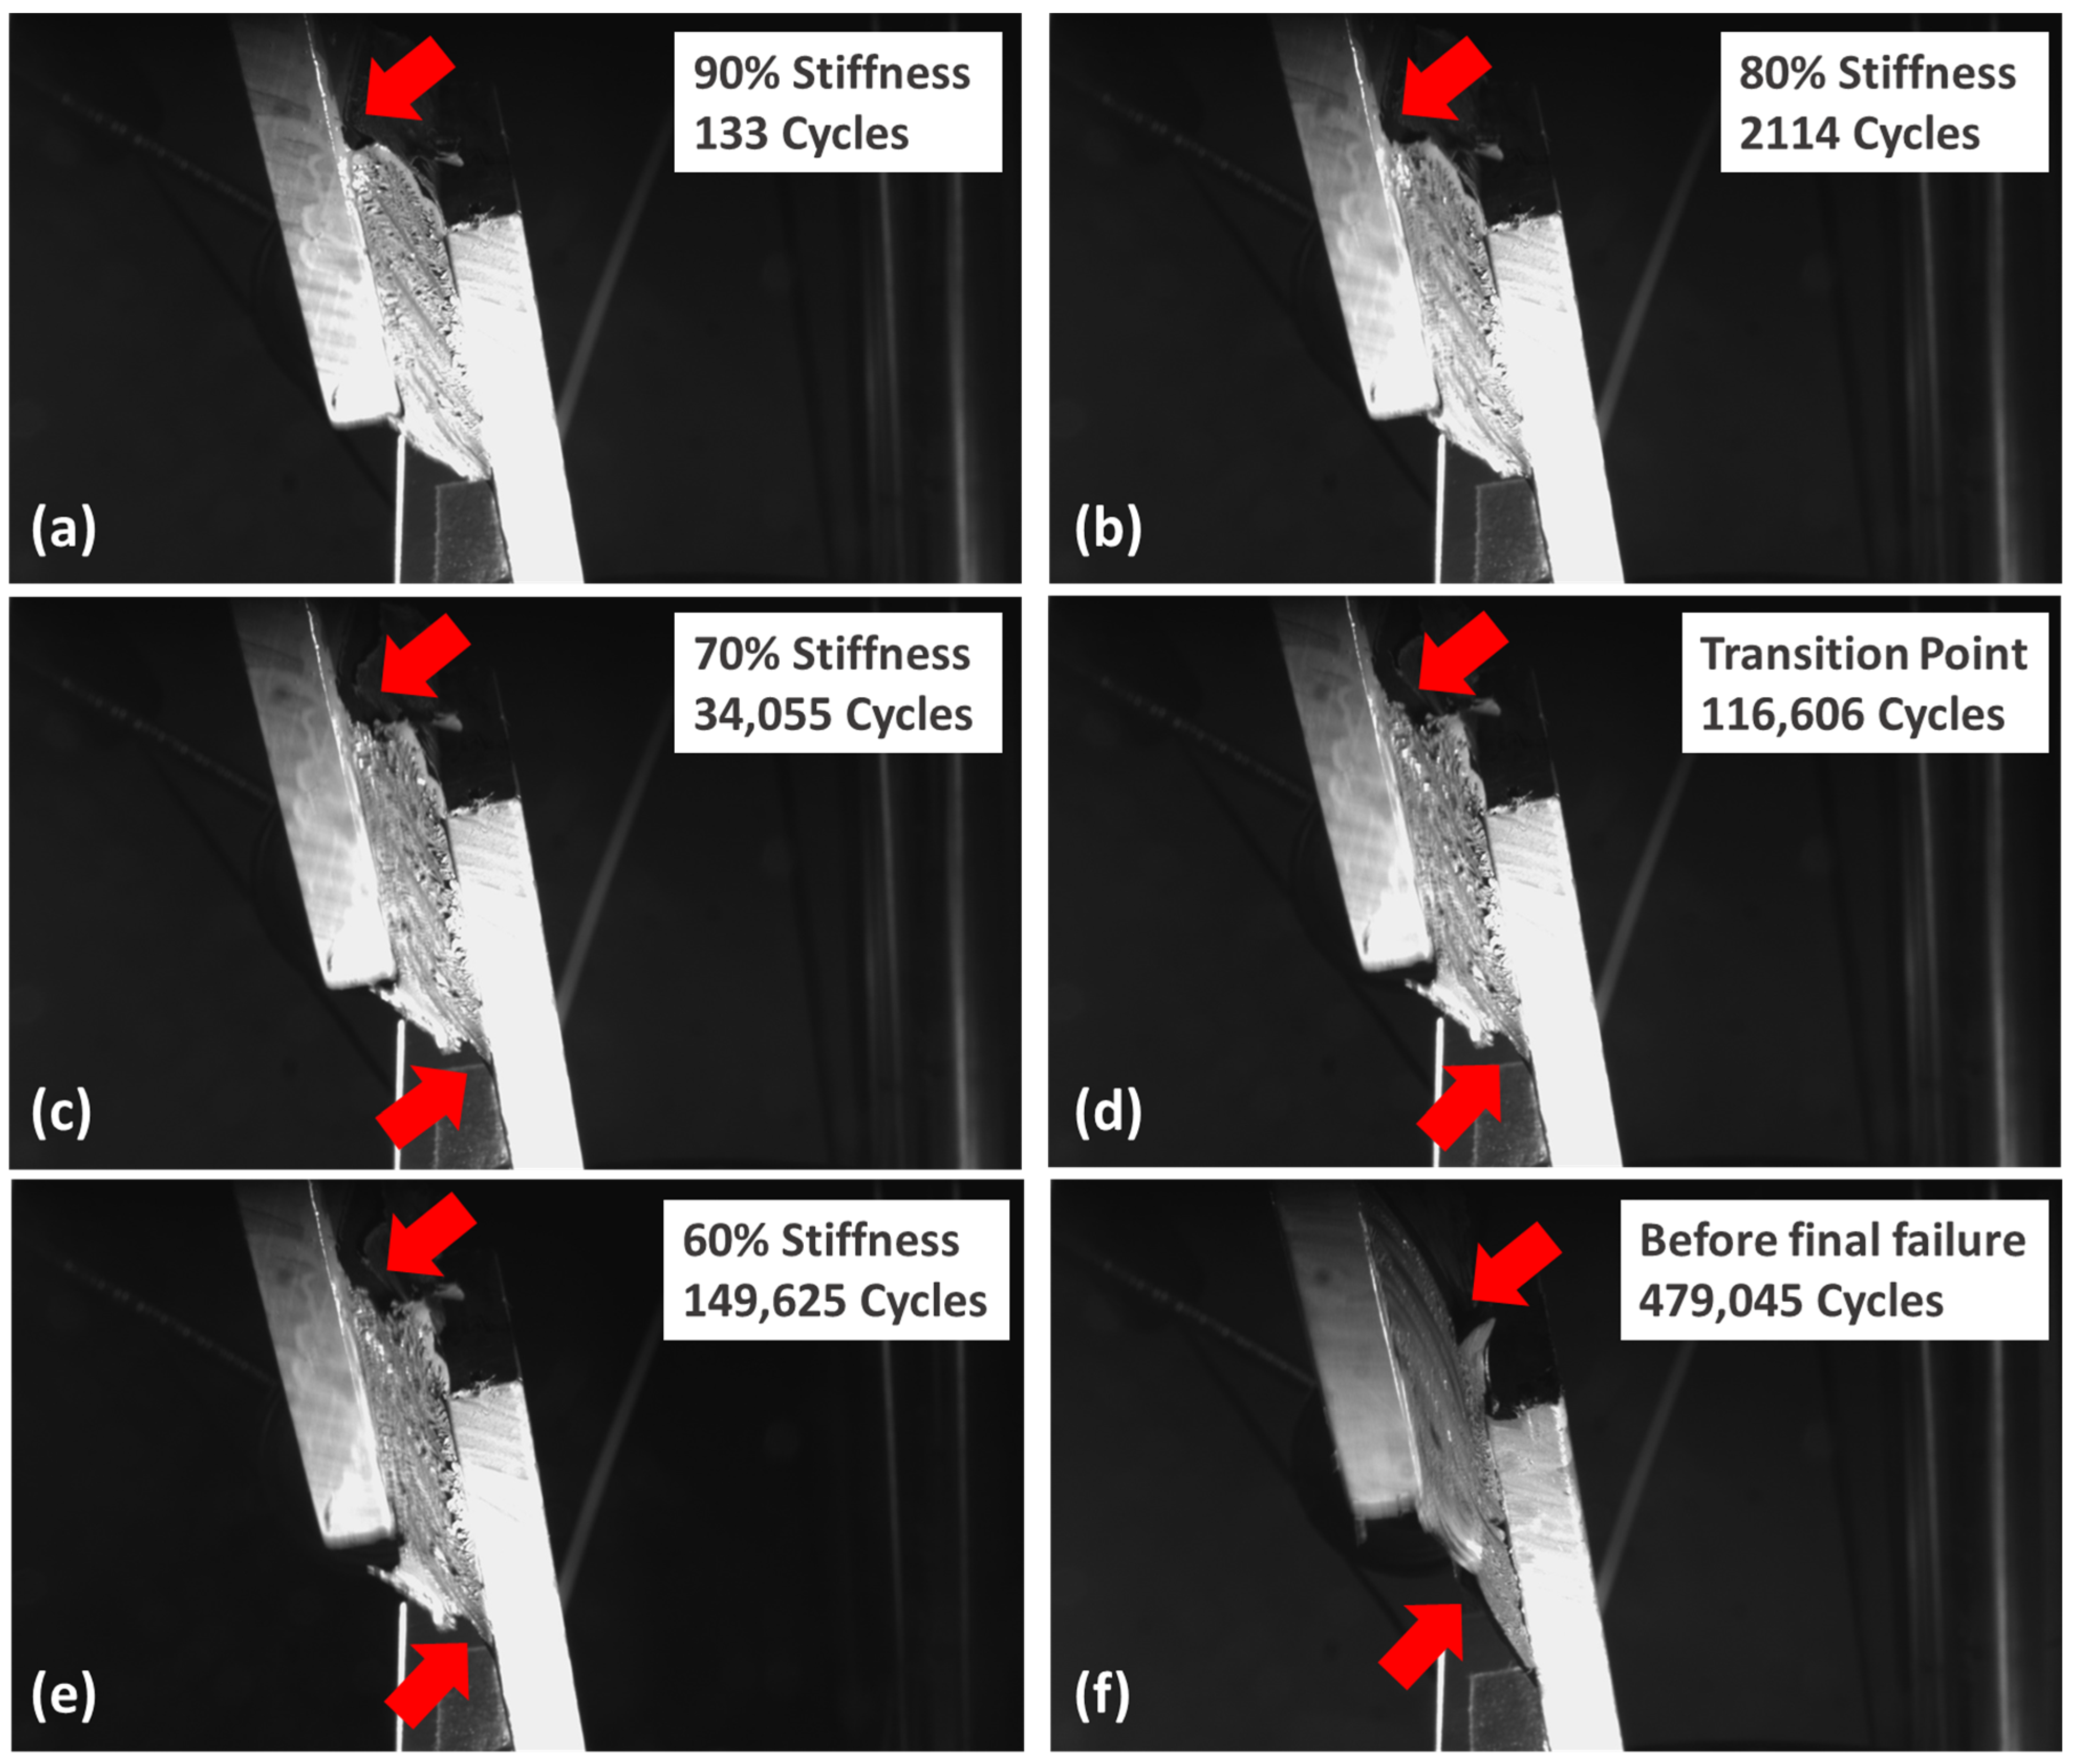
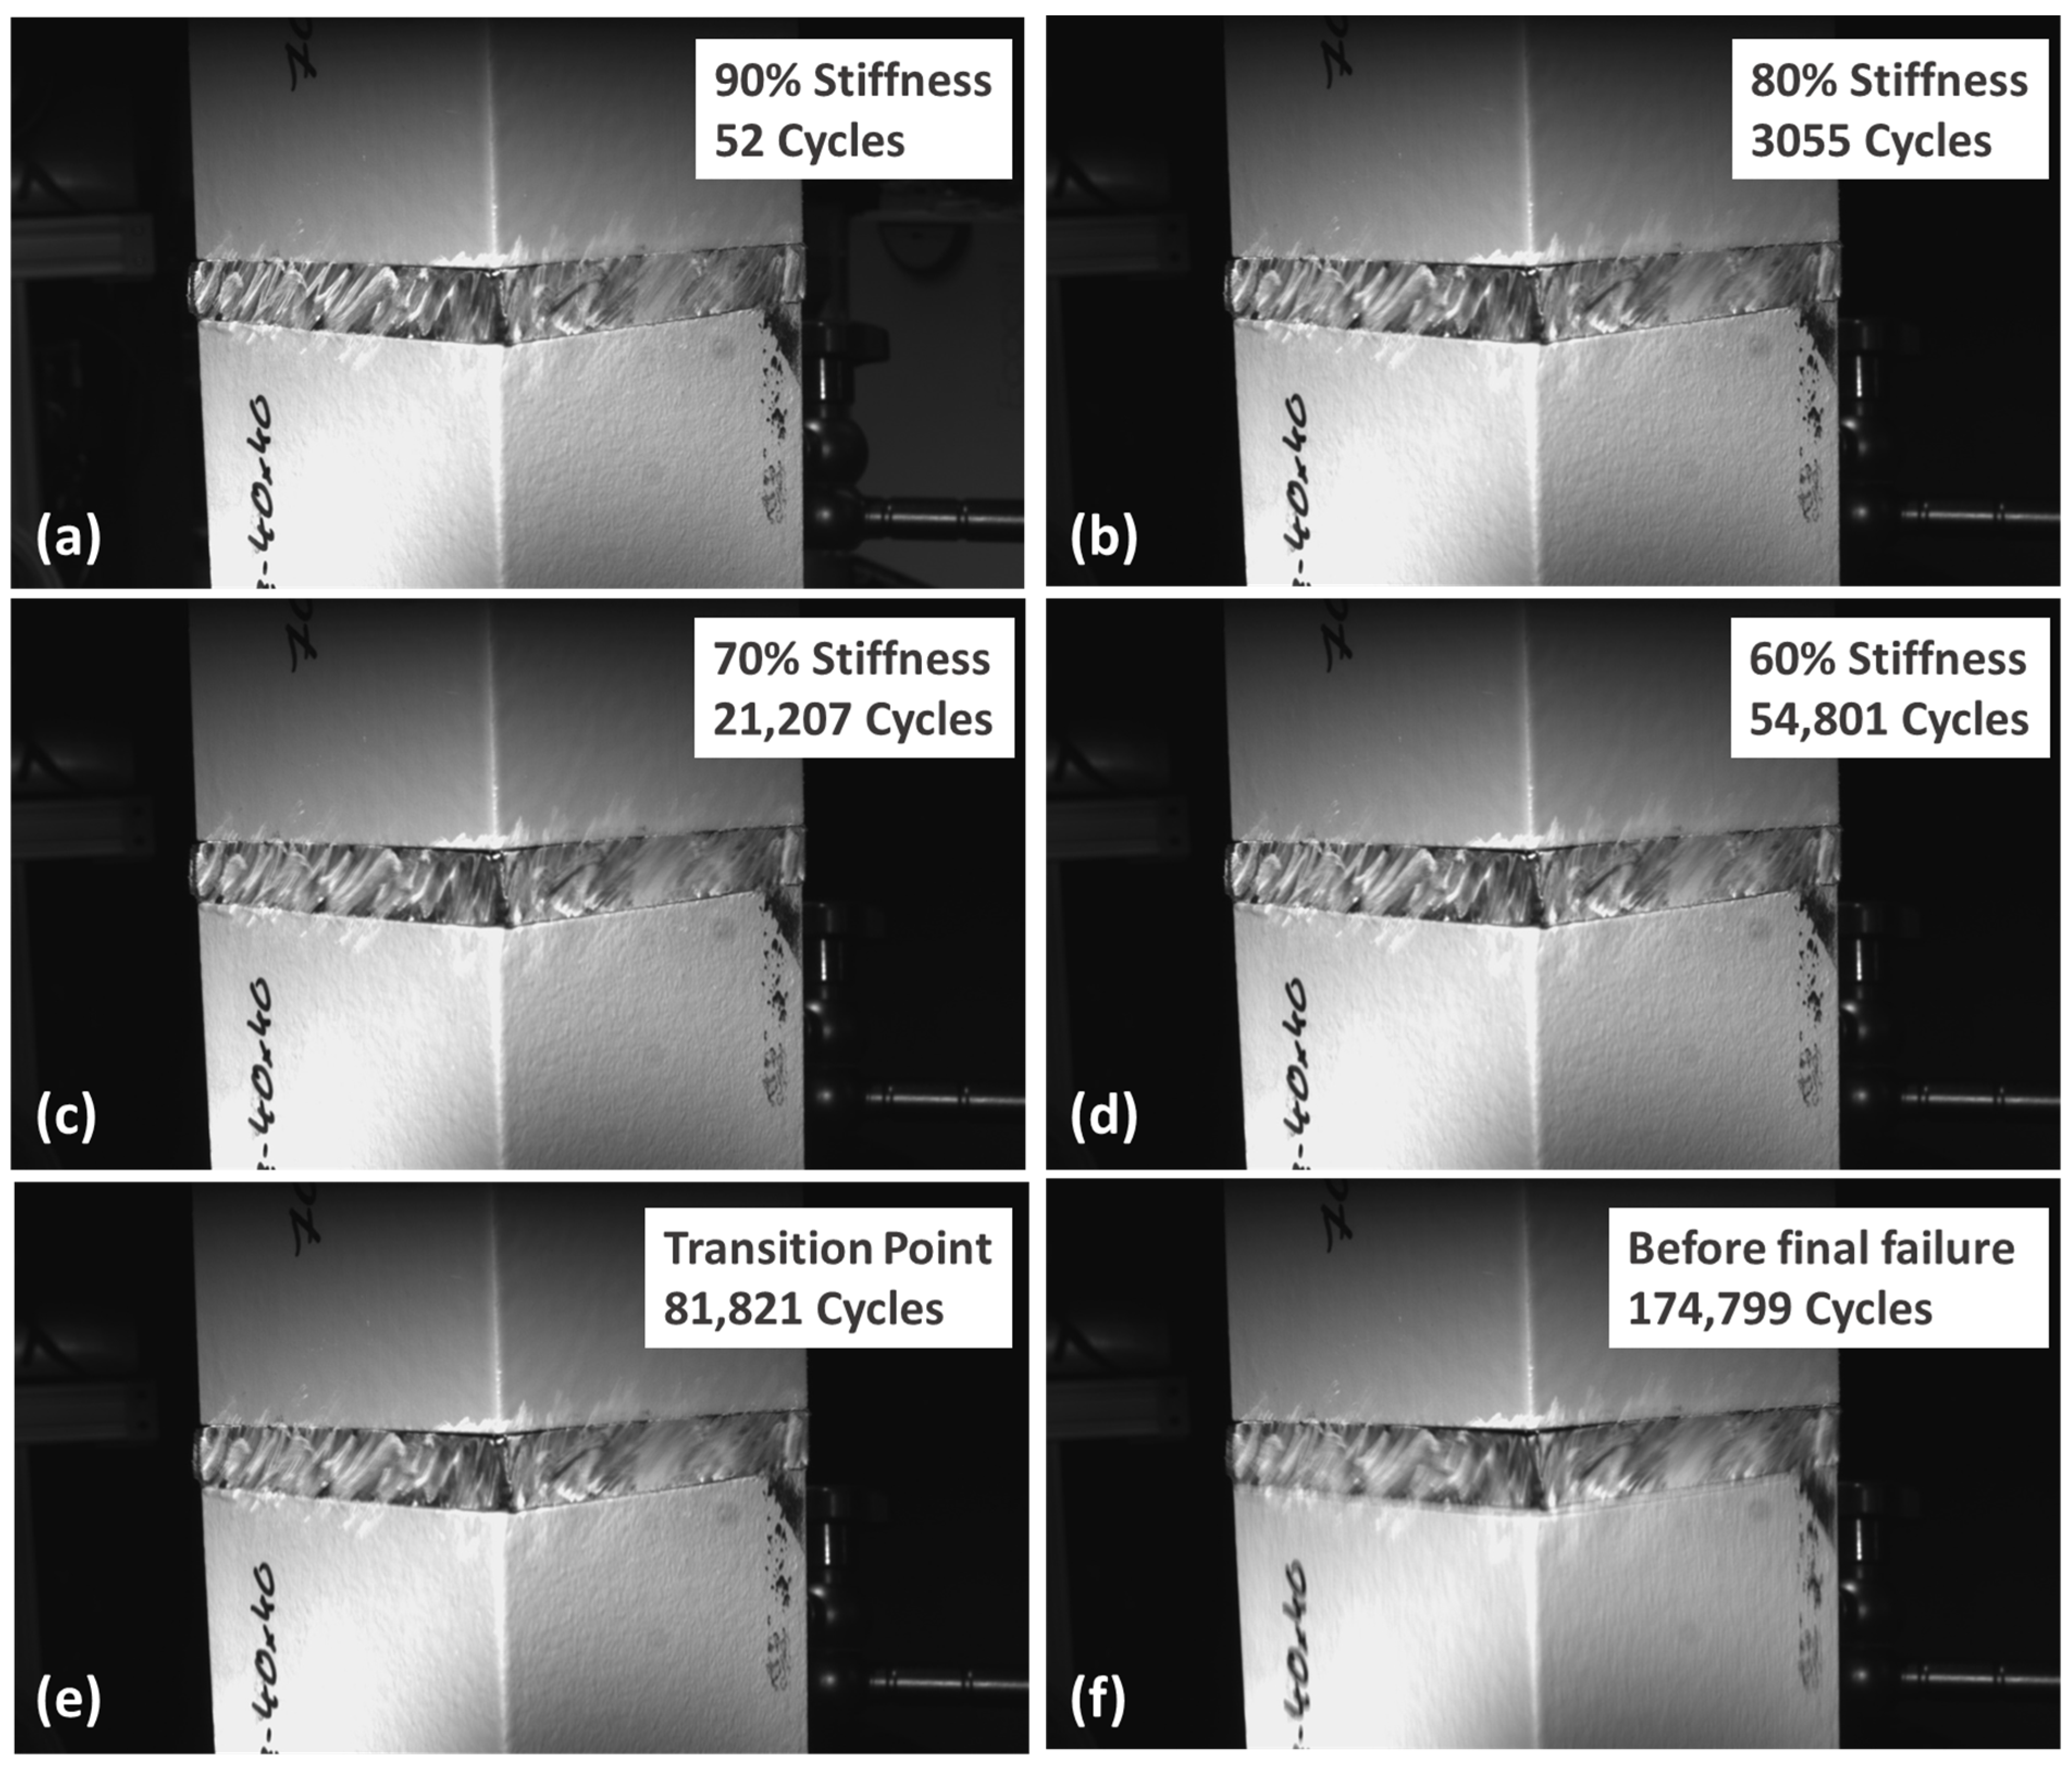
5.3. Butt Joint: Stiffness Degradation versus Pictures Analysis

The analysis in terms of amplitude compliance and normalised stiffness was also performed for the butt joint samples. In Figure 16, the results for the SMP and PU adhesives related to the tests performed at RT (23 °C/50 % r.h.) and R = 0.1 are presented. The data obtained for the butt joint samples present considerably more noise when compared to the data of the TAST joint (see Figure 8 and Figure 12). This is due to the much smaller displacements experienced by the butt joint in comparison with the TAST joint.
Another relevant finding associated with the butt joint sample is related to the failure pattern. For this type of joint, it is not possible to visualise the cracks from an external view before its final failure, as one can observe in Figure 17 (PU) and Figure 18 (SMP). The pictures suggest that the sample cracks initiate from within the adhesive layer and then spread to the outside until its final failure.
To further investigate this hypothesis, two tests were conducted using the PU adhesive at the same load conditions. In the first test, the fatigue test was performed until the final failure of the sample. With the number of cycles to final failure reached in the first trial in hand, the test was repeated but stopped before the second sample reached the number of cycles of the first trial. Once the test was stopped, the sample was cut through the mid-surface of the adhesive layer thickness.
Figure 19 shows the comparison between the adhesive layer mid-surfaces for the following: (a) test without mechanical loading, (b) test stopped with 44,000 cycles and (c) total failure at 46,126 cycles. In the centre of the mechanically loaded samples (Figure 19b,c), it is possible to observe a cavity. Due to the geometry of the sample (butt joint with thick layer), this cavity can be associated with a high hydrostatic stress region [35]. Red arrows highlight the failures related to the cavitation, while the orange arrows show “white surfaces” where the adhesive was cut through.
Several works have suggested that high hydrostatic stress can be responsible for the failure of elastomeric (hyperelastic) adhesive due to cavitation [3], which might explain why the failure of the butt joint starts from the centre of the sample, i.e., not being visible externally [14,36].

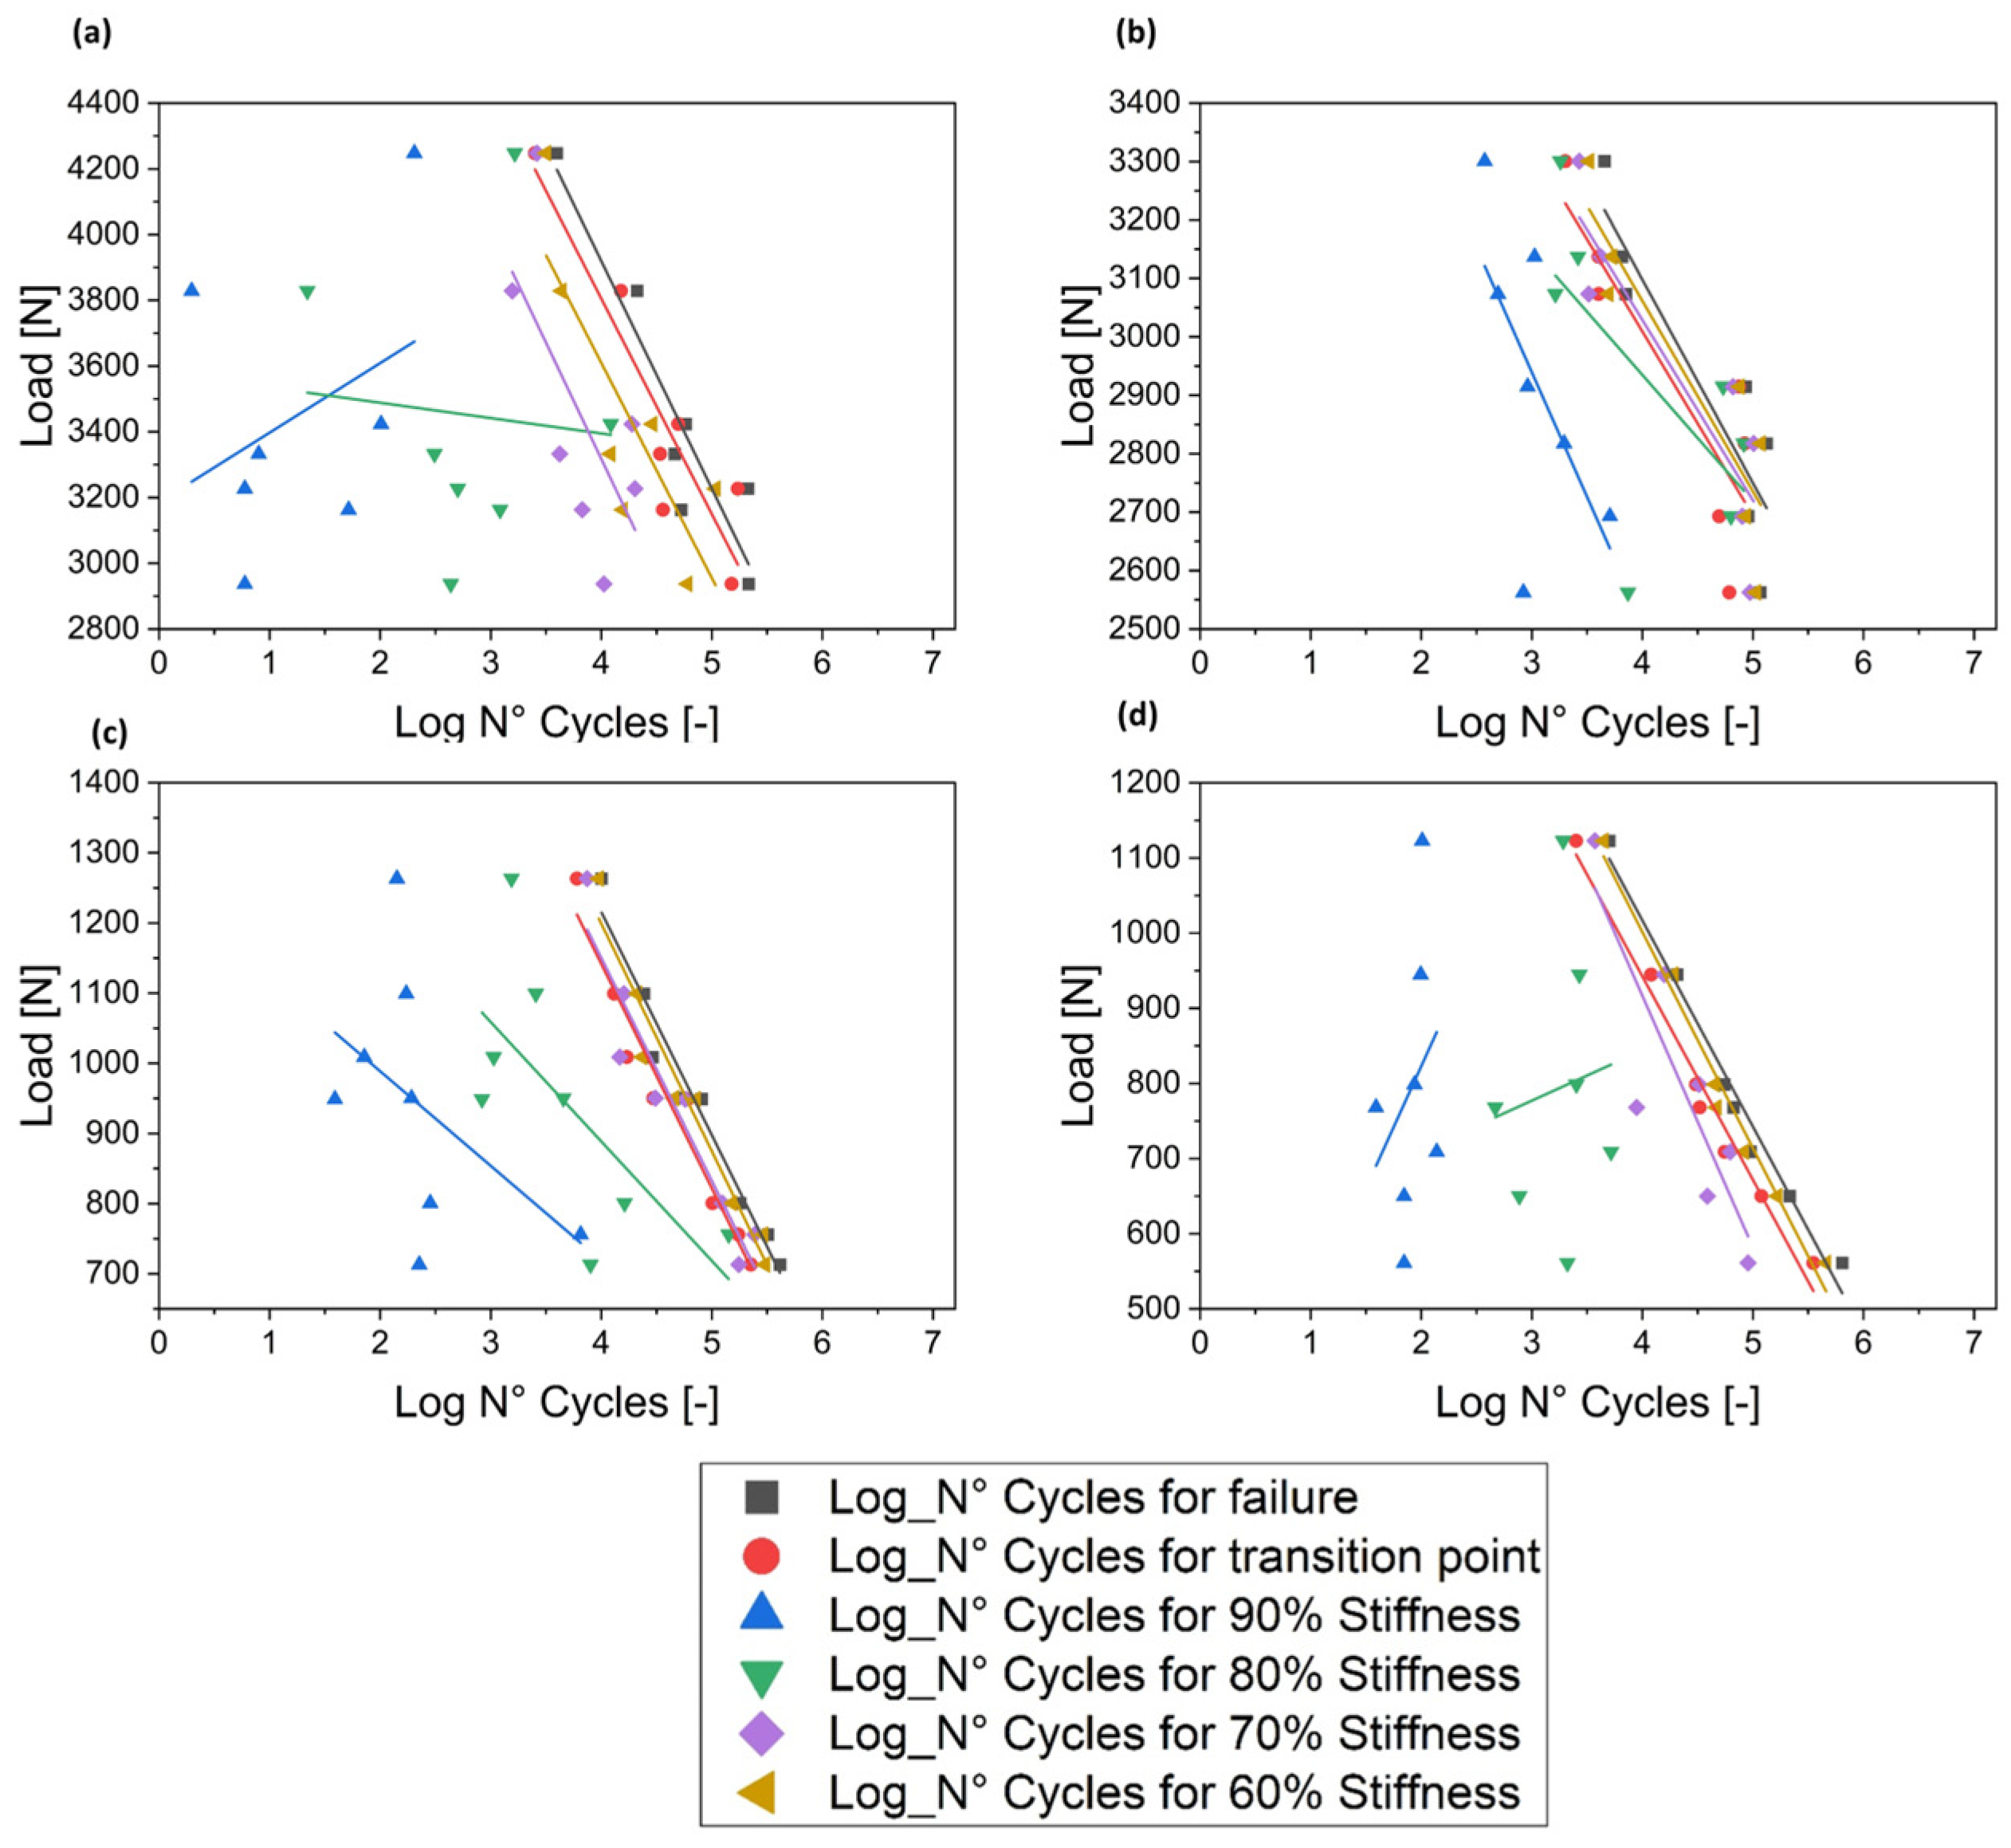
5.4. Fatigue Design Curves
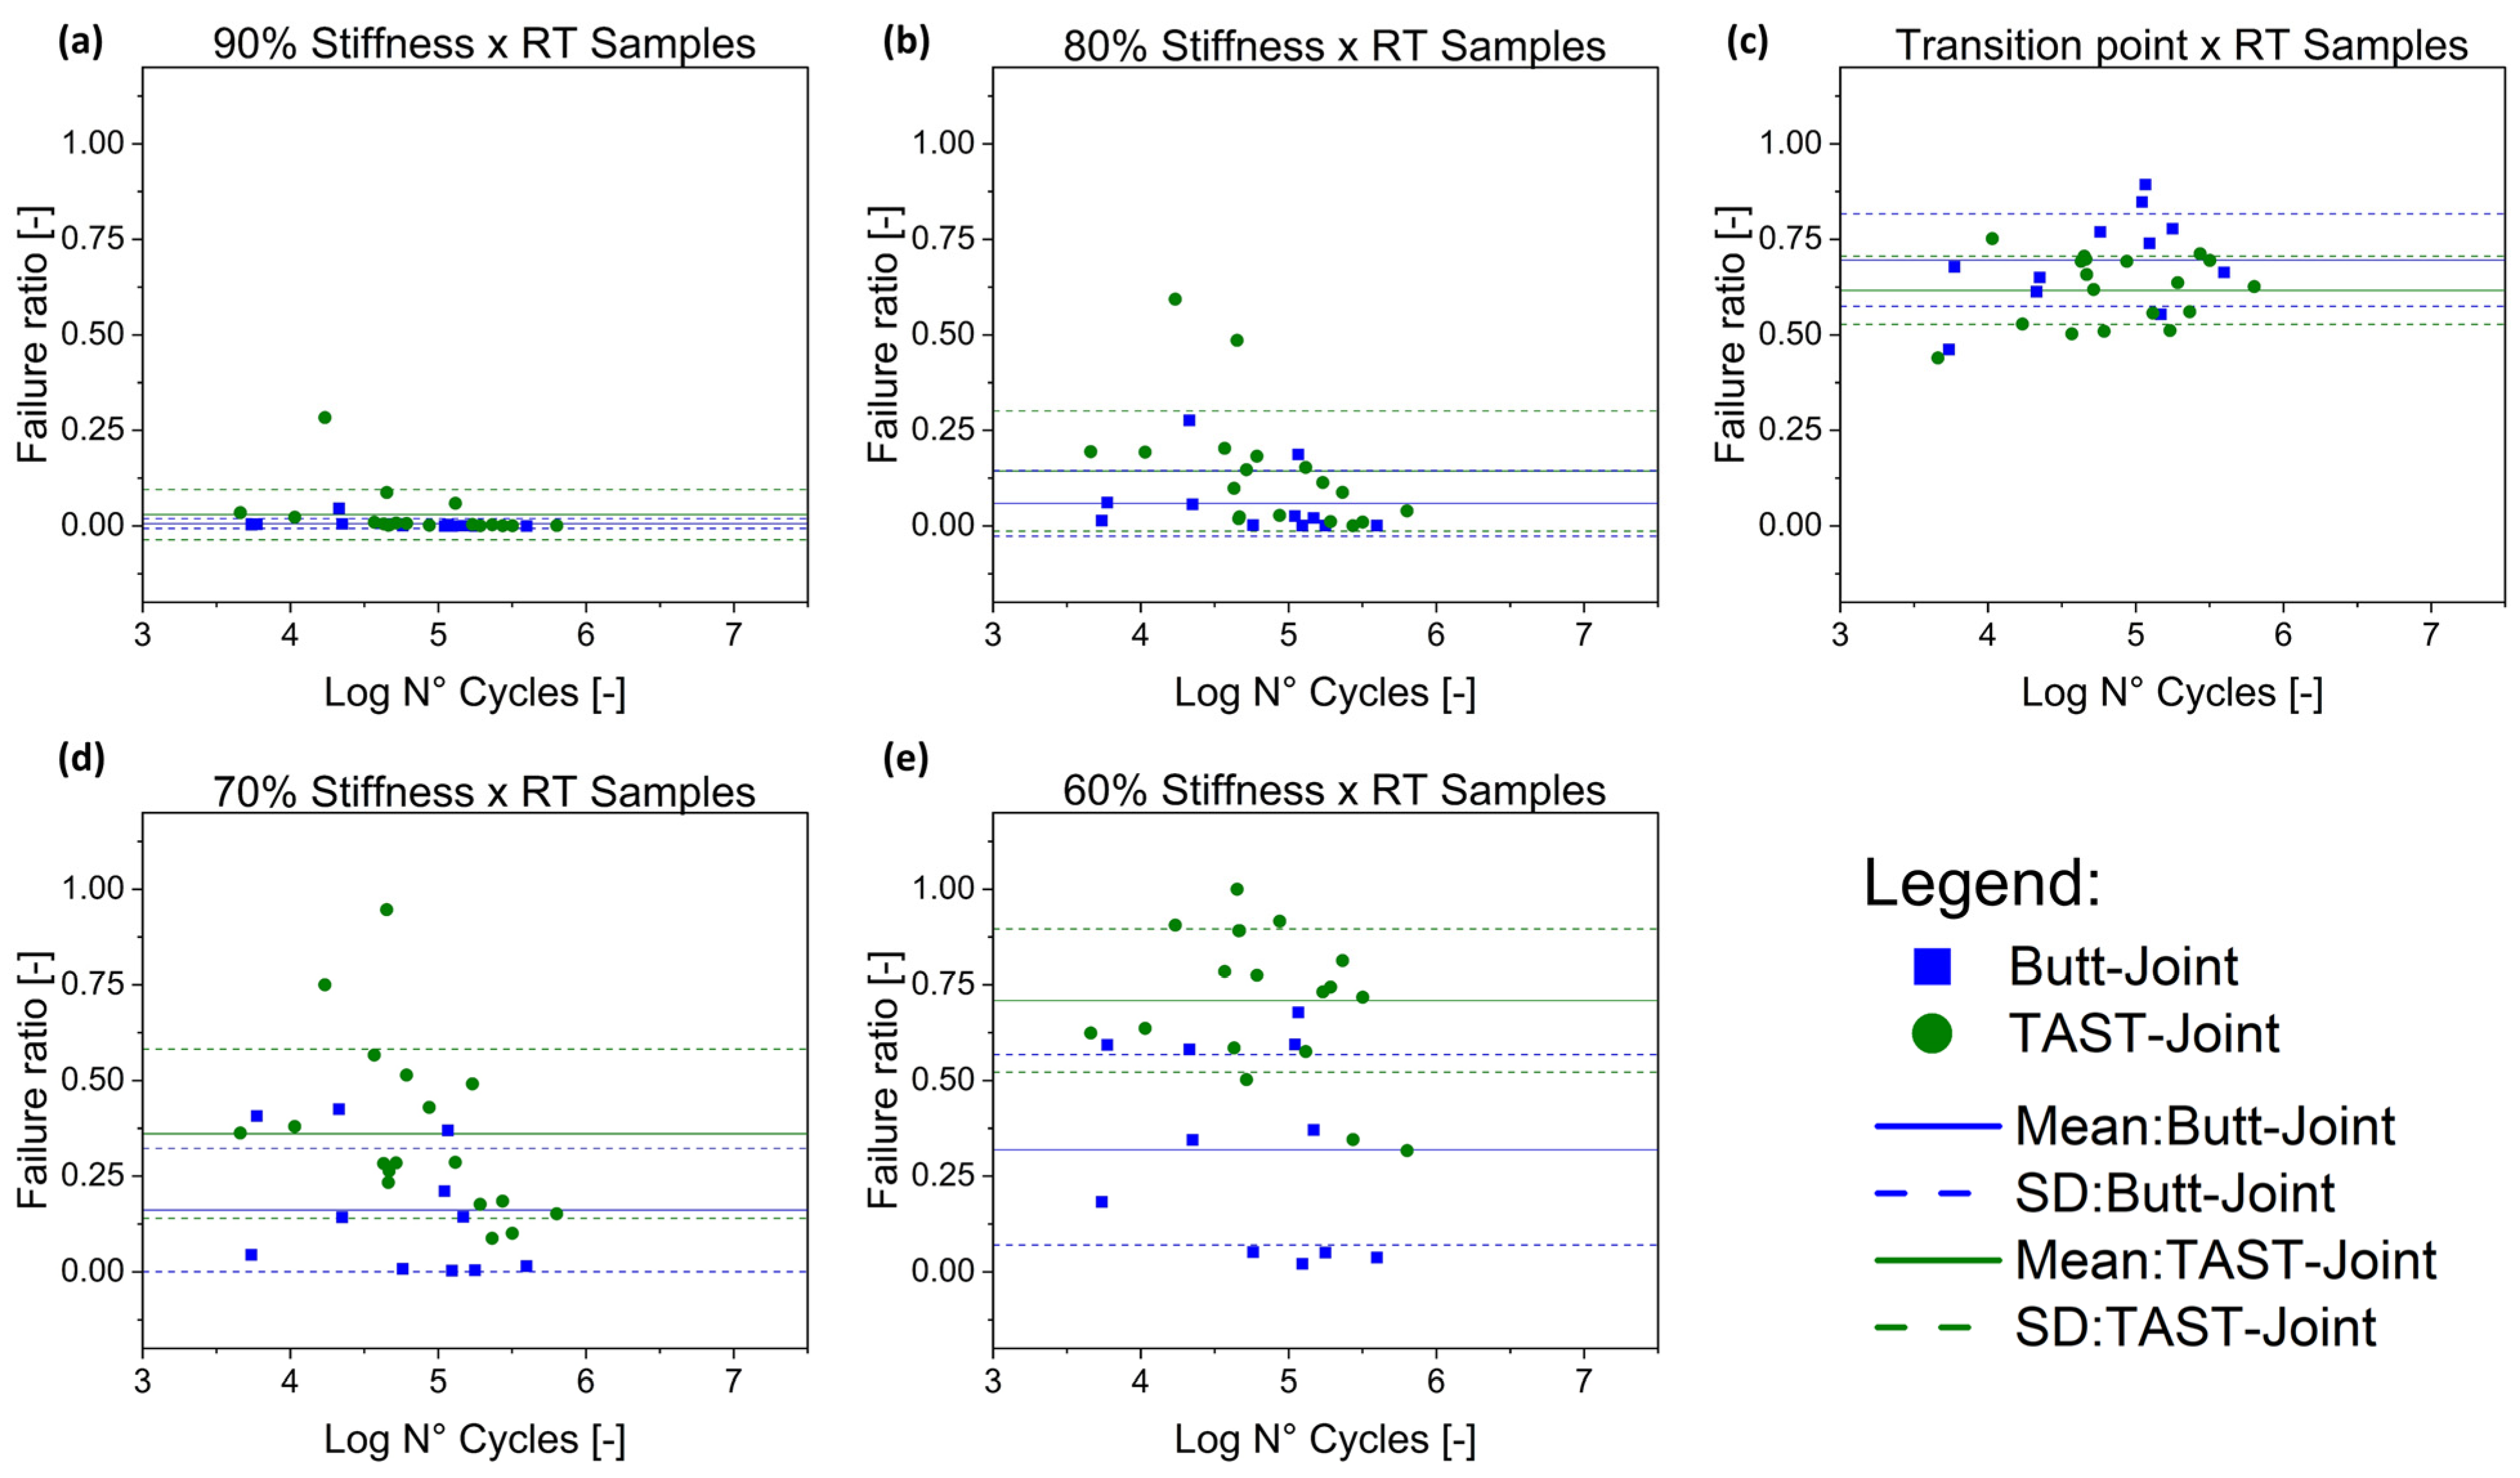
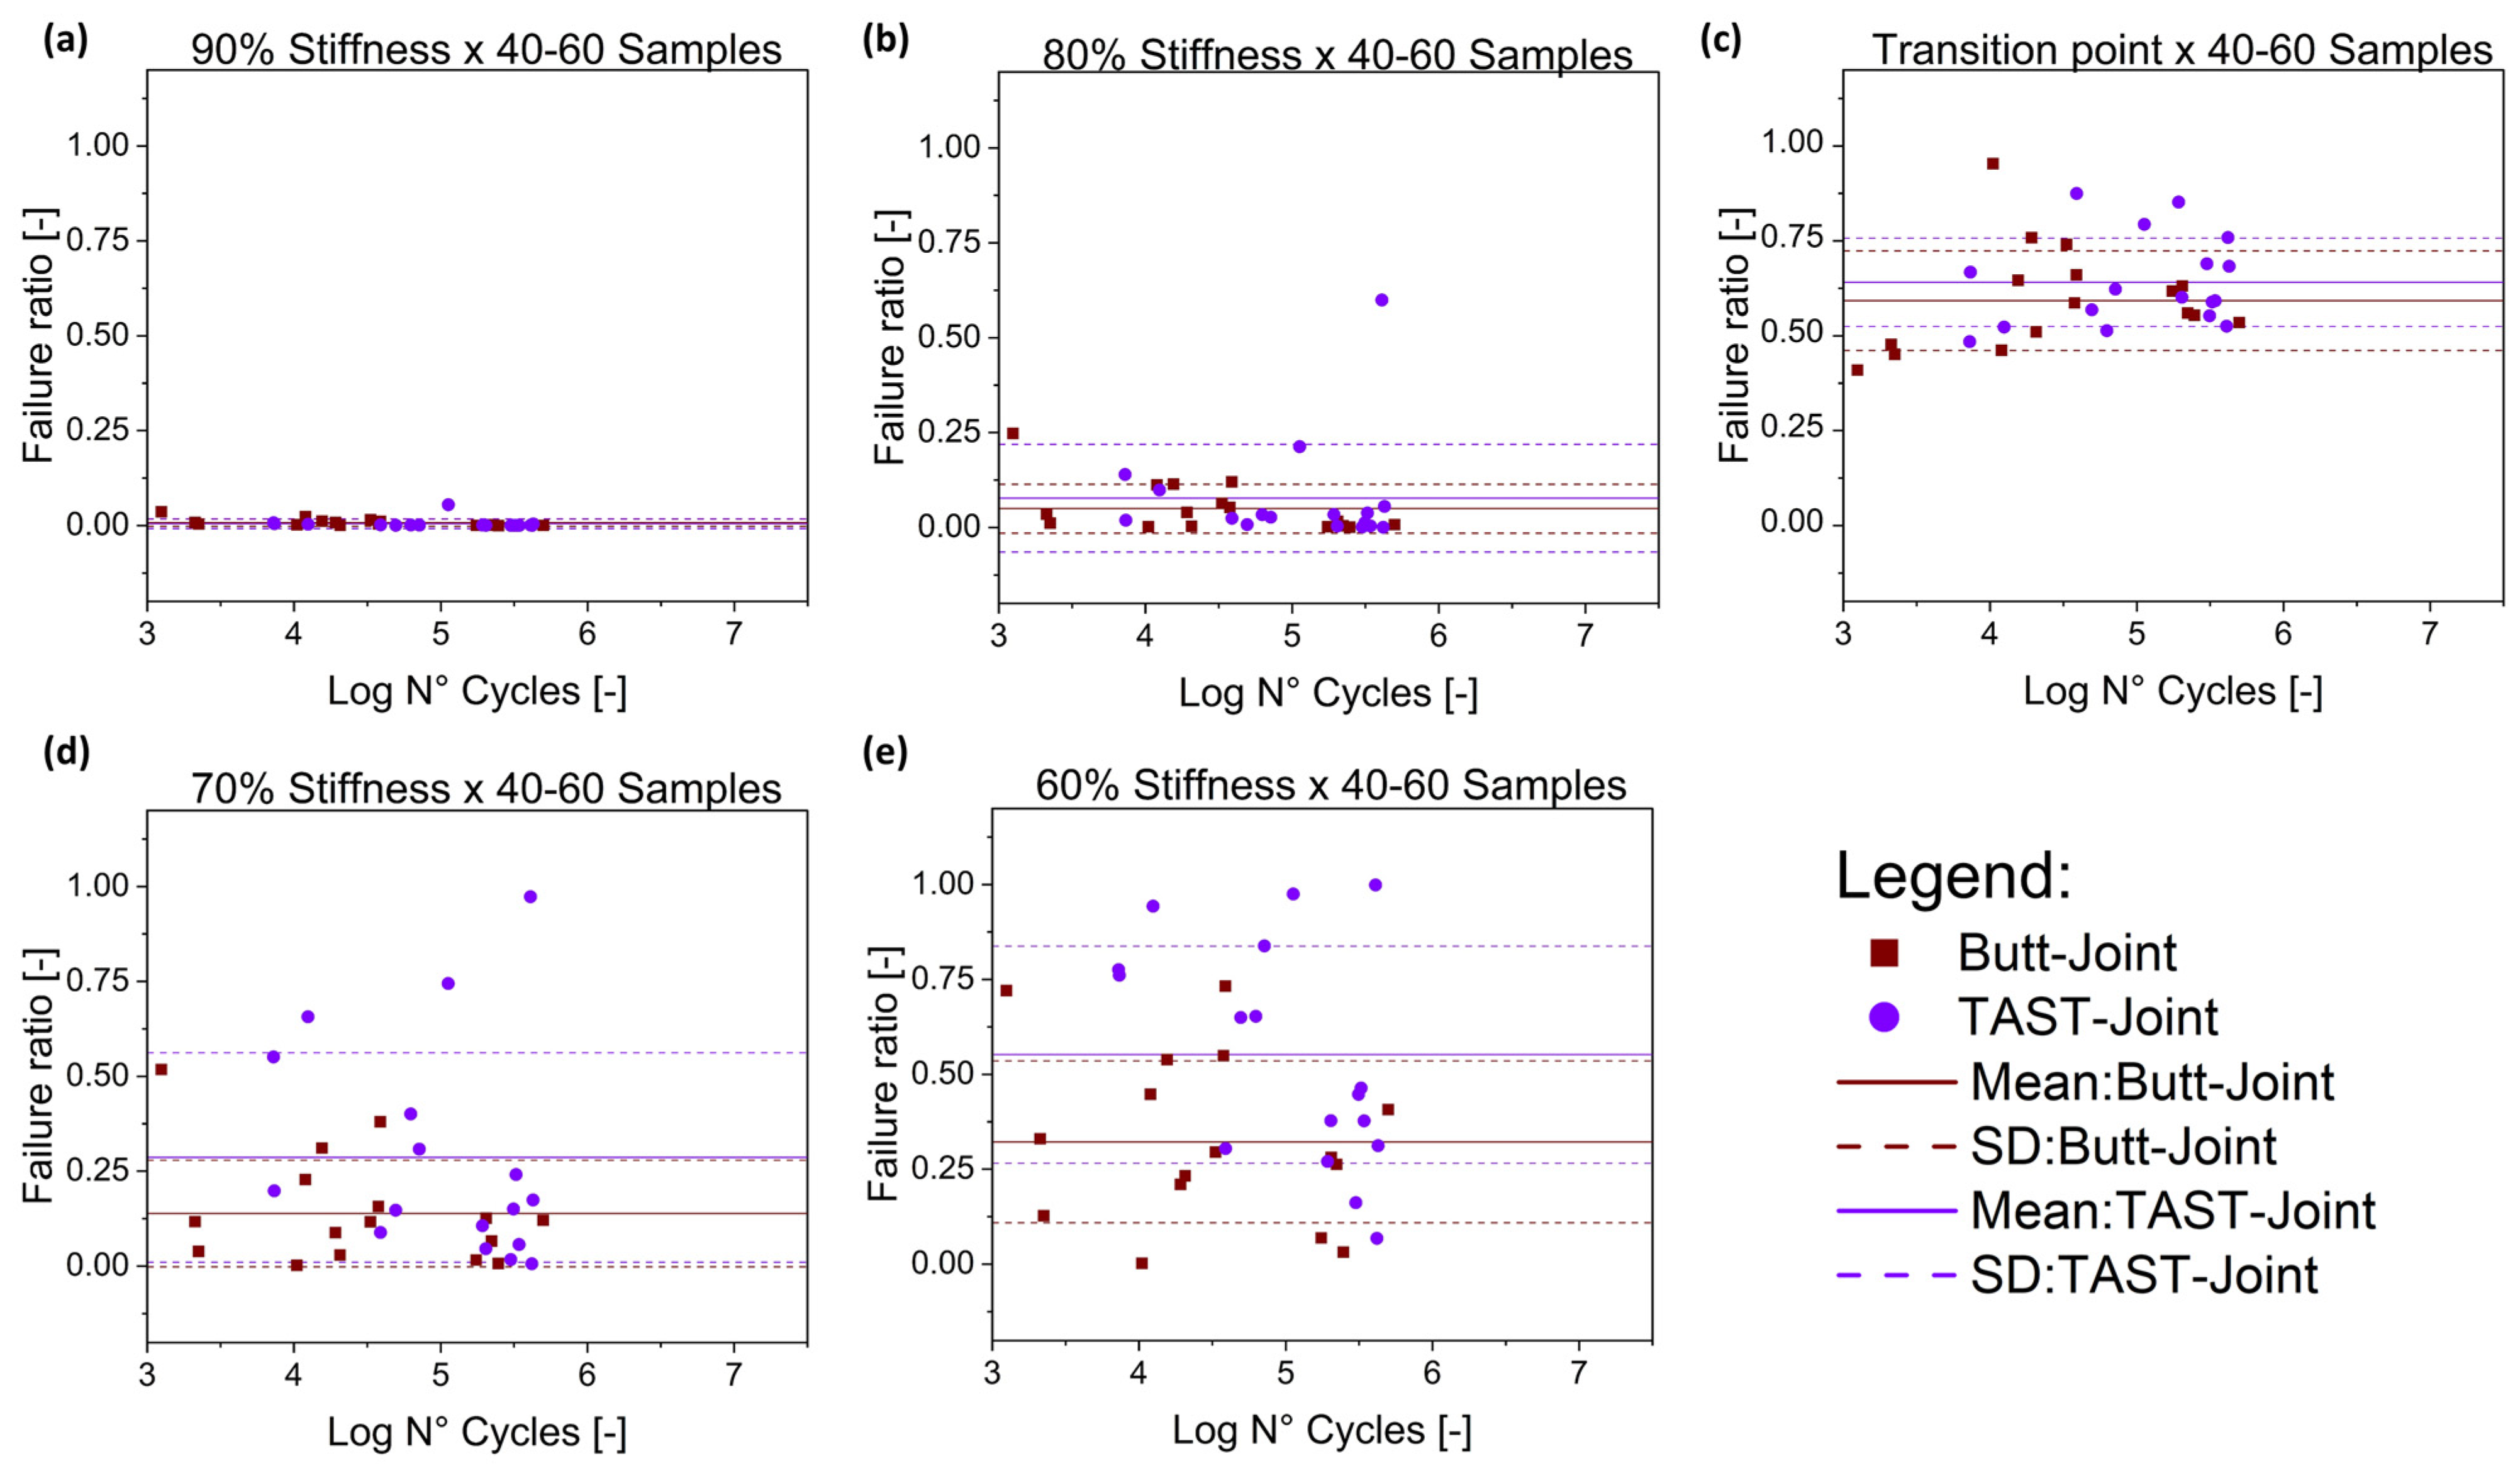
As mentioned in Section 5.1, one of the objectives of the current work is to compare the scatter of the fatigue design curves obtained based on stiffness levels and based on reaching the transition point. As the design curves for all cases (two adhesives, two joint geometries, two conditions, three values of stress ratios and six methods applied) would result in 144 design curves, the ones related to the stress ratio of R = 0.1 were selected as representatives.
The fatigue test results obtained for the PU and SMP adhesives for R = 0.1 are presented in Figure 20 and Figure 21 in the form of load–cycle (L–N) curves, where the life is plotted against the maximum applied load [26,37]. The presence of significant scatter is inherently associated with the phenomenon of fatigue [21].
It is important to emphasise that the accuracy of predictions is highly dependent on the scatter of the experimental data (i.e., fatigue design curves). To quantify the scatter and evaluate the quality of the data for each curve, the R-squared values of the linear regression for the PU and SMP adhesives are provided in Table 2 and Table 3. The average and standard deviation, considering four SN curves (TAST joint (23–50 and 40–60) and butt joint (23–50 and 40–60)) are also given.
In terms of the data quality, the fatigue design curves until the point of the final failure present the higher values of R-squared followed closely by the method that uses the transition point. The curves related to 90% and 80% degrees of stiffness degradation show the smallest values for the R-squared, also with the highest values of the standard deviation. For 70% and 60% stiffness, the average values are close to the ones obtained with the transition point, but the standard deviation is slightly higher (especially for the butt joint of the PU adhesive at RT).
Another interesting point regarding the fatigue design curves is in the comparison between the curves obtained up to total failure and up to the transition point. The curves appear parallel to each other, so that the use of the curves up to the transition point proves to be a safer option in terms of design without failures.

5.5. Failure Ratio

As noted in Section 5.2 and Section 5.3, during fatigue testing for TAST and butt joints, cracking of these joints initiates differently. In the first case, cracks are visible from the beginning of the fatigue test at the edges of the overlap length. In the latter, no cracks are visible from the outside until the final failure occurs. Therefore, crack initiation might not be the most suitable reference for critical structural weakening since it depends on the geometry of the joint. Furthermore, considering only the number of cycles for final failure may be an unsafe methodology for joint design.
To overcome the described challenges, the concept of “failure ratio” was introduced in Section 5.1. The idea is to obtain a method that can be applied to both TAST and butt joints regardless of the stress ratio, conditions, or the range of the number of cycles to final failure. For this purpose, the fatigue data of the TAST and butt joints for the stress ratios of R = 0.1/0.5/−1 (fatigue loading under constant amplitude) were combined in terms of adhesive type and environmental conditions (23 °C/50% r.h. and 40 °C/60% r.h.). Then, for each test performed, the number of cycles to reach the different degrees of stiffness (90%, 80%, 70% and 60% of the initial stiffness value) and to reach the transition point were identified according to Section 4.
The failure ratio was then plotted as a function of the number of cycles to final failure, considering the butt and TAST joints in Figure 22 (PU adhesive at 23 °C/50% r.h.), Figure 23 (SMP adhesive at 23 °C/50% r.h.), Figure 24 (PU adhesive at 40 °C/60% r.h.), and Figure 25 (SMP adhesive at 40 °C/60% r.h.). The average and plus/minus the standard deviation of the failure ratio for each sample are represented by solid and dashed lines, respectively. As a target, the failure ratio should ideally be the same for both samples with the smallest standard deviation possible.
These figures indicate that the approach of considering 90% and 80% of initial stiffness might be over-conservative as, for the majority of cases, only 20% of the total lifetime is spent reaching this value. The approach of considering 70% or 60%, despite allowing for larger failure ratios, does present very distinct values of the failure ratio between butt and TAST joints. The transition point approach, on the other hand, demonstrates a combination of a high average fatigue ratio with similar values for TAST and butt joints accompanied by a minimum standard deviation in all cases investigated.
These findings are summarised in Figure 26, where the average failure ratio (plus/minus the standard deviation) is plotted for (a) PU adhesive at 23 °C/50% r.h., (b) SMP adhesive at 23 °C/50% r.h., (c) PU adhesive at 40 °C/60% r.h., and (d) SMP adhesive at 40 °C/60% r.h. The purple vertical lines indicate the difference between the average values for the butt and TAST joints. In all cases, the failure ratio considering the transition point is larger than 0.55 with a small difference among the different samples. The other approaches have either too little or too distinct values of the failure ratio.
By combining the assessments from Section 5.4 and Section 5.5, the compliance-based approach for the determination of the transition point was able to provide fatigue design curves that have the following characteristics:
(i)
A high coefficient of determination (R-squared), comparable to the final failure curve;
(ii)
A high failure ratio, which avoids over-conservative design;
(iii)
Robustness, since the failure ratios for different adhesives (PU and SMP), stress ratios (R = −1, 0.1, 0.5), conditions (23 °C/50% r.h. and 40 °C/60% r.h.) and geometries (butt joint and TAST joint) are consistent.

6. Conclusions

In the current research work, a compliance-based method for the determination of fatigue design curves for elastomeric adhesive joints was developed and validated. The method was derived from fatigue experiments with two different elastomeric adhesives (a polyurethane and a silane-modified polymer) subjected to varied stress ratios (R = 0.1/0.5/−1). The butt and thick adherent shear test geometries were considered for the fatigue tests at RT (23 °C/50% r.h.) and 40 °C/60% r.h.
An analysis of pictures during testing were conducted to identify cracks in the two types of joints. On one hand, for the TAST joint samples, the crack initiated in the very beginning of the tests at the overlap corners where stress concentrations take place. On the other hand, for the butt joint, the cracks were not visible from an external view before their final failure.
For the fatigue tests, the stiffness and compliance per cycle were calculated for the entire lifetime until total sample rupture. From the compliance plots, two distinct regions were identified: in the beginning, a region with stable compliance growth and, closer to the final failure, a region with unstable compliance growth. The proposed method aimed to determine the transition point between these regions and to construct fatigue design curves based on this point.
The number of cycles to reach the transition point were compared to the number of cycles to reach different degrees of stiffness (90%, 80%, 70% and 60% of initial stiffness). Fatigue design curves were built from the number of cycles of each one of the described approaches. In terms of the data quality, the fatigue design curves until final failure presented the highest values of R-squared followed closely by the method using the transition point. The curves related to 90% and 80% degrees of stiffness degradation show the smallest values for the R-squared.
The failure ratio concept, which is the ratio between the lifetime for reaching a given approach and the total lifetime, was introduced. The approach that considered 90% and 80% of initial stiffness was over-conservative with very small values of the failure ratio (less than 0,2 for the majority of cases). The approach that considered 70% or 60% of initial stiffness presented very distinct values of the failure ratio between butt and TAST joints. On the other hand, the transition point approach demonstrated a combination of high fatigue ratios with similar values for TAST and butt joints along with a minimum standard deviation.
These findings suggest that the compliance-based determination of the transition point between stable and unstable compliance growth can yield fatigue design curves with a high coefficient of determination (accuracy) and high failure ratio (avoiding over-conservative design). Moreover, the method was robust, as the failure ratio for different adhesives (PU and SMP), stress ratios (R = −1, 0.1, 0.5), conditions (23 °C/50% r.h. and 40 °C/60% r.h.) and geometries (butt joint and TAST joint) were highly consistent.

Author Contributions

Conceptualization, P.H.E.F. and V.C.B.; code development, P.H.E.F. and A.W.; validation and formal analysis, P.H.E.F. and V.C.B.; experimental tests, P.H.E.F. and V.C.B.; discussion, P.H.E.F. and V.C.B.; writing—review and editing, P.H.E.F. and V.C.B.; supervision, A.W., C.N. and B.M. All authors have read and agreed to the published version of the manuscript.

Funding

The IGF project No. 20655 N “Nachweisführung für die Beanspruchbarkeit von hyperelastischen Klebverbindungen unter betriebsrelevanten Bedingungen II” of the Research Association for Welding and Allied Processes of DVS was funded by the AiF within the framework of the programme for the promotion of Industrial Collective Research (IGF) of the Federal Ministry for Economic Affairs and Climate Action BMWK on the basis of a resolution of the German Bundestag. V.C. Beber acknowledges the funding from CAPES (Coordenação de Aperfeiçoamento de Pessoal de Nível Superior) through the Science without Borders program under the grant BEX 13458/13-2.

Data Availability Statement

Not applicable.

Conflicts of Interest

The authors declare no conflict of interest.

Abbreviations

The following abbreviations/symbols were employed in this investigation:
Abbreviation/SymbolMeaning
NNumber of cycles
RStress ratio
dadhAdhesive layer thickness
PUPolyurethane
SMPSilane-modified polymers
TASTThick-Adherend-Shear-Test Joint
r.h.Relative humidity
τ Shear stress
σ Tensile stress
τ a Shear stress amplitude
σ a Tensile stress amplitude
τ m Shear mean stress
σ m Tensile mean stress

References

  1. Duncan, B. Developments in testing adhesive joints. In Advances in Structural Adhesive Bonding; Elsevier: Amsterdam, The Netherlands, 2010; pp. 389–436. ISBN 9781845694357. [Google Scholar]
  2. Burchardt, B. Advances in polyurethane structural adhesives. In Advances in Structural Adhesive Bonding; Elsevier: Amsterdam, The Netherlands, 2010; pp. 35–65. ISBN 9781845694357. [Google Scholar]
  3. Rosendahl, P.L. From Bulk to Structural Failure: Fracture of Hyperelastic Materials, 1st ed; Springer Fachmedien Wiesbaden; Imprint Springer Vieweg: Wiesbaden, Germany, 2021; ISBN 9783658316051. [Google Scholar]
  4. Adin, H.; Yildiz, B.; Adin, M.Ş. Numerical investigation of fatigue behaviours of non-patched and patched aluminium pipes. Eur. J. Tech. 2021, 11, 60–65. [Google Scholar] [CrossRef]
  5. Evangelista Fernandes, P.H.; Nagel, C.; Wulf, A.; Beber, V.C. Mean stress correction and fatigue failure criteria for hyperelastic adhesive joints. J. Adhes. 2023, 1–24. [Google Scholar] [CrossRef]
  6. Adin, H.; Sağlam, Z.; Adin, M.Ş. Numerical investigation of fatigue behavior of non-patched and patched aluminum/composite plates. Eur. Mech. Sci. 2021, 5, 168–176. [Google Scholar] [CrossRef]
  7. Zhang, Y.; Vassilopoulos, A.; Keller, T. Stiffness degradation and fatigue life prediction of adhesively-bonded joints for fiber-reinforced polymer composites. Int. J. Fatigue 2008, 30, 1813–1820. [Google Scholar] [CrossRef]
  8. Abdel Wahab, M.M. Fatigue in Adhesively Bonded Joints: A Review. ISRN Mater. Sci. 2012, 2012, 746308. [Google Scholar] [CrossRef]
  9. Beber, V.C.; Schneider, B. Fatigue of structural adhesives under stress concentrations: Notch effect on fatigue strength, crack initiation and damage evolution. Int. J. Fatigue 2020, 140, 105824. [Google Scholar] [CrossRef]
  10. Hamdi, A.; Boulenouar, A.; Benseddiq, N.; Guessasma, S. Crack propagation in elastomers subjected to cyclic loading. Proc. IMechE 2019, 233, 2301–2310. [Google Scholar] [CrossRef]
  11. Boutar, Y.; Naïmi, S.; Mezlini, S.; Carbas, R.J.; da Silva, L.F.; Ben Sik Ali, M. Cyclic fatigue testing: Assessment of polyurethane adhesive joints’ durability for bus structures’ aluminium assembly. J. Adv. Join. Process. 2021, 3, 100053. [Google Scholar] [CrossRef]
  12. Heinrich, G.; Kipscholl, R.; Stoček, R. (Eds.) Fatigue Crack Growth in Rubber Materials: Experiments and Modelling; Springer: Cham, Switzerland, 2021; ISBN 3030689190. [Google Scholar]
  13. Lee, S.; Pharr, M. Sideways and stable crack propagation in a silicone elastomer. Proc. Natl. Acad. Sci. USA 2019, 116, 9251–9256. [Google Scholar] [CrossRef]
  14. Beber, V.C.; Fernandes, P.H.E.; Wulf, A.; Nagel, C.; Koschek, K.; Mayer, B. Final Report of the Project: “Nachweisführung für die Beanspruchbarkeit von Hyperelastischen Klebverbindungen unter Betriebsrelevanten Bedingungen II”; IGF-Vorhaben Nr. 20665 N; DVS-Media: Düsseldorf, Germany, 2023. [Google Scholar]
  15. Varadarajan, R.; Rimnac, C.M. Compliance calibration for fatigue crack propagation testing of ultra high molecular weight polyethylene. Biomaterials 2006, 27, 4693–4697. [Google Scholar] [CrossRef]
  16. Çavdar, S.; Teutenberg, D.; Meschut, G.; Wulf, A.; Hesebeck, O.; Brede, M.; Mayer, B. Stress-based fatigue life prediction of adhesively bonded hybrid hyperelastic joints under multiaxial stress conditions. Int. J. Adhes. Adhes. 2020, 97, 102483. [Google Scholar] [CrossRef]
  17. Schijve, J. Fatigue of Structures and Materials; Springer Netherlands: Dordrecht, The Netherlands, 2009; ISBN 9781402068089. [Google Scholar]
  18. Fernandes, P.H.E.; Silva, G.C.; Pitz, D.B.; Schnelle, M.; Koschek, K.; Nagel, C.; Beber, V.C. Data-Driven, Physics-Based, or Both: Fatigue Prediction of Structural Adhesive Joints by Artificial Intelligence. Appl. Mech. 2023, 4, 334–355. [Google Scholar] [CrossRef]
  19. Pizzi, A.; Mittal, K.L. Handbook of Adhesion Technology; Springer: Berlin/Heidelberg, Germany, 2011. [Google Scholar]
  20. Beber, V.C.; Schneider, B.; Brede, M. Influence of Temperature on the Fatigue Behaviour of a Toughened Epoxy Adhesive. J. Adhes. 2016, 92, 778–794. [Google Scholar] [CrossRef]
  21. Fernandes, P.; Poggenburg-Harrach, L.; Nagel, C.; Beber, V.C. Lifetime calculation of adhesively bonded joints under proportional and non-proportional multiaxial fatigue loading: A combined critical plane and critical distance approach. J. Adhes. 2022, 98, 780–809. [Google Scholar] [CrossRef]
  22. Sousa, F.C.; Akhavan-Safar, A.; Goyal, R.; Da Silva, L. Fatigue life estimation of single lap adhesive joints using a critical distance criterion: An equivalent notch approach. Mech. Mater. 2021, 153, 103670. [Google Scholar] [CrossRef]
  23. Jeandrau, J.-P.; Peyrac, C.; Lefebvre, F.; Renard, J.; Gantchenko, V.; Patamaprohm, B.; Guinault, C. Fatigue Behaviour of Adhesive Joints. Procedia Eng. 2015, 133, 508–517. [Google Scholar] [CrossRef]
  24. Beber, V.C.; Brede, M. Multiaxial static and fatigue behaviour of elastic and structural adhesives for railway applications. Procedia Struct. Integr. 2020, 28, 1950–1962. [Google Scholar] [CrossRef]
  25. Schmandt, C.; Marzi, S. Effect of crack opening velocity on fracture behavior of hyperelastic semi-structural adhesive joints subjected to mode I loading. Procedia Struct. Integr. 2018, 13, 799–805. [Google Scholar] [CrossRef]
  26. Sousa, F.C.; Akhavan-Safar, A.; Goyal, R.; Silva, L.F.M. The influence of mode mixity and adhesive system on the fatigue life of adhesive joints. Fatigue Fract. Eng. Mater. Struct. 2020, 43, 2337–2348. [Google Scholar] [CrossRef]
  27. Lemaitre, J. A Continuous Damage Mechanics Model for Ductile Fracture. J. Eng. Mater. Technol. 1985, 107, 83–89. [Google Scholar] [CrossRef]
  28. Costa, J.; Vicens, J.; Blanco, N.; Rodríguez-Bellido, A. Fatigue behaviour of adhesive films and laminating resins in bonded joints for repair purposes. In Proceedings of the ICCM17–17th International Conference on Composite Materials, Edinburgh, UK, 27–31 July 2009. [Google Scholar]
  29. Lorenz, H.; Steinhauser, D.; Klüppel, M. Morphology and Micro-mechanics of Filled Elastomer Blends: Impact on Dynamic Crack Propagation. In Fracture Mechanics and Statistical Mechanics of Reinforced Elastomeric Blends; Grellmann, W., Heinrich, G., Kaliske, M., Klüppel, M., Schneider, K., Vilgis, T., Eds.; Springer: Berlin/Heidelberg, Germany, 2013; pp. 81–128. ISBN 978-3-642-37909-3. [Google Scholar]
  30. Wallau, W.; Recknagel, C. Durability assessment of structural sealant glazing systems applying a performance test method. J. Adhes. 2022, 98, 464–487. [Google Scholar] [CrossRef]
  31. Loureiro, A.L.; da Silva, L.F.M.; Sato, C.; Figueiredo, M.A.V. Comparison of the Mechanical Behaviour Between Stiff and Flexible Adhesive Joints for the Automotive Industry. J. Adhes. 2010, 86, 765–787. [Google Scholar] [CrossRef]
  32. Sheikh, N.; Mirzadeh, H.; Katbab, A.A.; Salehian, P.; Daliri, M.; Amanpour, S. Isocyanate-terminated urethane prepolymer as bioadhesive material: Evaluation of bioadhesion and biocompatibility, in vitro and in vivo assays. J. Biomater. Sci. Polym. Ed. 2001, 12, 707–719. [Google Scholar] [CrossRef] [PubMed]
  33. Gadhave, R.V.; Gadhave, C.R.; Dhawale, P.V. Silane Terminated Prepolymers: An Alternative to Silicones and Polyurethanes. Open J. Polym. Chem. 2021, 11, 31–54. [Google Scholar] [CrossRef]
  34. DIN. Kleben von Schienenfahrzeugen und -Fahrzeugteilen: Teil 3: Leitfaden zur Konstruktion und Nachweisführung von Klebverbindungen im Schienenfahrzeugbau; Beuth Verlag: Berlin, Germany, 2015; pp. 6701–6703. [Google Scholar]
  35. Ball, J. Discontinuous equilibrium solutions and cavitation in nonlinear elasticity. Phil. Trans. R. Soc. 1982, 306, 557–611. [Google Scholar] [CrossRef]
  36. Lion, A.; Johlitz, M. Constitutive Models for Rubber X, Proceedings of the 10th European Conference on Constitutive Models for Rubbers X, Munich, Germany, 28–31 August 2017, 1st ed.; Taylor and Francis: Boca Raton, FL, USA, 2017; ISBN 9781315223278. [Google Scholar]
  37. Boutar, Y.; Naïmi, S.; Daami, T.; Mezlini, S.; da Silva, L.F.M.; Ali, M.B.S. Mode I Fracture Energy of One-Component Polyurethane Adhesive Joints as Function of Bond Thickness for the Automotive Industry. In Proceedings of the Design and Modeling of Mechanical Systems—III, Hammamet, Tunisia, 27–29 March 2017; pp. 393–403. [Google Scholar] [CrossRef]
Figure 1. Representative relationship between the amplitude compliance × Log n° of cycles in (a) the region of stable compliance growth and (b) the region of unstable compliance growth.
Eng 04 00150 g001
Figure 2. Quasi-static test results according to DIN 6701-3: (a) Polyurethane adhesive and (b) SMP adhesive—Data from Beber et al. [14].
Eng 04 00150 g002
Figure 3. Joint geometries: (a) Butt joint and (b) TAST joint.
Eng 04 00150 g003
Figure 4. Fatigue testing setup for the butt joint sample.
Eng 04 00150 g004
Figure 5. Fatigue testing setup for the TAST joint sample.
Eng 04 00150 g005
Figure 6. Representation of the methodology to determine the unstable compliance growth region: (a) recursive fitting procedure developed in Python and (b) R-squared values × Log n° of cycles for each fit performed.
Eng 04 00150 g006
Figure 7. Implementation flowchart.
Eng 04 00150 g007
Figure 8. PU adhesive, TAST joint, RT: (a) N° cycles × amplitude compliance; (b) N° cycles × normalised stiffness.
Eng 04 00150 g008
Figure 9. PU adhesive, TAST joint, RT, R = 0.1, test pictures: (a) 90% stiffness, (b) 80% stiffness, (c) 70% stiffness, (d) transition point, (e) 60% stiffness and (f) before the final failure.
Eng 04 00150 g009
Figure 10. PU adhesive, TAST joint, RT, R = 0.5, test pictures: (a) 90% stiffness, (b) 80% stiffness, (c) 70% stiffness, (d) transition point, (e) 60% stiffness and (f) before the final failure.
Eng 04 00150 g010
Figure 11. PU adhesive, TAST joint, RT, R = −1, test pictures: (a) 90% stiffness, (b) 80% stiffness, (c) 70% stiffness, (d) transition point, (e) 60% stiffness and (f) before the final failure.
Eng 04 00150 g011
Figure 12. SMP adhesive, TAST joint, RT: (a) N° cycles × amplitude compliance; (b) N° cycles × normalised stiffness.
Eng 04 00150 g012
Figure 13. SMP adhesive, TAST joint, RT, R = 0.1, test pictures: (a) 90% stiffness, (b) 80% stiffness, (c) 70% stiffness, (d) transition point, (e) 60% stiffness and (f) before the final failure.
Eng 04 00150 g013
Figure 14. SMP adhesive, TAST joint, RT, R = 0.5, test pictures: (a) 90% stiffness, (b) 80% stiffness, (c) 70% stiffness, (d) transition point, (e) 60% stiffness and (f) before the final failure.
Eng 04 00150 g014
Figure 15. SMP adhesive, TAST joint, RT, R = −1, test pictures: (a) 90% stiffness, (b) 80% stiffness, (c) 70% stiffness, (d) transition point, (e) 60% stiffness and (f) before the final failure.
Eng 04 00150 g015
Figure 16. Butt joint, R = 0.1, RT (in black: SMP adhesive; and in red: PU adhesive): (a) N° cycles × amplitude compliance; (b) N° cycles × normalised stiffness.
Eng 04 00150 g016
Figure 17. PU adhesive, butt joint, RT, R = 0.1, test pictures: (a) 90% stiffness, (b) 80% stiffness, (c) 70% stiffness, (d) transition point, (e) 60% stiffness and (f) before the final failure.
Eng 04 00150 g017
Figure 18. SMP adhesive, butt joint, RT, R = 0.1, test pictures: (a) 90% stiffness, (b) 80% stiffness, (c) 70% stiffness, (d) transition point, (e) 60% stiffness and (f) before the final failure.
Eng 04 00150 g018
Figure 19. PU adhesive, butt joint, RT, R = 0.1, cut sample at the mid-surface of the adhesive layer thickness: (a) no mechanical test performed; (b) test stopped at 44,000 cycles; (c) total failure with 46,124 cycles.
Eng 04 00150 g019
Figure 20. Fatigue design curves for the PU adhesive and R = 0.1: (a) Butt joint at RT; (b) Butt joint at 40 °C/60% r.h.; (c) TAST joint at RT; (d) TAST joint at 40 °C/60% r.h.
Eng 04 00150 g020
Figure 21. Fatigue design curves for the SMP adhesive and R = 0.1: (a) Butt joint at RT; (b) Butt joint at 40 °C/60% r.h.; (c) TAST joint at RT; (d) TAST joint at 40 °C/60% r.h.
Eng 04 00150 g021
Figure 22. Failure ratio as a function of the number of cycles for PU adhesive at RT (23 °C/50% r.h.): (a) For 60% of initial stiffness; (b) For 70% of initial stiffness; (c) For 80% of initial stiffness; (d) For 90% of initial stiffness; (e) For reaching the transition point.
Eng 04 00150 g022
Figure 23. Failure ratio as a function of the number of cycles for SMP samples at RT (23 °C/50% r.h.): (a) For 60% of initial stiffness; (b) For 70% of initial stiffness; (c) For 80% of initial stiffness; (d) For 90% of initial stiffness; (e) For reaching the transition point.
Eng 04 00150 g023
Figure 24. Failure ratio as a function of the number of cycles for PU samples at 40 °C/60% r.h.: (a) For 60% of initial stiffness; (b) For 70% of initial stiffness; (c) For 80% of initial stiffness; (d) For 90% of initial stiffness; (e) For reaching the transition point.
Eng 04 00150 g024
Figure 25. Failure ratio as a function of the number of cycles for SMP samples at 40 °C/60% r.h.: (a) For 60% of initial stiffness; (b) For 70% of initial stiffness; (c) For 80% of initial stiffness; (d) For 90% of initial stiffness; (e) For reaching the transition point.
Eng 04 00150 g025
Figure 26. Average failure ratio combining fatigue data for stress ratios of R = −1, 0.1 and 0.5 for different approaches: (a) PU adhesive at 23 °C/50% r.h., (b) SMP adhesive at 23 °C/50% r.h., (c) PU adhesive at 40 °C/60% r.h., and (d) SMP adhesive at 40 °C/60% r.h. with TP (Transition Point), S60 (60% stiffness), S70 (70% stiffness), and S80 (80% stiffness).
Eng 04 00150 g026
Table 1. Sequence list for constant amplitude fatigue tests.
Adhesive
[-]
Joint
[-]
Condition
[°C]/[% r.h.]
R
[-]
PUButt23/500.1, 0.5
PUButt40/60−1, 0.1, 0.5
PUTAST23/50−1, 0.1, 0.5
PUTAST40/60−1, 0.1, 0.5
SMPButt23/500.1, 0.5
SMPButt40/60−1, 0.1, 0.5
SMPTAST23/50−1, 0.1, 0.5
SMPTAST40/60−1, 0.1, 0.5
Table 2. R-squared values related to the fatigue design curves of the PU adhesive at R = 0.1.
TAST_RTTAST_40–60BJ_RTBJ_40–60Average [-]Std. Dev. [-]
Failure0.970.980.870.810.900.06
Transition p.0.950.980.850.750.880.08
90% Stiffness0.230.080.130.390.210.11
80% Stiffness0.460.020.010.410.220.19
70% Stiffness0.910.750.450.800.730.15
60% Stiffness0.950.980.680.810.860.11
Table 3. R-squared values related to the fatigue design curves of the SMP adhesive at R = 0.1.
TAST_RTTAST_40–60BJ_RTBJ_40–60Average [-]Std. Dev. [-]
Failure0.980.980.930.710.900.10
Transition p.0.990.940.930.740.900.09
90% Stiffness0.130.050.020.550.190.19
80% Stiffness0.080.580.740.880.570.27
70% Stiffness0.990.650.900.870.850.11
60% Stiffness0.980.770.930.840.880.07
Disclaimer/Publisher’s Note: The statements, opinions and data contained in all publications are solely those of the individual author(s) and contributor(s) and not of MDPI and/or the editor(s). MDPI and/or the editor(s) disclaim responsibility for any injury to people or property resulting from any ideas, methods, instructions or products referred to in the content.

