
Abundant Species Govern the Altitude Patterns of Bacterial Community in Natural and Disturbed Subalpine Forest Soils
1
Ecological Security and Protection Key Laboratory of Sichuan Province, Mianyang Normal University, Mianyang 621000, China
2
Engineering Research Center of Chuanxibei RHS Construction at Mianyang Normal University of Sichuan Province, Mianyang Normal University, Mianyang 621000, China
*
Author to whom correspondence should be addressed.
Diversity 2024, 16(4), 242; https://doi.org/10.3390/d16040242
Submission received: 27 February 2024
/
Revised: 10 April 2024
/
Accepted: 15 April 2024
/
Published: 18 April 2024
(This article belongs to the Special Issue Microbiota Diversity in Plants and Forest)
Abstract
:Abundant and rare bacteria exhibit unequal responses to environmental changes and disturbances, potentially resulting in differential contributions to the altitudinal characteristics of total community in natural and disturbed soils. Although the altitude patterns of soil bacteria have been widely studied, it remains unclear whether these patterns are consistent among bacteria with varying predominance levels, and which subpopulation contributes more to maintaining these patterns in natural and disturbed subalpine forest soils. In this study, we collected 18 natural subalpine forest soil samples and 18 disturbed ones from three altitudes (2900 m a.s.l., 3102 m a.s.l., and 3194 m a.s.l.) along the Wenma highway in Miyaluo, Lixian, Sichuan, Southwest China. By partitioning total bacterial communities based on species predominance, we found that bacteria with higher predominance levels tended to exhibit altitude patterns (α-diversity, community structure, and functional redundancy) similar to those of total bacteria in both natural and disturbed subalpine forest soils, although they only occupied a small portion of the community. Abundant bacteria might play critical roles in maintaining the regional ecological characteristics of total community across the altitude gradient, while the rare and hyper-rare ones might contribute more to local diversity and functional redundancy. In natural soils, the altitude patterns of α-diversity inferred from total, abundant, and rare bacteria were mainly shaped by -N, while soil conductivity mainly drove the altitude patterns of α-diversity inferred from hyper-rare bacteria. Additionally, the community structures of total, abundant, rare, and hyper-rare bacteria were mainly shaped by -N, while the altitude patterns of functional redundancy inferred from total, abundant, and rare bacteria were mainly shaped by soil conductivity in natural soils. In disturbed subalpine forest soils, the influences of -N for the altitude patterns of α-diversity and community structure, and those of soil conductivity for functional redundancy, were relatively weak in total, abundant, rare, and hyper-rare bacteria. This study examined the roles of bacteria with varying predominance levels in maintaining the altitude pattern of bacteria in both natural and disturbed subalpine forest soils, providing novel insights for devising strategies to conserve biodiversity and ecologically restore disturbed soils in subalpine ecosystems.
1. Introduction
Subalpine forests play crucial roles in supporting terrestrial ecological services such as nutrient cycling [1] and regulating climate, air quality, and hydrology [2,3]. Yet, unprecedented human alterations to the native land surface pose growing threats on subalpine forest ecosystems [4], e.g., highway construction, leading to the degradation of landscape connectivity [5], loss of biodiversity [6], and even decreases in ecosystem quality [7]. Techniques such as external soil spray seeding (ESSS) [8] are often employed to facilitate landscape restorations after construction. It involves spraying artificially mixed soils onto cut slopes caused by the highway construction, and artificially mixed soils consist of composite materials (e.g., water retention and bonding agents), soluble chemical fertilizers, backfill soils, and grass seeds [9,10]. Yet, the composite materials introduced by ESSS [10,11] could also bring disturbances to native soils, impacting the growth and activity of microbes sheltering in these environments. Evidence shows that microbes are key for preserving ecosystem function and stability [12,13]. Also, many studies imply that microbes with different predominance levels are unequal in response to environmental changes and disturbances [14,15,16], while both of them contribute to ecosystem insurance [17,18]. Thus, revealing the characteristics of microbes with varying predominance levels in natural subalpine forest soils and those subjected to ESSS is of important significance to conserve biodiversity and optimize restoration strategies for disturbed subalpine forest ecosystems.
Microbial species abundance distributions follow one of ecology’s universal laws that a community often consists of many rare species and just a few abundant species [19,20,21], and these rare species—referred to as rare microbial biosphere [22]—are defined as the long tail in species rank–abundance curves [19]. Abundant species occupy core niche positions [18], and they are the mostly active and key components of a microbial community in driving biogeochemical cycling [23,24,25,26]. Rare species also play key roles in maintaining the stabilities of microbial community and function [27], conferring diverse metabolic abilities to a community [28], e.g., nutrient cycling [29], multifunctionality [30], carbon fixation [31] and accumulation [32], denitrification [33] and sulfate reduction [34]. Several conditionally rare species can even thrive when the naïve environment has been changed, thereby offering insurance for an ecosystem [17]. Abundant and rare microbial biosphere have been widely studied in many ecosystems [18,35], and these studies show that abundant and rare species unequally respond to environmental changes and disturbances. Regarding forest soils, evidence also indicates that abundant and rare species are unequal in response to environmental changes and disturbances. For example, He et al. (2023) revealed the distinct responses of abundant and rare bacteria to nitrogen additions in tropical forest soils [36]. Zhang et al. (2023) indicated that the α-diversity of abundant bacteria reveals no significant shifts during the successions of the secondary forest in a subalpine region, but increases remarkably for rare bacteria [35]. Notably, the responses of abundant and rare microbes to distinct disturbances are also varied. Jiao et al. (2019) indicated that the richness and relative abundance of abundant species remain relatively stable, while those of rare ones vary due to the disturbances of water addition, oil contamination, plant growth, and the mix of oil contamination and plant growth [18], suggesting that rare microbes may be more sensitive to disturbances. Despite that ESSS is a restoration approach, it has been demonstrated to significantly affect bacterial communities due to the composite materials containing water retention agents, cement, and fertilizers [37]. Such a comprehensive disturbance may differently impact bacterial communities consisting of species with varying predominance levels. Previous studies about ecosystem subjected to ESSS primarily focused on plant landscapes, soil properties, and nutrients [10,38,39]. Recent studies have investigated bacteria in natural subalpine forest soils and those subjected to ESSS [40], or in simulated ESSS experiments [37]. Yet, these studies did not distinguish between abundant and rare species, which still remains elusive with respect to the communities consisting of bacteria with varying predominance levels in subalpine forest soils subjected to ESSS.
Altitude is a synthetical variable affecting all aspects of an ecosystem such as climate, soil properties, and hydrology [41,42], and numerous studies have demonstrated significant shifts in soil microbial diversity and community composition with increasing altitude [43,44,45]. A more recent study also shows that both soil prokaryotic communities consisting of abundant and rare species are significantly impacted by altitude shifts, and the key factors shaping the communities of microbes with different predominance levels are particularly varied [46]. This implies that natural environmental gradients induced by altitude shifts can also have noteworthy and different impacts on soil microbial communities consisting of species with varying predominance levels. In subalpine forest ecosystems, altitude is also a critically synthesized variable in shaping soil microbial communities, because soil properties closely related to microbes, e.g., soil temperature, moisture content, and pH, are expected to change with increasing altitude [40]. Regarding soils subjected to ESSS in the subalpine forest ecosystem, both disturbances caused by ESSS and altitude-induced impacts are expected to influence bacterial communities consisting of species with varying predominance levels, thereby leading to ecological characteristics different from those previously found in natural ecosystems. Our previous study has revealed a decreased pattern for total bacterial diversity in natural subalpine forest soils and those subjected to ESSS with respect to altitude, and the soils subjected to ESSS possess a relatively low bacterial diversity at high altitudes [40]. Yet, it remains unclear how altitude and ESSS regulate the ecological characteristics of soil bacteria with varying predominance levels, and which subpopulation (e.g., abundant and rare bacteria) is the key contributor in maintaining the ecological characteristics of the total soil bacterial community across the altitude gradient.
In this study, we collected 36 soil samples from highway cut slopes (CS) subjected to ESSS and natural subalpine forest soils (NS) (Miyaluo, Lixian County, Sichuan, Southwest China). We focused on two unresolved questions: (i) How do altitude and ESSS regulate the ecological characteristics of soil bacteria with varying predominance levels? (ii) Which subpopulation is the key contributor in maintaining the ecological characteristics of the total soil bacterial community across altitude gradients? While the soil bacterial community along altitude gradients has been widely studied [40,44], this study delves deeper into the roles of abundant and rare species in maintaining the ecological characteristics of total soil bacterial community across altitude gradients. The significance lies in recognizing the ecological characteristics of abundant and rare bacteria and their roles in maintaining microbial biodiversity in both natural subalpine forest soils and those subjected to ESSS, providing novel insights for devising strategies to conserve biodiversity and ecologically restore soils disturbed by infrastructure construction in the subalpine forest ecosystem.
2. Materials and Methods
2.1. Site Description and Soil Sampling
We selected three altitudes (2900 m a.s.l., 3102 m a.s.l., and 3194 m a.s.l.) along the Wenma highway, Miyaluo, Lixian, Sichuan, Southwest China (31°42′38″ N–31°47′55″ N, 102°41′40″ E–102°44′23″ E) for soil sampling. The average annual precipitation of sampling areas varies between 600 and 1100 mm, accompanied by an average annual temperature of 8.9 °C. Soils in sampling regions are typical brown forest soils, and are classified as Cambic Umbrisols according to the IUSS Working Group (2007) [47]. According to the investigations prior to sampling, all cut slopes resulting from highway construction were subjected to ESSS-based restorations between June and October 2015, and they have been restored for about three years as of the sampling date. In October 2018, we collected 36 soil samples from cut slopes (CS) and the adjacent natural subalpine forest soils (NS) at a depth of 0–10 cm. Given the potential variability in soil properties caused by the hydrological condition of cut slopes, we employed an “S-shaped” sampling approach at each altitude site [9,10,48]. Briefly, we first identified six plots along an “S-shaped” route at each site, and then collected five soil cores per plot at a depth of 0–10 cm using quadrat sampling. After eliminating visible rocks, plant roots, and residues, five soil cores collected from each plot were thoroughly blended, and the mixed soils were considered as an independent biological replicate (six biological replicates at each altitude). This procedure was used for soil sampling of both NS and CS. Soils were sieved through a 2.0 mm mesh and subsequently divided into two parts. One part was stored at 4 °C for determining soil properties. Another part was freeze-dried (stored at −20 °C) and immediately used for genomic DNA extraction.
2.2. Soil Property Measurements
Soil pH was measured in a soil–water slurry (1:5, w/v) by a pH meter. Soil conductivity (CD) was measured via a conductivity meter. Soil moisture content (MC) was assessed via subjecting soils to oven drying until reaching a consistent mass at 105 °C [49]. Soil temperature (ST) was measured using a geothermometer in situ during the sampling. Soil total organic carbon (TOC) was assessed using the dichromate oxidation–titration method [50]. Soil total nitrogen (TN) was assessed using the Kjeldahl method [51]. Soil ammonium (-N) and nitrate nitrogen (-N) were measured using the indophenol blue method and the phenol disulfonic acid method, respectively [52]. Soil total phosphorus (TP) was digested with H2SO4-HClO4 first, and then measured using a molybdenum-blue colorimetric method [53]. Soil available phosphorus (SAP) was measured using the molybdenum antimony anti-colorimetric method [54].
2.3. DNA Extraction, 16S rRNA Gene Amplification and High-Throughput Sequencing
Genomic DNA was extracted from 0.25 g freeze-dried soils using a DNeasy® PowerSoil® kit (QIAGEN GmbH, Hilden, Germany), and then checked using a Nano-Drop ND-1000 Spectrophotometer (Nano-Drop Technologies Inc., Wilmington, DE, USA). Only the DNA with high quality was used for polymerase chain reaction (PCR) amplification using the primers 515F/909R [55]. The PCR reaction system comprised 25 μL, containing 1 μL of high-quality DNA template (about 20 ng), 1 μL each of 10 μM forward and reverse primers, 9.5 μL of H2O, and 12.5 μL of MasterMix (including PCR buffer, DNA polymerase, dNTPs, and Mg2+) (CWBIO, Beijing, China). The amplification protocol proceeded as follows: initial denaturation at 94 °C for 3 min, followed by 30 cycles of amplification (denaturation at 94 °C for 40 s, annealing at 56 °C for 1 min, and extension at 72 °C for 1 min), and a final extension at 72 °C for 10 min. PCR products underwent a quality check using a Nano-Drop ND-1000 Spectrophotometer (Nano-Drop Technologies Inc., Wilmington, DE, USA), were pooled at equal molar amounts for each soil sample (stored at −20 °C before the sequencing), and were subsequently subjected to the high-throughput sequencing of Illumina HiSeq. Due to the unsuccessful amplification of several samples, only 30 soil samples were ultimately subjected to 16S rRNA gene sequencing.
2.4. Bioinformatics Analysis of 16S rRNA Gene Sequencing Data
Paired-end reads were demultiplexed using sabre (https://github.com/najoshi/sabre; Accessed date: 10 December 2019) according to barcode sequences introduced during the PCR, resulting in two fastq files for each sample. Then, these fastq files were analyzed using the QIIME 2 workflow (version 2019.10) [56]. Briefly, paired-end reads were assembled using a VSEARCH algorithm before quality filtering (--p-min-quality = 4 and --p-max-ambiguous = 0) [57]. Then, assembled sequences were denoised using a deblur algorithm [58]. During the denoising, sequences underwent initial trimming to 235 base pairs, followed by a removal of the first 35 base pairs from the 5′ end, resulting in a final sequence length of 200 base pairs. Such an operation is aimed at mitigating the potential impacts of sequencing errors associated with longer sequences. Evidence has demonstrated that a sequence length of more than 90 base pairs is adequate for capturing the patterns of microbial composition and diversity between groups [59]. Amplicon sequence variants (ASVs) generated by the denoising were taxonomically annotated to the SILVA v13.8 [60] using a classify-sklearn algorithm. To reduce the likelihood of rare ASVs being artifacts of chance or sequencing error, we removed the ASVs that appeared only once across all samples, those that could not be annotated at the kingdom level, and those classified as mitochondria or chloroplast. Given the differences in sequencing depth among the samples, we rarefied sequence numbers to 8000 per sample, yielding 893 to 2064 ASVs across 30 soil samples. Finally, the ASVs were classified into three categories, in which those with an average relative abundance less than 0.0001% across all samples were defined as hyper-rare ASVs, those ranging from 0.0001% to 0.001% were classified as rare ASVs, and those greater than 0.001% were classified as abundant ASVs [61]. By applying such a classification strategy, we identified 4097, 4174, and 645 ASVs belonging to hyper-rare, rare, and abundant bacteria, respectively (Figure S1A). Hyper-rare ASVs were detected at 1 to 7 sampling sites, rare ASVs at 1 to 23 sites, and abundant ones at 1 to 30 sites (Figure S1A). The average relative abundance of hyper-rare ASVs ranged from 1.39 × 10⁻⁵% to 9.72 × 10⁻⁵%, rare ones ranged from 0.0001% to 0.001%, and abundant ones ranged from 0.001% to 0.053% (Figure S1B). By scrutinizing the numbers of hyper-rare, rare, and abundant ASVs in each sampling site, it was evident that all bacterial communities comprised many hyper-rare and rare ASVs, with only a few abundant ASVs (Figure S2). The Shannon–Wiener index and Bray–Curtis distance were calculated using the microeco R package v1.0.0 [62] at the ASV level. To calculate the functional redundancy of the community, the KEGG (Kyoto Encyclopedia of Genes and Genomes) [63] functional potentials of bacteria were predicted using the PICRUSt2 workflow v2.2.0-b [64], resulting in the copy numbers of KO (KEGG Orthology) for each ASV. The functional uniqueness (U) of bacterial communities based on the copy numbers of KO was calculated using the methods described in a previous study [65], and the functional redundancy (R) at the community level (the capability of a community to compensate for ecosystem function loss because of species loss) was inferred through the formula of R = 1 − U [65].
2.5. Statistical Analysis
The overall differences in soil properties were visualized using principal component analysis (PCA) and tested using the two-way and pairwise permutational multivariate analysis of variance (PERMANOVA) based on Euclidean distances. Differences in bacterial communities were visualized using a non-metric multidimensional scaling (NMDS) analysis and then tested using two-way and pairwise PERMANOVA based on Bray–Curtis distances. A clustering analysis based on Bray–Curtis distances was also performed for bacterial communities using the microeco R package v1.0.0 [62]. Individual soil properties, Shannon–Wiener index, and functional redundancy were compared using a non-parametric Wilcoxon rank sum test. This is because most of these metrics did not meet the hypothesis about normality and homogeneity of variance (Tables S1–S4). To identify those taxa highly contributing to community differences between NS and CS, or among three altitudes, we first performed a LEfSe (linear discriminant analysis effect size) analysis (p ≤ 0.01 and LDA score ≥ 4; no significant genus was identified under this criterion for hyper-rare bacterial communities) at the genus level. The reason we conducted a LEfSe analysis at the genus level is that it has greater biological significance and functional specificity, which allows for a better elucidation of the structure and function of microbial communities. The relative abundances of significant genera were visualized using the ggplot2 R packages v3.5.0 [66]. Then, ASVs belonging to each significant genus were extracted to infer their functions using the microeco R package v1.0.0 [62] with the FAPROTAX v1.2.4 database [67]. The numbers of ASVs that possessed known functions in each significant genus were visualized using the ggplot2 R package v3.5.0 [66]. The key factors impacting the Shannon–Wiener index and functional redundancy within NS and CS were identified using a Spearman rank correlation based on the psych R package v2.4.1. To identify those key factors impacting the bacterial community, we performed a redundancy analysis (RDA) based on Bray–Curtis distances. The relative contribution and associated significance of each soil property to community differences were estimated using the envfit() function of vegan R package v2.6.4. To estimate the contributions of hyper-rare, rare, and abundant subcommunities to the ecological characteristics of total soil bacterial communities, we correlated the Shannon–Wiener index, Bray–Curtis distance, and functional redundancy inferred from subcommunities to those from total communities using a Pearson correlation. All statistical analyses were performed in R v4.3.2.
3. Results
3.1. The Differences in Soil Properties between Natural and Cut Slope Soils, and among Altitudes
The PCA showed that there were significant differences in soil properties between NS and CS, and among altitudes (p < 0.05) (Figure S3, Table S5). The most significant differences in soil pH, CD, and -N were detected at 3102 m or 3194 m, while those of MC, ST, TOC, TN, and -N were detected at 3102 m. No significant differences were detected in TP or SAP between NS and CS (Figure S4). Generally, the soil pH, MC, and ST in CS were higher than those in NS, but the TOC, TN, and -N showed the opposite pattern, though several differences were non-significant; CD was significantly higher in CS than in NS at 3194 m; -N was less in CS than in NS at 2900 m and 3102 m, but the opposite pattern was detected at 3194 m (Figure S4). Regarding NS, the soil pH decreased with altitude; the maximal average values of MC and ST were detected at 2900 m, while the minimal were detected at 3102 m; the maximal CD and TN were detected at 3102 m, while the maximal -N was detected at 3194 m; the maximal -N was detected at 3102 m, and the minimal was detected at 3194 m; no significant differences were detected for TOC, SAP, or TP among altitudes (Figure S4). In CS, the soil pH, MC, and SAP showed an increase with altitude. Notably, no significant differences were detected between 3102 m and 3194 m for MC or between 2900 m and 3102 m for SAP. The ST declined with altitude, but no significant difference was detected between 3102 and 3194 m; the maximal CD and TP were detected at 3194 m; the maximal TOC, TN, -N and -N were detected at 2900 m or 3194 m, while the minimal were detected at 3102 m (Figure S4).
3.2. The Diversity Characteristics of Abundant, Rare and Hyper-Rare Bacteria
The Shannon–Wiener indices of total, abundant, and rare bacteria decreased with altitude in both NS and CS, but those of hyper-rare bacteria showed a “hump” altitude pattern, though several differences between altitudes were not statistically significant (Figure 1A). No significant differences in the Shannon–Wiener indices between NS and CS were detected for total, abundant, or rare bacteria at the three altitudes. Regarding hyper-rare bacteria, the Shannon–Wiener indices in CS were higher than those in NS at the three altitudes, especially at 2900 m and 3102 m (p < 0.05) (Figure 1A). -N (ρ ≥ 0.68, p < 0.01) showed the strongest correlation with the Shannon–Wiener indices of the total, abundant, and rare bacteria in NS. CD (ρ = 0.75, p < 0.01) showed the strongest correlation with the Shannon–Wiener index of hyper-rare bacteria, despite that TN (ρ = 0.73, p < 0.01) and -N (ρ = 0.64, p < 0.05) were also considerable (Figure S5). Regarding CS, MC (ρ ≤ −0.56, p < 0.05) showed the strongest correlation with the Shannon–Wiener indices of total and abundant bacteria, though TN (ρ = 0.75, p < 0.01) and soil pH (ρ = −0.72, p < 0.01) also strongly correlated with the Shannon–Wiener index of abundant bacteria (Figure S5); -N (ρ = −0.57, p < 0.05) showed the strongest correlation with the Shannon–Wiener index of hyper-rare bacteria, though SAP (ρ = −0.55, p < 0.05) and CD (ρ = −0.52, p < 0.05) were also considerable (Figure S5); there were no significant correlations between soil properties and the Shannon–Wiener index of rare bacteria (Figure S5). There was the strongest linear correlation between the Shannon–Wiener index of total bacteria and that of abundant bacteria in both NS (R = 0.94, p < 0.001) and CS (R = 0.97, p < 0.001), although this scenario was also considerable for rare bacteria (NS: R = 0.93, p < 0.001; CS: R = 0.86, p < 0.001) (Figure 1B). Instead, the correlation between the Shannon–Wiener index of total bacteria and that of hyper-rare ones was relatively weak (NS: R = 0.62, p < 0.05; CS: R = 0.71, p < 0.01) (Figure 1B).
3.3. The Community Characteristics of Abundant, Rare, and Hyper-Rare Bacteria
The Bray–Curtis distance clustering analysis revealed distinct groupings for the communities of total, abundant, rare, and hyper-rare bacteria (Figure S6A–D). NMDS showed similar results (Figure 2A–D and Figure S7). There were significant differences in community structure among altitudes within NS and CS, and between NS and CS at each altitude (Table S6). Community differences between NS and CS were greater at 3102 m and 3194 m compared to those observed at 2900 m. These scenarios were detected for total, abundant, rare, and hyper-rare bacteria (Figure 2A–D). The LEfSe analysis identified nine genera that significantly (p ≤ 0.01, LDA score ≥ 4) contributed to the community differences of total soil bacteria, along with eighteen and four genera that were highly influential in abundant and rare bacterial community differences, respectively (Figure S8). No significant genera were identified under the same criterion for the hyper-rare bacterial community. The genera identified from the abundant bacterial communities encompassed all those identified from the total soil bacterial communities, and the intersections showed highly similar changing patterns. For example, the relative abundances of Tychonema_CCAP_1459−11B, Nostoc_PCC−73102, Nitrososphaeraceae, and Flavobacterium were generally higher in CS. Instead, the relative abundance of Bradyrhizobium showed the opposite trend, being higher in NS than in CS (Figure 3A). The functional predictions for these significant genera showed that they were mainly involved in carbon and nitrogen cycling such as chemoheterotrophy, nitrification, and nitrogen fixation (Figure 3B).
The community structures of the total soil bacteria were more similar to those of abundant bacteria compared to those of hyper-rare and rare ones (Figure 2A–D). There were the strongest correlations between the Bray–Curtis distances of the total and abundant bacterial communities in NS (R = 1, p < 0.001) and CS (R = 0.98, p < 0.001), although these correlations were also considerable between the total and rare bacteria (NS: R = 0.97, p < 0.001; CS: R = 0.95, p < 0.001) (Figure S9). Instead, the correlation between the Bray–Curtis distance of the total and hyper-rare bacterial communities was relatively weak (NS: R = 0.82, p < 0.001; CS: R = 0.8, p < 0.001) (Figure S9). The RDA indicated that soil pH and -N strongly contributed to the community differences of the total, abundant, rare, and hyper-rare bacteria, especially the differences between NS and CS (Figure 4A–D and Figure S10). In NS, -N primarily contributed to the community shifts of total, abundant, rare, and hyper-rare bacteria across the altitude gradient (Figures S11A–D and S12A–D). In CS, SAP primarily contributed to the community shifts of the total, rare, and hyper-rare bacteria, while TN primarily contributed to those of the abundant bacteria across the altitude gradient (Figures S11E–H and S12E–H).
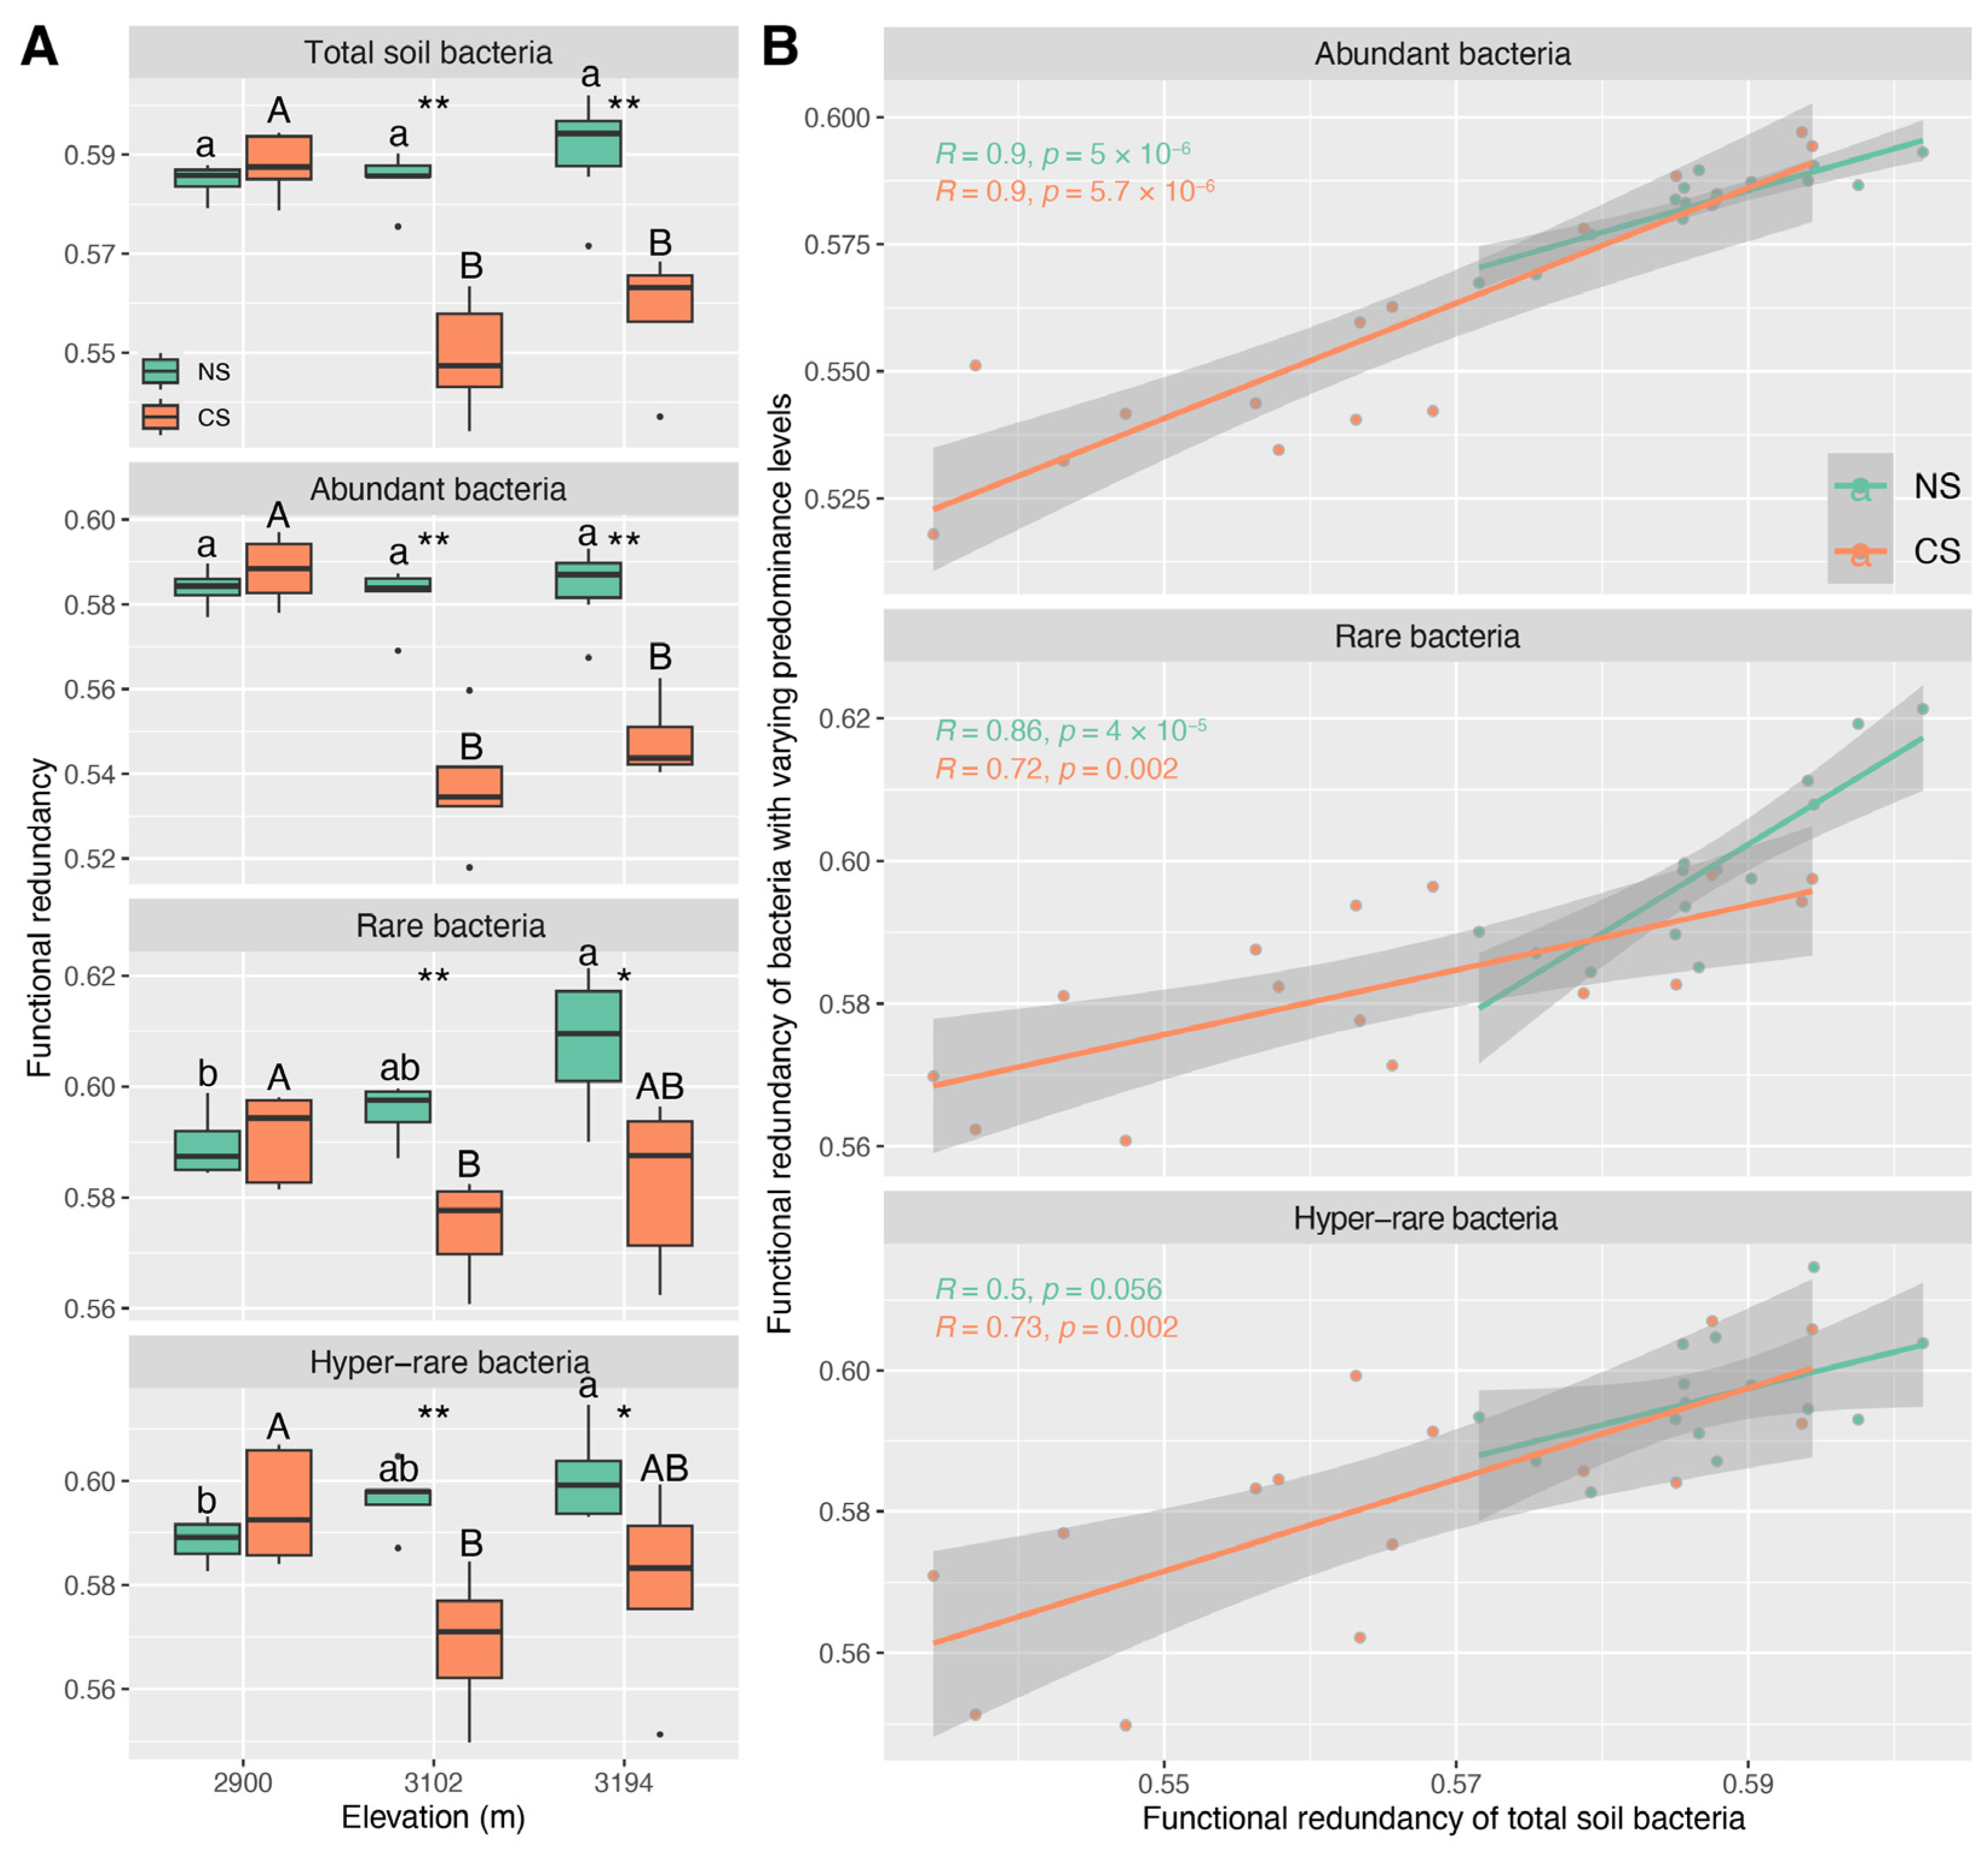
3.4. The Functional Redundancy Characteristics of Abundant, Rare, and Hyper-Rare Bacteria
Functional redundancies of total, abundant, rare, and hyper-rare bacterial communities in CS were lower than those in NS at 3102 m and 3094 m (Figure 5A). With the increase in altitude, the functional redundancies in NS showed an increasing pattern, but the increases were non-significant for the total and abundant bacterial communities (Figure 5A). The maximal functional redundancies were observed at 2900 m for the total, abundant, rare, and hyper-rare bacterial communities in CS, while they declined at 3102 m and 3194 m, especially 3102 m (Figure 5A). The altitude patterns of functional redundancy inferred from the total soil bacterial communities were predominantly evident in the communities of abundant bacteria, rather than those of rare and hyper-rare bacteria (Figure 5A,B). The CD (ρ ≤ −0.58, p < 0.05) showed the strongest correlation with the functional redundancy of the total, abundant, and rare bacterial communities in NS, but no significant correlation (p > 0.05) was detected for the hyper-rare bacterial community (Figure S13). In CS, the soil pH (ρ ≤ −0.61, p < 0.05), MC (ρ ≤ −0.58, p < 0.05) and TN (ρ ≥ 0.68, p < 0.01) were highly correlated with the functional redundancy of the total, abundant, rare, and hyper-rare communities (Figure S13).
4. Discussion
4.1. The Influences of Altitude and ESSS on the Communities Consisting of Bacteria with Varying Predominance Levels
It is reported that bacterial α-diversity declines with altitude in both natural subalpine forest soils and those subjected to ESSS [40]. Here, we detected the same scenarios for abundant and rare bacteria, though several differences were not statistically significant (Figure 1A). As a high microbial diversity can promote soil ecosystem function [68,69], this study highlights the significance of accounting for the altitude-induced effects on soil bacteria with varying predominance levels when implementing ESSS for cut slope restoration in subalpine forest ecosystems. This is also supported by the significant shifts in community structure with altitude in both natural and cut slope soils (Figure 2A–D). Evidence shows that abundant and rare bacteria are different in their response to environmental changes [35] and disturbances [36]. We found that the altitude patterns of abundant and rare bacterial α-diversities were very similar in natural and cut slope soils, and they differed from those of hyper-rare bacteria. Also, there were no significant differences in α-diversity between natural and cut slope soils for abundant and rare bacteria, but hyper-rare bacteria showed a significantly higher α-diversity in cut slope soils compared to natural soils at 2900 m and 3102 m (Figure 1A). We also detected similar altitudinal patterns in community structure and functional redundancy between rare and hyper-rare bacteria, contrasting with those of abundant bacteria (Figure 2B–D, Figure 4B–D and Figure 5A). These results are consistent with previous studies. For example, He et al. (2022) indicated that abundant and rare bacteria possess distinct shifting patterns of community structure in reforestation succession soils [70]. Zhang et al. (2023) also showed a similar scenario for abundant and rare bacteria in subalpine forest soils [35]. Overall, our findings demonstrate that bacteria with low predominance levels exhibit ecological characteristics distinct from those of bacteria with high predominance levels in both natural and cut slope soils. Given that both abundant and rare bacteria can contribute to ecosystem insurance [17], this study underscores the importance of categorizing total soil bacterial communities according to species predominance levels when assessing their responses to environmental changes and disturbance, in both natural subalpine forest soils and those subjected to ESSS.
Interestingly, we detected an increase in the functional redundancy of total, abundant, rare, and hyper-rare bacteria with altitude in natural soils, though several differences were not statistically significant (Figure 5A). This seems to contradict the findings regarding α-diversity in natural soils, as the stability of ecosystem functions with increasing microbial diversity is often considered an empirical indication of functional redundancy [71]. A possible explanation is that the selections with increasing altitude probably resulted in fewer species capable of adaptation and survivals, but these species may assume more functions to maintain ecosystem stability and functionality. Yet, this inference still needs to be verified in future studies. Notably, we observed that the functional redundancies of total, abundant, rare, and hyper-rare bacteria in cut slope soils were lower at higher altitudes (3102 m and 3194 m), and they were also significantly lower than those in natural soils at these altitudes (Figure 5A). As a high functional redundancy could offset the functional loss caused by species loss [72,73], our findings imply that implementing ESSS for cut slope restoration at high altitudes probably causes greater disturbances to naïve subalpine forest ecosystems. Such an inference is also supported by differences in the communities of total, abundant, and rare bacteria between natural and cut slope soils. For instance, the relative abundances of genera Bradyrhizobium, SC-I-84, mle1-7, IS-44, and Bryobacter were lower in cut slope soils compared to natural soils, particularly at 3102 m and 3194 m (Figure 3A). This may deplete biogeochemical processes such as nitrogen fixation, dark hydrogen oxidation, and chemoheterotrophy (Figure 3B). Additionally, we detected an enrichment of several genera with similar functions in cut slope soils, for example, Nostoc_PCC−73102, Blastococcus, Flavobacterium, and Arenimonas, suggesting their potentially key roles in compensating for the functions of depleted bacteria (Figure 3B).
4.2. Potential Roles of Bacteria with Varying Predominance Levels in Maintaining the Ecological Characteristics of Total Community across the Altitude Gradient
We found that α-diversity, community structure, and functional redundancy inferred from the total bacterial community showed the strongest correlation with those from the abundant bacterial community in both natural and cut slope soils (Figure 1B, Figure 5B and Figure S9). This implies that abundant species play a key role in maintaining the ecological characteristics of the total soil bacterial community across altitude gradients. Previous studies indicate that rare species are the key contributors to microbial diversity [35,74], since rare microbial species possess a great genetic diversity and a substantial amount of metabolically active lineages, making them key contributors to microbial diversity [18,75]. In this study, the α-diversity of the total bacterial community in both natural and cut slope soils were mainly characterized by the communities of abundant bacteria rather than those of rare and hyper-rare ones (Figure 1A). This does not suggest that our findings are contradictory to the previous notion, as we also detected higher diversities for rare and hyper-rare bacteria than those for abundant ones at nearly all altitudes in both natural and cut slope soils (Figure 1A). This is in line with that reported by Zhang et al. (2023) in a subalpine forest ecosystem [35], suggesting a critical role of rare species in maintaining locally bacterial diversity. Evidence indicates that rare species have greater functional importance and can assume or supplement functions carried out by other abundant ones [17,76,77], thereby providing functional redundancy or insurance for a community. In the present study, we also observed higher functional redundancies for rare and hyper-rare bacteria than those for abundant ones at nearly all altitudes in both natural and cut slope soils (Figure 5A). This is consistent with a previous study [78], and also suggests a critical role of rare species in maintaining locally functional redundancy. However, evaluating the roles of bacteria with varying predominance levels in maintaining the regional characteristics of the total community across the altitude gradient may yield different outcomes. Evidence shows that abundant bacterial communities tend to remain relatively stable in response to environmental changes and disturbances [18], whereas rare ones are unevenly distributed and more susceptible to local extinctions [18,79]. Under such a scenario, the environments shaped by biotic and abiotic factors at each altitude might have favored or enriched bacteria with high fitness, allowing them to occupy a core niche position. As a result, we detected a relatively substantial contribution of abundant bacteria in maintaining the altitude patterns of total soil bacterial α-diversity, community structure, and functional redundancy. In summary, these findings suggest that abundant bacteria play an important role in maintaining the regional characteristics of the total soil bacterial community, whereas rare or hyper-rare ones probably contribute to the diversity and functional redundancy of local communities in both natural subalpine forest soils and those subjected to ESSS.
4.3. Shared Key Driving Factors Result in Similar Ecological Characteristics for the Communities of Total Soil Bacteria and Abundant Ones across the Altitude Gradient
Evidence indicates that nitrogen content can significantly regulate bacterial diversity [80,81]. In the present study, we found that -N showed the strongest positive correlation with the α-diversities inferred from total, abundant, and rare bacteria in natural soils (Figure S5), mostly because -N is a critical nutrient and electron acceptor for microbes [82]. However, the α-diversity of hyper-rare bacteria showed the strongest positive correlation with soil conductivity rather than -N. This can somewhat explain why the altitudinal patterns of α-diversity were similar among total, abundant, and rare bacteria, and why they differed from those of hyper-rare bacteria in natural soils. It is reported that soil conductivity is closely related to salinity and cation exchange capacity [83], suggesting a high sensitivity of hyper-rare α-diversity to soil salinity and cation exchange capacity rather than -N content in our study areas. A similar scenario for -N also seemed to be applicable for the community structures of total, abundant, rare, and hyper-rare bacteria in natural soils (Figure S12A–D). However, -N alone cannot fully account for the differences between the abundant bacterial community and rare/hyper-rare ones. This is likely because the abundant bacterial communities were also strongly impacted by TN, while the rare/hyper-rare bacterial communities were additionally affected by ST (Figure S12B–D). Nevertheless, these findings imply that -N may be a key factor in shaping the altitude pattern of bacteria with varying predominance levels in natural subalpine forest soils. Although our recent studies have revealed the importance of nitrogen content in regulating the altitude pattern of soil bacteria in the same areas [1,40], it is still surprising that the impacts of -N on soil bacterial community can be extended to species with an average relative abundance as low as 0.0001% (rare bacteria), and even below 0.0001% (hyper-rare bacteria) in natural soils. This is because soil pH has been reported as the key factor in many studies [84,85,86], and it has also been observed that abundant and rare bacteria respond differently to the same environmental changes in forest ecosystems [35,36]. We found that soil conductivity was the most critical factor impacting the functional redundancies inferred from the communities of total and abundant bacteria, and both soil conductivity and pH were influential for rare ones (Figure S13). Such a result could explain the similar altitude patterns of functional redundancy inferred from total and abundant bacteria in natural soils (Figure 5A,B). Regarding soils subjected to ESSS, we found that the effects of -N content and soil conductivity on the α-diversity, community structure, and functional redundancy inferred from total, abundant, rare, and hyper-rare bacteria were relatively weak or not statistically significant (Figures S5, S12E–H and S13). A possible explanation is that ESSS might have introduced additional selections on bacteria [37], such as soil pH (Figure 4 and Figure S10). This implies that ESSS can disrupt the predictability of soil bacteria with varying predominance in natural subalpine forest ecosystem, highlighting a necessity to concern the impacts of ESSS on soil microbiota during the restoration of cut slopes. Nevertheless, a similar altitude pattern still tended to share the same key driving factor in cut slope soils, e.g., MC for total and abundant bacterial α-diversity (Figure S5).
5. Conclusions
By partitioning total bacterial communities based on the predominance of ASVs, this study revealed the altitude patterns of soil bacteria with varying predominance levels in natural subalpine forest soils and those subjected to ESSS. We found that bacteria with relatively high predominance levels tended to possess altitude patterns (α-diversity, community structure, and functional redundancy) similar to those possessed by total soil bacteria in both natural subalpine forest soils and those subjected to ESSS. Instead, bacteria with relatively low predominance levels tended to possess altitude patterns distinguished from those of relatively predominant ones. Abundant bacteria might play key roles in maintaining the regional ecological characteristics of total community across altitude gradients, while the rare and hyper-rare ones might contribute more to local diversity and functional redundancy. The high similarities in the α-diversity and community structure of total and abundant bacteria were mainly shaped by -N, while those in functional redundancy were mainly shaped by soil conductivity in natural soils. Yet, the influences of -N on the altitude patterns of α-diversity and community structure, and those of conductivity on functional redundancy, were remarkably weak in soils subjected to ESSS. This study examined the roles of abundant and rare species in maintaining the altitude-induced ecological patterns of the bacterial community in both natural subalpine forest soils and those subjected to ESSS, providing novel insights for devising strategies to conserve biodiversity and ecologically restore soils disturbed by infrastructure construction in vulnerable high-altitude subalpine forest ecosystems.
Supplementary Materials
The following supporting information can be downloaded at: https://www.mdpi.com/article/10.3390/d16040242/s1. Figure S1: The distributions of amplicon sequence variants (ASVs) with varying average relative abundances in 30 soil samples, and the average relative abundances (RB) of abundant (RB ≥ 0.001%), rare (0.0001% ≤ RB < 0.001%) and hyper-rare (RB < 0.0001%) bacteria; Figure S2: The ASV numbers of abundant (RB ≥ 0.001%), rare (0.0001% ≤ RB < 0.001%) and hyper-rare (RB < 0.0001%) bacteria in soils sampled from 2900 m, 3102 m and 3194 m; Figure S3: A principal component analysis showing the overall difference in soil properties; Figure S4: Soil properties in natural and cut slope soils; Figure S5: A heatmap showing the Spearman correlations between soil properties and the Shannon-Wiener indices of total, abundant (RB ≥ 0.001%), rare (0.0001% ≤ RB < 0.001%) and hyper-rare (RB < 0.0001%) bacteria; Figure S6: Bray-Curtis distance-based clustering analysis for total, abundant (RB ≥ 0.001%), rare (0.0001% ≤ RB < 0.001%) and hyper-rare (RB < 0.0001%) bacterial communities; Figure S7: The Sheppard Plot along with the Bray-Curtis distance-based non-metric multidimensional scaling analysis shown in Figure 2; Figure S8: Differential genera identified by the LEfSe analysis; Figure S9: The relationships between the Bray-Curtis distances of total bacterial communities and those of abundant (RB ≥ 0.001%), rare (0.0001% ≤ RB < 0.001%) and hyper-rare (RB < 0.0001%) ones; Figure S10: The relative contributions of individual soil property to the community differences of total, abundant (RB ≥ 0.001%), rare (0.0001% ≤ RB < 0.001%) and hyper-rare (RB < 0.0001%) bacteria; Figure S11: Bray-Curtis distance-based redundancy analysis for the communities of total, abundant (RB ≥ 0.001%), rare (0.0001% ≤ RB < 0.001%) and hyper-rare (RB < 0.0001%) bacteria in natural and cut slope soils; Figure S12: The relative contributions of individual soil property to the community differences of total, abundant (RB ≥ 0.001%), rare (0.0001% ≤ RB < 0.001%) and hyper-rare (RB < 0.0001%) bacteria in natural and cut slope soils; Figure S13: A heatmap showing the Spearman correlations between soil properties and the functional redundancy of total, abundant (RB ≥ 0.001%), rare (0.0001% ≤ RB < 0.001%) and hyper-rare (RB < 0.0001%) bacteria; Table S1: Shapiro-Wilk test of normality for soil properties; Table S2: Bartlett test of homogeneity of variances for soil properties; Table S3: Shapiro-Wilk test of normality, and Bartlett test of homogeneity of variances for Shannon-Wiener index; Table S4: Shapiro-Wilk test of normality, and Bartlett test of homogeneity of variances for functional redundancy; Table S5: Two-way and pairwise permutational multivariate analysis of variance (PERMANOVA) based on Euclidean distances for soil properties; Table S6: The two-way and pairwise permutational multivariate analysis of variance (PERMANOVA) based on Bray-Curtis distances for bacterial communities.
Author Contributions
C.L., H.L. and Y.J. conceived the ideas, designed the methodology, and wrote the manuscript. D.L. revised the manuscript and contributed to the discussion. All authors have read and agreed to the published version of the manuscript.
Funding
This research was funded by Sichuan Science and Technology Program (2023NSFSC0755, 2023ZYD0102, 2022NSFSC1175) and the Scientific Research Initiation Project of Mianyang Normal University (QD2021A23, QD2021A37, QD2023A01).
Institutional Review Board Statement
Not applicable.
Data Availability Statement
Raw reads are available in the Microbiome Database with an accession number of PRJ-AMPLI-074e63a809e72441a04a6d770af8e5bf (http://egcloud.cib.cn).
Acknowledgments
The authors thank the supporter of this project and the referees for their constructive comments.
Conflicts of Interest
The authors declare no conflicts of interest.
References
- Liao, H.; Sheng, M.; Liu, J.; Ai, X.; Li, C.; Ai, S.; Ai, Y. Soil N availability drives the shifts of enzyme activity and microbial phosphorus limitation in the artificial soil on cut slope in southwestern China. Environ. Sci. Pollut. Res. 2021, 28, 33307–33319. [Google Scholar] [CrossRef] [PubMed]
- Grêt Regamey, A.; Weibel, B. Global assessment of mountain ecosystem services using earth observation data. Ecosyst. Serv. 2020, 46, 101213. [Google Scholar] [CrossRef]
- Beniston, M. Climatic change in mountain regions: A review of possible impacts. Clim. Change 2003, 59, 5–31. [Google Scholar] [CrossRef]
- Fusaro, C.; Sarria Guzmán, Y.; Chávez Romero, Y.A.; Luna Guido, M.; Muñoz Arenas, L.C.; Dendooven, L.; Estrada Torres, A.; Navarro Noya, Y.E. Land use is the main driver of soil organic carbon spatial distribution in a high mountain ecosystem. PeerJ 2019, 7, e7897. [Google Scholar] [CrossRef] [PubMed]
- Forman, R.T.T. Estimate of the area affected ecologically by the road system in the United States. Conserv. Biol. 2000, 14, 31–35. [Google Scholar] [CrossRef]
- Banerjee, P.; Ghose, M.K.; Pradhan, R. Analytic hierarchy process based spatial biodiversity impact assessment model of highway broadening in Sikkim Himalaya. Geocarto Int. 2020, 35, 470–493. [Google Scholar] [CrossRef]
- Van Der Ree, R.; Smith, D.J.; Grilo, C. The ecological effects of linear infrastructure and traffic: Challenges and opportunities of rapid global growth. In Handbook of Road Ecology; John Wiley & Sons, Ltd.: Hoboken, NJ, USA, 2015; pp. 1–9. [Google Scholar]
- Xu, H.; Li, T.B.; Chen, J.N.; Liu, C.N.; Zhou, X.h.; Xia, L. Characteristics and applications of ecological soil substrate for rocky slope vegetation in cold and high-altitude areas. Sci. Total Environ. 2017, 609, 446–455. [Google Scholar] [CrossRef]
- Ai, S.; Chen, J.; Gao, D.; Ai, Y. Distribution patterns and drivers of artificial soil bacterial community on cut-slopes in alpine mountain area of southwest China. Catena 2020, 194, 104695. [Google Scholar] [CrossRef]
- Fu, D.; Yang, H.; Wang, L.; Yang, S.; Li, R.; Zhang, W.; Ai, X.; Ai, Y. Vegetation and soil nutrient restoration of cut slopes using outside soil spray seeding in the plateau region of southwestern China. J. Environ. Manag. 2018, 228, 47–54. [Google Scholar] [CrossRef]
- Xiao, H.; Huang, J.; Ma, Q.; Wan, J.; Li, L.; Peng, Q.; Rezaeimalek, S. Experimental study on the soil mixture to promote vegetation for slope protection and landslide prevention. Landslides 2017, 14, 287–297. [Google Scholar] [CrossRef]
- Zhong, Y.; Liu, J.; Jia, X.; Shangguan, Z.; Wang, R.; Yan, W. Microbial community assembly and metabolic function during wheat straw decomposition under different nitrogen fertilization treatments. Biol. Fertil. Soils 2020, 56, 697–710. [Google Scholar] [CrossRef]
- Thiele Bruhn, S.; Bloem, J.; de Vries, F.T.; Kalbitz, K.; Wagg, C. Linking soil biodiversity and agricultural soil management. Curr. Opin. Environ. Sustain. 2012, 4, 523–528. [Google Scholar] [CrossRef]
- Rocca, J.D.; Simonin, M.; Bernhardt, E.S.; Washburne, A.D.; Wright, J.P. Rare microbial taxa emerge when communities collide: Freshwater and marine microbiome responses to experimental mixing. Ecology 2020, 101, e02956. [Google Scholar] [CrossRef] [PubMed]
- Liang, Y.; Xiao, X.; Nuccio, E.E.; Yuan, M.; Zhang, N.; Xue, K.; Cohan, F.M.; Zhou, J.; Sun, B. Differentiation strategies of soil rare and abundant microbial taxa in response to changing climatic regimes. Environ. Microbiol. 2020, 22, 1327–1340. [Google Scholar] [CrossRef] [PubMed]
- Jiao, S.; Lu, Y. Abundant fungi adapt to broader environmental gradients than rare fungi in agricultural fields. Glob. Change Biol. 2020, 26, 4506–4520. [Google Scholar] [CrossRef] [PubMed]
- Kurm, V.; Geisen, S.; Gera Hol, W.H. A low proportion of rare bacterial taxa responds to abiotic changes compared with dominant taxa. Environ. Microbiol. 2019, 21, 750–758. [Google Scholar] [CrossRef] [PubMed]
- Jiao, S.; Wang, J.; Wei, G.; Chen, W.; Lu, Y. Dominant role of abundant rather than rare bacterial taxa in maintaining agro-soil microbiomes under environmental disturbances. Chemosphere 2019, 235, 248–259. [Google Scholar] [CrossRef] [PubMed]
- Pedrós Alió, C. The rare bacterial biosphere. Annu. Rev. Mar. Sci. 2012, 4, 449–466. [Google Scholar] [CrossRef] [PubMed]
- McGill, B.J.; Etienne, R.S.; Gray, J.S.; Alonso, D.; Anderson, M.J.; Benecha, H.K.; Dornelas, M.; Enquist, B.J.; Green, J.L.; He, F.; et al. Species abundance distributions: Moving beyond single prediction theories to integration within an ecological framework. Ecol. Lett. 2007, 10, 995–1015. [Google Scholar] [CrossRef]
- Sogin, M.L.; Morrison, H.G.; Huber, J.A.; Welch, D.M.; Huse, S.M.; Neal, P.R.; Arrieta, J.M.; Herndl, G.J. Microbial diversity in the deep sea and the underexplored “rare biosphere”. Proc. Natl. Acad. Sci. USA 2006, 103, 12115–12120. [Google Scholar] [CrossRef]
- Xu, L.; Cao, H.; Li, C.; Wang, C.; He, N.; Hu, S.; Yao, M.; Wang, C.; Wang, J.; Zhou, S. The importance of rare versus abundant phoD-harboring subcommunities in driving soil alkaline phosphatase activity and available P content in Chinese steppe ecosystems. Soil Biol. Biochem. 2022, 164, 108491. [Google Scholar] [CrossRef]
- Xu, L.; Zhu, B.; Li, C.; Zhou, Z.; Yao, M.; Zhou, X.; Wang, J.; Zhang, B.; Li, X. Increasing relative abundance of non-cyanobacterial photosynthetic organisms drives ecosystem multifunctionality during the succession of biological soil crusts. Geoderma 2021, 395, 115052. [Google Scholar] [CrossRef]
- Xu, L.; Zhang, B.; Wang, E.; Zhu, B.; Yao, M.; Li, C.; Li, X. Soil total organic carbon/total nitrogen ratio as a key driver deterministically shapes diazotrophic community assemblages during the succession of biological soil crusts. Soil Ecol. Lett. 2021, 3, 328–341. [Google Scholar] [CrossRef]
- Treplin, M.; Pennings, S.C.; Zimmer, M. Decomposition of leaf litter in a US saltmarsh is driven by dominant species, not species complementarity. Wetlands 2013, 33, 83–89. [Google Scholar] [CrossRef]
- Cottrell, M.T.; David, K.L. Contribution of major bacterial groups to bacterial biomass production (thymidine and leucine incorporation) in the Delaware estuary. Limnol. Oceanogr. 2003, 48, 168–178. [Google Scholar] [CrossRef]
- Jousset, A.; Bienhold, C.; Chatzinotas, A.; Gallien, L.; Gobet, A.; Kurm, V.; Küsel, K.; Rillig, M.C.; Rivett, D.W.; Salles, J.F. Where less may be more: How the rare biosphere pulls ecosystems strings. ISME J. 2017, 11, 853–862. [Google Scholar] [CrossRef] [PubMed]
- Jia, X.; Dini Andreote, F.; Salles, J.F. Community assembly processes of the microbial rare biosphere. Trends Microbiol. 2018, 26, 738–747. [Google Scholar] [CrossRef] [PubMed]
- Shu, D.; Guo, Y.; Zhang, B.; Zhang, C.; Van Nostrand, J.D.; Lin, Y.; Zhou, J.; Wei, G. Rare prokaryotic sub-communities dominate the complexity of ecological networks and soil multinutrient cycling during long-term secondary succession in China’s Loess Plateau. Sci. Total Environ. 2021, 774, 145737. [Google Scholar] [CrossRef] [PubMed]
- Chen, Q.L.; Ding, J.; Zhu, D.; Hu, H.W.; Delgado Baquerizo, M.; Ma, Y.B.; He, J.Z.; Zhu, Y.G. Rare microbial taxa as the major drivers of ecosystem multifunctionality in long-term fertilized soils. Soil Biol. Biochem. 2020, 141, 107686. [Google Scholar] [CrossRef]
- Zhao, K.; Kong, W.; Wang, F.; Long, X.E.; Guo, C.; Yue, L.; Yao, H.; Dong, X. Desert and steppe soils exhibit lower autotrophic microbial abundance but higher atmospheric CO2 fixation capacity than meadow soils. Soil Biol. Biochem. 2018, 127, 230–238. [Google Scholar] [CrossRef]
- Wang, X.; Zhou, L.; Fu, Y.; Jiang, Z.; Jia, S.; Song, B.; Liu, D.; Zhou, X. Drought-induced changes in rare microbial community promoted contribution of microbial necromass C to SOC in a subtropical forest. Soil Biol. Biochem. 2024, 189, 109252. [Google Scholar] [CrossRef]
- Philippot, L.; Spor, A.; Hénault, C.; Bru, D.; Bizouard, F.; Jones, C.M.; Sarr, A.; Maron, P.-A. Loss in microbial diversity affects nitrogen cycling in soil. ISME J. 2013, 7, 1609–1619. [Google Scholar] [CrossRef] [PubMed]
- Pester, M.; Bittner, N.; Deevong, P.; Wagner, M.; Loy, A. A ‘rare biosphere’microorganism contributes to sulfate reduction in a peatland. ISME J. 2010, 4, 1591–1602. [Google Scholar] [CrossRef]
- Zhang, X.; Zhao, W.; Kou, Y.; Fang, K.; Liu, Y.; He, H.; Liu, Q. The contrasting responses of abundant and rare microbial community structures and co-occurrence networks to secondary forest succession in the subalpine region. Front. Microbiol. 2023, 14, 1177239. [Google Scholar] [CrossRef]
- He, J.; Tan, X.; Nie, Y.; Ma, L.; Liu, J.; Lu, X.; Mo, J.; Leloup, J.; Nunan, N.; Ye, Q. Distinct responses of abundant and rare soil bacteria to nitrogen addition in tropical forest soils. Microbiol. Spectr. 2023, 11, e03003–e03022. [Google Scholar] [CrossRef]
- Liao, H.; Li, C.; Ai, S.; Li, X.; Ai, X.; Ai, Y. A simulated ecological restoration of bare cut slope reveals the dosage and temporal effects of cement on ecosystem multifunctionality in a mountain ecosystem. J. Environ. Manag. 2023, 325, 116672. [Google Scholar] [CrossRef]
- Ai, X.; Wang, L.; Xu, D.; Rong, J.; Ai, S.; Liu, S.; Li, C.; Ai, Y. Stability of artificial soil aggregates for cut slope restoration: A case study from the subalpine zone of southwest China. Soil Tillage Res. 2021, 209, 104934. [Google Scholar] [CrossRef]
- Zhu, M.; Yang, S.; Ai, S.; Ai, X.; Jiang, X.; Chen, J.; Li, R.; Ai, Y. Artificial soil nutrient, aggregate stability and soil quality index of restored cut slopes along altitude gradient in southwest China. Chemosphere 2020, 246, 125687. [Google Scholar] [CrossRef]
- Liao, H.; Li, C.; Ai, Y.; Li, X. Soil bacterial responses to disturbance are enlarged by altitude in a mountain ecosystem. J. Soils Sediments 2023, 23, 3820–3831. [Google Scholar] [CrossRef]
- Zhu, B.; Li, C.; Wang, J.; Li, J.; Li, X. Elevation rather than season determines the assembly and co-occurrence patterns of soil bacterial communities in forest ecosystems of Mount Gongga. Appl. Microbiol. Biotechnol. 2020, 104, 7589–7602. [Google Scholar] [CrossRef]
- Sun, F.; Lü, Y.; Wang, J.; Hu, J.; Fu, B. Soil moisture dynamics of typical ecosystems in response to precipitation: A monitoring-based analysis of hydrological service in the Qilian Mountains. Catena 2015, 129, 63–75. [Google Scholar] [CrossRef]
- Kou, Y.; Liu, Y.; Li, J.; Li, C.; Tu, B.; Yao, M.; Li, X. Patterns and drivers of nirK-type and nirS-type denitrifier community assembly along an elevation gradient. mSystems 2021, 6, e00667-21. [Google Scholar] [CrossRef] [PubMed]
- Li, J.; Shen, Z.; Li, C.; Kou, Y.; Wang, Y.; Tu, B.; Zhang, S.; Li, X. Stair-step pattern of soil bacterial diversity mainly driven by pH and vegetation types along the elevational gradients of Gongga Mountain, China. Front. Microbiol. 2018, 9, 569. [Google Scholar] [CrossRef]
- Chang, E.H.; Chen, T.H.; Tian, G.; Chiu, C.Y. The effect of altitudinal gradient on soil microbial community activity and structure in moso bamboo plantations. Appl. Soil Ecol. 2016, 98, 213–220. [Google Scholar] [CrossRef]
- Rui, J.; Zhao, Y.; Cong, N.; Wang, F.; Liu, X. Elevational distribution and seasonal dynamics of alpine soil prokaryotic communities. Front. Microbiol. 2023, 14, 1280011. [Google Scholar] [CrossRef]
- Zhang, Z.; Yuan, Y.; Zhao, W.; He, H.; Li, D.; He, W.; Liu, Q.; Yin, H. Seasonal variations in the soil amino acid pool and flux following the conversion of a natural forest to a pine plantation on the eastern Tibetan Plateau, China. Soil Biol. Biochem. 2017, 105, 1–11. [Google Scholar] [CrossRef]
- Ren, C.; Zhao, F.; Kang, D.; Yang, G.; Han, X.; Tong, X.; Feng, Y.; Ren, G. Linkages of C:N:P stoichiometry and bacterial community in soil following afforestation of former farmland. For. Ecol. Manag. 2016, 376, 59–66. [Google Scholar] [CrossRef]
- Bao, S. Soil and Agricultural Chemistry Analysis; China Agriculture Press: Beijing, China, 2000. [Google Scholar]
- Nelson, D.W.; Sommers, L.E. Total Carbon, Organic Carbon, and Organic Matter. In Methods of Soil Analysis; Soil Science Society of America, American Society of Agronomy: Madison, WI, USA, 1996; pp. 961–1010. [Google Scholar] [CrossRef]
- Bremner, J.M. Total Nitrogen. In Methods of Soil Analysis: Part 2. Chemical and Micro-Biological Properties; Black, C.A., Evans, D.D., Dinauer, R.C., Eds.; American Society of Agronomy, Soil Science Society of America: Madison, WI, USA, 1965; pp. 1149–1178. [Google Scholar] [CrossRef]
- Wang, Y.; Li, C.; Kou, Y.; Wang, J.; Tu, B.; Li, H.; Li, X.; Wang, C.; Yao, M. Soil pH is a major driver of soil diazotrophic community assembly in Qinghai-Tibet alpine meadows. Soil Biol. Biochem. 2017, 115, 547–555. [Google Scholar] [CrossRef]
- Kisand, A. Distribution of sediment phosphorus fractions in hypertrophic strongly stratified Lake Verevi. Hydrobiologia 2005, 547, 33–39. [Google Scholar] [CrossRef]
- Olsen, S.R. Estimation of Available Phosphorus in Soils by Extraction with Sodium Bicarbonate; U.S. Department of Agriculture: Washington, DC, USA, 1954.
- Tamaki, H.; Wright, C.L.; Li, X.; Lin, Q.; Hwang, C.; Wang, S.; Thimmapuram, J.; Kamagata, Y.; Liu, W.-T. Analysis of 16S rRNA amplicon sequencing options on the Roche/454 next-generation titanium sequencing platform. PLoS ONE 2011, 6, e25263. [Google Scholar] [CrossRef]
- Bolyen, E.; Rideout, J.R.; Dillon, M.R.; Bokulich, N.A.; Abnet, C.C.; Al-Ghalith, G.A.; Alexander, H.; Alm, E.J.; Arumugam, M.; Asnicar, F. Reproducible, interactive, scalable and extensible microbiome data science using QIIME 2. Nat. Biotechnol. 2019, 37, 852–857. [Google Scholar] [CrossRef] [PubMed]
- Rognes, T.; Flouri, T.; Nichols, B.; Quince, C.; Mahé, F. VSEARCH: A versatile open source tool for metagenomics. PeerJ 2016, 4, e2584. [Google Scholar] [CrossRef] [PubMed]
- Amir, A.; McDonald, D.; Navas Molina, J.A.; Kopylova, E.; Morton, J.T.; Zech Xu, Z.; Kightley, E.P.; Thompson, L.R.; Hyde, E.R.; Gonzalez, A. Deblur rapidly resolves single-nucleotide community sequence patterns. mSystems 2017, 2. [Google Scholar] [CrossRef] [PubMed]
- Thompson, L.R.; Sanders, J.G.; McDonald, D.; Amir, A.; Ladau, J.; Locey, K.J.; Prill, R.J.; Tripathi, A.; Gibbons, S.M.; Ackermann, G. A communal catalogue reveals Earth’s multiscale microbial diversity. Nature 2017, 551, 457–463. [Google Scholar] [CrossRef] [PubMed]
- Quast, C.; Pruesse, E.; Yilmaz, P.; Gerken, J.; Schweer, T.; Yarza, P.; Peplies, J.; Glöckner, F.O. The SILVA ribosomal RNA gene database project: Improved data processing and web-based tools. Nucleic Acids Res. 2012, 41, D590–D596. [Google Scholar] [CrossRef] [PubMed]
- Galand, P.E.; Casamayor, E.O.; Kirchman, D.L.; Lovejoy, C. Ecology of the rare microbial biosphere of the Arctic Ocean. Proc. Natl. Acad. Sci. USA 2009, 106, 22427–22432. [Google Scholar] [CrossRef] [PubMed]
- Liu, C.; Cui, Y.; Li, X.; Yao, M. microeco: An R package for data mining in microbial community ecology. FEMS Microbiol. Ecol. 2021, 97, fiaa255. [Google Scholar] [CrossRef] [PubMed]
- Kanehisa, M.; Goto, S. KEGG: Kyoto encyclopedia of genes and genomes. Nucleic Acids Res. 2000, 28, 27–30. [Google Scholar] [CrossRef] [PubMed]
- Douglas, G.M.; Maffei, V.J.; Zaneveld, J.; Yurgel, S.N.; Brown, J.R.; Taylor, C.M.; Huttenhower, C.; Langille, M.G.I. PICRUSt2: An improved and customizable approach for metagenome inference. bioRxiv 2020. [Google Scholar] [CrossRef]
- Ricotta, C.; de Bello, F.; Moretti, M.; Caccianiga, M.; Cerabolini, B.E.L.; Pavoine, S. Measuring the functional redundancy of biological communities: A quantitative guide. Methods Ecol. Evol. 2016, 7, 1386–1395. [Google Scholar] [CrossRef]
- Wickham, H. ggplot2: Elegant graphics for data analysis; Springer: Berlin/Heidelberg, Germany, 2016. [Google Scholar]
- Louca, S.; Parfrey, L.W.; Doebeli, M. Decoupling function and taxonomy in the global ocean microbiome. Science 2016, 353, 1272–1277. [Google Scholar] [CrossRef]
- Eisenhauer, N.; Hines, J.; Maestre, F.T.; Rillig, M.C. Reconsidering functional redundancy in biodiversity research. NPJ Biodivers. 2023, 2, 9. [Google Scholar] [CrossRef]
- Maron, P.A.; Sarr, A.; Kaisermann, A.; Lévêque, J.; Mathieu, O.; Guigue, J.; Karimi, B.; Bernard, L.; Dequiedt, S.; Terrat, S. High microbial diversity promotes soil ecosystem functioning. Appl. Environ. Microbiol. 2018, 84, e02738-17. [Google Scholar] [CrossRef] [PubMed]
- He, Z.; Liu, D.; Shi, Y.; Wu, X.; Dai, Y.; Shang, Y.; Peng, J.; Cui, Z. Broader environmental adaptation of rare rather than abundant bacteria in reforestation succession soil. Sci. Total Environ. 2022, 828, 154364. [Google Scholar] [CrossRef] [PubMed]
- Royalty, T.M.; Steen, A.D. A quantitative measure of functional redundancy in microbial ecosystems. bioRxiv 2020. [Google Scholar] [CrossRef]
- Li, Y.; Ge, Y.; Wang, J.; Shen, C.; Wang, J.; Liu, Y.J. Functional redundancy and specific taxa modulate the contribution of prokaryotic diversity and composition to multifunctionality. Mol. Ecol. 2021, 30, 2915–2930. [Google Scholar] [CrossRef] [PubMed]
- Biggs, C.R.; Yeager, L.A.; Bolser, D.G.; Bonsell, C.; Dichiera, A.M.; Hou, Z.; Keyser, S.R.; Khursigara, A.J.; Lu, K.; Muth, A.F. Does functional redundancy affect ecological stability and resilience? A review and meta-analysis. Ecosphere 2020, 11, e03184. [Google Scholar] [CrossRef]
- Lynch, M.D.J.; Neufeld, J.D. Ecology and exploration of the rare biosphere. Nat. Rev. Microbiol. 2015, 13, 217–229. [Google Scholar] [CrossRef] [PubMed]
- Jiao, S.; Chen, W.; Wei, G. Biogeography and ecological diversity patterns of rare and abundant bacteria in oil-contaminated soils. Mol. Ecol. 2017, 26, 5305–5317. [Google Scholar] [CrossRef] [PubMed]
- Kearns, P.J.; Holloway, D.; Angell, J.H.; Feinman, S.G.; Bowen, J.L. Effect of short-term, diel changes in environmental conditions on active microbial communities in a salt marsh pond. Aquat. Microb. Ecol. 2017, 80, 29–41. [Google Scholar] [CrossRef]
- Campbell, B.J.; Yu, L.; Heidelberg, J.F.; Kirchman, D.L. Activity of abundant and rare bacteria in a coastal ocean. Proc. Natl. Acad. Sci. USA 2011, 108, 12776–12781. [Google Scholar] [CrossRef]
- Zhao, Y.; Lin, H.; Zhang, W. Abundant bacteria shaped by deterministic processes have a high abundance of potential antibiotic resistance genes in a plateau river sediment. Front. Microbiol. 2022, 13, 977037. [Google Scholar] [CrossRef]
- Lennon, J.T.; Jones, S.E. Microbial seed banks: The ecological and evolutionary implications of dormancy. Nat. Rev. Microbiol. 2011, 9, 119–130. [Google Scholar] [CrossRef] [PubMed]
- Xu, Y.F.; Dong, X.M.; Luo, C.; Ma, S.N.; Xu, J.L.; Cui, Y.D. Nitrogen enrichment reduces the diversity of bacteria and alters their nutrient strategies in intertidal zones. Front. Mar. Sci. 2022, 9, 942074. [Google Scholar] [CrossRef]
- Wang, C.; Liu, D.; Bai, E. Decreasing soil microbial diversity is associated with decreasing microbial biomass under nitrogen addition. Soil Biol. Biochem. 2018, 120, 126–133. [Google Scholar] [CrossRef]
- Xu, M.; Zhang, Q.; Xia, C.; Zhong, Y.; Sun, G.; Guo, J.; Yuan, T.; Zhou, J.; He, Z. Elevated nitrate enriches microbial functional genes for potential bioremediation of complexly contaminated sediments. ISME J. 2014, 8, 1932–1944. [Google Scholar] [CrossRef] [PubMed]
- Smith, J.L.; Halvorson, J.J.; Bolton, H., Jr. Soil properties and microbial activity across a 500 m elevation gradient in a semi-arid environment. Soil Biol. Biochem. 2002, 34, 1749–1757. [Google Scholar] [CrossRef]
- Cho, H.; Tripathi, B.M.; Moroenyane, I.; Takahashi, K.; Kerfahi, D.; Dong, K.; Adams, J.M. Soil pH rather than elevation determines bacterial phylogenetic community assembly on Mt. Norikura. FEMS Microbiol. Ecol. 2019, 95, fiy216. [Google Scholar] [CrossRef] [PubMed]
- Xu, M.; Li, X.; Cai, X.; Gai, J.; Li, X.; Christie, P.; Zhang, J. Soil microbial community structure and activity along a montane elevational gradient on the Tibetan Plateau. Eur. J. Soil Biol. 2014, 64, 6–14. [Google Scholar] [CrossRef]
- Shen, C.; Xiong, J.; Zhang, H.; Feng, Y.; Lin, X.; Li, X.; Liang, W.; Chu, H. Soil pH drives the spatial distribution of bacterial communities along elevation on Changbai Mountain. Soil Biol. Biochem. 2013, 57, 204–211. [Google Scholar] [CrossRef]
Figure 1.
Shannon–Wiener indices of total, abundant (RB ≥ 0.001%), rare (0.0001% ≤ RB < 0.001%), and hyper-rare (RB < 0.0001%) bacteria in natural (NS) and cut slope (CS) soils (A). The relationships between Shannon–Wiener indices of total soil bacteria and those of abundant, rare, and hyper-rare ones (B). Asterisks in figure (A) represent significant differences between NS and CS at an altitude (* p < 0.05). Lowercase and uppercase letters in figure (A) denote the significance of differences among altitudes within NS and CS, respectively, and it indicates no significant difference (p < 0.05) between two groups if they share the same letter. R-values and p-values in figure (B) represent Pearson correlation coefficients and their associated significance. RB: average relative abundance.
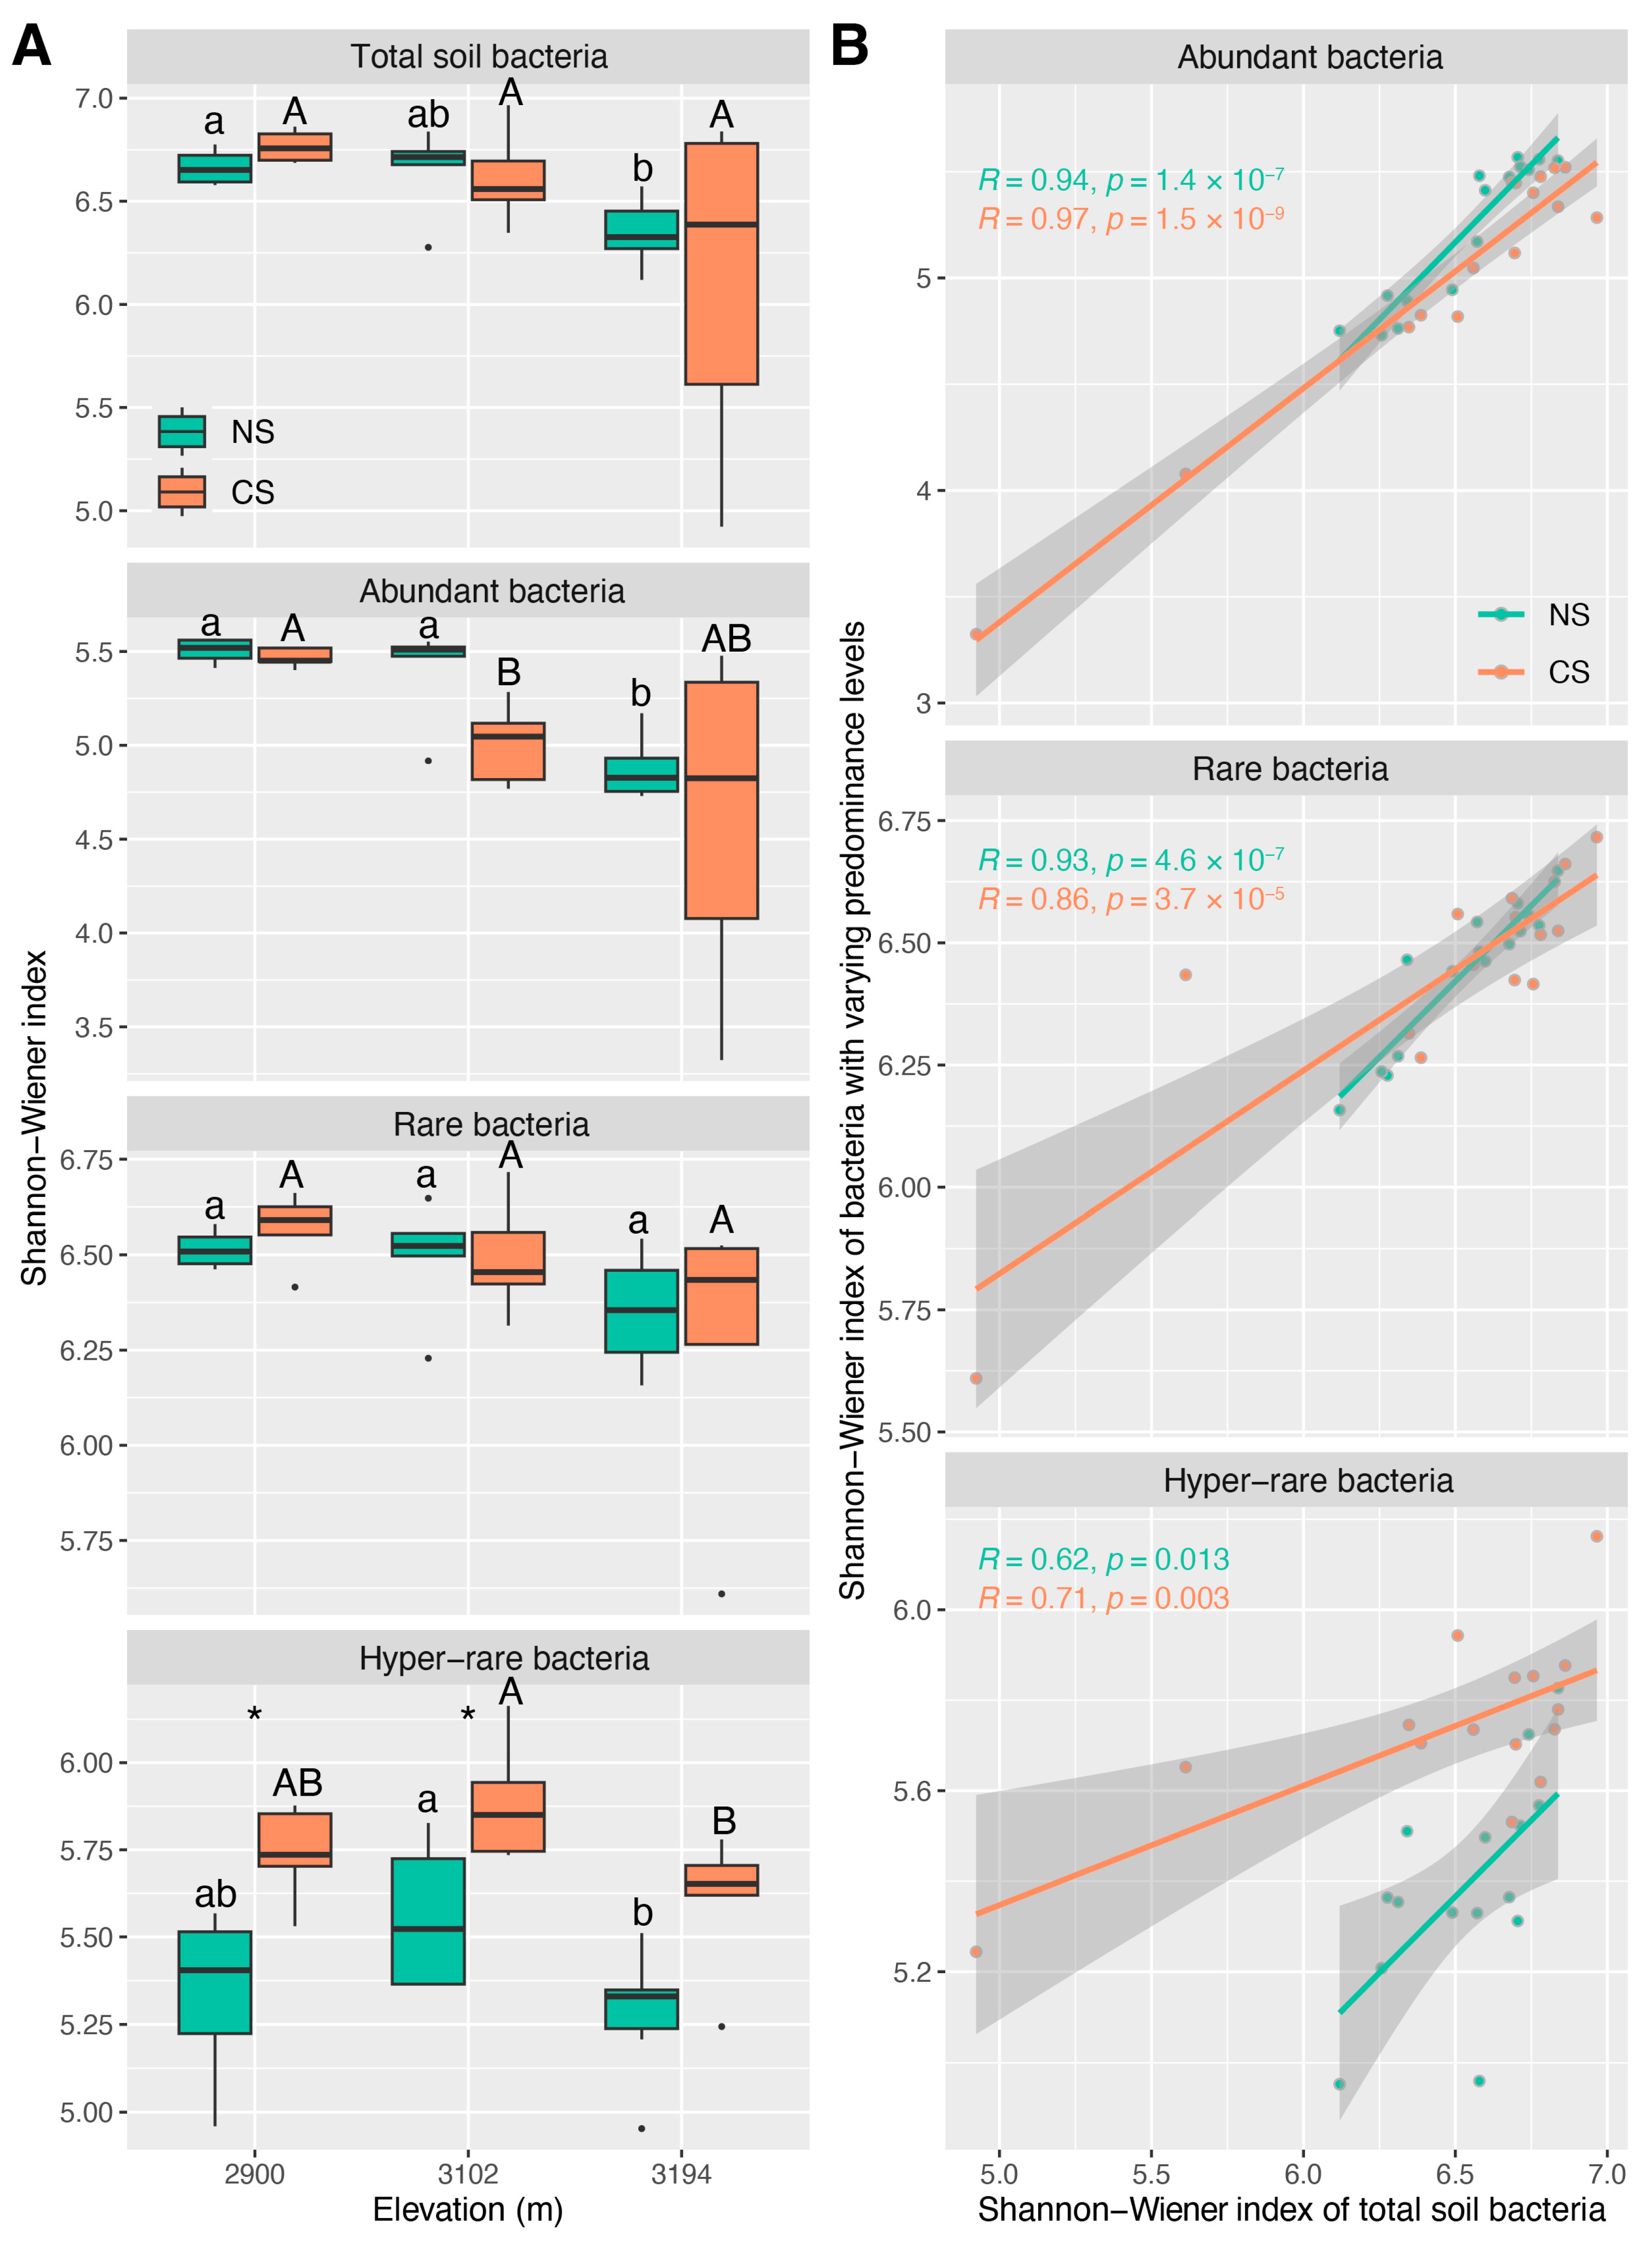
Figure 2.
Bray–Curtis-distance-based non-metric multidimensional scaling (NMDS) analysis for the communities of total (A), abundant (RB ≥ 0.001%) (B), rare (0.0001% ≤ RB < 0.001%) (C), and hyper-rare (RB < 0.0001%) (D) bacteria. NS: natural soils; CS: cut slope soils; RB: average relative abundance.
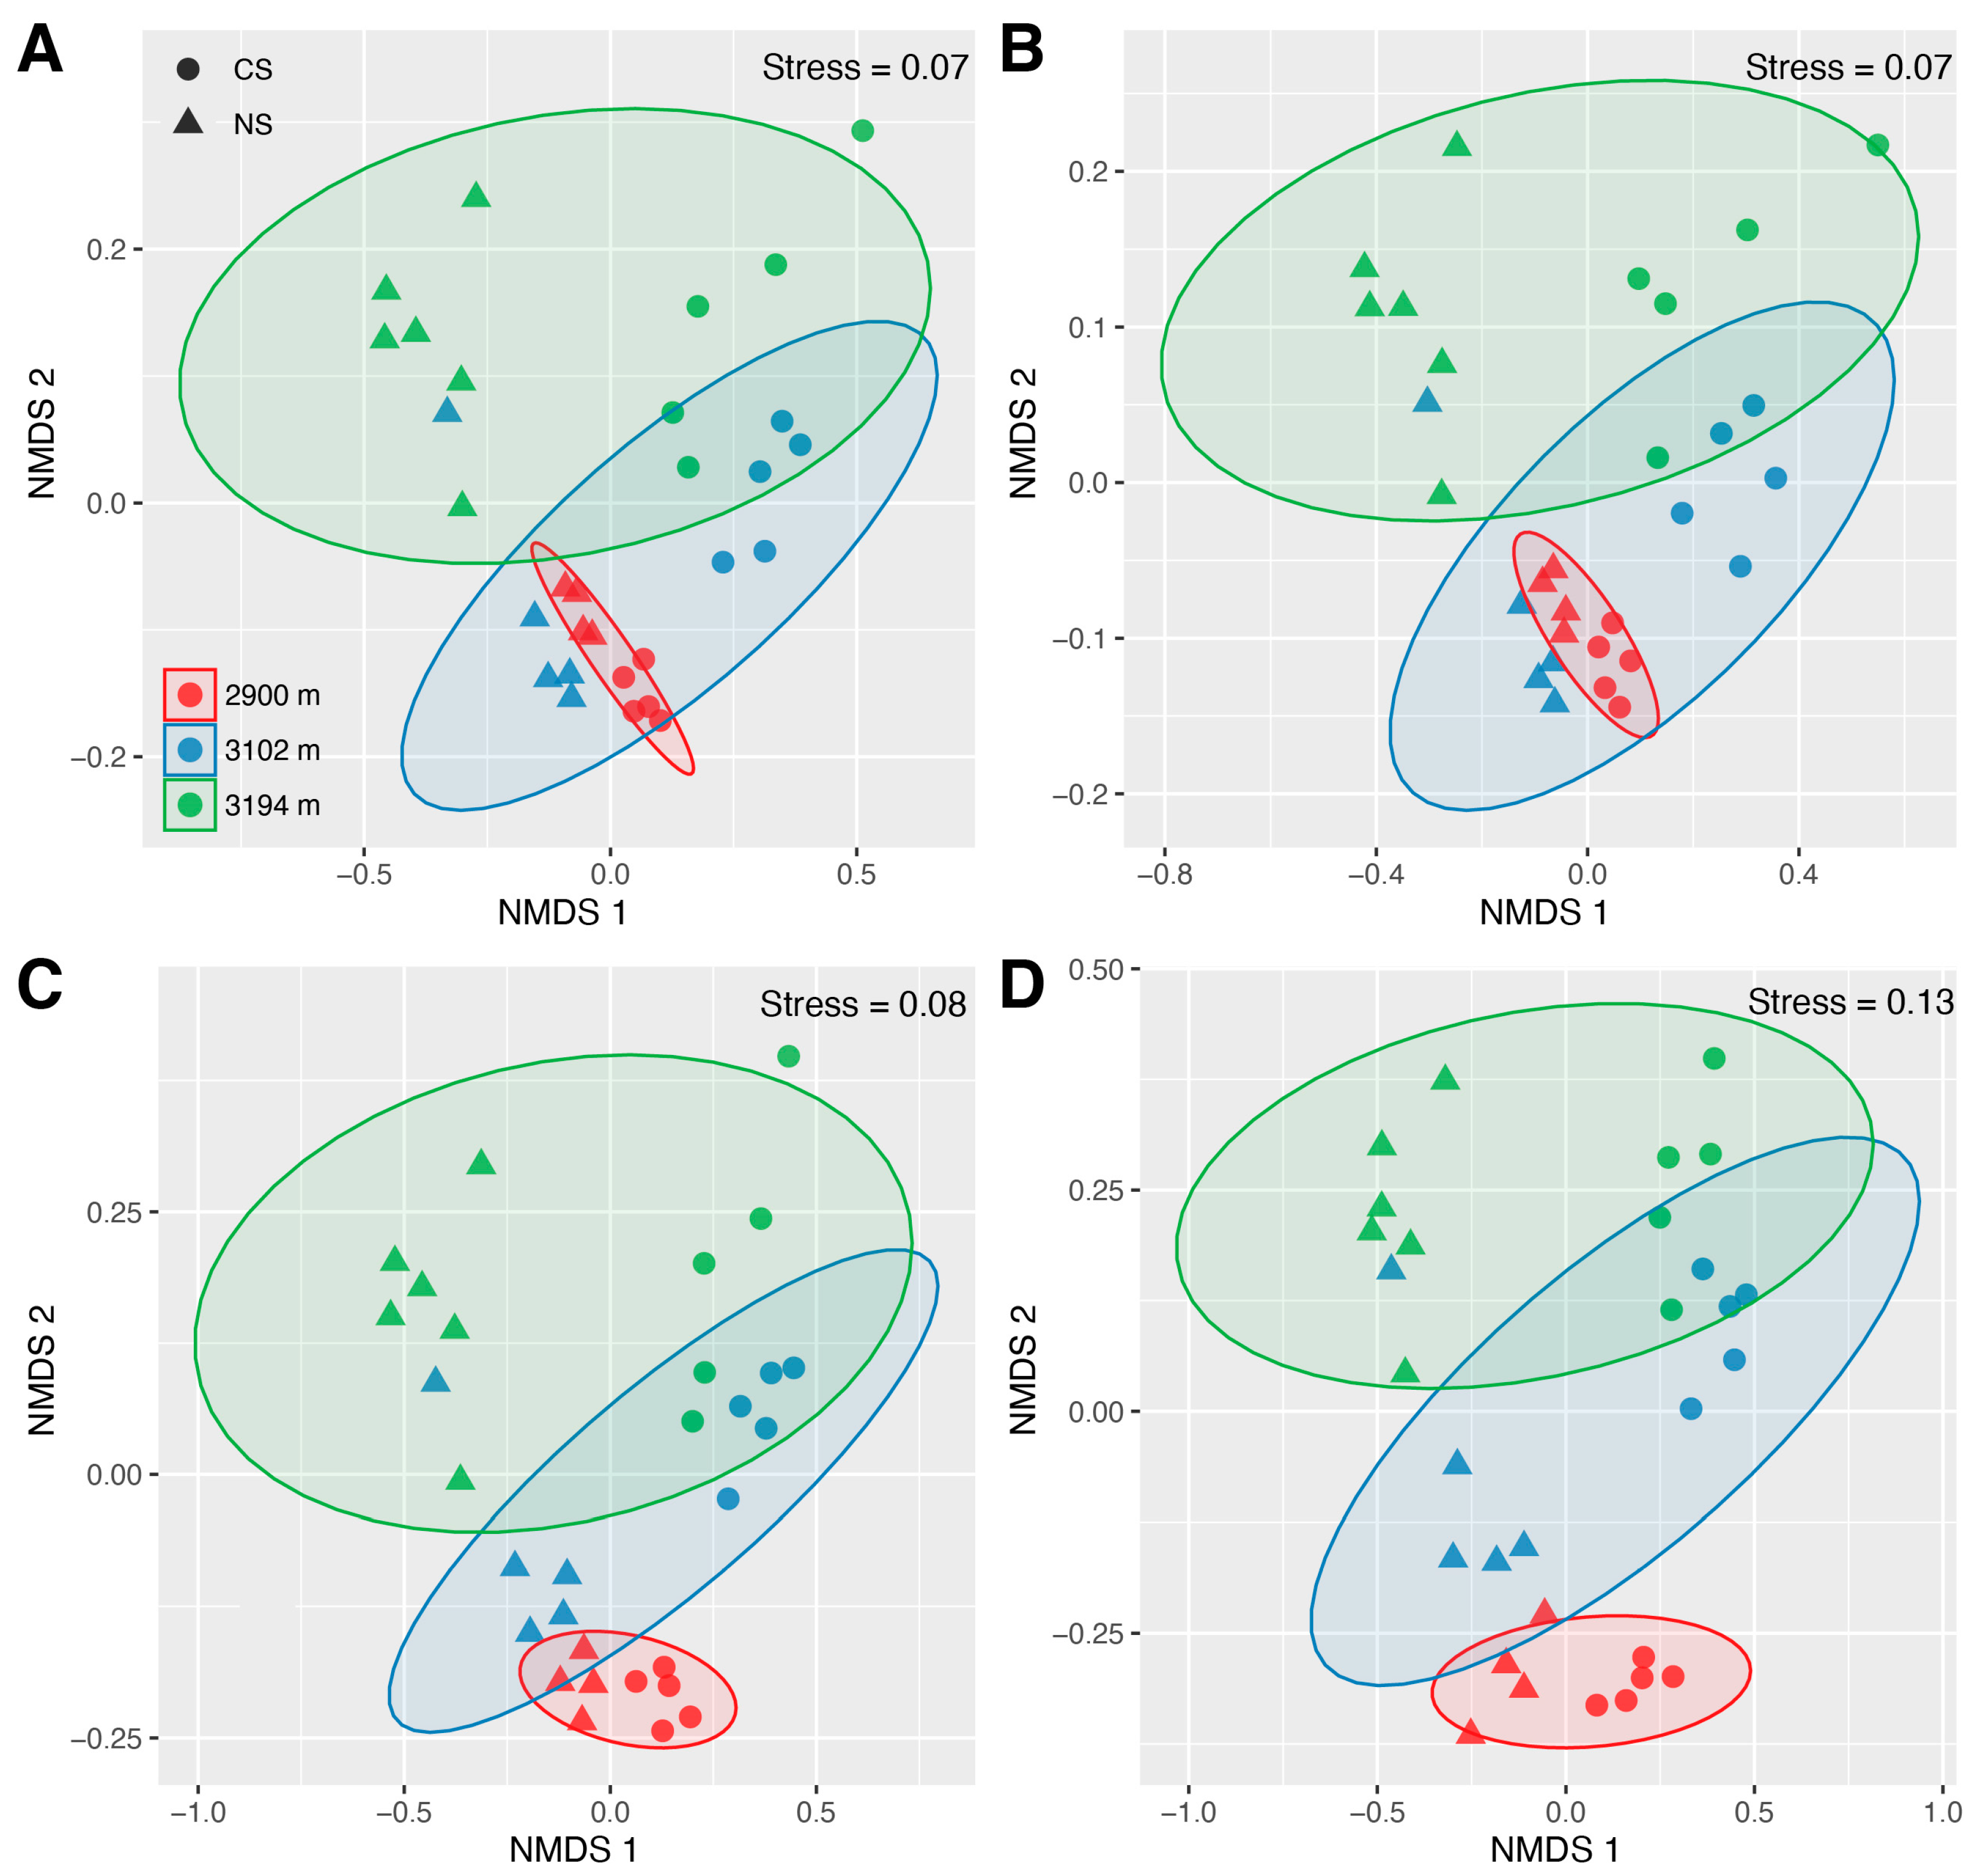
Figure 3.
Shifts in the relative abundance of differential genera identified by LEfSe analysis for total, abundant (RB ≥ 0.001%), and rare (0.0001% ≤ RB < 0.001%) bacteria (A). The FAPROTAX functions of differential genera (B). Relative abundance values in figure (A) were normalized using log() function in R base package. Numbers within square brackets in figure (A) represent the ASV count associated with each differential genus. Numbers in cells of figure (B) represent the ASV count for each differential genus possessing a particular function (e.g., the Bryobacter possessing 38 ASVs with chemoheterotrophy). Figure (B) only shows differential genera with a known function. NS: natural soils; CS: cut slope soils; RB: average relative abundance; CC: carbon cycling; NC: nitrogen cycling.
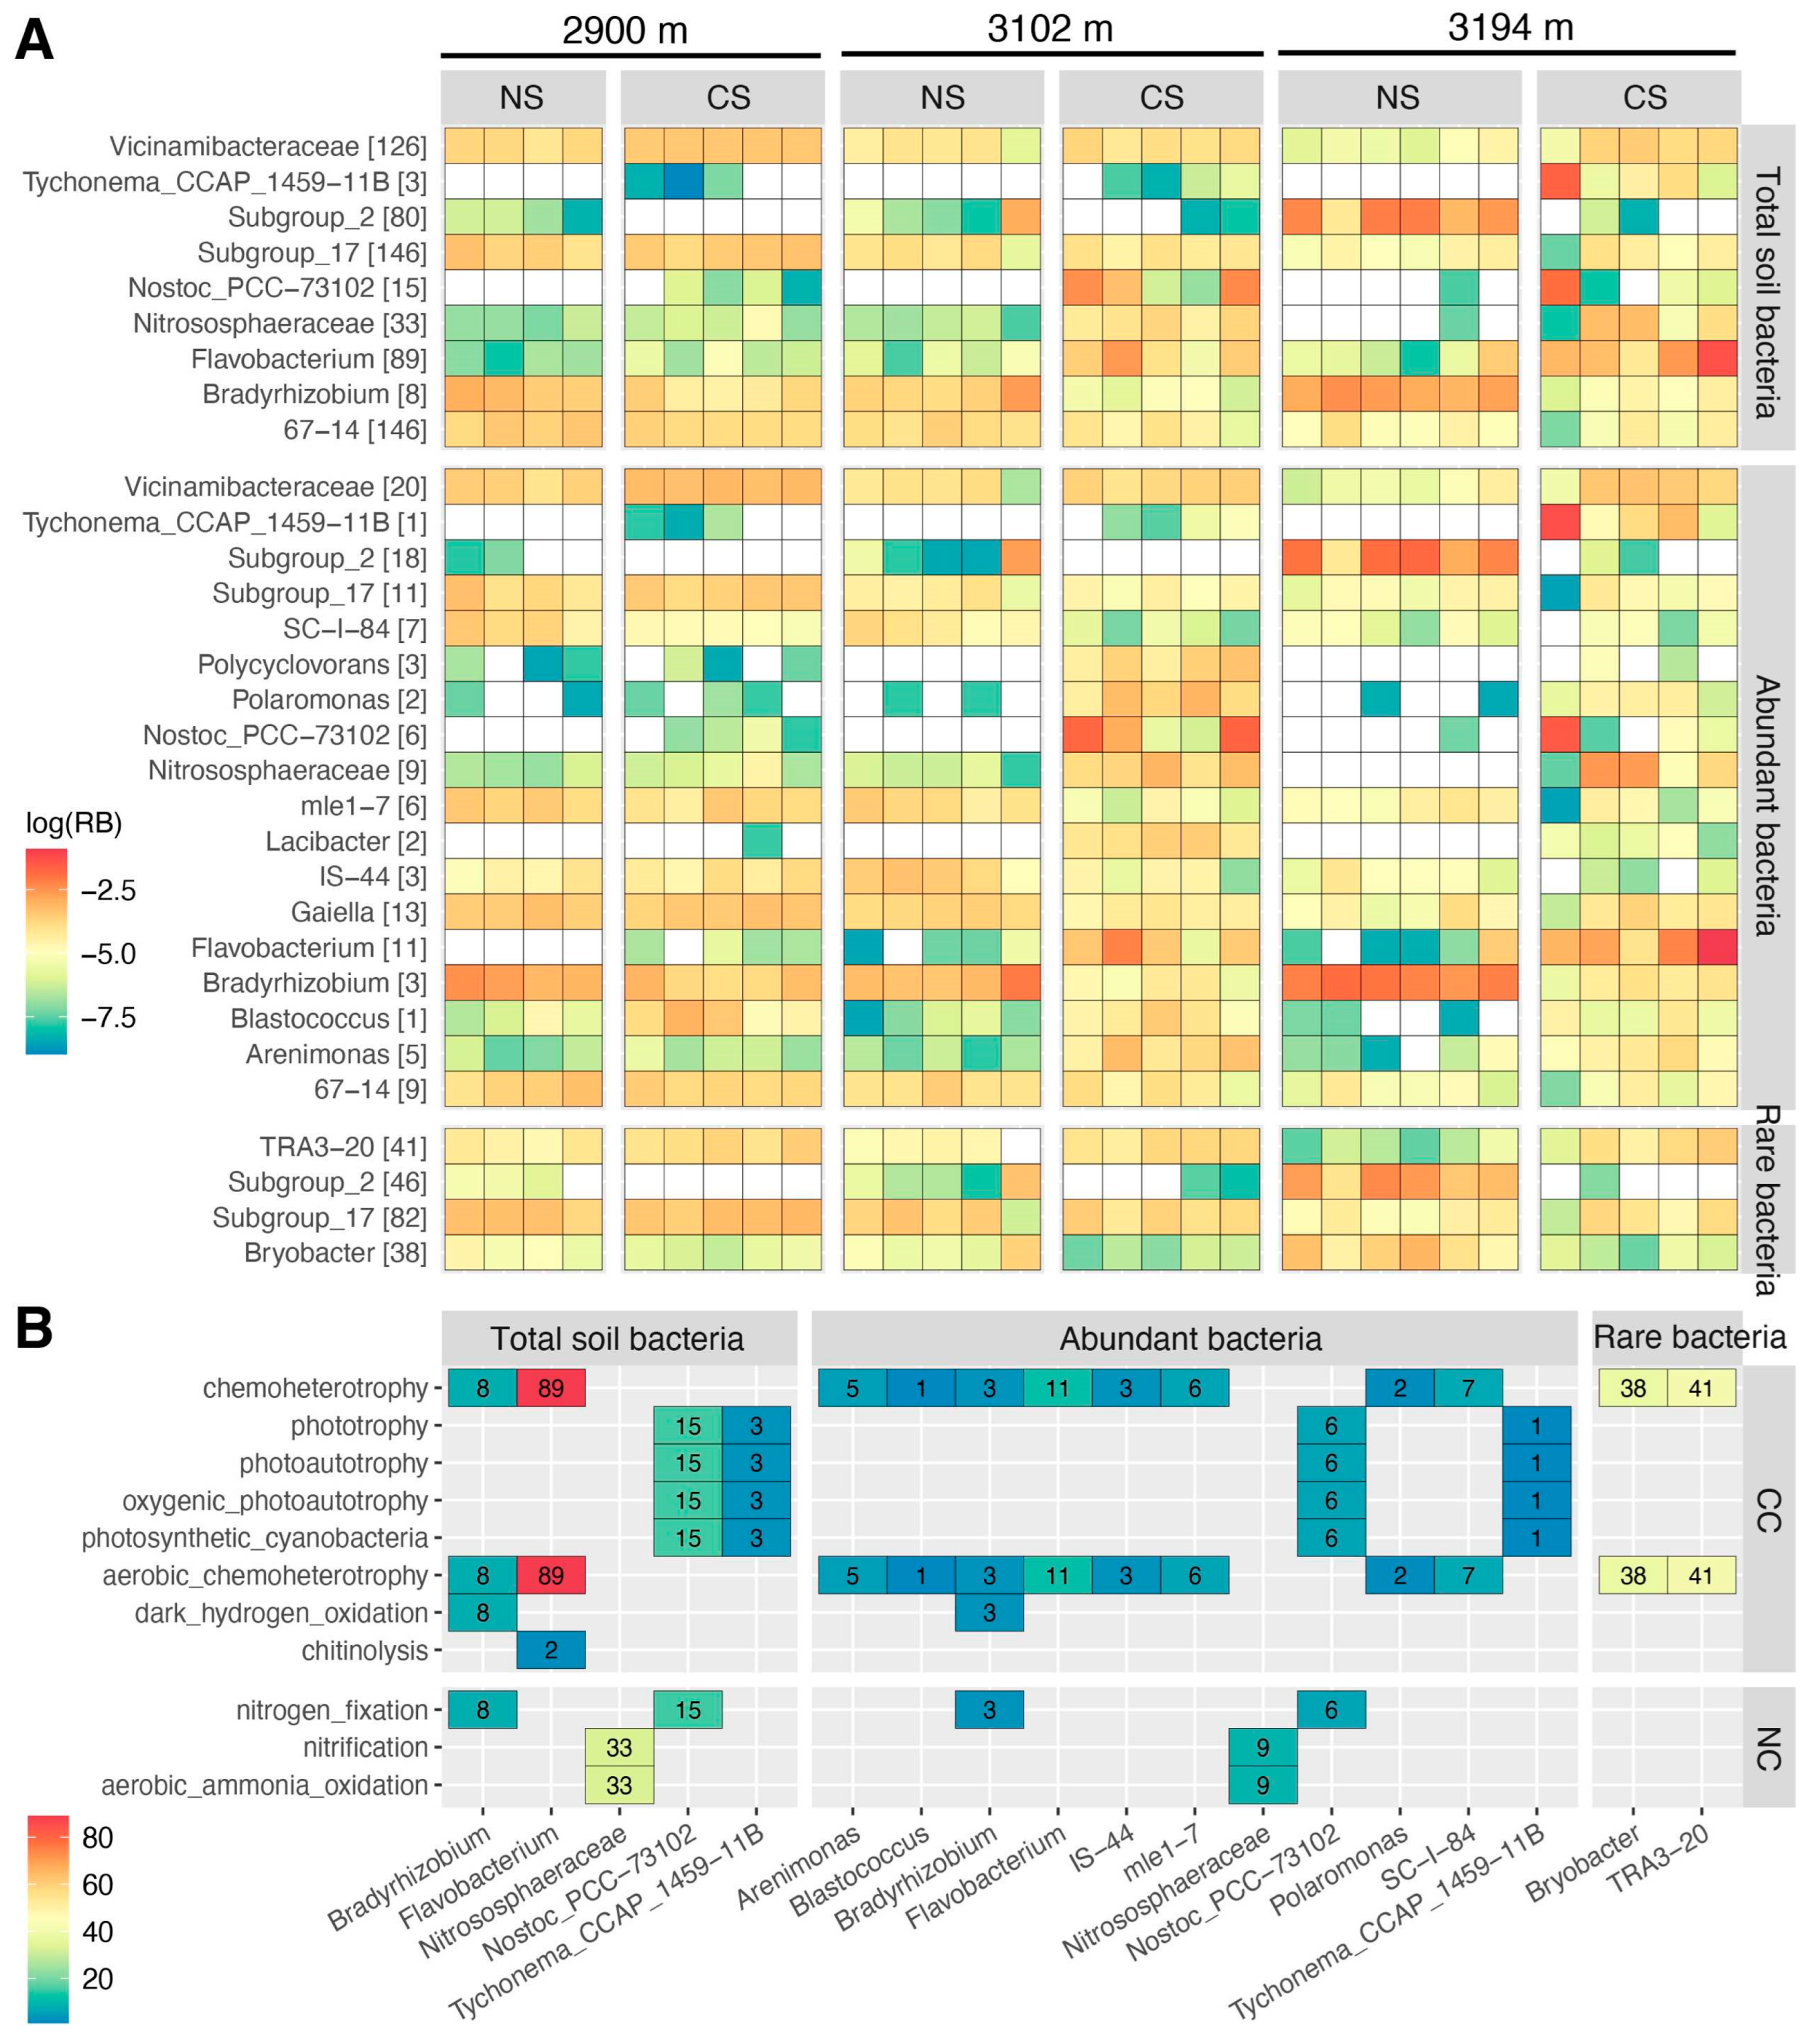
Figure 4.
Bray–Curtis-distance-based redundancy analysis (RDA) for the communities of total (A), abundant (RB ≥ 0.001%) (B), rare (0.0001% ≤ RB < 0.001%) (C), and hyper-rare (RB < 0.0001%) (D) bacteria. NS: natural soils; CS: cut slope soils; RB: average relative abundance.
Figure 4.
Bray–Curtis-distance-based redundancy analysis (RDA) for the communities of total (A), abundant (RB ≥ 0.001%) (B), rare (0.0001% ≤ RB < 0.001%) (C), and hyper-rare (RB < 0.0001%) (D) bacteria. NS: natural soils; CS: cut slope soils; RB: average relative abundance.
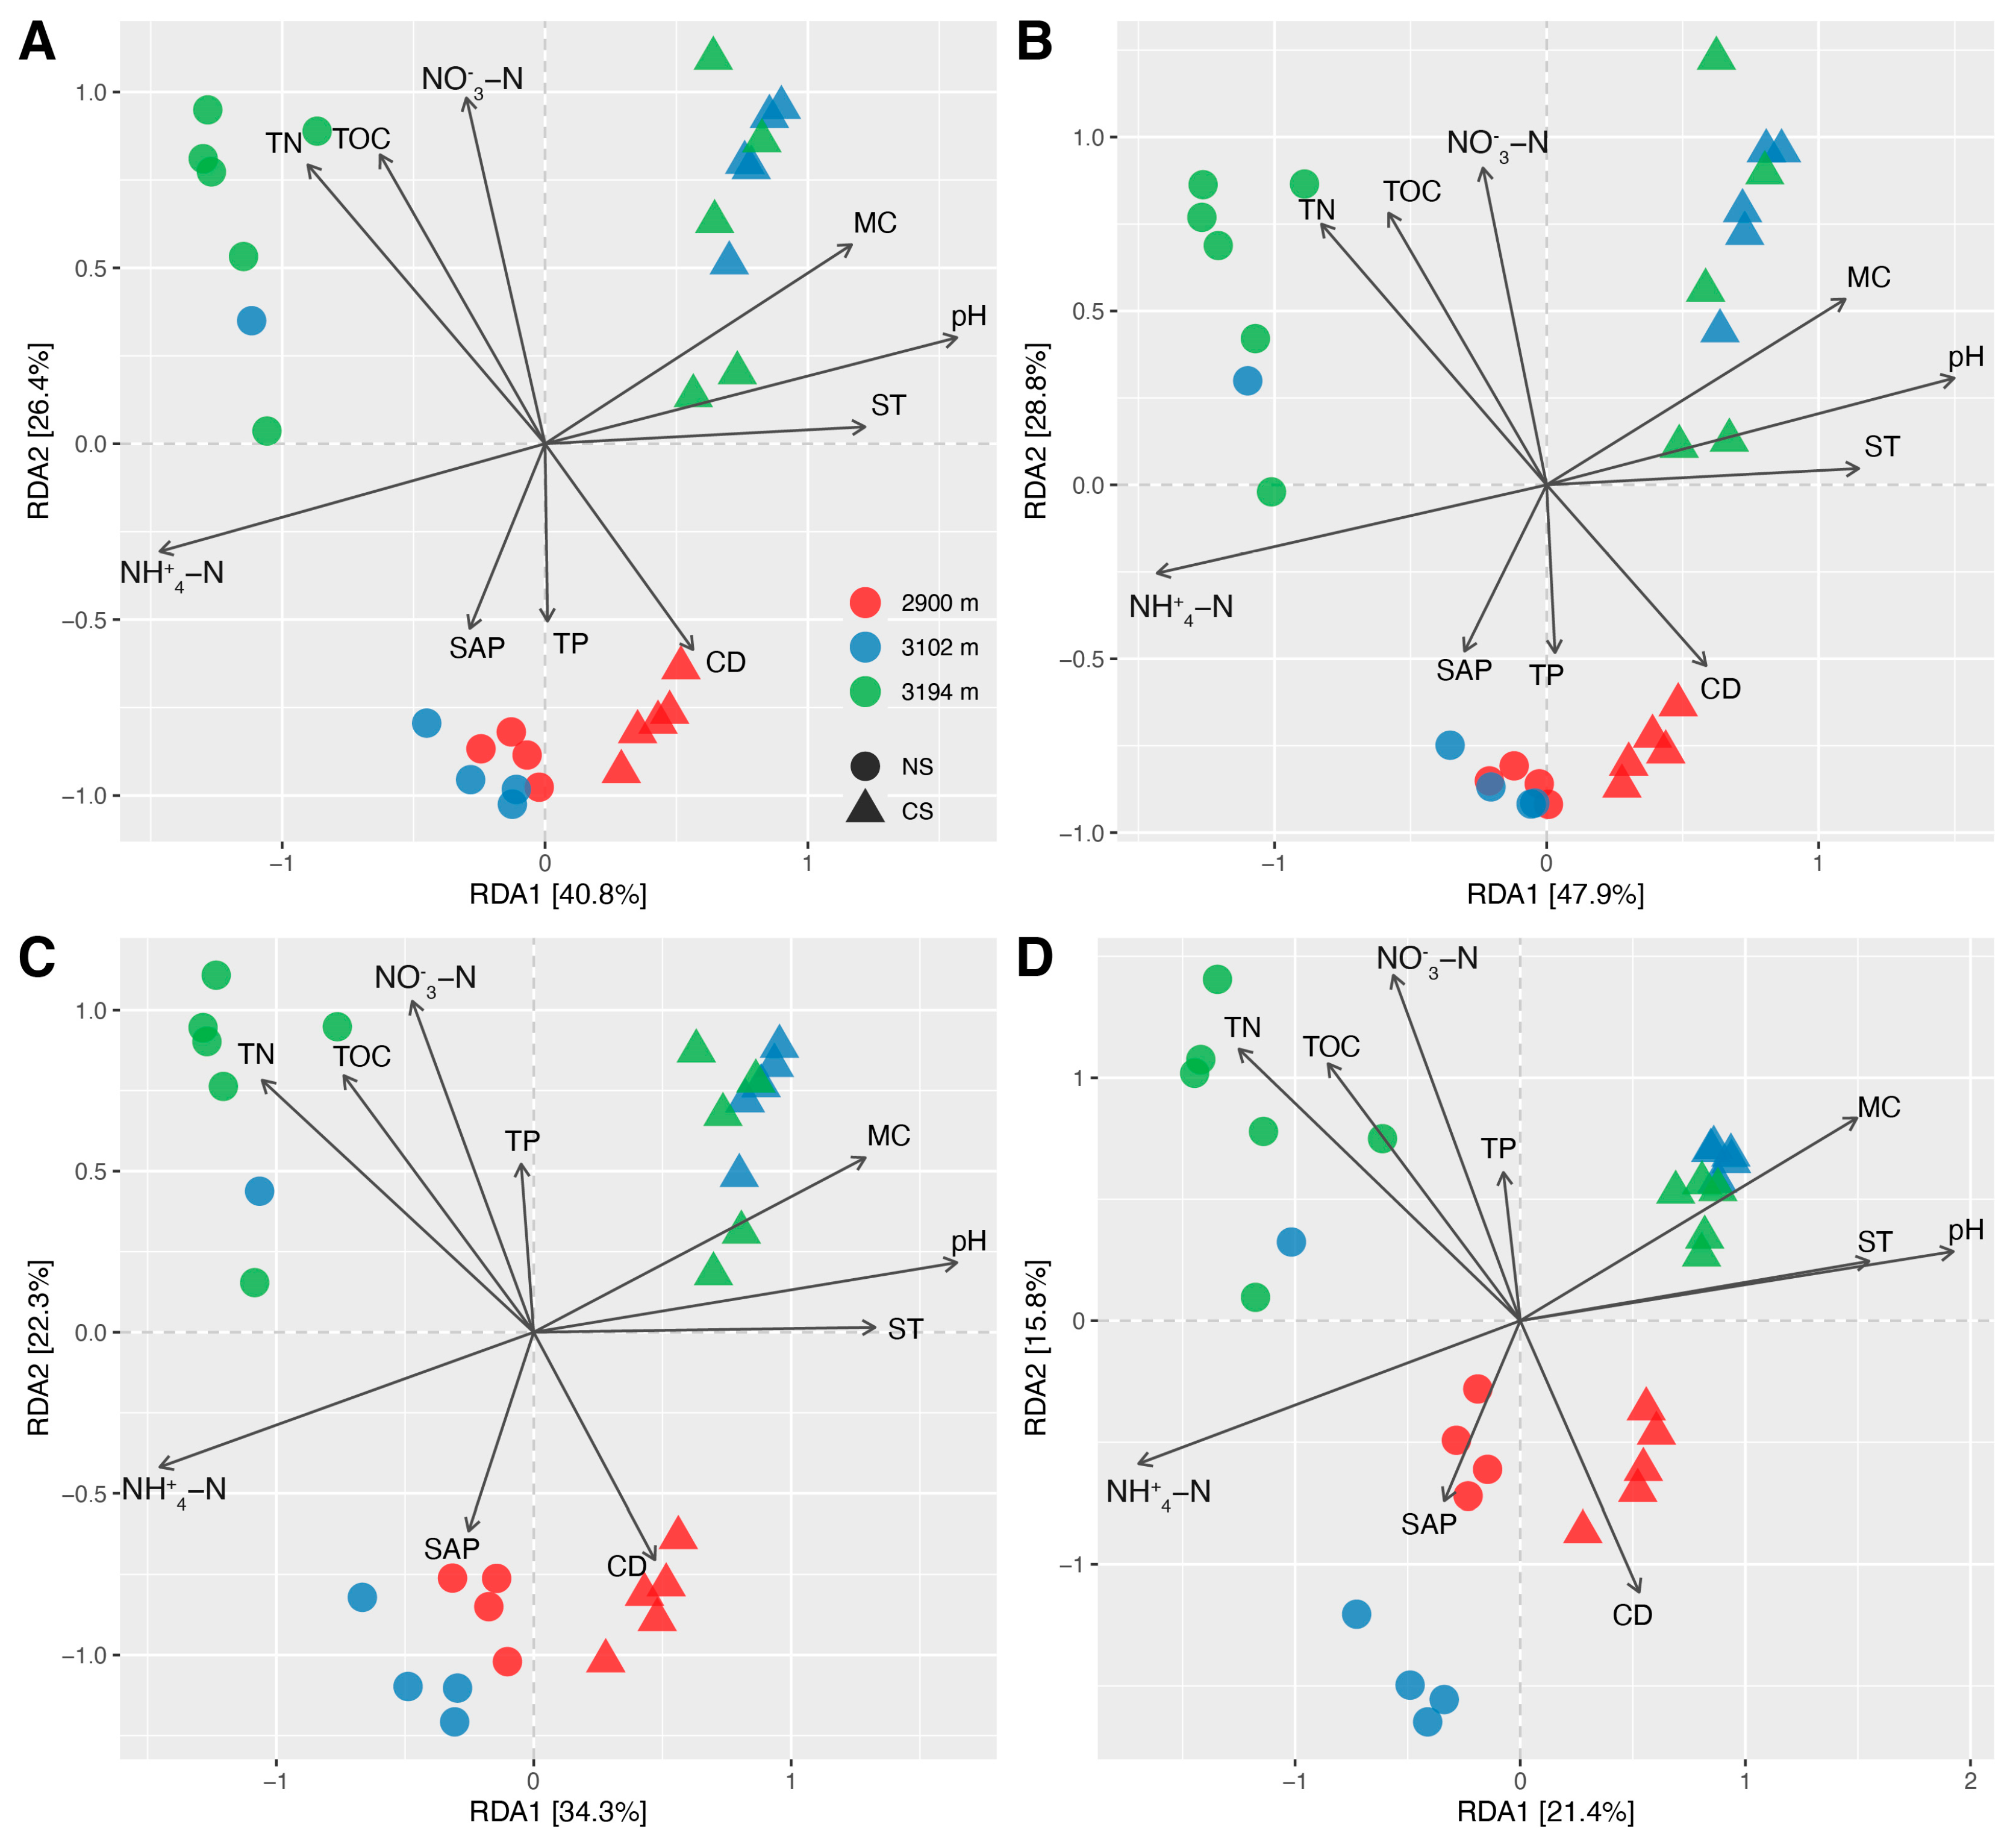
Figure 5.
Functional redundancies of total, abundant (RB ≥ 0.001%), rare (0.0001% ≤ RB < 0.001%), and hyper-rare (RB < 0.0001%) bacteria in natural (NS) and cut slope (CS) soils (A). The relationships between the functional redundancies of total soil bacteria and those of abundant, rare, and hyper-rare ones (B). Asterisks in figure (A) represent the significant differences between NS and CS at an altitude (* p < 0.05, ** p < 0.01). The lowercase and uppercase letters in figure (A) represent the significance of differences among altitudes within NS and CS, respectively, and it indicates no significant difference (p < 0.05) between two groups if they share the same letter. R-values and p-values in figure (B) mean Pearson correlation coefficients and their associated significance. RB: average relative abundance.
Disclaimer/Publisher’s Note: The statements, opinions and data contained in all publications are solely those of the individual author(s) and contributor(s) and not of MDPI and/or the editor(s). MDPI and/or the editor(s) disclaim responsibility for any injury to people or property resulting from any ideas, methods, instructions or products referred to in the content. |
© 2024 by the authors. Licensee MDPI, Basel, Switzerland. This article is an open access article distributed under the terms and conditions of the Creative Commons Attribution (CC BY) license (https://creativecommons.org/licenses/by/4.0/).
Share and Cite
MDPI and ACS Style
Li, C.; Liao, H.; Li, D.; Jing, Y. Abundant Species Govern the Altitude Patterns of Bacterial Community in Natural and Disturbed Subalpine Forest Soils. Diversity 2024, 16, 242. https://doi.org/10.3390/d16040242
AMA Style
Li C, Liao H, Li D, Jing Y. Abundant Species Govern the Altitude Patterns of Bacterial Community in Natural and Disturbed Subalpine Forest Soils. Diversity. 2024; 16(4):242. https://doi.org/10.3390/d16040242
Chicago/Turabian StyleLi, Chaonan, Haijun Liao, Dehui Li, and Yanli Jing. 2024. "Abundant Species Govern the Altitude Patterns of Bacterial Community in Natural and Disturbed Subalpine Forest Soils" Diversity 16, no. 4: 242. https://doi.org/10.3390/d16040242
Note that from the first issue of 2016, this journal uses article numbers instead of page numbers. See further details here.