Article

Soil-Microbial CNP Content and Ecological Stoichiometry Characteristics of Typical Broad-Leaved Tree Communities in Fanjing Mountain in Spring

1
Guizhou Institute of Biology, Guiyang 550009, China
2
Fanjing Mountain Forest Ecosystem Observatory, Guizhou Academy of Sciences, Jiangkou 554400, China
3
Guizhou Fanjingshan Forest Ecosystem National Observation and Research Station, Jiangkou 554400, China
*
Author to whom correspondence should be addressed.
Diversity 2024, 16(4), 249; https://doi.org/10.3390/d16040249
Submission received: 5 February 2024 / Revised: 12 April 2024 / Accepted: 17 April 2024 / Published: 22 April 2024

Abstract

:
This study aims to investigate the impact of diverse forest stand types and soil depths on soil ecological stoichiometry characteristics, shedding light on nutrient limitations and cycling patterns within the mid-subtropical forest ecosystem in southwest China during spring. The research focused on four representative forest stands situated in Fanjing Mountain: Castanopsis fargesii (C. fargesii), Cyclobalanopsis multiervis (C. multiervis), Cyclobalanopsis argyrotricha (C. argyrotricha), and Rhododendron argyrophyllum Franch (R. argyrophyllum). Sample plots were established in these forest types, and soil samples were collected from the 0–20 cm and 20–40 cm soil layers in March, spring of 2023. Various soil parameters, including pH, soil organic carbon (SOC), total nitrogen (TN), total phosphorus (TP), soil microbial biomass carbon (MBC), soil microbial nitrogen (MBN), and soil microbial phosphorus (MBP) were measured, and their stoichiometric ratios were calculated. The findings of the study were as follows: (1) In the 0–20 cm soil layer, C. argyrotricha exhibited the highest soil organic carbon, followed by C. fargesii, C. multiervis, and R. argyrophyllum with the lowest content. No significant differences in soil organic carbon were observed among the four forests in the 20–40 cm soil layer. Additionally, C. argyrotricha displayed a significantly higher soil C:N ratio compared to other forest types in different soil layers. In the typical broad-leaved forest area of Fanjing Mountain, the TP was classified as deficient. (2) In the 0–20 cm soil layer, the MBC of C. fargesii surpassed C. multiervis, C. argyrotricha, and R. argyrophyllum by 26.59%, 42.92%, and 24.67%, respectively. There were no significant differences in soil MBC:MBP ratio and MBN:MBP ratio, regardless of forest species and soil depths. The low availability of soil nitrogen in different forest stand types in Fanjing Mountain strongly limits soil microorganism biomass. (3) The correlation between SOC, TN, TP, and their stoichiometric ratios varied across different soil layers. Therefore, in managing the Fanjing Mountain forest area, attention should be paid to supplementing N and P in the soil.

1. Introduction

Ecological stoichiometry is a scientific discipline that investigates the energy balance and the equilibrium of various chemical elements within ecosystems. It predominantly focuses on the interplay among the three crucial components of carbon, nitrogen, and phosphorus, which serve as vital indicators of soil fertility and productivity [1,2]. Forest soil is a critical component and nutrient pool of terrestrial ecosystems. The ratio between soil nutrient elements reflects a series of ecological strategies and represents a key constraint on coupling carbon, nitrogen, and phosphorus cycles [3]. The nutrient holding capacity of different types of soil varies in different forest stand types, leading to different stoichiometric ratios of C, N, and P in the soil [4,5,6,7]. Examining soil ecological stoichiometry characteristics among different vegetation types provides insights into element cycling [7,8,9,10] and nutrient supply on a regional spatial scale [11,12,13,14]. Despite substantial progress in understanding the ecological stoichiometry characteristics of soil organic carbon, nitrogen, and phosphorus in different vegetation types, as well as determining the limiting nutrients in forest ecosystems, challenges persist due to regional climatic variations and differing vegetation types. Pronounced differences exist among soils in various ecosystem types, necessitating further investigation into the ecological stoichiometry characteristics of soil organic carbon, nitrogen, and phosphorus in forest soils across different regions.
Soil microbial biomass represents the living component of soil organic matter, acting as both a “source” and “sink” of soil nutrients. As soil microorganisms build their biomass, they facilitate the circulation of ecosystem materials and energy, influencing the soil-plant-atmosphere continuum (SPAC) and ecosystem function [15]. The mineralization, decomposition, and fixation of nutrients by soil microorganisms strongly impacts soil fertility [16,17]. The C:N:P ratio of microbial biomass governs its effects on nutrient mineralization and sequestration [18]. Compared to soil enzyme activity and soil nutrients, the C:N:P ratio of soil microbial biomass stands out as a more sensitive indicator of nutrient limitation [19,20]. The transformation of forest stand types will change the plant community structure and species composition and lead to changes in soil microbial functions, affecting nutrient turnover [21,22,23]. Exploring the microbial biomass characteristics of forest soil in different regions is of great significance for the in-depth understanding of soil nutrient cycling, availability and limiting nutrients of forest soil ecosystems.
This study investigated four typical forest stand types in the Fanjing Mountain Nature Reserve in Guizhou, China. Each of these stands have different altitudes, slope aspects, soil types, and vegetation types. These forest types include Castanopsis fargesii (C. fargesii), Cyclobalanopsis multiervis (C. multiervis), Cyclobalanopsis argyrotricha (C. argyrotricha), and Rhododendron argyrophyllum Franch (R. argyrophyllum). The relative height difference of Fanjing Mountain reaches 2000 m, which condenses the environmental gradient across the zone at the landscape scale. The geological history and environmental changes within this range have been relatively consistent. These forest types are at the stable or top level in the succession sequence of Fanjing Mountain. The vegetation community covers a sizeable vertical gradient of Fanjing Mountain, providing an ideal natural laboratory for exploring changes in soil chemistry and microbial properties along regional cross-zone environmental gradients. Our study aimed to comprehensively analyze soil chemicals, including pH, soil organic carbon (SOC), total nitrogen (TN), total phosphorus (TP), and microbial properties, including soil microbial biomass carbon (MBC), soil microbial nitrogen (MBN), and soil microbial phosphorus (MBP), related to biogeochemical processes under different forest stand types and at different soil depths (0–20 cm and 20–40 cm). Specifically, this study aimed to evaluate the combined effects of stand type and soil depth on soil and soil microbial carbon, nitrogen, and phosphorus content and stoichiometry. Our hypotheses are: (1) The forest stand type and soil depth significantly affect the C, N, and P concentrations and stoichiometric ratios of soil microbial biomass; (2) There is a significant correlation between the stoichiometric characteristics of soil C, N, and P and the soil microbial biomass C, N, and P.

2. Materials and Methods

2.1. Natural Overview of the Study Area

Fanjing Mountain proudly stands at the convergence of the Jiangkou, Yinjiang, and Songtao counties in northeastern Guizhou Province, marking the highest peak in the Wuling Mountains. It ascends from the Yunnan-Guizhou Plateau in the transitional zone towards the hills of western Hunan. The geographical coordinates span from north latitude 27°31′ to 28°41′ and east longitude 108°21′ to 109°17′. This region falls under the East Asian monsoon climate, characterized by an annual average temperature ranging from 6 to 17 °C. January witnesses an average temperature of 3.1 to 5.1 °C, while July experiences temperatures between 15 and 27 °C. The accumulated temperature exceeding 10 °C spans from 1500 to 5500 °C. Annual average precipitation fluctuates from 1100 to 2600 mm, with humidity consistently exceeding 80%. The predominant soil types include yellow soil and yellow-brown soil, with a soil pH ranging from 3.7 to 5.5. The region boasts dense, well-preserved forests, covering over 80% of the region, contributing to a relatively harmonious forest ecosystem.
This study focuses on four distinct forest types within the reserve: C. fargesii, C. multiervis, C. argyrotricha, and R. argyrophyllum. C. fargesii represents a typical subtropical evergreen broad-leaved forest, primarily found in the low mountain areas of Fanjing Mountain, forming a top community. C. multiervis thrives as a primary forest in the high mountains of Fanjing Mountain, experiencing minimal human interference, and establishing itself as a stable, vertical forest community. C. argyrotricha, unique to Guizhou’s subtropical mid-alpine mountains, is dominated by evergreen broad-leaved trees, and forms the top community in the forward succession on the southern slope of upper Fanjing Mountain. R. argyrophyllum constitutes a stable vegetation community at the pinnacle of the succession sequence in Fanjing Mountain [24]. Table 1 and Figure 1 present the fundamental information regarding the four forest type plots.

2.2. Soil Sample Collection

The sample collection took place in March 2023, involving six quadrats (30 m × 30 m) selected from four distinct forest types: C. fargesii, C. multiervis, C. argyrotricha, and R. argyrophyllum. The four forest types selected in the experiment were all native forests, and the age of the constructive tree species was over 100 years old. To ensure a representative sample, six sampling points were strategically chosen along an “S”-shaped route within each quadrat. During the sampling process, the upper litter layer was delicately peeled off, and soil samples were collected at depths of 0–20 cm and 20–40 cm, utilizing a soil auger with a 5 cm diameter. In cases where the soil depth was less than 40 cm, the sampling depth was adjusted based on the actual soil depth. The collected soil samples from each depth were thoroughly mixed, and approximately 1 kg of soil was retained following the “four-quarter rule”. Subsequently, these samples were returned to the laboratory, where they underwent a 2 mm sieve process to eliminate plant roots, stones, and litter. A portion of the fresh soil samples was stored at 4 °C to maintain their integrity. The soil microbial biomass carbon, nitrogen, and phosphorus contents were promptly measured. The remaining soil samples were naturally dried, then sieved through a 100-mesh sieve, and subsequently utilized for the determination of soil nutrients.

2.3. Determination of Soil-Microbial Carbon, Nitrogen, and Phosphorus Concentrations

Organic carbon was measured using the potassium dichromate volumetric method heated in an oil bath [25]. Total nitrogen was measured using an alkaline hydrolysis diffusion method, specifically the semi-micro-Kelvin method [26]. Total phosphorus was measured using the digestion-molybdenum antimony colorimetric method [27]. Soil MBC, MBN, and MBP contents were measured using the chloroform fumigation method. MBC was determined by chloroform fumigation-K2SO4 extraction; MBN was determined by chloroform fumigation-K2SO4 extraction-potassium persulfate oxidation method; and MBP was determined by chloroform fumigation-NaHCO3 extraction-molybdenum blue colorimetric method. The control group was not fumigated, and the extraction process was the same as that of the fumigated group; the difference between the element concentration measured in the fumigated group and the element concentration measured in the non-fumigated group was multiplied by the corresponding conversion coefficient to calculate the carbon, nitrogen, and phosphorus contents of the microbial biomass, where the carbon, nitrogen, and phosphorus conversion coefficients were 0.45, 0.45, and 0.40, respectively [28].

2.4. Data Processing

The stoichiometric ratios of carbon, nitrogen, and phosphorus in soil and soil microbial biomass were expressed as mass ratios. The experimental data were statistically analyzed using SPSS 25.0 (SPSS Inc., IBM Corporation, Chicago, IL, USA). Before performing variance analysis, Levene’s test was used to assess the homogeneity of variances of soil-microbial carbon, nitrogen, and phosphorus content, and ecological stoichiometric ratio data. The variances were uneven. Data were analyzed using the Kruskal–Wallis non-parametric test, with post hoc tests using the step-down method for multiple comparisons. p ≤ 0.05 was considered statistically significant, and data in graphs are expressed as median ± range. The histograms were generated using Origin 2019 (OriginLab, Northampton, MA, USA). Heat maps of correlations between soil microbial biomass carbon, nitrogen, and phosphorus contents and corresponding stoichiometric ratios were drawn using the “complot” package of R software (R 4.03). CANOCO 4.5 software was used to perform redundancy analysis on the relationship between ecological stoichiometric characteristics of soil and soil microorganisms and environmental factors.

3. Results and Analysis

3.1. Effects of Forest Stand Type and Soil Depth on Soil-Microbial Carbon, Nitrogen, and Phosphorus Concentrations and Stoichiometry Characteristics

Two-way analysis of variance results showed that stand types had extremely significant effects on SOC, TN, TP, C:N, C:P, N:P, and pH (p < 0.01), significant effects on WAF, MBC, and MBC:MBP (p < 0.05), and no significant impact on MBN, MBP, MBC:MBN, and MBN:MBP (p > 0.05). Among them, the F value of the C:N ratio was the largest, indicating that forest type had the greatest impact on C:N ratio. Soil depth had a substantial effect on SOC, TN, TP, C:N, C:P, and pH (p < 0.01) but had no significant impact on microbial carbon, nitrogen, or phosphorus, or their stoichiometric ratios (p > 0.05). The interaction between soil depth and stand type had a significant effect on SOC and C:P ratio (p < 0.01), a significant effect on WAF (p < 0.05), and no significant effect on other indicators (p > 0.05) (Table 2).

3.2. Characteristics of Soil Carbon, Nitrogen, Phosphorus and Stoichiometric Ratios

The changes in organic carbon, total nitrogen, and total phosphorus contents in the 0–20 cm and 20–40 cm soil layers at different soil depths are shown in Figure 1. In any forest type, the contents of organic carbon, total nitrogen, and total phosphorus in the 0–20 cm soil layer were higher than those in the 20–40 cm soil layer (Figure 2A–C). In the 0–20 cm soil layer, the order of soil organic carbon in the four forests was C. argyrotricha > C. fargesii > C. multiervis > R. argyrophyllum. In the 20–40 cm soil layer, there was no significant difference in soil organic carbon among the four forests (p > 0.05) (Figure 2A). Similarly, in the 0–20 cm soil layer, there was no significant difference in soil TN among the four forests (p > 0.05) (Figure 2B). In the 20–40 cm soil layer, the soil total phosphorus of C. argyrotricha was the lowest, which was significantly different from other forest types (p < 0.05) (Figure 2C).
In different soil layers, the soil C:N ratio of C. argyrotricha was significantly higher than that of other forest types (p 0.05) (Figure 2D). The soil C:P ratio of C. argyrotricha was higher than that of other forest types. In the 0–20 cm soil layer, there was a significant difference between C. argyrotricha and C. multiervis and R. argyrophyllum (p < 0.05). In the 20–40 cm soil layer, there was a significant difference (p < 0.05) between C. argyrotricha and R. argyrophyllum (Figure 2E). In the 0–20 cm soil layer, the soil N:P ratio of C. argyrotricha was lower than that of other forest types, but there was no significant difference among different forest types (p > 0.05). In the 20–40 cm soil layer, the soil N:P ratio of C. argyrotricha was significantly lower than that of other forest types (p < 0.05), and the difference between forest types was significant (p < 0.05) (Figure 2F).

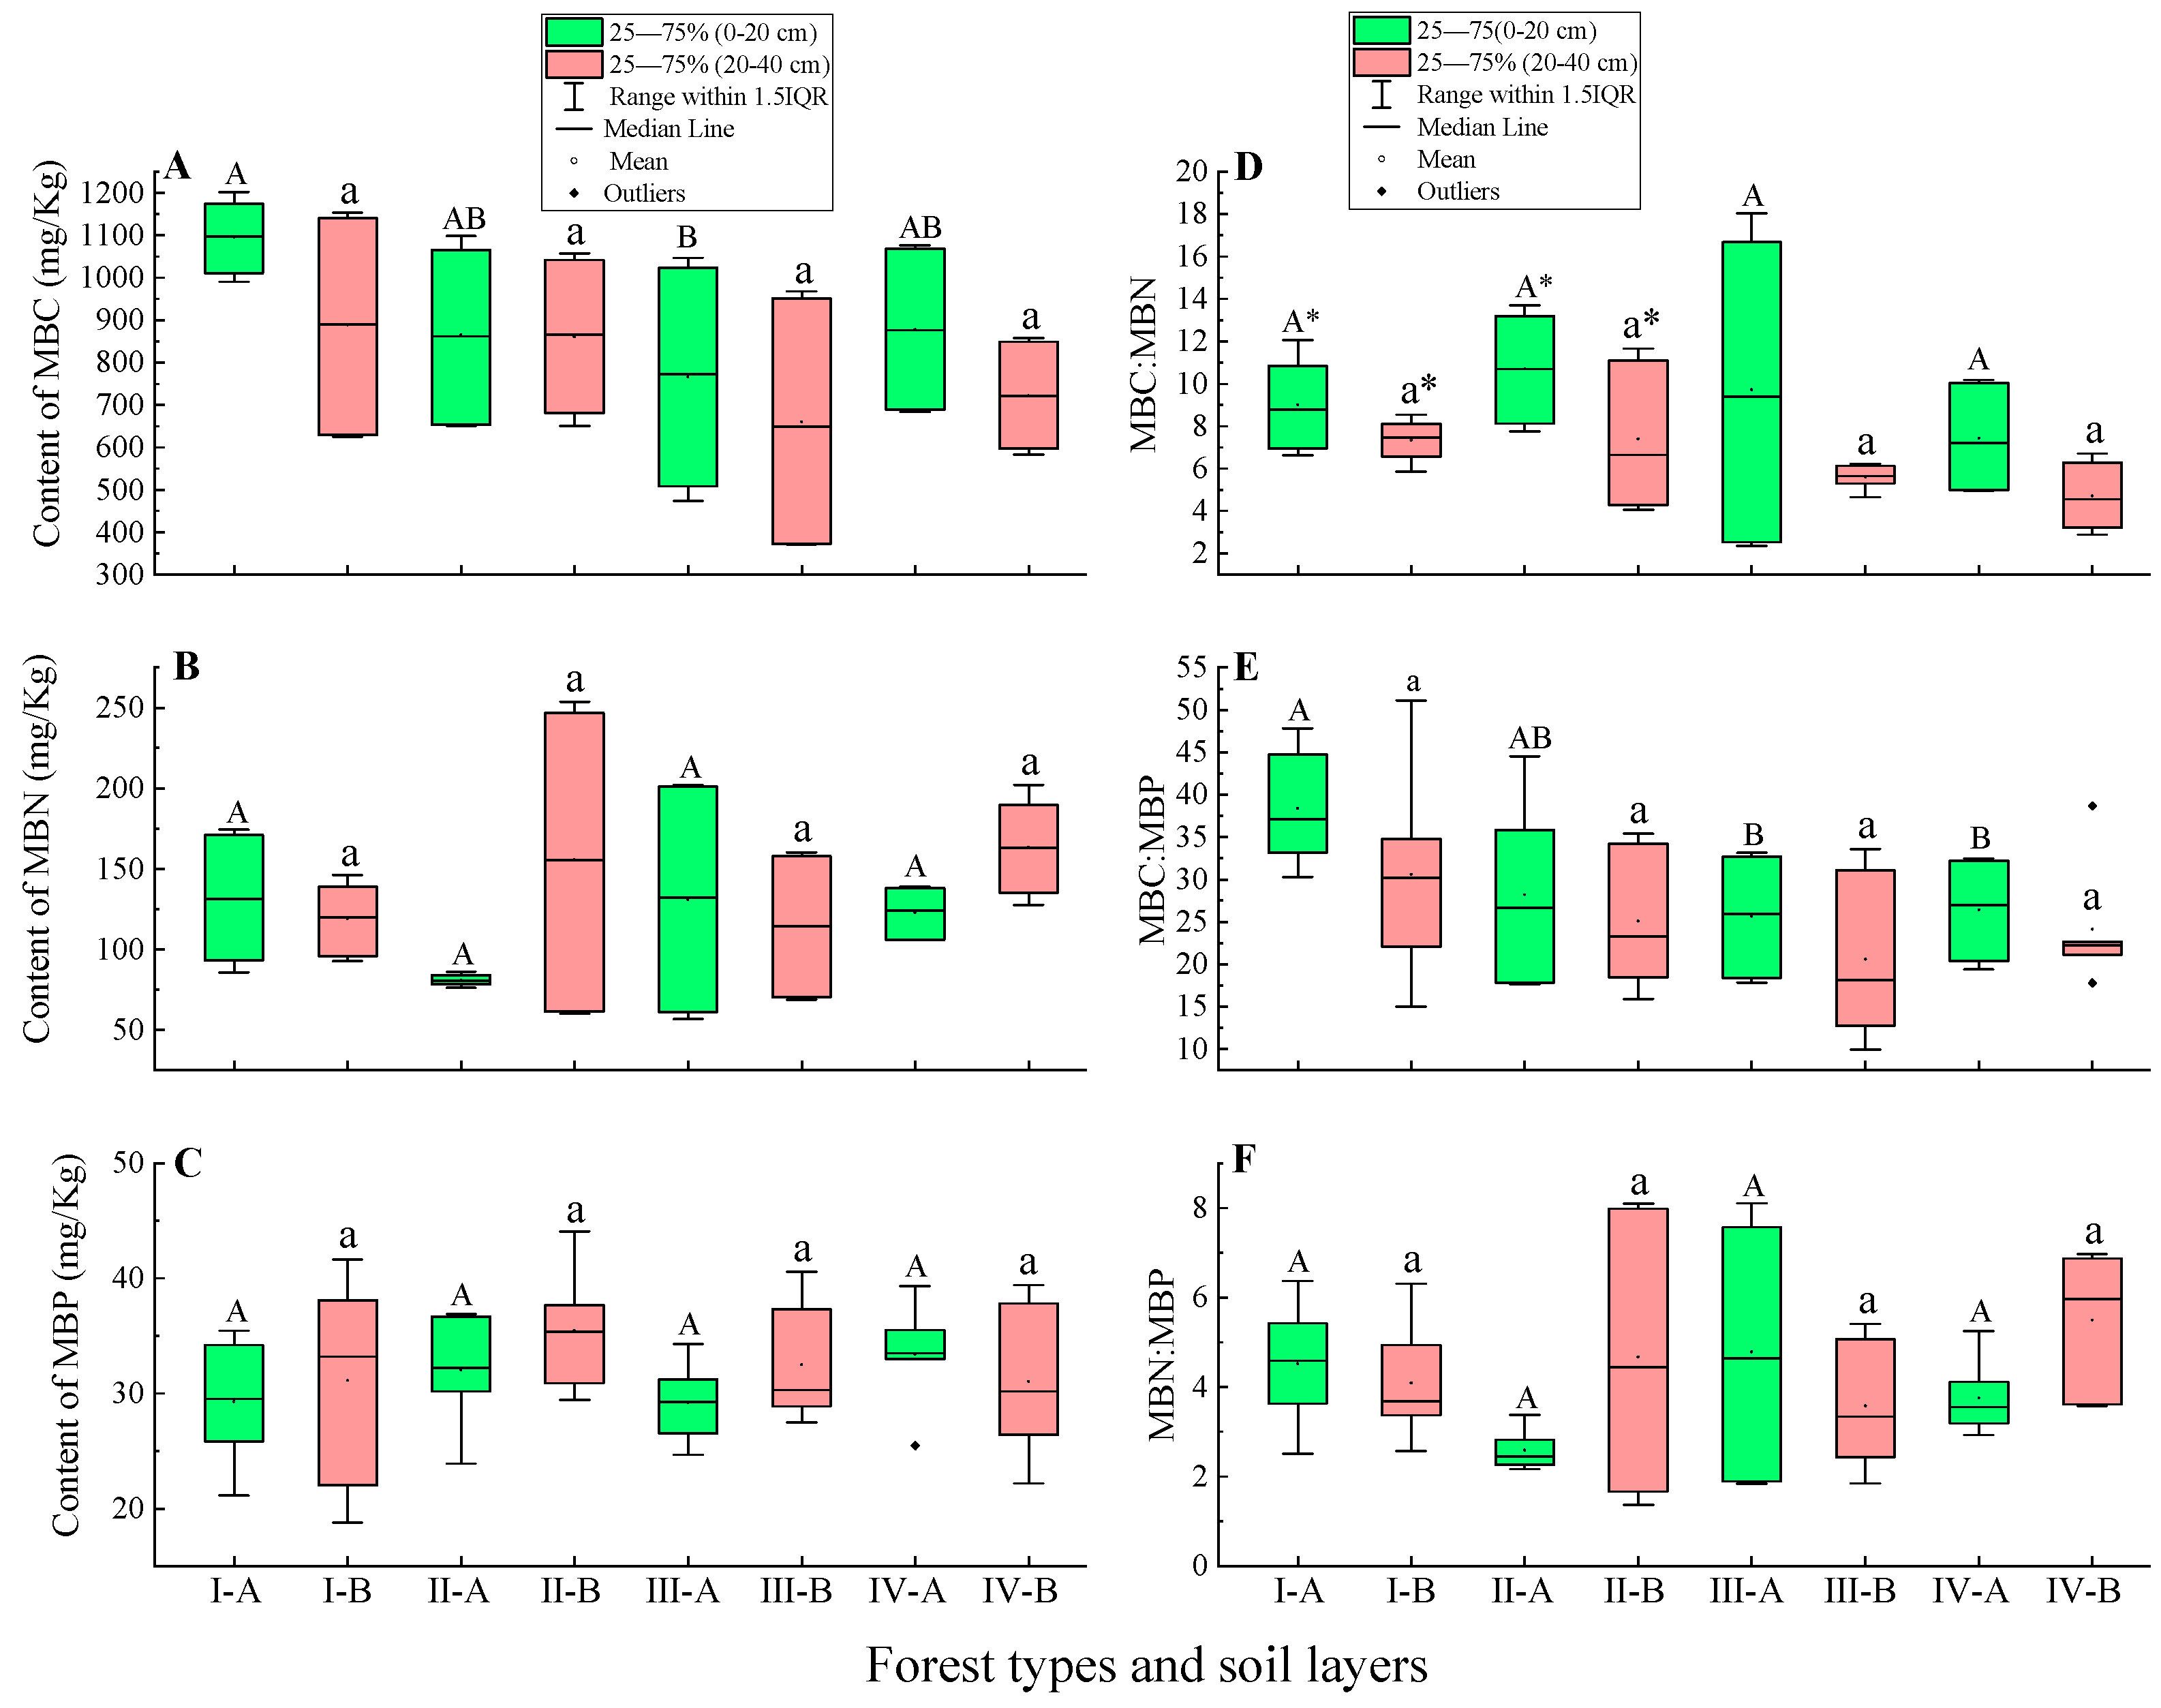
3.3. Soil Microbial Biomass Carbon, Nitrogen, Phosphorus Content and Stoichiometry Characteristics

Within the same forest type, there was no significant difference in MBC, MBN, and MBP content among different soil layers (p > 0.05) (Figure 3A–C). In the 0–20 cm soil layer, the MBC of C. fargesii was the highest, and was 26.59%, 42.92%, and 24.67% higher than that of C. multiervis, C. argyrotricha, and R. argyrophyllum forest, respectively. In the 20–40 cm soil layer, the MBC content of C. argyrotricha was also the lowest, but there was no significant difference compared with other forest types (p > 0.05) (Figure 3A). In the same soil layer, there was no significant difference in MBN and MBP content between the different forest types (p > 0.05).
In the same soil layer, there was no significant difference in soil MBC:MBN ratio and MBN:MBP ratio between different forest stands (p > 0.05) (Figure 3D,F); within the same forest type, there was no significant difference in soil MBC:MBP ratio and MBN:MBP ratio between different soil layers (p > 0.05) (Figure 3D–F).

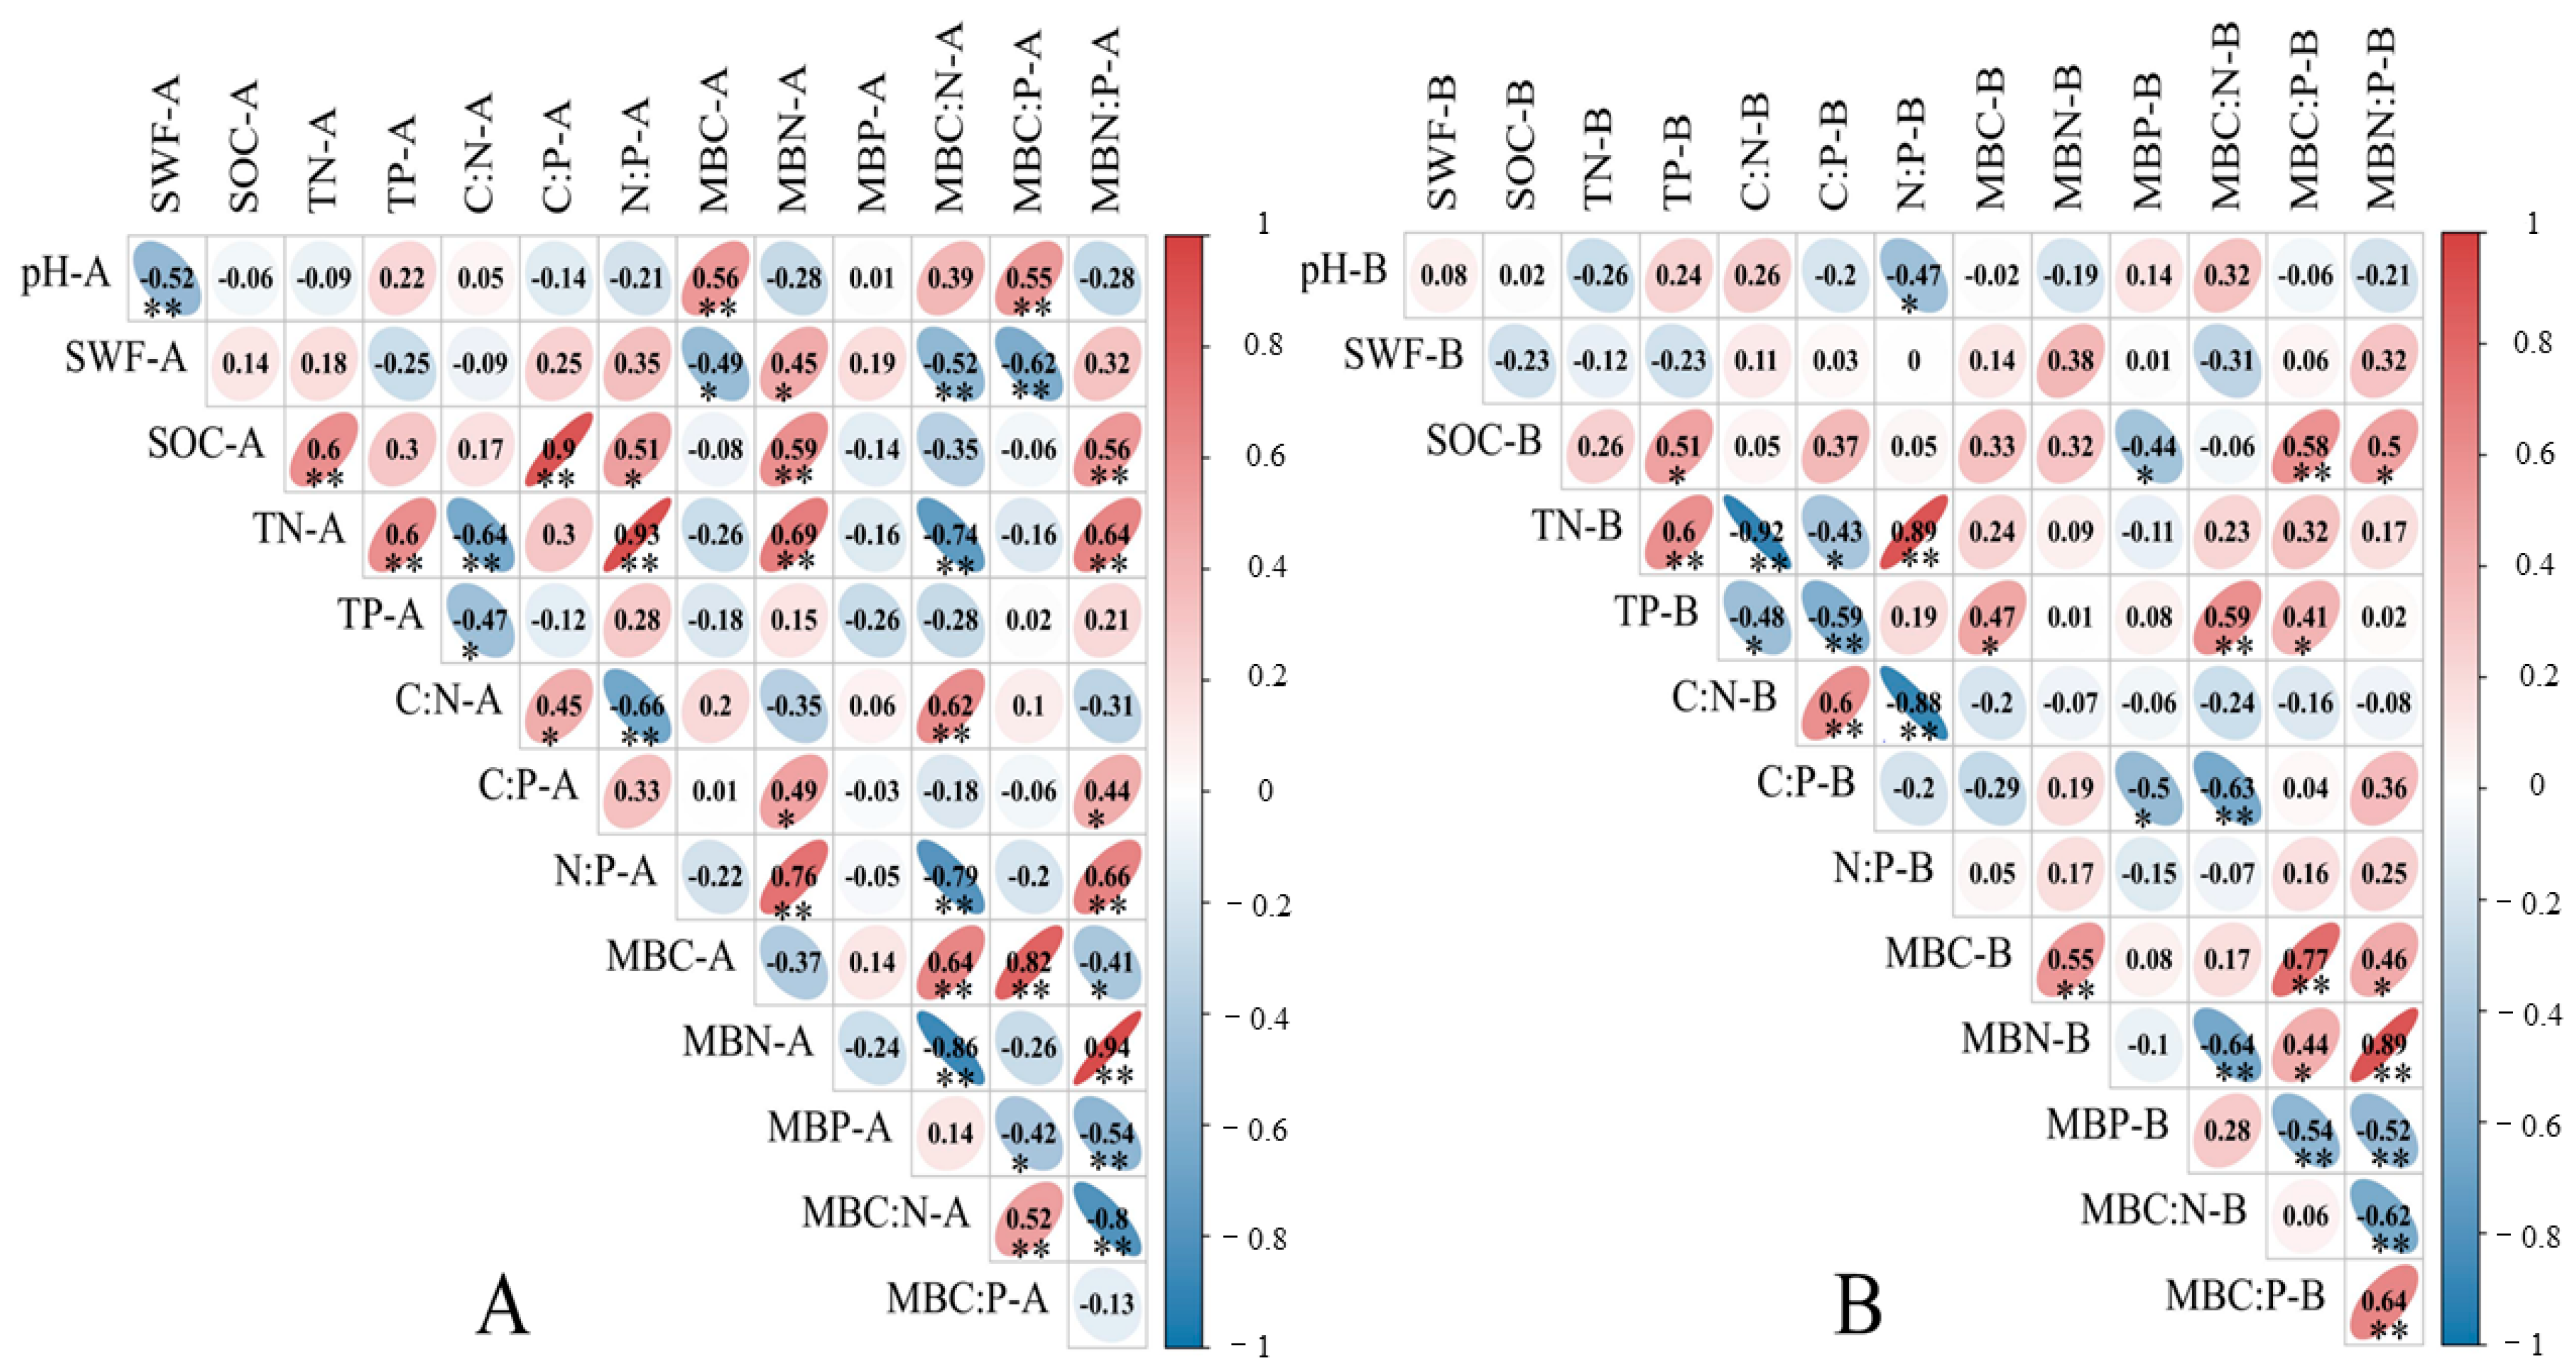
3.4. Correlation between Soil-Microbial Biomass Carbon, Nitrogen, Phosphorus and Stoichiometric Ratio

In the 0–20 cm soil layer, the correlation analysis of soil microbial biomass carbon, nitrogen, phosphorus, and stoichiometric ratio (Figure 4A) showed that SOC was significantly (p < 0.05) or extremely significantly positively correlated with TN, C:P, N:P, MBN, and MBN:MBP (p < 0.01). Soil TN was significantly positively correlated with TP, N:P, MBN, and MBN:MBP (p < 0.01), and significantly negatively correlated with C:N and MBC:MBN (p < 0.01).
In the 20–40 cm soil layer, correlation analysis (Figure 4B) showed that SOC was significantly (p < 0.05) or extremely significantly positively correlated with TP, MBC:MBP, and MBN:MBP (p < 0.01), and significantly negatively correlated with MBP (p < 0.05). Soil TN was significantly positively correlated with TP and N:P (p < 0.01), and significantly (p < 0.05) or extremely significantly negatively correlated with C:N and C:P (p < 0.01).

3.5. Redundancy Analysis

The soil microbial biomass carbon, nitrogen, and phosphorus and their stoichiometric ratios in different soil layers were compared using an environmental factors redundant sequence analysis. First, through stepwise iteration, environmental variables with significant explanatory power for the 0–20 cm soil layer were screened, namely slope aspect, altitude, forest type, soil moisture content, and slope (Table 3). The soil microbial biomass carbon, nitrogen, and phosphorus and their stoichiometric ratios in the 0–20 cm soil layer were analyzed with significant explanatory environmental variables for redundant dual-sequence analysis. The species–environment correlation values of the first and second axes were 0.889 and 0.797, respectively (Table 3). The first and second axes explained 40.8% and 17.3% of soil microbial biomass carbon, nitrogen, and phosphorus and their stoichiometric ratios, respectively (Table 3). RDA1 was mainly related to aspect, slope, altitude, and soil moisture content; RDA2 was related to aspect and slope (Figure 5A, Table 3). The explanation of all environmental variables for the variation of soil microbial biomass carbon, nitrogen, and phosphorus characteristics was 69%, and the explanation of significant explanatory environmental variables was 66%. The soil moisture content significantly contributed to variation among soil microbial biomass carbon, nitrogen, and phosphorus characteristics. This explanation amount was the largest at 26.00% (Monte Carlo permutation test using 9999 permutations, p = 0.002).
Through stepwise iteration, environmental variables with significant explanatory power for the 20–40 cm soil layer were screened, including altitude, aspect, soil moisture content, soil pH value, and slope (Table 3). The soil microbial biomass carbon, nitrogen, and phosphorus and their stoichiometric ratios in the 20–40 cm soil layer were analyzed with significant explanatory environmental variables for redundant dual-sequence analysis. The species–environment correlation values of the first and second axes were 0.909 and 0.702, respectively (Table 3). The first and second axes explained 37.5% and 14.4% of soil microbial biomass carbon, nitrogen, and phosphorus, and their stoichiometric ratios, respectively (Table 3). RDA1 was mainly related to soil pH, altitude, aspect, and slope; RDA2 related to slope, aspect, and soil moisture content (Figure 5B, Table 3). The variance explained by all environmental variables was 62%, and the explanation of significant explanatory environmental variables was 60%. Slope explained the most substantial variation, at 16.00% (Monte Carlo permutation test using 9999 permutations, p = 0.002).

4. Discussion

4.1. Soil Carbon, Nitrogen, and Phosphorus of Different Forest Stand Types and Their Ecological Stoichiometry Characteristics

Most natural biological processes in forest ecosystems occur on the soil surface. The organic matter litter decomposition is first concentrated on the soil surface. Then, it migrates to the lower layers with water or other media, resulting in an apparent vertical pattern of soil nutrients, gradually moving from the surface to the lower layers. Chen [16] studied soil depth, which significantly impacts SOC, TN, and TP, and their stoichiometry. Surface soil nutrient concentrations are higher than deep soil nutrient concentrations. In this study, the SOC, TN, and TP contents in the 0–20 cm soil layer across different forest stand types were higher than those in the 20–40 cm soil layer, and the results of the two-factor analysis of variance showed that the effects of soil depth on TP, SOC, and TN were extremely significant. Our research results are consistent with those of Chen et al. At the beginning of March in Fanjing Mountain, the temperature was low, and biological factors had little effect on the transformation of soil carbon, nitrogen, and phosphorus. Average TP in the 0–20 cm soil layer was 0.63 g/kg. This was at the intermediate level of soil TP content across the country (0.52~0.78 g/kg), and represents a value equal to only 22.5% of the total phosphorus content (2.8 g/kg) in worldwide soil. This is a manifestation of phosphorus deficiency. The average TP in the 20–40 cm soil layer (0.50 g/kg) was slightly lower than the national soil TP (0.52~0.78 g/kg) and significantly lower than the world average TP (2.8 g/kg), which is a manifestation of extreme phosphorus deficiency. Therefore, supplementing phosphorus elements in the soil should be considered in managing the Fanjing Mountain forest area. Chen [21] found that the occurrence and migration of the three elements also resulted in significant vertical distribution patterns of C:N, C:P, and N:P stoichiometry, which decreased with depth. The ratios of C:P and N:P decreased with an increase in soil depth, which was consistent with the results of Chen, but the stoichiometric distribution of C:N was stable and did not decrease with the increase in soil depth. The C:N ratio is mainly used to judge the degree of decomposition of organic matter in the soil. Studies have shown that when the C:N ratio is greater than 25, the accumulation rate of organic matter in the soil is greater than the decomposition rate; when the C:N ratio is between 12 and 16, microorganisms in the soil have well decomposed the organic matter, and it is difficult for any more organic matter to accumulate [29]. In this study, in the 0–20 cm soil layer, the C:N ratio of C. fargesii was between 16 and 25, indicating that there was no net accumulation or complete decomposition process of organic matter in it. The C:N ratio of C. multiervis and R. argyrophyllum ranged from 12 to 16, indicating that microorganisms had well decomposed the organic matter in these forest types. The C:N ratio of C. argyrotricha was greater than 25, indicating that the accumulation rate of organic matter in the soil under this forest type was greater than the decomposition rate. The N:P ratio in soils can reflect the decomposability of organic matter and soil nutrient limitation. Some studies have shown that when soil N:P < 10, vegetation growth is limited by nitrogen [30]. In this study, the soil N:P in the 0–20 cm soil layer of the C. multiervis and C. argyrotricha forests was less than 10, indicating that the soil was limited by N. Appropriate supplementation of nitrogen elements can be used in these two forest types to meet the growth needs of vegetation and improve their carbon sequestration capacity. Soil C:P is an important indicator reflecting plant growth and development and a sign of soil phosphorus mineralization ability. Microbial phosphorus will undergo net mineralization when the C:P ratio exceeds 200. When the C:P ratio is between 200 and 300, phosphorus in the soil neither increases nor decreases, and when the C:P ratio is greater than 300, it indicates that the phosphorus element in the soil is in a state of consumption [31]. In this study, the C:P ratio in the 0–20 cm soil layer of C. multiervis and R. argyrophyllum was lower than 200, indicating that the soil phosphorus availability of these two forest types was high. The ratio in the 0–20 cm soil layer of C. argyrotricha and C. fargesii was between 200 and 300, indicating that the phosphorus in the soil under these two forest types neither increases nor decreases, and is balanced.

4.2. Soil Microbial Biomass Carbon, Nitrogen, and Phosphorus Contents in Different Forest Stand Types and Their Ecological Stoichiometry Characteristics

Carbon, nitrogen, and phosphorus flow in soil ecosystems through immobilization and mineralization [32], thereby regulating vegetation productivity. A decrease in microbial biomass leads to the mineralization of nutrients, and an increase in microbial biomass leads to nutrient retention. In this study, the MBC content of C. fargesii was the highest, indicating that the soil carbon sequestration capacity of C. fargesii at low altitude was the strongest in early March, which well explained the high organic carbon content of C. fargesii. Chen [21] found that, in terms of microbial C:P and N:P ratios, the ratios decreased or had no trend with increasing soil depth. In this study, the microbial C:P and N:P ratios increased or had no trend with increasing soil depth, which was inconsistent with the results generated by Chen [21]. The biomass C:P and N:P ratios in E. coli have been found to be strongly homeostatic in their elemental composition across a broad range of supply C:P and N:P ratios, despite growth-dependent variations for its low growth rate [33]. Perhaps the strong dynamic balance of C:P and N:P observed in our study is also due to the low soil temperature in early spring and the slow growth of microorganisms in the soil. Cleveland [34] believed that soil microbial N:P ratio may be more suitable than plant N:P ratio to indicate ecosystem nutrient limitation. They proposed that soil microbial biomass N:P ratio (6.9) can be used to judge nutrients. If the N:P ratio of soil microbial biomass was greater than 6.9, the ecosystem nutrients were limited by P; conversely, they were limited by N [35]. In this study, the variation range of the MBN:MBP ratio in the 0–20 cm soil layer was 2.59–4.52, and the variation range of the MBN:MBP ratio in the 20–40 cm soil layer was 5.37–5.49, both of which were much lower than those of Cleveland [34]. Cleveland proposed the average soil microbial biomass N:P ratio (6.9), indicating that low soil availability of N strongly limits soil microbial biomass, activities and other ecosystem processes. These research results regarding low effectiveness N remind us again that in spring, to improve the growth ability of organisms in Mount Fanjing, N supplements should be administered.

4.3. Soil-Microorganism Carbon, Nitrogen, Phosphorus Relationship

In terms of the soil carbon, nitrogen, and phosphorus content and its stoichiometric ratio, there exists a significant or extremely significant positive correlation, which indicates that carbon, nitrogen, and phosphorus are coupled, and reflects the covariance between nutrients [19,36]. In this study, soil C and N, N and P, C:N, and C:P were significantly positively correlated in the 0–20 cm soil layer, which is consistent with previous research results. There was a significant positive correlation between soil SOC concentration and soil microbial biomass [37]. The growth of soil microorganisms is maintained and limited by the availability of soil organic carbon, and soil organic carbon is consumed and treated by soil microorganisms and changed by their activities. Therefore, soil microbial biomass and soil organic carbon are closely related at the spatial scale. However, only a significant positive effect of SOC on MBN was observed in this study, and no significant effect of SOC on MBC was observed. This may be related to differences in soil microbial community structure between sampling seasons and study sites, as soil microorganisms tend to prioritize the use of easily degradable carbon sources under unfavorable conditions for their growth [38]. When sampling, the temperature of the low altitude was 10 °C, whereas the high altitude was 2 °C, which is not conducive to microbial growth. Microbial carbon sources are easily degraded, resulting in no significant positive correlation between SOC and MBC, but a significant positive correlation with MBN. The soil total nitrogen was highly significantly positively correlated with soil microbial carbon and nitrogen, which was similar to the results of Li [39], indicating that soil microbial biomass is closely related to total nitrogen. When limited by soil total nitrogen content, microorganisms will change due to soil nitrogen resources, and adapt to changes in soil resources by adjusting their biomass carbon and nitrogen. Previous studies have believed that the concentration of microbial biomass carbon strongly correlates with soil microbial biomass nitrogen contents. The stoichiometry of soil microbial biomass is strictly determined [40] by soil microbial biomass carbon. This increase has been shown to depend on sufficient soil nitrogen to maintain the required microbial element stoichiometry [41], which is similar to the findings of this study.

5. Conclusions

Given the comprehensive influence of forest type, altitude, slope aspect, and other factors, the soil nutrient content of different forest types in Fanjing Mountain was found to be different in spring. The SOC and TN of the four forest types were higher in the surface soil than in lower layers of soil, and the TP content was deficient, indicating that phosphorus was a limiting element. The accumulation rate of organic matter in the soil of C. fargesii was greater than the decomposition rate. The soil carbon holding capacity and organic carbon content were strong. The low availability of soil nitrogen across the different forest stand types in Fanjing Mountain strongly limits the biomass of soil microorganisms, along with their activities and other ecosystem processes. Therefore, in managing the Fanjing Mountain forest area, attention should be paid to supplementing N and P in the soil. This could also strengthen the protection of forest area vegetation by promoting the decomposition of litter in the forest stands and improving the nutrient recycling capacity of different forest types in order to maintain forest productivity in the long term. This study can provide a theoretical basis for the soil nutrient cycle in the mid-subtropical forest ecosystem. However, to comprehensively evaluate the soil nutrient status of the Fanjing Mountain forest ecosystem, it is necessary to consider the leaves, branches, trunks, roots, and other organs of the tree species and carry out the work in combination with litter. More in-depth research will need to explore the relationship between vegetation, litter, and soil to provide solid data support and a theoretical basis for sustainable forest development and management.

Author Contributions

Conceptualization, Y.L. and W.L.; methodology, W.L. and Y.L.; software, X.W.; validation, X.W.; formal analysis, Y.L.; investigation, S.C.; resources, S.C.; data curation, G.M.; writing—original draft preparation, X.W. and W.L.; writing—review and editing, Y.L.; visualization, X.W.; project administration, Y.L.; funding acquisition, W.L. and Y.L. All authors have read and agreed to the published version of the manuscript.

Funding

This work was supported by the Guizhou provincial basic research program (natural science) [Grant No. QKHJC-ZK-2022-282], Scientific research experiment ability construction and engineering maintenance in Fanjingshan and Caohai, the Doctoral Research of Guizhou Academy of Sciences [Grant No. QKY-R-2021-03], Guizhou Province Forestry Scientific Project [Grant No. QLKH-2020-02], and the Science-technology Support Plan Projects of Guizhou Institute of Biology [Grant No. QSS-2021-01].

Institutional Review Board Statement

Not applicable.

Data Availability Statement

The original contributions presented in the study are included in the article, further inquiries can be directed to the corresponding author.

Conflicts of Interest

The authors declare no conflicts of interest.

References

  1. Wei, Y.; Wang, J.; Dang, X.; Han, Y.; Gao, Y.; Duan, X.; Jin, S. Soil Carbon, Nitrogen and Phosphorus Densities and Ecological Stoichiometry Characteristics of Haloxylon ammodendron Plantations in Arid Desert Area. J. Soil Water Conserv. 2022, 36, 259–266. (In Chinese) [Google Scholar]
  2. Zhang, Z.M.; Huang, X.F.; Zhou, Y.C. Factors influencing the evolution of human-driven rocky desertification in karst areas. Land Degrad. Dev. 2021, 32, 817–829. [Google Scholar] [CrossRef]
  3. Bertrand, I.; Viaud, V.; Daufresne, T.; Pellerin, S.; Recous, S. Stoichiometry constraints challenge the potential of agroecological practices for the soil C storage. A review. Agron. Sustain. Dev. 2019, 6, 54. [Google Scholar] [CrossRef]
  4. Liu, H.; Qi, J.C.; Liu, D.Q.; Yang, J.W.; Chen, M.W.; Li, S.P.; Li, C.J.; Li, C.Z. Effects of Different Forest Types On Stoichiometric Characteristics of Carbon, Nitrogen, and Phosphorus in Tropical Soils, China. Sustainability 2024, 16, 480. [Google Scholar] [CrossRef]
  5. Li, Y.; Zhang, J.L.; Qiu, Q.Y.; Zhou, Y.; You, W.B. Changes in Soil Properties and Enzyme Stoichiometry in Three Different Forest Types Changed to Tea Plantations. Forests 2023, 14, 2043. [Google Scholar] [CrossRef]
  6. Qin, J.; Liu, Y.; Bi, Q.K.; Chen, Z.Q.; Zhang, B.W. Response of Leaf and Soil C, N and P Stoichiometry in Different Pinus massoniana Forest Types to Slope Aspect in the Dabie Mountains Region of North Subtropical, China. Front. Environ. Sci. 2023, 11, 1148986. [Google Scholar] [CrossRef]
  7. Deng, X.; Zhu, L.; Song, X.C.; Tang, J.; Tan, Y.B.; Deng, N.N.; Zheng, W.; Cao, J.Z. Soil Ecological Stoichiometry Characteristics of Different Stand Types in Maoershan Nature Reserve. Soil Bull. 2022, 53, 366–373. (In Chinese) [Google Scholar]
  8. Liu, Y.Y.; Luo, W.M.; Mu, G.T.; Wu, X.L.; Su, S.C.; Zhang, Z.M. C:N:P stoichiometric characteristics of the soil-vegetation system of three rare tree species growing on Mount Fanjing in Southwest China. Glob. Ecol. Conserv. 2021, 32, e01893. [Google Scholar] [CrossRef]
  9. Fiore-Donno, A.M.; Human, Z.R.; Štursová, M.; Mundra, S.; Morgado, L.; Kauserud, H.; Baldrian, P.; Bonkowski, M. Soil compartments (bulk soil, litter, root and rhizosphere) as main drivers of soil protistan communities distribution in forests with different nitrogen deposition. Soil Biol. Biochem. 2022, 168, 108628. [Google Scholar] [CrossRef]
  10. Zhang, Z.M.; Wu, X.L.; Zhang, J.C.; Huang, X.F. Distribution and migration characteristics of microplastics in farmland soils, surface water and sediments in Caohai Lake, southwestern plateau of China. J. Clean. Prod. 2022, 366, 132912. [Google Scholar] [CrossRef]
  11. Gong, Z.J.; Sheng, M.Y.; Zheng, X.J.; Zhang, Y.; Wang, L.J. Ecological Stoichiometry of C, N, P and Si of Karst Masson Pine Forests: Insights for the Forest Management in Southern China. Sci. Total Environ. 2024, 912, 169490. [Google Scholar] [CrossRef] [PubMed]
  12. Wang, J.; Guo, Y.; Cui, X. Response of soil C. N, and P ecological stoichiometry to specific forest types and altitude in cold-temperateforests. J. Cent. South Univ. For. Technol. 2022, 42, 141–147. (In Chinese) [Google Scholar]
  13. Yang, X.; Wang, P.; Gao, D.; Gao, N.; Li, L.; Yang, X.; Zhong, Q. Ecological stoichiometry of Form Quercus pannosa and Form Pinus squamata in the Yaoshan Nature Reserve, Yunnan. Acta Ecol. Sin. 2019, 39, 4021–4028. (In Chinese) [Google Scholar]
  14. Li, Y.Y.; Fu, F.W.; Li, J.R.; Chen, W.S.; Ding, H.H.; Xiao, S.Y. Stoichiometric Characteristics of Abies georgei var smithii Plants in Southeast Tibet. Sustainability 2023, 15, 8458. [Google Scholar] [CrossRef]
  15. Zhou, Z.; Wang, C. Responses and regulation mechanisms of microbial decomposers to substrate carbon, nitrogen, and phosphorus stoichiometry. Chin. J. Plant Ecol. 2016, 40, 620–630. [Google Scholar]
  16. Heuck, C.; Weig, A.; Spohn, M. Soil microbial biomass C:N:P stoichiometry and microbial use of organic phosphorus. Soil Biol. Biochem. 2015, 85, 119–129. [Google Scholar] [CrossRef]
  17. Leff, J.W.; Jones, S.E.; Prober, S.M.; Barberán, A.; Borer, E.T.; Firn, J.L.; Harpole, W.S.; Hobbie, S.E.; Hofmockel, K.S.; Knops, J.M.H.; et al. Consistent responses of soil microbial communities to elevated nutrient inputs in grasslands across the globe. Proc. Natl. Acad. Sci. USA 2015, 112, 10967–10972. [Google Scholar] [CrossRef]
  18. Fan, H.B.; Wu, J.P.; Liu, W.F.; Yuan, Y.H.; Hu, L.; Cai, Q.K. Linkages of plant and soil C:N:P stoichiometry and their relationships to forest growth in subtropical plantations. Plant Soil 2015, 392, 127–138. [Google Scholar] [CrossRef]
  19. Li, W.N.; Ali, I.; Han, X.M.; Ullah, S.; Yang, M. Soil C, N, P, K and Enzymes Stoichiometry of an Endangered Tree Species, Parashorea chinensis of Different Stand Ages Unveiled Soil Nutrient Limitation Factors. Forests 2023, 14, 624. [Google Scholar] [CrossRef]
  20. Luo, H.Q.; Yu, J.L.; Li, R.X.; Gu, J.D.; Luo, L.; Zhang, Y.Y.; He, Y.; Xiao, Y.L.; Deng, S.H.; Zhang, Y.Z.; et al. Microbial biomass C:N:P as a better indicator than soil and ecoenzymatic C: N:P for microbial nutrient limitation and C dynamics in Zoige Plateau peatland soils. Int. Biodeterior. Biodegrad. 2022, 175, 105492. [Google Scholar] [CrossRef]
  21. Chen, X.; Feng, J.G.; Ding, Z.J.; Tang, M.; Zhu, B. Changes in soil total, microbial and enzymatic C-N-P contents and stoichiometry with depth and latitude in forest ecosystems. Sci. Total Environ. 2022, 816, 151583. [Google Scholar] [CrossRef] [PubMed]
  22. Zhao, R.D.; He, M.; Jiang, C.L.; Liu, F. Soil microbial stoichiometry and community structure responses to long-term natural forest conversion to plantations in a subtropical region. Environ. Sci. Pollut. R. 2022, 29, 27560–27570. [Google Scholar] [CrossRef] [PubMed]
  23. Qi, D.D.; Feng, F.J.; Lu, C.; Fu, Y.M. C:N:P stoichiometry of different soil components after the transition of temperate primary coniferous and broad-leaved mixed forests to secondary forests. Soil Tillage Res. 2022, 216, 105260. [Google Scholar] [CrossRef]
  24. Zhou, Z. Research on the Fanjing Mountain; Guizhou People’s Publishing House: Guiyang, China, 1990. [Google Scholar]
  25. Han, W.; Luo, L.; Zhang, S. Adsorption of tetrabromobisphenol A on soils: Contribution of soil components and influence of soil properties. Colloids Surf. A Physicochem. Eng. Asp. 2013, 428, 60–64. [Google Scholar] [CrossRef]
  26. Jing, Z.; Cheng, J.; Su, J.; Bai, Y.; Jin, J. Changes in plant community composition and soil properties under 3-decade grazing exclusion in semiarid grassland. Ecol. Eng. 2014, 64, 171–178. [Google Scholar] [CrossRef]
  27. Tang, L.L.; Wan, K.Y.; Cheng, C.P.; Li, R.H.; Wang, D.Z.; Pan, J.F.; Tao, Y.; Xie, J.; Chen, F. Effect of fertilization patterns on the assemblage of weed communities in an upland winter wheat field. J. Plant Ecol. 2014, 7, 39–50. [Google Scholar] [CrossRef]
  28. Yin, S.; Wang, C.; Jin, Y.; Zhou, Z. Changes in soil-microbe-exoenzyme C:N:P stoichiometry along an altitudinal gradient in Mt. Datudingzi, Northeast China. Chin. J. Plant Ecol. 2019, 43, 999–1009. (In Chinese) [Google Scholar] [CrossRef]
  29. Chen, F.; Liu, F.; Bai, X.; Wu, L.; Chen, Z. Spatial heterogeneity and ecological stoichiometry characteristics of soil carbon, nitrogen and phosphorus under different micro-geomorphology in karst mountains. Acta Ecol. Sin. 2022, 42, 10201–10213. (In Chinese) [Google Scholar]
  30. Bui, E.N.; Henderson, B.L. C:N:P stoichiometry in Australian soils with respect to vegetation and environmental factors. Plant Soil 2013, 373, 553–568. [Google Scholar] [CrossRef]
  31. Black, C.; Goring, C. Organic Phosohorus in Soils. Agronomy 1953, 1, 123–152. [Google Scholar]
  32. Mazzarino, M.J.; Szott, L.; Jimenez, M. Dynamics of soil total C and total N microbial biomass, and water-soluble C in tropical agroecosystems. Soil Biol. Biochem. 1993, 25, 205–214. [Google Scholar] [CrossRef]
  33. Makino, W.; Cotner, J.B.; Sterner, R.W.; Elser, J.J. Are Bacteria More Like Plants or Animals? Growth Rate and Resource Dependence of Bacterial C:N:P Stoichiometry. Funct. Ecol. 2003, 17, 121–130. [Google Scholar] [CrossRef]
  34. Cleveland, C.C.; Liptzin, D. C:N:P stoichiometry in soil: Is there a “Redfield ratio” for the microbial biomass? Biogeochemistry 2007, 85, 235–252. [Google Scholar] [CrossRef]
  35. Xue, H.L.; Lan, X.; Liang, H.G.; Zhang, Q. Characteristics and Environmental Factors of Stoichiometric Homeostasis of Soil Microbial Biomass Carbon, Nitrogen and Phosphorus in China. Sustainability 2019, 11, 2804. [Google Scholar] [CrossRef]
  36. Xiang, Y.; Chen, S.; Pan, P.; Ouyang, X.; Ning, J.; Li, Q. Stoichiometric traits of C, N and P of leaf-litter-soil system of Pinus massoniana forest. J. For. Environ. 2019, 39, 120–126. (In Chinese) [Google Scholar]
  37. Beugnon, R.; Bu, W.S.; Bruelheide, H.; Davrinche, A.; Du, J.; Haider, S.; Kunz, M.; Oheimb, G.V.; Garcia, M.D.P.; Saadani, M.; et al. Abiotic and Biotic Drivers of Tree Trait Effects On Soil Microbial Biomass and Soil Carbon Concentration. Ecol. Monogr. 2023, 93, e1563. [Google Scholar] [CrossRef]
  38. Kumar, U.; Kaviraj, M.; Panneerselvam, P.; Nayak, A.K. Conversion of Mangroves into Rice Cultivation Alters Functional Soil Microbial Community in Sub-humid Tropical Paddy Soil. Front. Environ. Sci. 2022, 10, 858028. [Google Scholar] [CrossRef]
  39. Li, S.; Cui, Y.; Sun, Z.; Liu, H.; Ye, H. Effect of grazing exclusion on soil organic carbon and stoichiometry characteristics of soil microbiall biomass in sagebrush desert. Acta Prataculturae Sin. 2023, 32, 58–70. (In Chinese) [Google Scholar]
  40. Feng, E.P.; Zhang, L.W.; Kong, Y.H.; Xu, X.K.; Wang, T.; Wang, C.F. Distribution Characteristics of Active Soil Substances along Elevation Gradients in the Southern of Taihang Mountain, China. Forests 2023, 14, 370. [Google Scholar] [CrossRef]
  41. Ren, C.J.; Zhao, F.Z.; Kang, D.; Yang, G.H.; Han, X.H.; Tong, X.G.; Feng, Y.Z.; Ren, G.X. Linkages of C:N:P stoichiometry and bacterial community in soil following afforestation of former farmland. Forest Ecol. Manag. 2016, 376, 59–66. [Google Scholar] [CrossRef]
Figure 1. Location of the study area in Mount Fanjing. Ⅰ, C. fargesii; Ⅱ, C. multiervis; Ⅲ, C. argyrotricha; Ⅳ, R. argyrophyllum.
Diversity 16 00249 g001
Figure 2. SOC, TN, and TP stoichiometric indexes of 0–20 cm and 20–40 cm soil layers in four forest types. Ⅰ, C. fargesii; Ⅱ, C. multiervis; Ⅲ, C. argyrotricha; Ⅳ, R. argyrophyllum. A of X-axis, 0–20 cm soil layer; B of X-axis, 20–40 cm soil layer. Subfigure (A), content of SOC; subfigure (B), content of TN; subfigure (C), content of TP; subfigure (D), ratio of C:N; subfigure (E), ratio of C:P; subfigure (F), ratio of N:P. Different lowercase letters indicate significant differences at p < 0.05 among the 20–40 cm soil layer in four forest types; different uppercase letters indicate significant differences at p < 0.05 among the 0–20 cm soil layer in four forest types. * indicates significant differences between the 0–20 cm soil layer and 20–40 cm soil layer at the same forest type (p < 0.05).
Diversity 16 00249 g002
Figure 3. Carbon, nitrogen, and phosphorus stoichiometric indexes of the microbial biomass of the 0–20 cm and 20–40 cm soil layers in four different forest types. Ⅰ, C. fargesii; Ⅱ, C. multiervis; Ⅲ, C. argyrotricha; Ⅳ, R. argyrophyllum. A of X-axis, 0–20 cm soil layer; B of X-axis, 20–40 cm soil layer. Subfigure (A), content of MBC; subfigure (B), content of MBN; subfigure (C), content of MBP; subfigure (D), ratio of MBC:MBN; subfigure (E), ratio of MBC:MBP; subfigure (F), ratio of MBN:MBP. Different lowercase letters indicate significant differences at p < 0.05 among the 20–40 cm soil layers in four forest types. Different uppercase letters indicate significant differences at p < 0.05 among 0–20 cm soil layers in four forest types. * indicates significant differences between the 0–20 cm soil layer and 20–40 cm soil layer within the same forest type at p < 0.05.
Diversity 16 00249 g003
Figure 4. Pearson’s correlation heatmap of between soil microbial biomass carbon, nitrogen, and phosphorus and its ecostoichiometric ratio in the 0–20 cm soil layer (A) and 20–40 cm soil layer (B). Note: * represents significant difference at 0.05 level; ** represents significant difference at 0.01 level; the number axis represents the magnitude of the correlation coefficient value, where red denotes a positive correlation and blue denotes a negative correlation.
Diversity 16 00249 g004
Figure 5. Biplots of redundancy analysis. Note: Biplots of redundancy analysis to show associations between environmental variables and C:N:P ecological stoichiometry in soil and microbial biomass of 0–20 cm (A) and between environmental variables and C:N:P ecological stoichiometry in soil and microbial biomass of 20–40 cm (B). Arrows pointing in the same direction indicate variables that are positively correlated, whereas arrows pointing in opposite directions indicate variables that are negatively correlated. Abbreviations: FT, forest type; SWF, water accommodated fraction; AT, altitude; AS, aspect; SL, slope; SOC, soil organic carbon; TN, total nitrogen; TP, total phosphorus; MBC, microbial biomass C; MBN, microbial biomass N; MBP, microbial biomass P.
Diversity 16 00249 g005
Table 1. Basic information of the sample plots.
Sample Sample SizeAltitudeSlope AspectSoil TypeConstructive Species
I30 m × 30 m (n = 3)634–637E86°Cab Udi Orthic EntisolsCastanopsis fargesii;
Castanopsis carlesii (Hemsl.)Hay.
30 m × 30 m (n = 3)812–816SE125°Cab Udi Orthic EntisolsCastanopsis fargesii
II30 m × 30 m (n = 3)1652–1654N340°Cab Udi Orthic EntisolsCyclobalanopsis multinervis W. C. Cheng et T. Hong; Quercus engleriana Seem.
30 m × 30 m (n = 3)1817–1824NW303°Cab Udi Orthic EntisolsCyclobalanopsis multinervis W. C. Cheng et T. Hong; Betula austrosinensis Chun ex P. C. Li
III30 m × 30 m (n = 3)1804–1807SW221°Cab Udi Orthic EntisolsAcer sinense Pax
30 m × 30 m (n = 3)2061–2063E111°Fec Hydragric AnthrosolsAcer sinense; Pax Cyclobalanopsis multinervis W. C. Cheng et T. Hong
IV30 m × 30 m (n = 3)2336–2339NW312°Fec Hydragric AnthrosolsRhododendron argyrophyllum Franch.
30 m × 30 m (n = 3)2350–2352W266°Fec Hydragric AnthrosolsRhododendron leishanicum Fang et X. S. Zhang ex Chamb.
Table 2. Two-way ANOVA of soil microbial biomass and their stoichiometric ratios (F-value).
Forest TypeSoillayerForest Type * Soillayer
Soil propertiesSOC5.204 **44.135 **5.387 **
TN5.816 **31.429 **1.435
TP20.421 **40.09 **0.944
C:N26.503 **2.2511.09
C:P11.043 **22.919 **4.795 **
N:P9.877 **20.951 **1.976
WAF3.019 *0.6734.74 *
ph22.593 **22.151 **1.916
Microbial biomassMBC3.12 *3.2060.427
MBN0.5312.0662.13
MBP0.8440.8350.625
MBC:MBN1.4898.3060.251
MBC:MBP3.743 *3.1860.231
MBP:MBN0.560.9542.092
Note: SOC, soil organic carbon; TN, total nitrogen; TP, total phosphorus; MBC, microbial biomass C; MBN, microbial biomass N; MBP, microbial biomass P.; * and ** represent significant differences at 5% and 1% levels, respectively.
Table 3. Results of redundancy analysis variance partitioning of environmental factors with soil-microbial biomass carbon, nitrogen, and phosphorus and its ecostoichiometric ratio.
ItemSoil LayerAxis 1Axis 2Axis 3Axis 4Total Variance
EigenvaluesA0.4080.1730.0710.0191
B0.3750.1440.0760.0051
Species–environment correlationsA0.8890.7970.7750.620
B0.9090.7020.7110.356
CV of species data (%)A40.858.165.267.2
B37.551.959.560.0
CV of species–environment relationship (%)A60.686.396.999.7
B62.186.098.699.4
Sum of all eigenvaluesA/B 1
Variance explained by all variablesA 0.69
B 0.62
Variance explained by selected variablesA 0.66
B 0.60
Forward selection of variables RDA 1RDA 2F valuep valueExtra fit
AspectA−0.1644−0.61303.650.022 *0.14
B−0.35470.16575.310.004 **0.14
AltitudeA0.1800−0.10814.200.029 *0.14
B0.26400.00174.710.011 *0.15
SWFA−0.42830.161711.630.001 **0.26
B0.04660.34253.100.041 *0.08
SlopeA−0.33970.48853.760.003 **0.07
B0.50330.36644.190.007 **0.16
Forest typeA0.0241−0.01112.800.024 *0.05
pHB0.2809−0.13113.170.039 *0.07
CV, cumulative variance. ** significant at p < 0.01; * significant at p < 0.05. A, 0–20 cm soil layer; B, 20–40 cm soil layer.
Disclaimer/Publisher’s Note: The statements, opinions and data contained in all publications are solely those of the individual author(s) and contributor(s) and not of MDPI and/or the editor(s). MDPI and/or the editor(s) disclaim responsibility for any injury to people or property resulting from any ideas, methods, instructions or products referred to in the content.

