Article

Effects of Different Thinning Intensities on Carbon Storage in Pinus koraiensis Middle-Aged Plantations in Northeast China

1
College of Forestry, Northeast Forestry University, Harbin 150040, China
2
Key Laboratory of Sustainable Forest Ecosystem Management-Ministry of Education, Northeast Forestry University, Harbin 150040, China
3
Feline Research Center of National Forestry and Grassland Administration, College of Wildlife and Protected Area, Northeast Forestry University, Harbin 150040, China
4
State Forestry and Grassland Administration Engineering Technology Research Center of Korean Pine, Harbin 150040, China
*
Author to whom correspondence should be addressed.
Forests 2024, 15(5), 738; https://doi.org/10.3390/f15050738
Submission received: 17 March 2024 / Revised: 20 April 2024 / Accepted: 22 April 2024 / Published: 24 April 2024
(This article belongs to the Special Issue Silviculture and Management Strategy in Coniferous Forests)

Abstract

:
Forest ecosystems are essential to the global carbon cycle because they are the biggest terrestrial carbon reserves. In the management of forests, thinning is a commonly employed strategy, impacting the respiration and biomass loss of trees, thereby modifying forest carbon dynamics. However, there is a lack of scientific research to confirm the impacts of thinning intensities on carbon storage in trees, soil layers, shrubs, and ground vegetation layers as well as its impact on wood production and growth rate. The goal of this study was to find the optimal thinning levels for increasing carbon sequestration during the growth stage of the Korean pine (Pinus koraiensis) middle-aged plantations in Northeast China. In this study, thinning intensity (0, 10, 11, 16, 18, and 22%) affected the carbon storage of trees, tree growth, volume, and, we suspected, soil layer, shrubs, and vegetation (herbs, litter, and grass) also. Specifically, after four years of thinning, the 18% treatment significantly increased total carbon storage, individual organ storage, growth, and tree volume (p < 0.05). These results give us abundant information about how thinning affects the dynamics of carbon storage, wood production, and the interactions between soil and plants in P. koraiensis plantations, contributing to multi-objective management strategies for optimizing carbon sequestration, wood production, and ecosystem health.

1. Introduction

The forest is the most valuable terrestrial ecosystem and plays a crucial role in maintaining rural livelihoods, preserving ecology, and storing carbon [1,2,3] as it represents the planet’s largest carbon sink and carbon pool [4]. Forests contribute 861 ± 66 Pg to the global carbon stock and a sink rate of 2.4 ± 0.4 Pg per year, warranting it essential in the climate change mitigation efforts [2,5,6]. In addition to meteorological and geographic elements and vegetation characteristics, a forest’s capacity to store carbon varies on its structure, forest cover, biodiversity, density, and management practices [7,8]. Concerns about climate change and global warming have increased interest in terrestrial carbon sequestration as a way to look into potential mitigation strategies [9]. Mitigating global climate change can be achieved primarily through increasing the capacity to absorb CO2 from the atmosphere and, moreover, reducing CO2 emissions. Various forest management practices can improve soil carbon input [10,11] and raise forest productivity, which in turn can improve the capacity of stable carbon pools to store carbon and reduce the effects of global warming.
Thinning is the method of forest management that is most frequently used to control plantation development [12,13]. It affects the respiration and biomass loss of trees, which alter the carbon dynamics in forests. Additionally, over a number of years, the removal of aboveground trees alters the way organic matter decomposes in the soil [14,15,16,17]. Thinning can also increase light availability in forest stands and speed up litter decomposition by decreasing the density at the canopy level. Under some thinning procedures, this may result in greater carbon storage in the herb and shrub layers [18]. A thinning intensity of 20%–25% can successfully reduce the depletion of organic carbon in seasonal freeze–thaw forest settings [19]. By improving light availability and lowering competition from overstory trees, thinning can also promote the growth of understory vegetation [20].
The majority of research on thinning currently concentrates on its effects on soil nutrients [21], forest products [22], and understory plant species diversity [23]. However, the effect on forest carbon sequestration has received less attention. The primary method for maximizing forest structure and raising the productivity and quality of forests is through thinning [24]. In order to improve standing trees’ competitiveness, growth, and general health, thinning controls how growing space is distributed [25]. Simultaneously, thinning management offers an option for wood production, which helps lessen the strain from logging and prevents further degradation and deforestation [26]. Moreover, thinning can be accomplished by clearing unhealthy or dead trees, reducing the initial stand density and significantly enhancing the growth of the trees that are kept [27].
The 8th China Forest Resources Inventory [28] states that China has 21.6% of the total land area covered by forest, approximately 208 million hectares of total forest area. Of this, 122 million hectares, or 58.6%, is covered by natural forests. The effects of thinning on trees, shrubs, herbs, and soil on an ecosystems’ ability to store carbon are still not well understood in particular regions like northeastern China, which is China’s largest forest region and may be the area most affected by global warming [29]. Scientific studies are needed to test the effects of global warming on soil, shrubs, and tree carbon storage. In order to maximize carbon sequestration throughout the growth stage and provide a basis for enhancing carbon storage density in multi-objective management, this study looks into how thinning affects carbon storage inside the Pinus koraiensis plantation and determines the ideal thinning intensities.
In this study, a 42-year-old Korean pine plantation was studied based on six thinning intensities in Qingping Forest Farm in Northeastern China to (1) evaluate the carbon stock density in stands with different thinning intensities; (2) assess carbon stock density in the shrub, herb, and litter layers; (3) examine the total carbon stock of the soil in different layers with different thinning intensities; and (4) calculate wood production across stands with different thinning intensities. We calculated the forest carbon storage of the plot, which provides the scientific basis for forest thinning management to increase forest carbon sequestration.

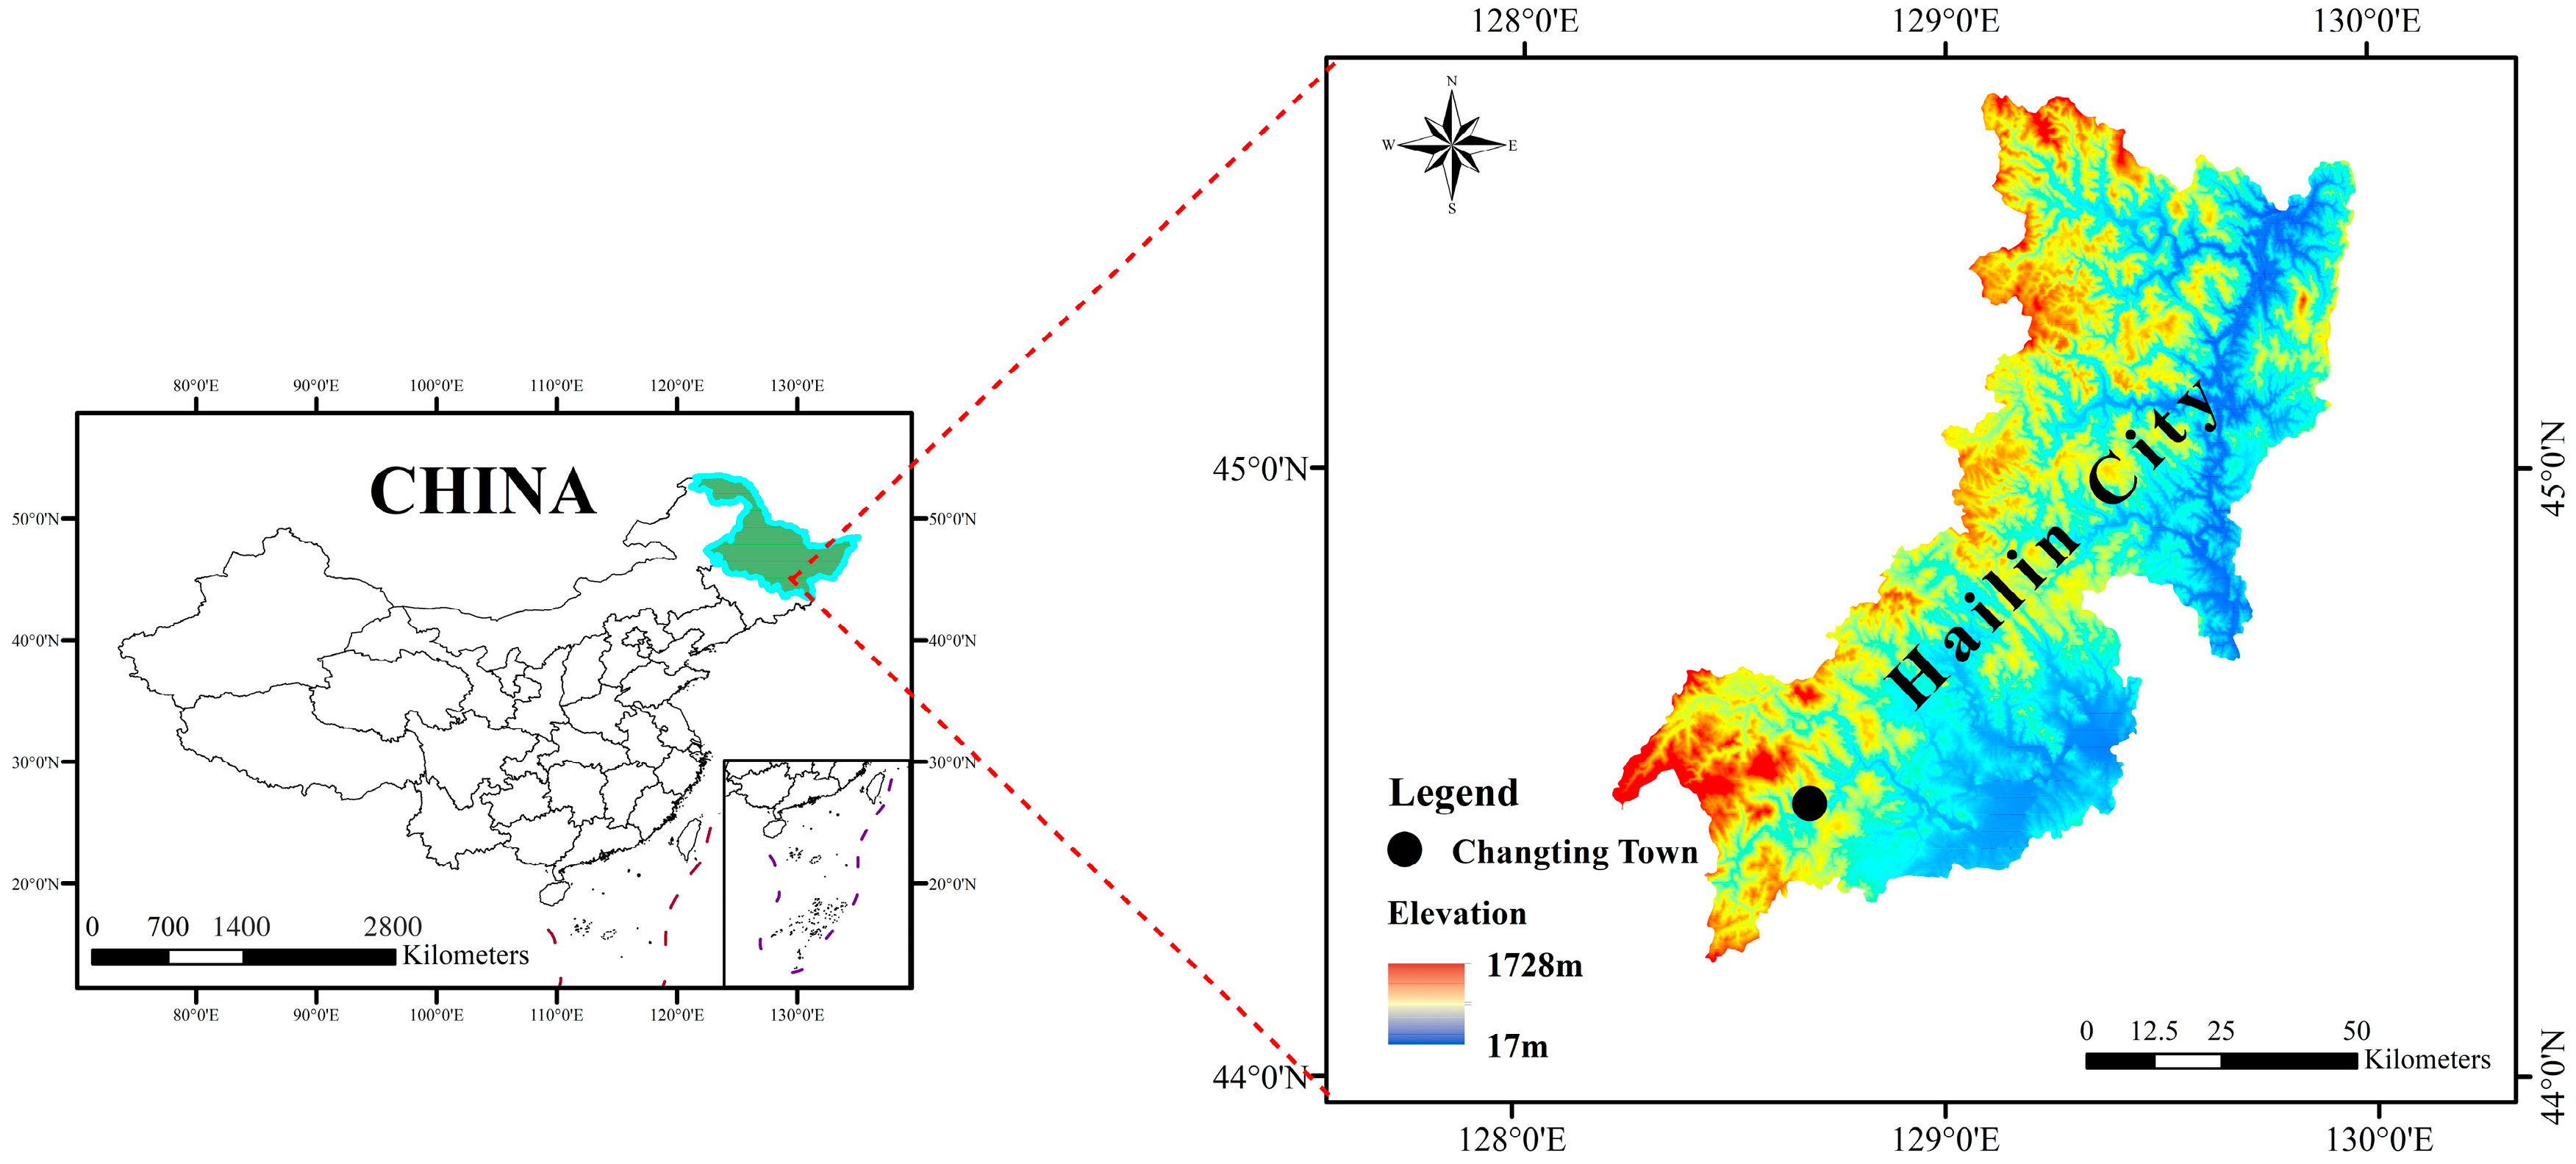
2. Materials and Methods

Qingping Forest Farm, Changting Town, is situated in the southwest of Mudanjiang City, Hailin City, Heilongjiang Province, China (128°02′–129°01′ E, 44°03′–44°41′ N) (Figure 1). The site slope is 11° on average with an elevation of 508 m. Annual precipitation varies between 500 and 1100 mm. The lowest (−35 °C) and highest temperatures (33 °C) occur in January and July, respectively, with an average annual temperature of 2.7 °C. The climate is temperate continental monsoonal with dry, cold, windy, and snowy winters and cool, rainy, and humid summers. Snowfall is concentrated in December and January with ground snow thickness ranging from 30 to 60 cm and up to 120 to 180 cm in deep mountainous areas.

2.1. Experimental Procedures

In the Qingping Forest Farm, we randomly arranged five experimental cultivated plots with thinning intensities of 10% (F1), 11% (F2), 16% (F3), 18% (F4), and 22% (F5), along with one uncultivated control plot with zero thinning (CK, 0%). Each plot had an area of 0.06 ha and was circular in shape. The major information of the species and the numbers of trees in each of the six plots is recorded in Table 1. We note that, although stand density was not equal in the sample plots before thinning, all plots, including the control plot, had almost the same parameters, such as gradient, slope, aspect, stand type, temperature, moisture, elevation, and precipitation, not least of all because the sample plots were close to each other.
Inside the plot, we collected samples of soil, shrubs, and vegetation (herbs, litter, and grasses). Various tools, such as a compass, ultrasonic altimeter, and DBH tape, were utilized to accurately measure tree height and diameter at breast height of all trees in a plot. Tree density was calculated by dividing the total number of trees by the area. All tree carbon data were determined by an analysis of the carbon stock density of each organ as per ref. [30] (Table 2).

2.2. Soil Collection

In the autumn of 2023, soil samples were taken at three soil depths, 0–20 cm, 20–40 cm, and 40–60 cm, randomly from five points in each plot using a soil trowel.

2.3. Soil Bulk Density Calculation

For bulk density, soil was collected from the three soil depths of 0–20 cm, 20–40 cm, and 40–60 cm randomly from five points in each plot. Bulk density cores were collected using a 100 cm3 ring corer from these three depths at the five random points. A knife was used to ensure that the soil surface was flat before sampling and then to remove excess soil protruding the ring corer. The dry soil weight (g) was divided by soil volume (100 cm3); the average of the five soil bulk densities per grid cell was used for further analyses.

2.4. Vegetation Sample Collection

We assessed both shrubs and vegetation during the field survey. In the big circular plot, five 5 m × 5 m shrub quadrats were selected (four quadrats at the corner and one at the center of the plot). Similarly, within the shrub quadrats, 1 m × 1 m vegetation quadrats were established. We collected shrubs from each of the five shrub quadrats (Figure 2).
Vegetation was collected in three layers (upper, middle, and below). Following the determination of vegetation depth, surface litter, herbs, and grasses within each vegetation quadrat were meticulously gathered in the upper layer. In the middle layer, leaf litter was taken (hummus layer). In the lower layer, we took a hummus/soil mix. The vegetation samples from each layer were then combined per shrub quadrat (n = 3) and dried for 2–3 days in the oven at 65 °C. All plant and litter samples underwent subsequent weighing. This methodology ensured a comprehensive and accurate assessment of both aboveground and belowground biomass, contributing valuable data to the study’s ecological insights.

2.5. Determination of Conventional Soil and Vegetation Total Carbon

For the soil total carbon determination, we kept the soil over a 24 h drying period at room temperature. Following this, 50 mg of powdered soil samples were weighed, wrapped in tinfoil paper, and prepared for determination. Subsequently, an elemental analyzer (Vario MACRO cube, Elementary Analyses System GmbH, Langenselbold, Germany) was utilized to provide the soil’s carbon content [33]. For the purpose of determining the vegetation carbon content, the collected samples underwent a 105 °C oven-drying process for 24 h, followed by sieving (0.15 mm). Subsequently, 25 mg of powdered vegetation samples were weighed, enveloped in tinfoil, and analyzed for carbon content using the Vario MACRO cube elemental analyzer [33].

2.6. Statistical Analyses

Our study design comprised plot-level and tree-level analyses. Plot-level included total carbon and total tree volume. Tree-level included DBH, height, and growth. In the plot-level analyses, tree-level data were summed and then divided by the area of the plot and converted into values per hectare. For the tree-level analyses, the values are given as mean values with their corresponding SD/SE.
In our analytical approach, we tested the normality of the dataset using the Shapiro–Wilk test. When the dataset was normally distributed, we employed one-way analysis of variance (ANOVA) and the post hoc Tukey test to discern significant differences. For data that were not normally distributed, we employed the Kruskal–Wallis test and Dunn’s test to discern significant differences among the variables. Statistical significance was determined with a threshold of p < 0.05. Statistical analyses were executed using RStudio, version 4.3.2.

3. Results

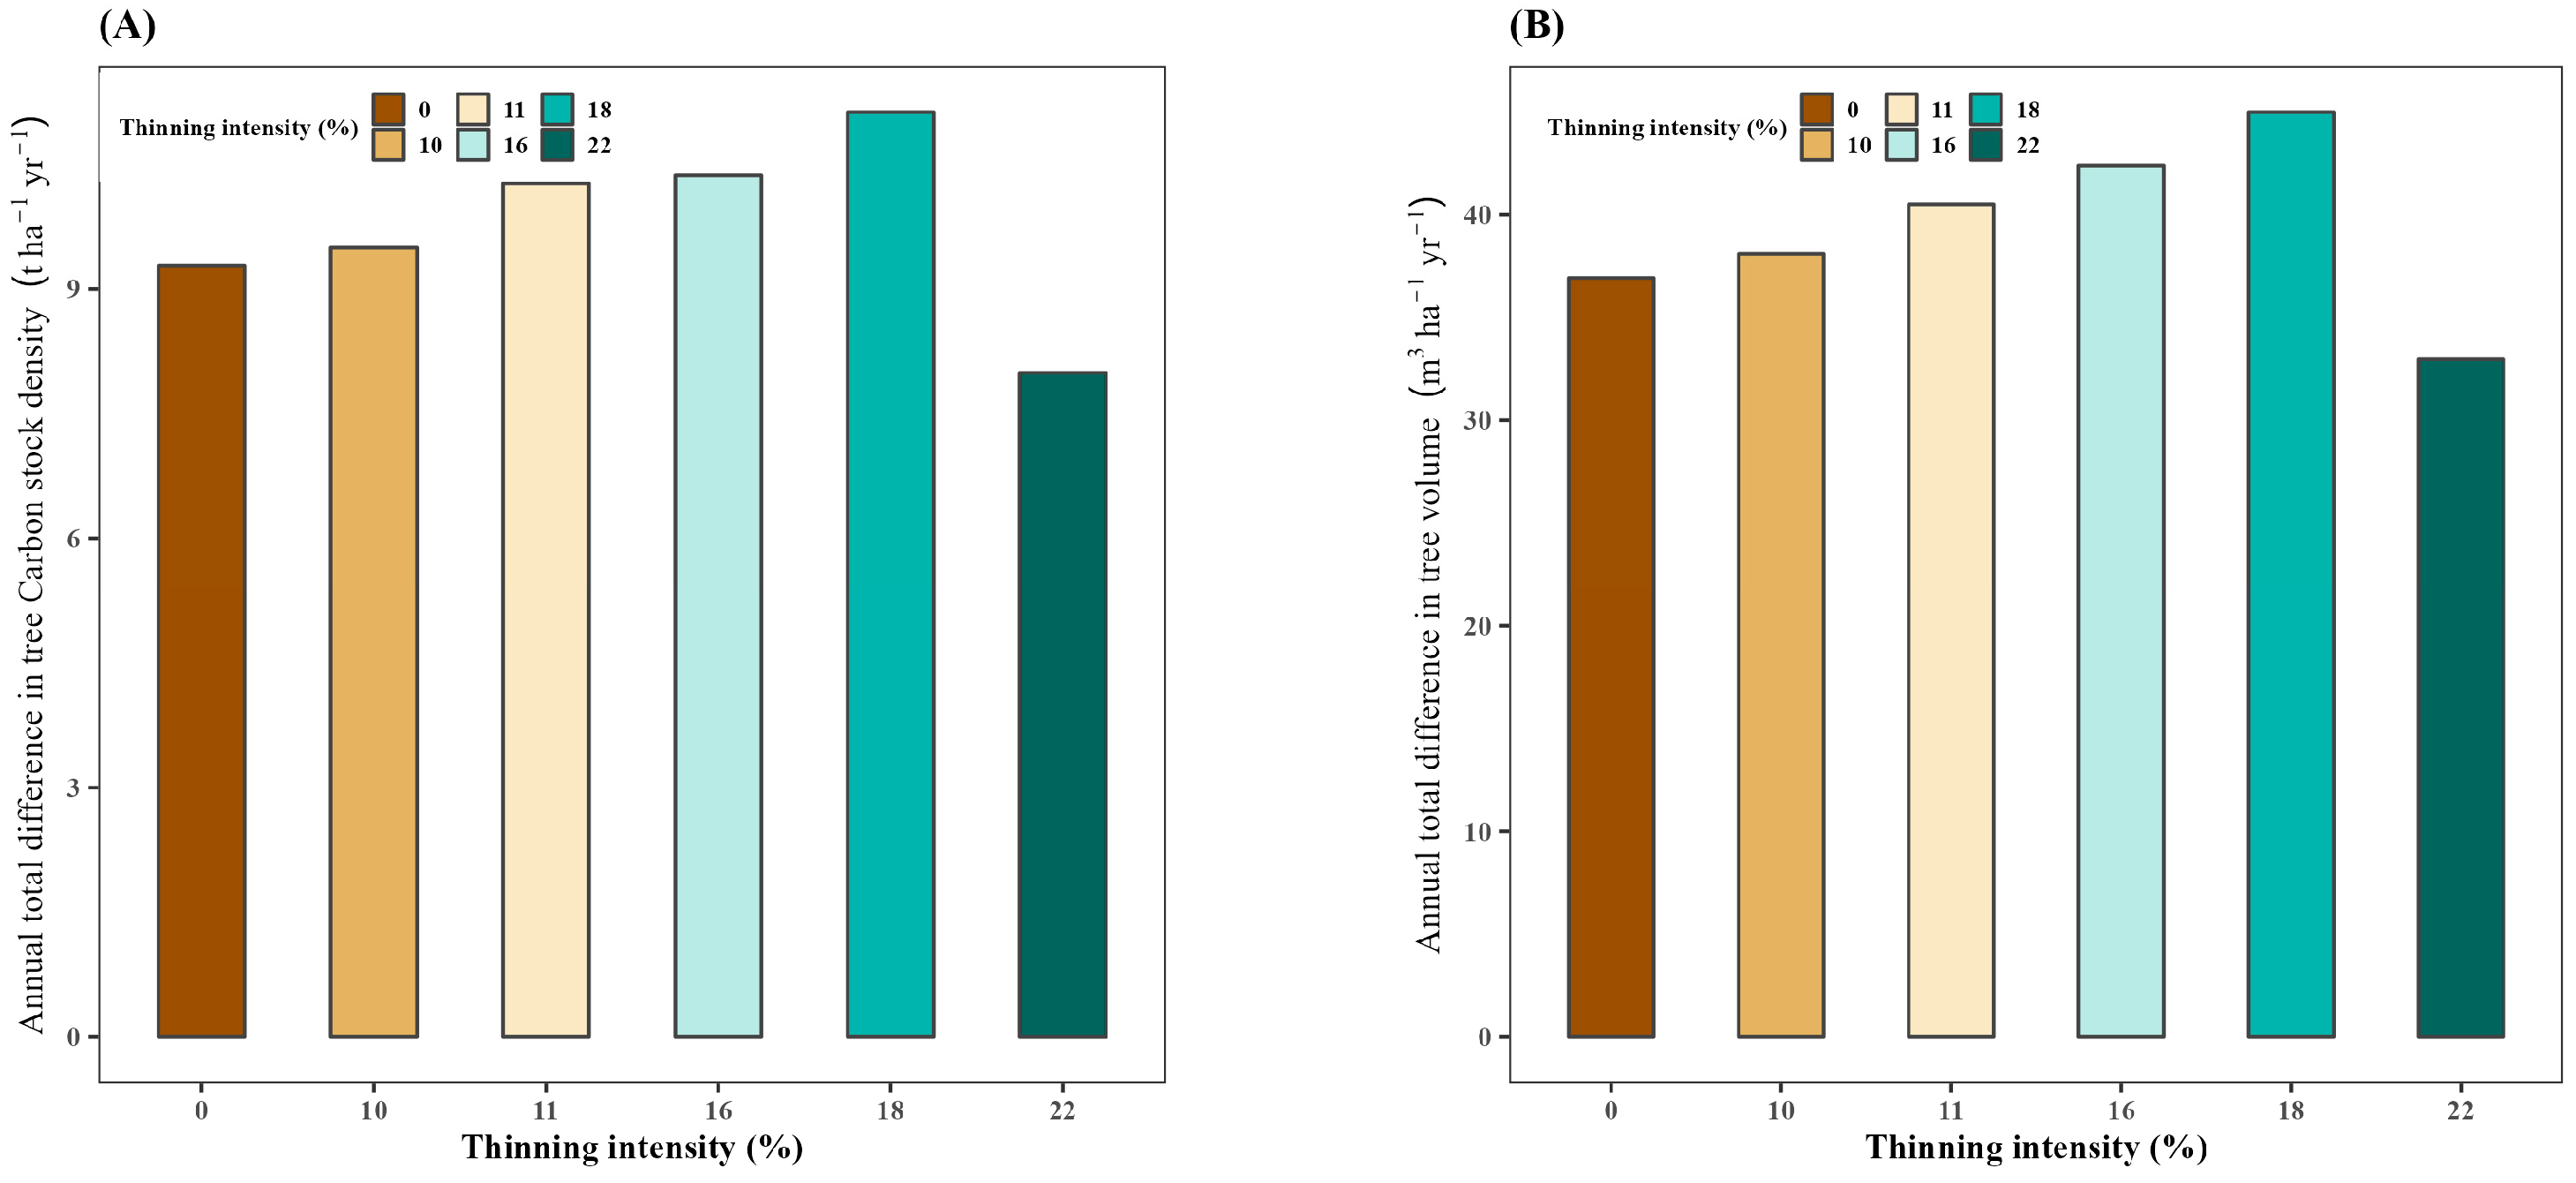
3.1. Effect of Thinning on Annual Total Difference in Tree Carbon Stock Density

After four years of thinning treatment, the annual total difference in tree carbon stock density increased with thinning intensity but increased slowly (Figure 3A and Figure S1). However, after 18% thinning, it decreased dramatically. The highest carbon density was found in the 18% thinned plot, followed by 16% > 11% > 10% > 0% > 22% (Table S1).

3.2. Effect of Thinning on Annual Total Difference in Tree Volume

The annual total difference in tree volume increased with the increase in thinning intensity (Figure 3B and Figure S1). Tree volume increased incrementally in all the thinning plots. The annual total difference in tree volume of each plot was different, ordered as 18% > 16% > 11% > 10% > 0% > 22%.

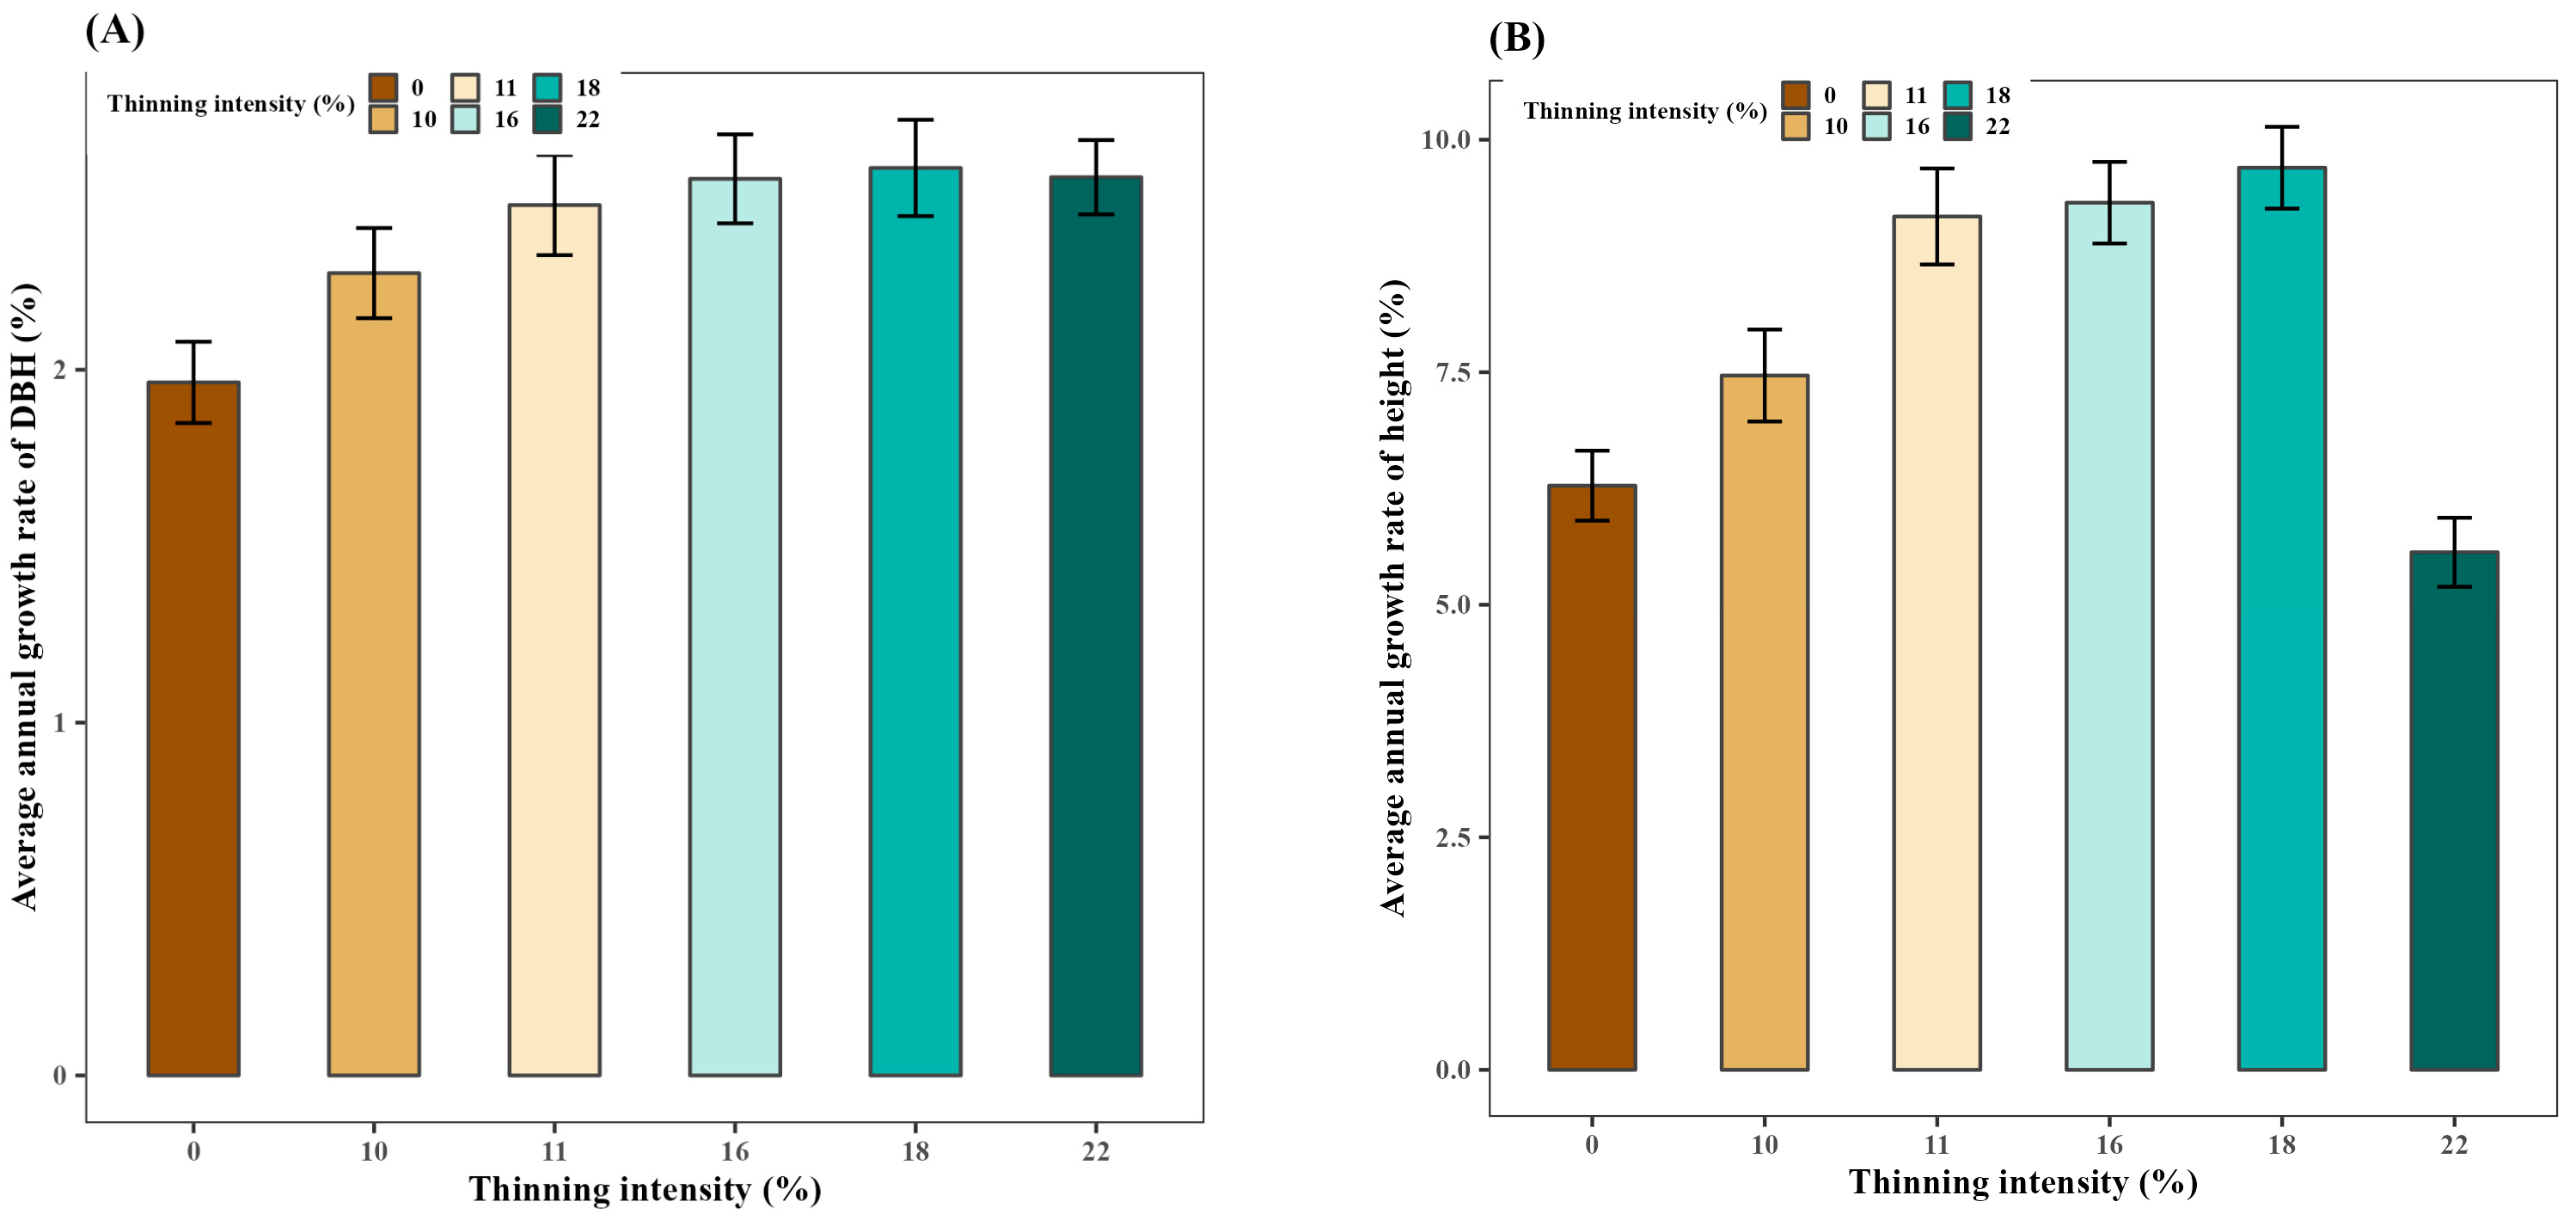
3.3. Effect of Thinning on the Average Annual Growth Rate of DBH and Height

The Kruskal–Wallis test showed that the annual growth rate based on DBH was significantly different between thinning plots (p < 0.001). Dunn’s test revealed significant differences in the annual growth rate of DBH among the different thinning intensities as CK~10%, p < 0.05; CK~11%, p < 0.01; CK~16%, p < 0.001; CK~18%, p < 0.001; and CK~22%, p < 0.001. Other pairwise comparisons had no significant differences (Figure 4A and Figure S2).
The Kruskal–Wallis test showed that the annual growth rate based on height was significantly different between thinning plots (p < 0.001). Dunn’s test revealed significant differences in the annual growth rate of height among the different thinning intensities as CK~10%, p < 0.05; CK~11%, p < 0.001; CK~16%, p < 0.001; CK~18%, p < 0.001; 10%~11%, p < 0.05; 10~16%, p < 0.01; 10%~18%, p < 0.01; 10%~22%, p < 0.01; 11%~22%, p < 0.001; 16%~22%, p < 0.001; and 18%~22%, p < 0.001. Other pairwise comparisons had no significant differences (Figure 4B and Figure S2). Among all of the thinned plots, 11%–18% had higher growth rates than the CK (0% thinning). At certain thinning intensities, the results suggested that the annual growth rates of DBH and height were positively affected after thinning.

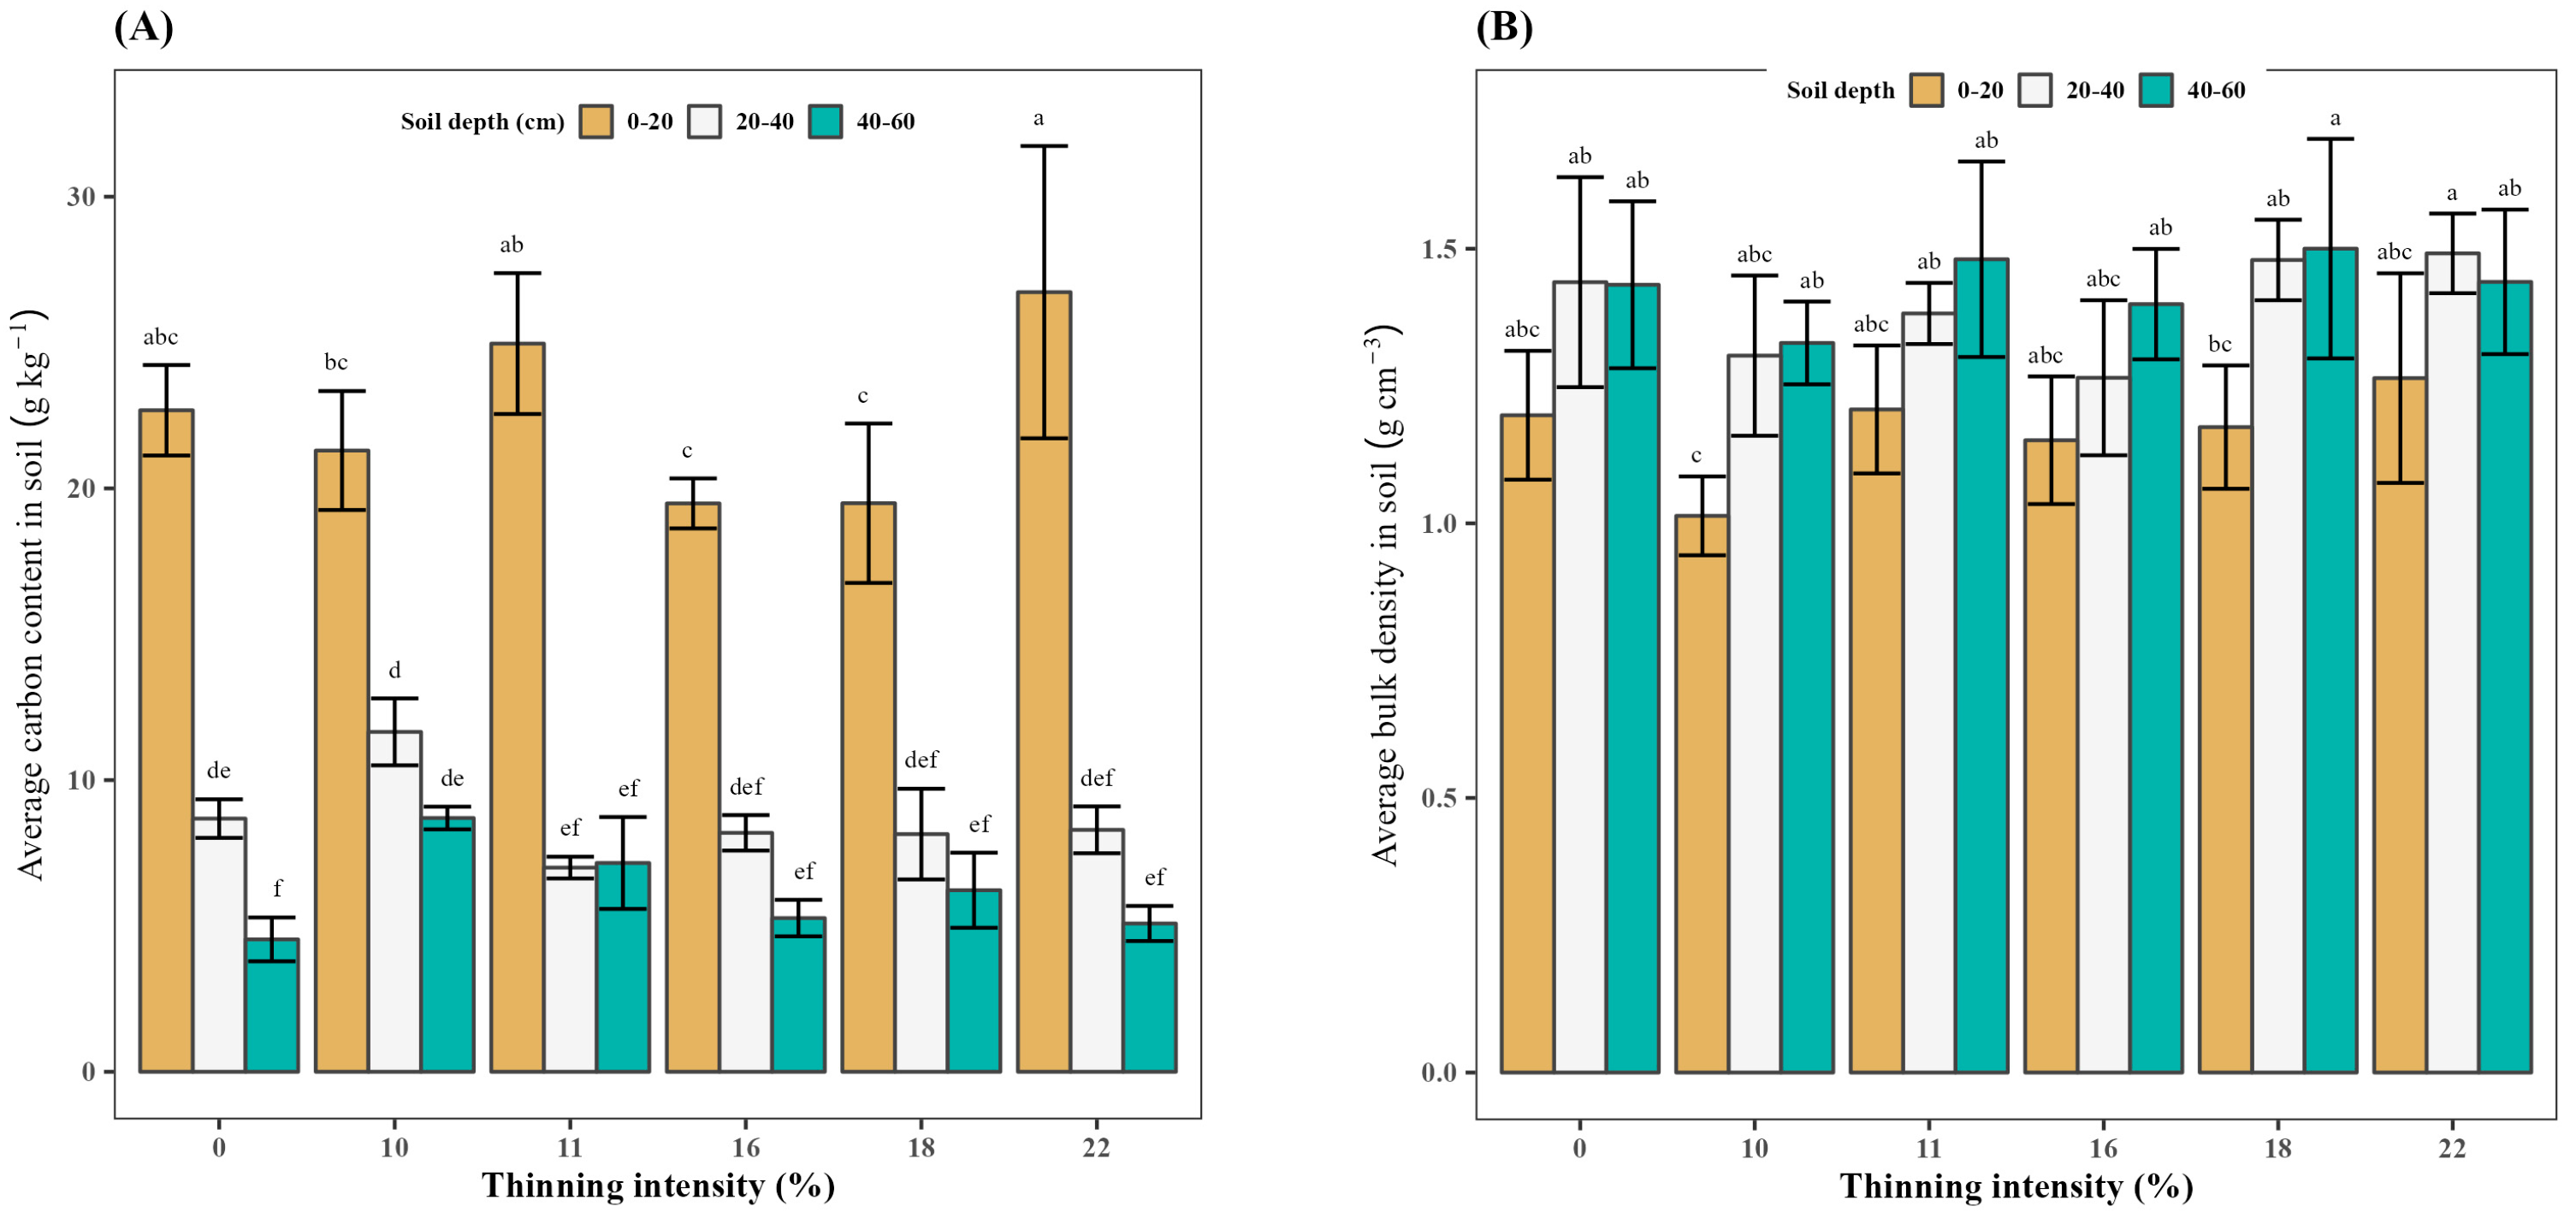
3.4. Effect of Thinning on the Average Carbon Content in Soil

There was no significant difference except for soil carbon in the 40–60 cm depth layer in the 10% thinning plot, which was significantly higher than in the control plot (p < 0.05, Figure 5A and Figure S3). The carbon content in the topsoil layer (0–20 cm) was 22% > 11% > 0% > 10% > 18% > 16%. In the 20–40 cm and 40–60 cm soil layers, the carbon content in the 10% thinning was higher than in other thinning intensities. In all thinning, the soil carbon content significantly decreased with increasing soil depth. The carbon content in the 40–60 cm soil layer was significantly lower than in the 0–20 cm soil layer. The variation (SD) in 18% thinning was bigger and more consistent across soil depths than the other thinning intensities.

3.5. Effect of Thinning on the Average Bulk Density in Soil

No statistically significant difference was observed in the soil profile following thinning treatments (p < 0.05, Figure 5B and Figure S4). The lowest average bulk density was observed in the 10% thinned plot in the 0–20 cm soil layer.

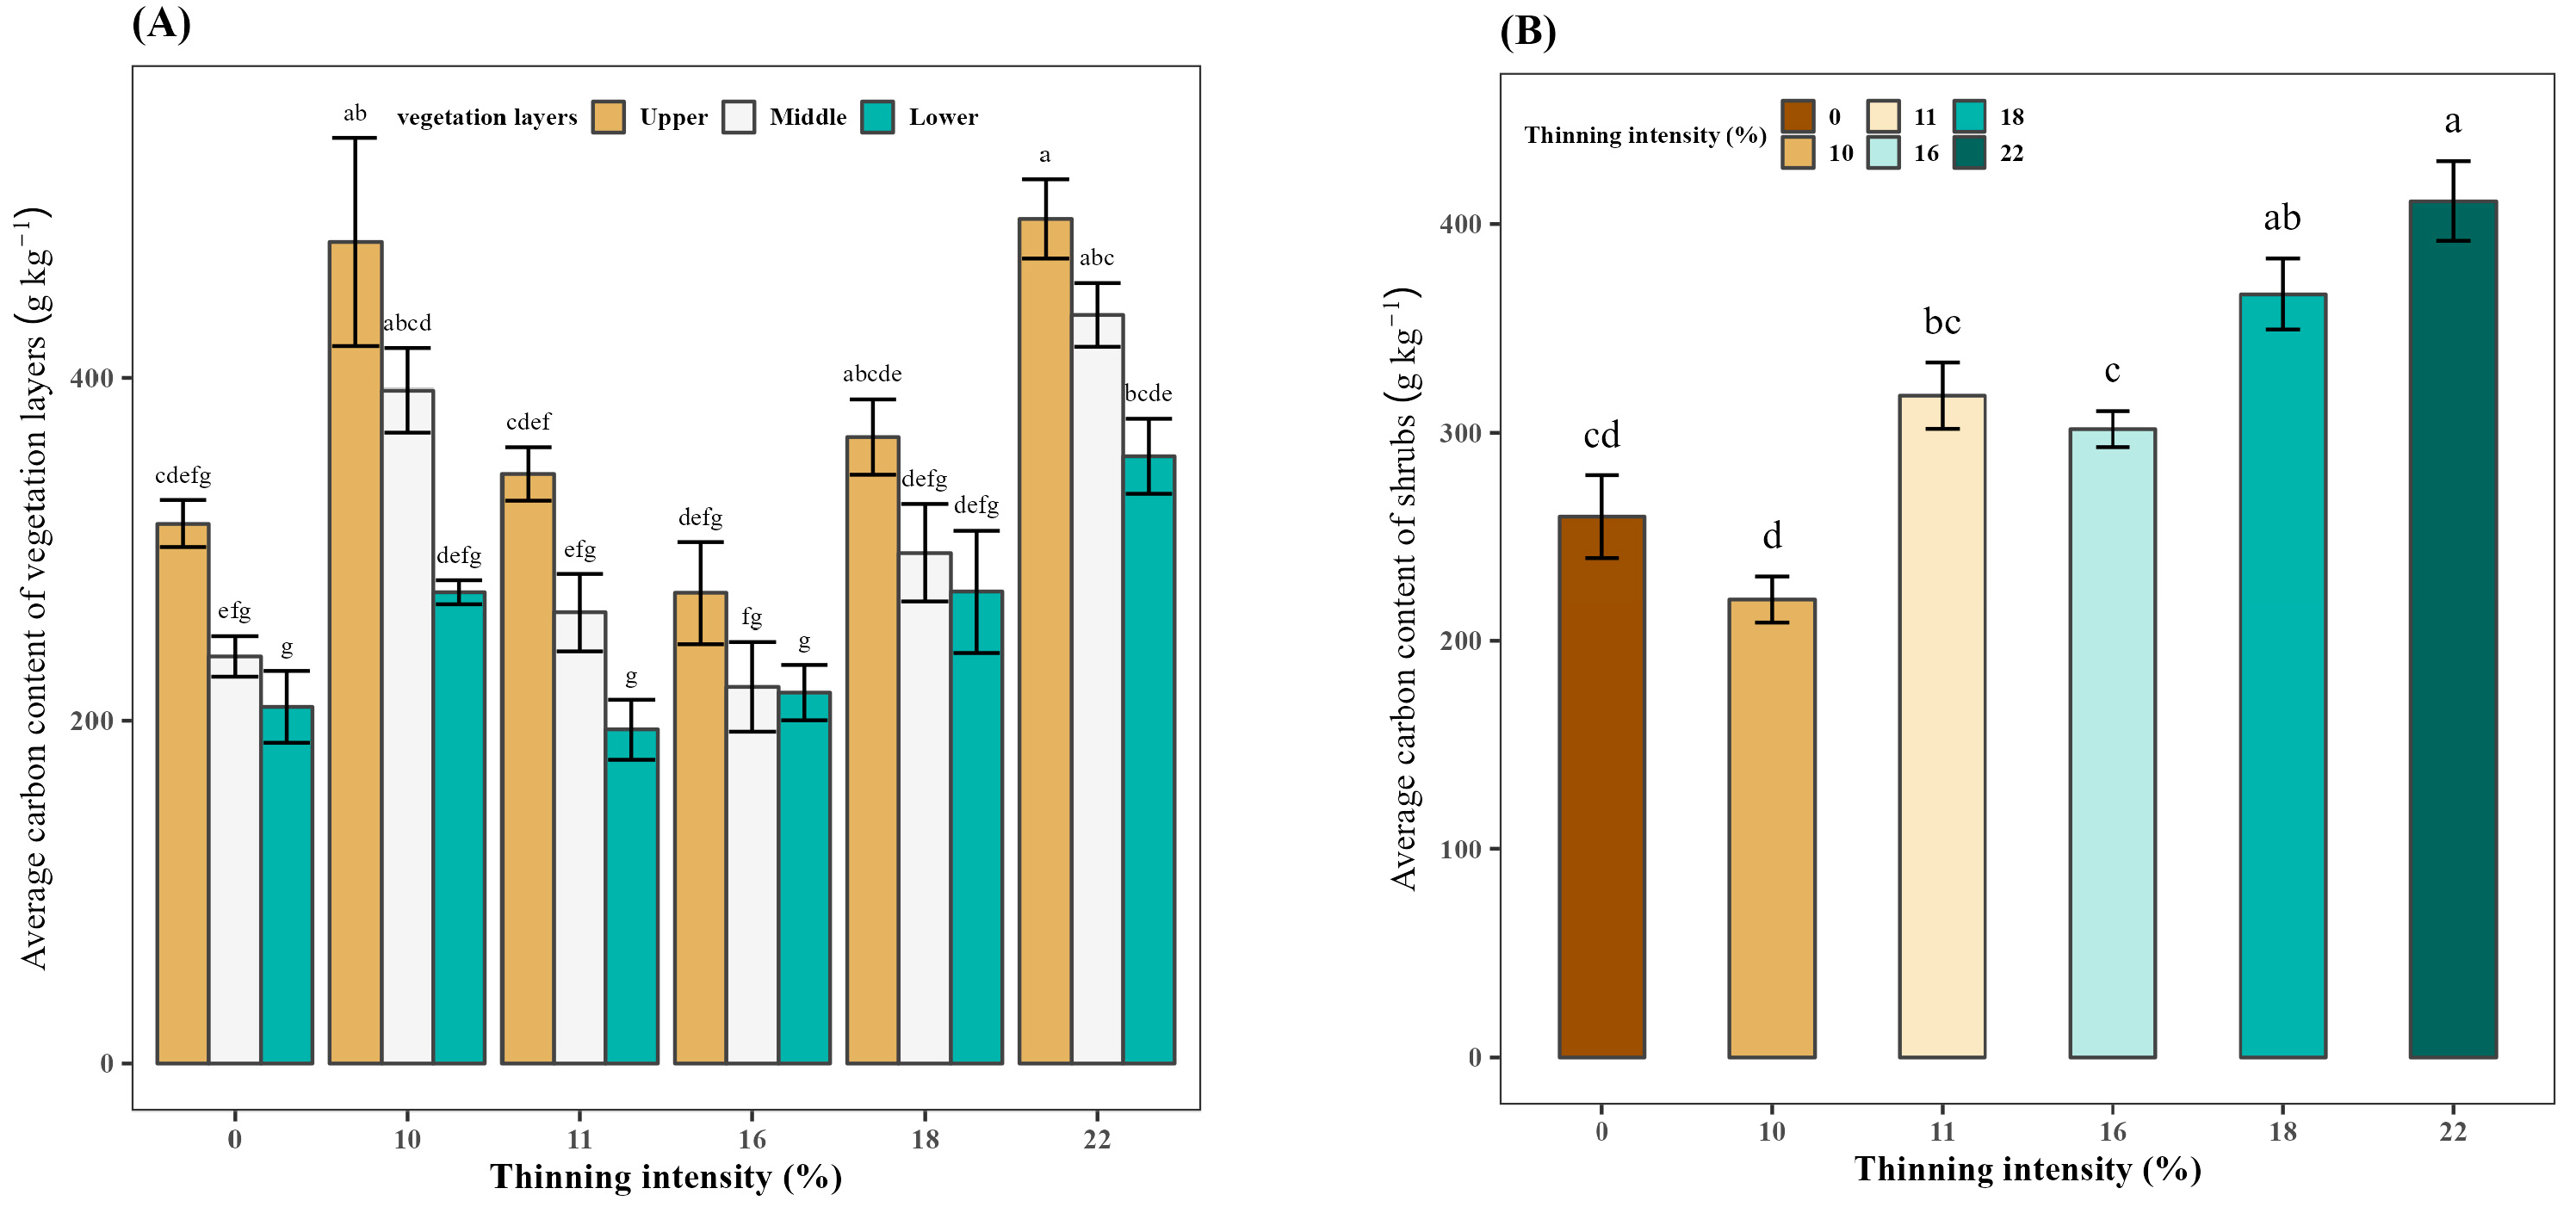
3.6. Effect of Thinning on the Average Carbon Content of Vegetation Layers

The carbon content varied significantly between different thinning intensities within the same vegetation layer (Figure 6A and Figure S5). The average carbon content in the vegetation layer in the 22% thinned plot was higher than in the CK (0% thinned), and both the 22% and 10% thinned plots had significantly higher carbon content in the upper and middle layers compared with the CK (p < 0.05). The order of average carbon content for all layers was 22% > 10% > 18% > 11% > 0% > 16%. In all plots, the vegetation carbon content significantly decreased with vegetation layer (upper > middle > lower). The variation (SE) in 18% thinning was more consistent than that observed in the other thinning intensities.

3.7. Effect of Thinning on the Average Carbon Content of Shrubs

The highest average carbon content in shrubs was in the 22% thinning treatment. There was a significant difference between the 22% thinned plot and the CK as well as between the 18% thinned plot and the CK (p < 0.05, Figure 6B and Figure S6). There were no significant differences between the 18% thinned plot and the 22% thinned plot. The carbon content in shrubs increased along the gradient of thinning intensity from 10% to 22% thinning.

3.8. Effect of Thinning on Carbon Storage of Tree Organs

This study investigated the impact of thinning on carbon storage in different parts of the tree. Four years after thinning, the total carbon storage and individual organ storage increased with thinning intensity (18% > 16% > 11% > 10% > 0% > 22%) (Table 3 and Table S7).
Examining the proportion of carbon storage in each organ, the stem consistently held the highest share, ranging from 89.91% to 90.42% of total carbon storage, across the different thinning treatments. The branches and roots followed, constituting 3.78% to 4.04% and 3.78% to 3.97%, respectively. The leaves accounted for 2.01% to 2.07% of total carbon storage (Table S7). The results suggested that thinning can alter the distribution of carbon in tree organs, shown at the 18% thinning intensity in which the stem and branch contributions were somewhat increased and decreased, respectively.
The thinning plots generally showed higher tree organ carbon content in 2023 compared to the control plot (CK), except for the 22% thinning plot where it was lower. Thinning altered the carbon content in different tree organs with varying effects depending on the thinning intensity. The results suggested an overall improvement of tree organ carbon content in the thinned plots, emphasizing the potential benefits of thinning on carbon storage dynamics in forest ecosystems.

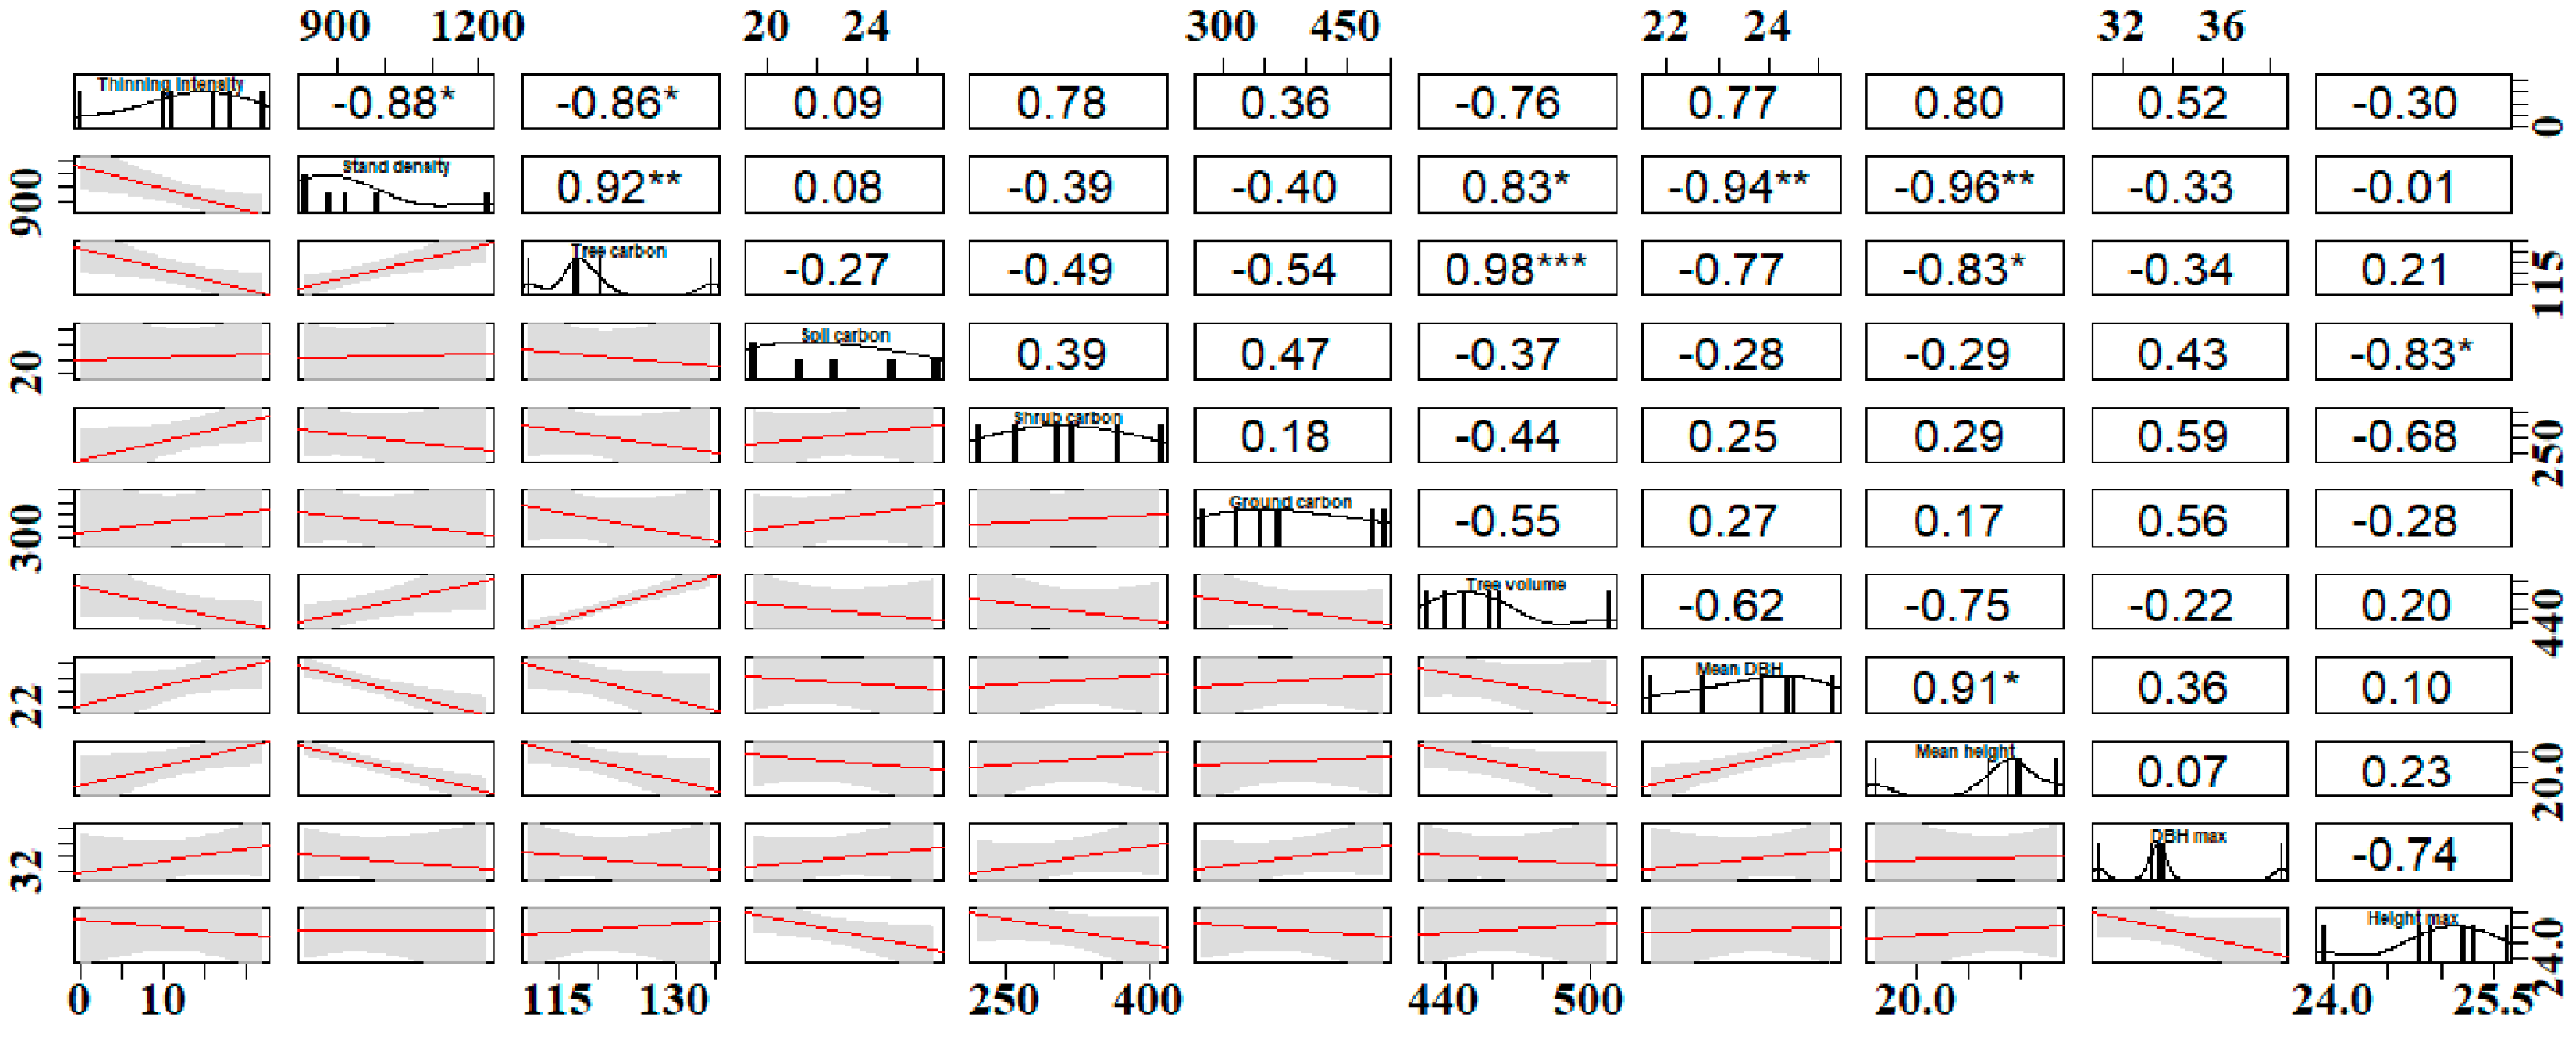
3.9. The Variation in Carbon Storage and Stand Factors

The thinning intensity had a significant negative correlation with tree carbon (r= −0.86, p < 0.05) and stand density (r= −0.88, p < 0.05), as we would expect; this also negates the concerns about tree density variation at the beginning of the experiment. Similarly, stand density had a significantly positive, high correlation with tree carbon (r = 0.92, p < 0.01) and tree volume (r = 0.83, p < 0.01) but a high, significantly negative correlation with mean tree DBH (r= −0.94, p < 0.01) and mean tree height (r= −0.96, p < 0.01). The tree carbon stock had a significantly positive, high correlation with tree volume (r = 0.98, p < 0.001) but a negative correlation with mean height (r = −0.83, p < 0.05). Likewise, soil carbon had a significantly negative correlation with maximum tree height (r = −0.83, p < 0.05). The mean DBH and mean height of trees were significantly positively correlated (r = 0.91, p < 0.05) (Figure 7).

4. Discussion

4.1. Effect of Thinning on Tree Carbon Storage

Our study’s findings indicate that, in comparison to the CK plot, the 18% thinned plot had a higher carbon stock within four years—the carbon content of the living biomass increased as a result of thinning. Following four years of thinning, as the severity of the thinning increased, the cumulative increase in carbon density rose until the 18% thinned plot, at which point it fell, achieving the maximum cumulative increment in the 18% thinned plot. Only this plot outperformed the other thinned plots in terms of carbon density. Another crucial element influencing the post-treatment carbon density growth response is the amount of time since thinning. The outcome demonstrated that, from the perspective of carbon accumulation, thinning is a technique with short-term positive outcomes [34].
Ming et al. [35] found that Masson pine forest’s tree pruning enhanced the trees capacity to store carbon. Similarly, Han et al. [36] discovered that, following thinning, Chinese pine stands’ capacity to store carbon rose noticeably. In line with earlier research, this study found that the ideal thinning intensity for the maximum carbon storage in a plantation at the Qingping Forest Farm was 18%. Harvesting a few trees has an impact on the entire stand because it gives more room for dominant and better-adapted species to flourish. Additionally, thinning can encourage species to grow quickly in stands, thereby enhancing the stand’s capacity to sequester carbon at a faster rate.

4.2. Effect of Thinning on Tree Stem Volume

Tree growth is significantly impacted by thinning [37]. Four years after thinning, as anticipated, tree diameter and stem volume were substantially greater in the thinned plots than in the non-thinned plot. This result is in line with earlier research that showed thinning in conifer species positively affects diameter and stem volume increments [38]. According to Choi et al. (2014), after 12 years of thinning in a plantation that was 17 years old [39], in a significantly thinned plot, individual Korean pine trees showed growth in both stem volume and tree diameter of 13.3–24.7 and 23.0%–52.0%, respectively. Severe intraspecific competition that slows down tree growth rate is most likely the reason for restricted tree growth in a minimally thinned stand [39,40].
According to Ruano et al., as a result of the increasing thinning, tree growth may not respond noticeably in the initial years following thinning [41]. Our study found that the 18% thinned plot had the best stand productivity, as shown by stock volume per hectare, although there was no discernible difference between it and the unthinned plot. Conversely, a decrease in stand output could result from more intense thinning. In comparison to the unthinned plot, the 22% thinned plot had a lower stock volume per hectare. The results of investigations in a Scots pine (P. sylvestris) forest showed a declining trend in volume increment and total volume produced per unit area from heavy thinning in comparison to unthinned plots [37,42], which is consistent with our findings. Fascinatingly, Harrington and Reukema (1983) [43] noted that, over time, the stand production in the thinned stand equals and surpasses that of the unthinned plot due to a decrease in the difference in stand volume between the two plots. Therefore, we propose that, in order to improve timber production in Korean pine forests over the long-run, later thinning should come after managing the initial planting density.
Four years after thinning, we measured the tree heights in this 42-year-old stand for our study, and the stand with 18% thinning had taller trees on average. They were not appreciably taller than the pines from the other thinning treatments though. This result suggested that the height growth of Korean pine was affected by thinning. Importantly, we add that the lower average growth rate of height in the 22% plot is due to additional management in this plot. Specifically, the Korean pine, as an important seed-producing tree species, is managed by cutting the tops of trees in order to promote favorable growth. This may at least partly explain this result, affecting also the calculated carbon stock and tree volume in this plot/thinning intensity.

4.3. Effect of Thinning on Tree Growth

The most straightforward and efficient ways to represent the stand’s management state in a non-spatial form are through the distribution of tree height and tree DBH. Forest tree tabulating and research on forest management technologies benefit greatly from the ease with which DBH may be measured in forest surveys and the accuracy and dependability of the measured values. They are frequently employed as crucial variables to comprehend stand biomass, carbon stock, and forest growth and to assess the condition of the forest [25]. The majority of study findings demonstrate that thinning can boost DBH growth by reducing the competitive pressure of water and light among tree species [44,45]. The outcomes of these earlier investigations differ from ours. Our findings demonstrated that moderate thinning intensity considerably increased growth as compared to the CK plot. In comparison to the CK plot, growth was maximum when the thinning intensity was 18%. The distinction between managed and non-managed forests could be the cause of this. Our work was conducted in plantations with a low canopy density and a poor growth environment, whereas previous thinning research has tended to concentrate on forests with favorable development conditions. Following low-intensity thinning, there is an increase in soil surface temperature and a drop in canopy density, which leads to water evaporation and hampered tree growth. The DBH expanded in a wider direction when the thinning intensity was 18%, even though this effect persisted because of the rise in the percentage of broad-leaved tree species, such as Korean pine. Comparable to previous research, variations in growth at the species level could help explain various reactions to thinning treatments [45].
Still, other research indicates that stand density following thinning has a detrimental impact on tree height growth in young Douglas fir (Pseudotsuga menziesii) plantations in the United States Pacific Northwest [46] but a positive impact for Pinus banksiana and Alnus rubra [47]. Thinning leaf foliage is quickly exposed to increased light intensity, which increases transpiration and respiration. This could account for the decline in height growth noticed in the first one to two years following thinning [48]. But others have reported that, in areas experiencing extreme drought, increasing moisture and nutrient availability could encourage the growth of taller trees [48]. In our research, we found that the plot with 22% thinning intensity had less height. There might be some hidden reason behind this that was unable to be identified. To optimize the benefits for carbon stock and species growth, managers can plan thinning levels with the assistance of an understanding of the relationship between thinning intensity and growth response.

4.4. Effect of Thinning on Soil Carbon

Different levels of soil organic carbon are impacted by forest management methods [49]. In this study, soil carbon contributes to the carbon stored in the ecosystem. Thinning considerably enhanced the soil’s capacity to store carbon by 7.2%, according to a meta-analysis of the impact of thinning on such capacity in Chinese plantations. Comparing moderate thinning (35%–55%) to other thinning intensities, soil carbon storage increased by 16.1% [50]. Another study reported that litter and soil layers with a 20%–25% thinning intensity were shown to have the most favorable effects on carbon sequestration [19]. In this study, 22% thinning had higher carbon storage in the soil at 0–20 cm depth than in the 16% and 18% thinned plots, consistent with previous research [19]. Soil carbon storage is significantly influenced by soil depth [51]. In this investigation, as soil depth increased, soil carbon storage under various thinning intensities declined. Additionally, surface layer soil bulk density is higher than bottom layer soil bulk density, which is consistent with earlier research and is linked to the action of plant roots and soil organisms that reduce soil depth-related carbon storage [52,53]. When the thinning intensity is 22%, soil carbon storage is improved, and ecosystem carbon storage can be significantly increased.
In northeast China, a comparatively tiny fraction of the total carbon stored in the forest is made up of the carbon stored in the forest’s understory, which stores less than 13%, and its surface, which stores less than 5%. Notably, the primary distribution of carbon storage in forests remains in the soil [54]. In line with Dong et al., thinning enhanced soil and tree carbon storage of the total carbon storage [55]. This could be because vegetation and shrubs can only store a certain amount of carbon, and the quantity of carbon stored in trees and soil increases with thinning intensity.
In comparison to no thinning, carbon storage increased under a 22% thinning intensity. We observed increased carbon storage in the layers of trees and shrubs, respectively, compared with the control plot (CK). By applying an ideal thinning intensity, the ability of current and comparable forest ecosystems to act as carbon sinks might be enhanced, and soil carbon levels might be optimized.

4.5. Effect of Thinning on Vegetation and Shrub Layer

Shrub and vegetation layers are crucial parts of forest ecosystems, and they store carbon in a way that is essential to the ecosystem’s health and functions, including the cycling of nutrients [56]. In plantations, appropriate thinning may improve the understory plants’ capacity to store carbon. Liu et al. (2016) also markedly raised the biomass of understory plants [57], consistent with the present study. The average carbon storage of the shrub and vegetation layers increased as thinning increased, highest under a thinning intensity of 22%. Although there were differences in the carbon storage of vegetation across thinning intensities, an overall trend was not observed. Our carbon storage of shrubs and vegetation was a little low, but it was consistent with the findings of Gao et al. (2023) [19]. The effects of decreasing shrub and vegetation layers on the carbon stock can be varied and complex. On the other hand, moderate thinning intensity may result in more carbon being stored in the layers of vegetation and shrubs, which may enhance the forest ecosystem’s total capacity to sequester carbon [58]. The findings of this study suggest that moderate thinning may facilitate the carbon storage of shrubs, as the carbon storage of vegetation layers under 22% thinning was shown to be higher than under 0% thinning. An adequate thinning intensity can be used to improve ecosystem carbon storage when stand type and habitat are similar.

4.6. The Effect of Stand Factors on Carbon Storage

In forest ecosystems, there is a strong relationship between aboveground carbon and stand density with stand density being critical to carbon dynamics. According to research, stand density affects the amount of carbon stored aboveground, and higher stand densities are frequently linked to higher aboveground carbon stores in living trees [59]. Research has indicated that stand density influences the aboveground carbon with different stand densities resulting in different carbon sequestration rates and overall amounts of carbon stored in trees [59]. Furthermore, the dynamic character of carbon storage in response to variations in stand density [59] is highlighted by the fact that the link between aboveground carbon sequestration rates and stand density can change over time, indicating the progressive nature of carbon storage in response to stand characteristics. In our investigation, there was a strong and positive link between the tree carbon stock, tree volume, and stand density.
Understanding the relationship between stand density and tree volume in forest ecosystems is essential to comprehending the dynamics of carbon and the productivity of forests. According to research, stand density, which is commonly defined as the number of trees per unit area, influences both tree volume and the total accumulation of biomass [60,61]. Our result also indicates that tree volume had a significantly positive, very high correlation with stand density and tree carbon. Furthermore, variables, such as tree species and stand age, and management techniques, such as thinning intensity [62], can affect the connection between stand density, tree carbon, and tree volume. In our result, we also found that there was no significant correlation between vegetation carbon and mean height. However, the specific correlation between stand density and tree volume may be influenced by factors such as tree species, stand age, and management techniques. While there is a general trend of increased carbon storage with greater plant height in forest vegetation, the correlation between vegetation carbon and mean height may vary depending on the study parameters and forest characteristics.

4.7. Limitations of This Study

In our study, there was a slight difference in tree density among the plots before thinning, which was a limitation of our study, although tree density still decreased with thinning intensity as we would expect. To observe the effects of different thinning intensities on soil carbon, shrub carbon, and vegetation carbon, it would be better to take datasets before and after thinning, but in our study, we were unable to do so. In the future, we highly recommend paying attention to solving limitations in tree density, soil carbon, shrub carbon, vegetation carbon, and other related variables to be able to improve the range of analyses performed. Having replicates in each thinning intensity, such as at least three replicates per treatment, would also strengthen the analyses, including to discern the effects of thinning from localized environmental and/or management conditions.

5. Conclusions

In conclusion, this study illuminates the nuanced yet substantial effects of thinning on various aspects of P. koraiensis plantations. The findings highlight the efficacy of the 18% thinning intensity in significantly improving carbon storage, tree volume, and growth rates. This particular intensity exhibited notable advantages, fostering enhanced wood production and robust growth metrics compared to the other thinning treatments.
Furthermore, the influence of thinning extended beyond the tree layer to impact the vegetation layer, indicating a potential for tailored thinning practices to positively influence both tree and understory vegetation dynamics. These comprehensive insights contribute valuable knowledge to the realm of forest management, providing a basis for optimizing carbon sequestration, promoting healthy ecosystem functioning, and guiding strategic thinning practices in P. koraiensis plantations.

Supplementary Materials

The following supporting information can be downloaded at: https://www.mdpi.com/article/10.3390/f15050738/s1.

Author Contributions

Conceptualization, P.Z. and N.S.; Data curation, N.S., Y.H. and A.-Q.I.; Formal analysis, T.R.P. and N.S.; Funding acquisition, P.Z.; Investigation, P.Z. and N.S.; Methodology, T.R.P. and N.S.; Project administration, P.Z.; Resources, P.Z.; Supervision, P.Z.; Visualization, T.R.P. and N.S.; Writing—original draft, N.S. and T.R.P.; Writing—review and editing, T.R.P., N.S., N.J.R., S.A. and P.Z. All authors have read and agreed to the published version of the manuscript.

Funding

This work was funded by the National Key Research and Development Program of China (Grant No. 2022YFD2201002), the Fundamental Research Funds for the Central Universities (Grant No. 2572023CT02), and the Heilongjiang Touyan Innovation Team Program (Technology Development Team for High-efficient Silviculture of Forest Resources).

Data Availability Statement

The raw data supporting the conclusions of this article will be made available by the authors on request.

Acknowledgments

The authors are grateful to two anonymous reviewers, the handling editor, and editor-in-chief whose comments were critical in finalizing the manuscript. Further, the authors are thankful to the Qingping Forest Farm (QFF) authority for facilitating the fieldwork, specifically the QFF staff for field assistance. We are filled with gratitude to Sudipta Saha, Xiubo Yang, Muhammad Junaid Ismail, Akber Ali, Bhavana Chaudhari, Zheng Zhang, Hao Xin, Lei Huang, Zhe Wang, Xinyue Li, and all individuals who provided direct and indirect support at various stages of the study. The usual disclaimer applies, and all mistakes remain the author’s responsibility.

Conflicts of Interest

The authors declare that they have no conflicts of interest.

References

  1. Peres, C.A.; Gardner, T.A.; Barlow, J.; Zuanon, J.; Michalski, F.; Lees, A.C.; Vieira, I.C.G.; Moreira, F.M.S.; Feeley, K.J. Biodiversity conservation in human-modified Amazonian forest landscapes. Biol. Conserv. 2010, 143, 2314–2327. [Google Scholar] [CrossRef]
  2. Pan, Y.; Birdsey, R.A.; Fang, J.; Houghton, R.; Kauppi, P.E.; Kurz, W.A.; Phillips, O.L.; Shvidenko, A.; Lewis, S.L.; Canadell, J.G.; et al. A Large and Persistent Carbon Sink in the World’s Forests. Science 2011, 333, 988–993. [Google Scholar] [CrossRef] [PubMed]
  3. Nitanan, K.M.; Shuib, A.; Sridar, R.; Kunjuraman, V.; Zaiton, S.; Herman, M.A.S. The total economic value of forest ecosystem services in the tropical forests of Malaysia. Int. For. Rev. 2020, 22, 485–503. [Google Scholar] [CrossRef]
  4. Dixon, R.K.; Solomon, A.M.; Brown, S.; Houghton, R.A.; Trexier, M.C.; Wisniewski, J. Carbon pools and flux of global forest ecosystems. Science 1994, 263, 185–190. [Google Scholar] [CrossRef]
  5. Brockerhoff, E.G.; Barbaro, L.; Castagneyrol, B.; Forrester, D.I.; Gardiner, B.; Ramon Gonzalez-Olabarria, J.; Lyver, P.O.B.; Meurisse, N.; Oxbrough, A.; Taki, H.; et al. Forest biodiversity, ecosystem functioning and the provision of ecosystem services. Biodivers. Conserv. 2017, 26, 3005–3035. [Google Scholar] [CrossRef]
  6. Canadell, J.G.; Raupach, M.R. Managing forests for climate change mitigation. Science 2008, 320, 1456–1457. [Google Scholar] [CrossRef] [PubMed]
  7. Chaturvedi, R.K.; Raghubanshi, A.S. Assessment of carbon density and accumulation in mono- and multi-specific stands in Teak and Sal forests of a tropical dry region in India. For. Ecol. Manag. 2015, 339, 11–21. [Google Scholar] [CrossRef]
  8. Sharma, C.M.; Mishra, A.K.; Krishan, R.; Tiwari, O.P.; Rana, Y.S. Variation in vegetation composition, biomass production, and carbon storage in ridge top forests of high mountains of Garhwal Himalaya. J. Sustain. For. 2016, 35, 119–132. [Google Scholar] [CrossRef]
  9. Leung, D.Y.C.; Caramanna, G.; Maroto-Valer, M.M. An overview of current status of carbon dioxide capture and storage technologies. Renew. Sustain. Energy Rev. 2014, 39, 426–443. [Google Scholar] [CrossRef]
  10. Jandl, R.; Lindner, M.; Vesterdal, L.; Bauwens, B.; Baritz, R.; Hagedorn, F.; Johnson, D.W.; Minkkinen, K.; Byrne, K.A. How strongly can forest management influence soil carbon sequestration? Geoderma 2007, 137, 253–268. [Google Scholar] [CrossRef]
  11. Valentini, R.; Matteucci, G.; Dolman, A.J.; Schulze, E.D.; Rebmann, C.; Moors, E.J.; Granier, A.; Gross, P.; Jensen, N.O.; Pilegaard, K.; et al. Respiration as the main determinant of carbon balance in European forests. Nature 2000, 404, 861–865. [Google Scholar] [CrossRef] [PubMed]
  12. Li, R.-S.; Yang, Q.-P.; Zhang, W.-D.; Zheng, W.-H.; Chi, Y.-G.; Xu, M.; Fang, Y.-T.; Gessler, A.; Li, M.-H.; Wang, S.-L. Thinning effect on photosynthesis depends on needle ages in a Chinese fir (Cunninghamia lanceolata) plantation. Sci. Total Environ. 2017, 580, 900–906. [Google Scholar] [CrossRef] [PubMed]
  13. Schaedel, M.S.; Larson, A.J.; Affleck, D.L.R.; Belote, T.; Goodburn, J.M.; Page-Dumroese, D.S. Early forest thinning changes aboveground carbon distribution among pools, but not total amount. For. Ecol. Manag. 2017, 389, 187–198. [Google Scholar] [CrossRef]
  14. Laporte, M.F.; Duchesne, L.C.; Morrison, I.K. Effect of clearcutting, selection cutting, shelterwood cutting and microsites on soil surface CO2 efflux in a tolerant hardwood ecosystem of northern Ontario. For. Ecol. Manag. 2003, 174, 565–575. [Google Scholar] [CrossRef]
  15. Concilio, A.; Ma, S.Y.; Li, Q.L.; LeMoine, J.; Chen, J.Q.; North, M.; Moorhead, D.; Jensen, R. Soil respiration response to prescribed burning and thinning in mixed-conifer and hardwood forests. Can. J. For. Res. 2005, 35, 1581–1591. [Google Scholar] [CrossRef]
  16. Ohashi, M.; Gyokusen, K.; Saito, A. Measurement of carbon dioxide evolution from a Japanese cedar (Cryptomeria japonica D. Don) forest floor using an open-flow chamber method. For. Ecol. Manag. 1999, 123, 105–114. [Google Scholar] [CrossRef]
  17. Lee, J.; Morrison, I.K.; Leblanc, J.-D.; Dumas, M.T.; Cameron, D.A. Carbon sequestration in trees and regrowth vegetation as affected by clearcut and partial cut harvesting in a second-growth boreal mixedwood. For. Ecol. Manag. 2002, 169, 83–101. [Google Scholar] [CrossRef]
  18. Zou, X.; Zheng, Z.; Yang, C.; Yang, M.; Guo, Z.; Wang, Y.; Huang, Z.; Zhu, L.; Xu, L.; Lin, K. Initial effects of crop tree release and traditional thinning on productivity and carbon storage of Cunninghamia lanceolata plantation. Front. Glob. Chang. 2023, 6, 1288613. [Google Scholar] [CrossRef]
  19. Gao, T.; Song, X.; Ren, Y.; Liu, H.; Qu, H.; Dong, X. Thinning intensity affects carbon sequestration and release in seasonal freeze-thaw areas. J. For. Res. 2023, 34, 993–1006. [Google Scholar] [CrossRef]
  20. Yu, J.; Zhang, X.; Xu, C.; Hao, M.; Choe, C.; He, H. Thinning can increase shrub diversity and decrease herb diversity by regulating light and soil environments. Front. Plant Sci. 2022, 13, 948648. [Google Scholar] [CrossRef]
  21. Wang, Y.; Lin, K.; Song, C.; Cui, C.; Peng, L.; Zheng, H.; Zheng, M.; Ren, Z.; Qiu, M. Short-term effects of thinning on carbon storage in Chinese fir plantation ecosystems. J. Nanjing For. Univ. Nat. Sci. Ed. 2022, 46, 65–73. [Google Scholar] [CrossRef]
  22. Malmsheimer, R.W.; Bowyer, J.L.; Fried, J.S.; Gee, E.; Izlar, R.L.; Miner, R.A.; Munn, I.A.; Oneil, E.; Stewart, W.C. Managing Forests because Carbon Matters: Integrating Energy, Products, and Land Management Policy. J. For. 2011, 109, S7–S48. [Google Scholar] [CrossRef]
  23. Taki, H.; Inoue, T.; Tanaka, H.; Makihara, H.; Sueyoshi, M.; Isono, M.; Okabe, K. Responses of community structure, diversity, and abundance of understory plants and insect assemblages to thinning in plantations. For. Ecol. Manag. 2010, 259, 607–613. [Google Scholar] [CrossRef]
  24. Aldea, J.; Bravo, F.; Bravo-Oviedo, A.; Ruiz-Peinado, R.; Rodriguez, F.; del Rio, M. Thinning enhances the species-specific radial increment response to drought in Mediterranean pine-oak stands. Agr. For. Meteorol. 2017, 237, 371–383. [Google Scholar] [CrossRef]
  25. Guan, H.; Dong, X.; Zhang, T.; Wang, Z.; Ruan, J. Comparing the Stand Structure of a Secondary Mixed Forest with Three Broad-Leaved Forests in China’s Greater Khingan Mountains. Pol. J. Environ. Stud. 2020, 29, 3127–3141. [Google Scholar] [CrossRef]
  26. Fantini, A.C.; Schuch, C.; Siminski, A.; Siddique, I. Small-scale Management of Secondary Forests in the Brazilian Atlantic Forest. Floresta Ambiente 2019, 26, e20170690. [Google Scholar] [CrossRef]
  27. Nicoll, B.C.; Connolly, T.; Gardiner, B.A. Changes in Spruce Growth and Biomass Allocation Following Thinning and Guying Treatments. Forests 2019, 10, 253. [Google Scholar] [CrossRef]
  28. Xu, J. The 8th forest resources inventory results and analysis in China. For. Econ. 2014, 3, 6–8. [Google Scholar]
  29. Lange, M.; Eisenhauer, N.; Sierra, C.A.; Bessler, H.; Engels, C.; Griffiths, R.I.; Mellado-Vazquez, P.G.; Malik, A.A.; Roy, J.; Scheu, S.; et al. Plant diversity increases soil microbial activity and soil carbon storage. Nat. Commun. 2015, 6, 6707. [Google Scholar] [CrossRef]
  30. Wang, C.K. Biomass allometric equations for 10 co-occurring tree species in Chinese temperate forests. For. Ecol. Manag. 2006, 222, 9–16. [Google Scholar] [CrossRef]
  31. Hu, H.; Luo, B.; Wei, S.; Wei, S.; Sun, L.; Luo, S.; Ma, H. Biomass carbon density and carbon sequestration capacity in seven typical forest types of the Xiaoxing’an Mountains, China. Chin. J. Plant Ecol. 2015, 39, 140–158. [Google Scholar] [CrossRef]
  32. Yang, H.; Wang, X.; Tao, Y.; Gu, Y. Study on the tree volume table compilation of Korean pine in Liaoning province. Liaoning For. Sci. Technol. 2007, 2, 61–62. [Google Scholar]
  33. Chen, L. Soil Experiment and Practice Course; Northeast Forestry University Press: Harbin, China, 2005. [Google Scholar]
  34. Mu, C.; Lu, H.; Wang, B.; Bao, X.; Cui, W. Short-term effects of harvesting on carbon storage of boreal Larix gmelinii Carex schmidtii forested wetlands in Daxing’anling, northeast China. For. Ecol. Manag. 2013, 293, 140–148. [Google Scholar] [CrossRef]
  35. Ming, A.; Zhang, Z.; Chen, H.; Zhang, X.; Tao, Y.; Su, Y. Effects of Thinning on the Biomass and Carbon Storage in Pinus massoniana Plantation. Sci. Silvae Sin. 2013, 49, 1–6. [Google Scholar] [CrossRef]
  36. Han, F.; Tian, X.; Dang, K.; Cao, T. Impact of Thinning on Carbon Storage for Pinus tabulaeformis Stands in Shaanxi Qiaoshan. J. Northwest For. Univ. 2015, 30, 184–191. [Google Scholar]
  37. Mäkinen, H.; Isomäki, A. Thinning intensity and growth of Scots pine stands in Finland. For. Ecol. Manag. 2004, 201, 311–325. [Google Scholar] [CrossRef]
  38. Navarro, F.B.; Jimenez, M.N.; Canadas, E.M.; Gallego, E.; Terron, L.; Ripoll, M.A. Effects of different intensities of overstory thinning on tree growth and understory plant-species productivity in a semi-arid Pinus halepensis Mill. afforestation. For. Syst. 2010, 19, 410–417. [Google Scholar] [CrossRef]
  39. Woodruff, D.R.; Bond, B.J.; Ritchie, G.A.; Scott, W. Effects of stand density on the growth of young Douglas-fir trees. Can. J. For. Res. 2002, 32, 420–427. [Google Scholar] [CrossRef]
  40. Bae, S.-W.; Hwang, J.-H.; Lee, S.-T.; Kim, H.-S.; Jeong, J.-M. Changes in soil temperature, moisture content, light availability and diameter growth after thinning in Korean pine (Pinus koraiensis) plantation. J. Korean Soc. For. Sci. 2010, 99, 397–403. [Google Scholar]
  41. Ruano, I.; Rodriguez-Garcia, E.; Bravo, F. Effects of pre-commercial thinning on growth and reproduction in post-fire regeneration of Pinus halepensis Mill. Ann. For. Sci. 2013, 70, 357–366. [Google Scholar] [CrossRef]
  42. Valinger, E.; Elfving, B.; Mörling, T. Twelve-year growth response of Scots pine to thinning and nitrogen fertilisation. For. Ecol. Manag. 2000, 134, 45–53. [Google Scholar] [CrossRef]
  43. Harrington, C.A.; Reukema, D.L. Initial shock and long-term stand development following thinning in a Douglas-fir plantation. For. Sci. 1983, 29, 33–46. [Google Scholar] [CrossRef]
  44. Roberts, S.D.; Harrington, C.A. Individual tree growth response to variable-density thinning in coastal Pacific Northwest forests. For. Ecol. Manag. 2008, 255, 2771–2781. [Google Scholar] [CrossRef]
  45. Vernon, M.J.; Sherriff, R.L.; van Mantgem, P.; Kane, J.M. Thinning, tree-growth, and resistance to multi-year drought in a mixed-conifer forest of northern California. For. Ecol. Manag. 2018, 422, 190–198. [Google Scholar] [CrossRef]
  46. Li, Y.; Turnblom, E.C.; Briggs, D.G. Effects of density control and fertilization on growth and yield of young Douglas-fir plantations in the Pacific Northwest. Can. J. For. Res. 2007, 37, 449–461. [Google Scholar] [CrossRef]
  47. Tong, Q.J.; Zhang, S.Y.; Thompson, M. Evaluation of growth response, stand value and financial return for pre-commercially thinned jack pine stands in Northwestern Ontario. For. Ecol. Manag. 2005, 209, 225–235. [Google Scholar] [CrossRef]
  48. Brix, H. Fertilization and Thinning Effect on a Douglas-Fir Ecosystem at Shawnigan Lake: A Synthesis of Project Results; FRDA Research Program, Research Branch, BC Ministry of Forests and Lands: Victoria, Canada, 1992. [Google Scholar]
  49. Lei, L.; Xiao, W. Uncertainty Effect of Forest Harvest on Soil Carbon Pool: A Review. For. Res. 2015, 28, 892–899. [Google Scholar] [CrossRef]
  50. Gong, C.; Tan, Q.; Liu, G.; Xu, M. Forest thinning increases soil carbon stocks in China. For. Ecol. Manag. 2021, 482, 118812. [Google Scholar] [CrossRef]
  51. Zhang, J.; Xu, M.-X.; Wang, Z.; Ma, X.-X.; Qiu, Y.-J. Effects of revegetation on organic carbon storage in deep soils in hilly Loess Plateau region of Northwest China. Ying Yong Sheng Tai Xue Bao=J. Appl. Ecol. 2012, 23, 2721–2727. [Google Scholar] [CrossRef]
  52. Fang, X.; Tian, D.; Xiang, W. Effects of thinning on carbon stroage and its spatial distributions in Chinese Fir plantation ecosystem. J. Cent. S. Univ. For. Technol. 2010, 30, 47–53. [Google Scholar] [CrossRef]
  53. Wei, Y.; Zhou, W.; Zhou, L.; Yu, D.; Zhou, Y.; Qin, S.; Dai, L. Carbon storage and its distribution pattern in the natural Larix gmelin?? forests on Daxing’an mountains. Acta Ecol. Sin. 2015, 35, 189–195. [Google Scholar] [CrossRef]
  54. Wei, Y.; Li, M.; Chen, H.; Lewis, B.J.; Yu, D.; Zhou, L.; Zhou, W.; Fang, X.; Zhao, W.; Dai, L. Variation in Carbon Storage and Its Distribution by Stand Age and Forest Type in Boreal and Temperate Forests in Northeastern China. PLoS ONE 2013, 8, e72201. [Google Scholar] [CrossRef]
  55. Dong, L.; Liu, H.; Wang, C.; Zhao, J.; Gao, Y.; Huang, X.; Xiao, Y. Short-term and Long-term Effects of Thinning on Carbon Storage of Quercus mongolica Secondary Forests. J. Shenyang Agric. Univ. 2019, 50, 614–620. [Google Scholar]
  56. Zhao, P.; Song, C.; Su, R.; Hai, L.; Zhou, M.; Wei, J.; Wang, S. Review in the research of litter fall in forest ecosystems. J. Inn. Mong. Agric. Univ. 2009, 30, 292–299. [Google Scholar]
  57. Haibo, F.; Dalun, T.; Wenxing, K. Biomass dynamics of a thinned Chinese fir plantation ecosystem. J. Cent. S. For. Coll. 1999, 19, 16–19. [Google Scholar] [CrossRef]
  58. Lin, J.-C.; Chiu, C.-M.; Lin, Y.-J.; Liu, W.-Y. Thinning Effects on Biomass and Carbon Stock for Young Taiwania Plantations. Sci. Rep. 2018, 8, 3070. [Google Scholar] [CrossRef]
  59. Anderson, S.; Knapp, B.O.; Kabrick, J.M. Stand-Density Effects on Aboveground Carbon Dynamics in Secondary Pinus and Quercus Forests of Central USA. For. Sci. 2023, 69, 213–227. [Google Scholar] [CrossRef]
  60. Bonnor, G. The influence of stand density on the correlation of stem diameter with crown width and height for lodgepole pine. For. Chron. 1964, 40, 347–349. [Google Scholar] [CrossRef]
  61. Węgiel, A.; Bembenek, M.; Łacka, A.; Mederski, P.S. Relationship between stand density and value of timber assortments: A case study for Scots pine stands in north-western Poland. N. Z. J. For. Sci. 2018, 48, 12. [Google Scholar] [CrossRef]
  62. Allen, M.; Brunner, A.; Antón-Fernández, C.; Astrup, R. The relationship between volume increment and stand density in Norway spruce plantations. For. Int. J. For. Res. 2021, 94, 151–165. [Google Scholar] [CrossRef]
Figure 1. Geographic location of the study area in the Qingping Forest, Heilongjiang Province, northeast China.
Forests 15 00738 g001
Figure 2. Plot design for vegetation sample collection. (A) Experiment plot, (B) Shrubs quadrat (for the collection of shrubs), (C) Vegetation quadrat (for the collection of vegetation). See method for details.
Forests 15 00738 g002
Figure 3. (A) The annual total difference in tree carbon stock density of each plot (t ha−1 yr−1). (B) The annual total difference in tree volume of each plot (m3 ha−1 yr−1).
Forests 15 00738 g003
Figure 4. Average annual growth rate of DBH (A) and height (B) of all trees in each plot. The data in the figure are “mean ± SE”.
Forests 15 00738 g004
Figure 5. (A) Average carbon content in three soil layers of each plot. Different lowercase letters indicate significant differences (p < 0.05) among the different soil layers with different thinning intensities (Tukey’s HSD test). (B) Average soil bulk density in different soil layers. Different lowercase letters indicate significant differences at the p < 0.05 level among the average bulk density of soils from the different depths with different thinning intensities (Tukey’s HSD test).
Forests 15 00738 g005
Figure 6. (A) Average carbon content of vegetation in different layers (Tukey’s HSD test). Different lowercase letters indicate significant differences at the p < 0.05 level among the same vegetation layer with different thinning intensities. (B) Average carbon content of shrubs in different thinning plots. Different lowercase letters indicate significant differences at the p < 0.05 level among the average carbon content of shrubs with different thinning intensities (Tukey’s HSD test).
Forests 15 00738 g006
Figure 7. Correlation plots of thinning intensity, stand density, tree carbon, soil carbon, shrub carbon, vegetation carbon, tree volume, mean DBH, mean height, DBH max, and height max. “−” for negative relationships, while others were positive (* p < 0.05; ** p < 0.01; *** p < 0.001).
Forests 15 00738 g007
Table 1. The basic survey of six thinning plots. The data in the table are “mean ± SE”. Kruskal–Wallis test revealed that a statistically significant difference existed among plots with different thinning intensities as measured by DBH of all trees in 2019 (p < 0.01), DBH of only Korean pine trees only in 2019 (p < 0.05), height of all trees in 2019 (p < 0.001), height of Korean pine trees only in 2019 (p < 0.01), DBH of all trees in 2023 (p < 0.01), DBH of Korean pine trees only in 2023 (p < 0.01), height of all trees in 2023 (p < 0.01), and height of Korean pine trees only in 2023 (p < 0.001). Asterisks indicate significant differences (p < 0.05) between the corresponding thinning intensity and the control plot within the same column, determined by Dunn’s test.
Thinning
Treatments
Tree TypesTree Density (ha−1)The Year after Thinning (2019)Four Years after Thinning (2023)
DBH (cm)H (m)DBH (cm)H (m)
0% (CK)All trees121620.1 ± 0.715.7 ± 0.221.7 ± 0.819.6 ± 0.3
Korean pine115020.1 ± 0.715.8 ± 0.221.8 ± 0.819.6 ± 0.3
10%All trees88322.3 ± 0.4 *16.1 ± 0.124.4 ± 0.4 *21.0 ± 0.4 *
Korean pine85022.6 ± 0.4 *16.2 ± 0.124.6 ± 0.4 *21.0 ± 0.4 *
11%All trees98320.7 ± 0.515.2 ± 0.2 *22.7 ± 0.620.7 ± 0.3 *
Korean pine90021.2 ± 0.515.4 ± 0.2 *23.3 ± 0.621.1 ± 0.3 *
16%All trees83323.0 ± 0.5 *15.6 ± 0.225.3 ± 0.5 *21.3 ± 0.2 *
Korean pine83323.0 ± 0.5 *15.6 ± 0.225.3 ± 0.5 *21.3 ± 0.2 *
18%All trees91621.6 ± 0.615.1 ± 0.2 *23.9 ± 0.6 *21.0 ± 0.4 *
Korean pine88321.8 ± 0.6 *15.2 ± 0.2 *24.1 ± 0.6 *21.2 ± 0.3 *
22%All trees83322.3 ± 0.6 *17.1 ± 0.2 *24.5 ± 0.6 *20.9 ± 0.3 *
Korean pine83322.3 ± 0.6 *17.1 ± 0.2 *24.5 ± 0.6 *20.9 ± 0.3 *
Table 2. Equations for calculating stem, branch, leaf, and root biomass of dominant tree species in this study. D and H are diameter at breast height (cm) and height (m) of a tree, respectively. B is the biomass of the respective tree component (kg).
Tree SpeciesComponentEquation
Pinus koraiensisStemB1 = 0.04665 × (D2H)0.90237
BranchB2 = 0.03123 × (D2H)0.61248
LeafB3 = 0.01235 × (D2H)0.64347
RootB4 = 0.00925 × (D2H)0.73965
Betula dahuricaStemB1 = 0.01175 × (D2H)1.10252
BranchB2 = 0.01024 × (D2H)0.80547
LeafB3= 0.01347 × (D2H)0.64947
RootB4= 0.04887 × (D2H)0.63246
B1, B2, B3, and B4 are biomass of stem, branch, leaf, and root, respectively, in kg [31]. Now, total biomass (TB) = B1 + B2 + B3 + B4. Biomass stock density (kg m−2) (BSD) = TB/area plot. Biomass stock density (t ha−1) = (BSD) × 10. Carbon stock density (t ha−1) = (BSD) in ton per hectare × 0.5. Wood volume was then calculated from individual tree characteristics (diameter at breast height and height) as ref. [32]. V = 0.0000589865 D1.966609091 H 0.904763956. Where, V = individual tree volume (m3), D = diameter at breast height (cm), H = tree height (m).
Table 3. Tree carbon storage with different thinning treatments (annual carbon increment and relative carbon increment).
Thinning Treatment (%)2019
Total Carbon (t ha−1)
2023
Total Carbon
(t ha−1)
Annual Increment Carbon
(t ha−1y−1)
Relative Increment Carbon (%)
097.3134.459.299.5
1079.00116.999.5012.0
1176.14117.2510.2813.5
1676.03117.5010.3713.6
1875.75120.2711.1314.7
2279.19111.167.9910.1
Disclaimer/Publisher’s Note: The statements, opinions and data contained in all publications are solely those of the individual author(s) and contributor(s) and not of MDPI and/or the editor(s). MDPI and/or the editor(s) disclaim responsibility for any injury to people or property resulting from any ideas, methods, instructions or products referred to in the content.

