Article

Drought Impact on Eco-Physiological Responses and Growth Performance of Healthy and Declining Pinus sylvestris L. Trees Growing in a Dry Area of Southern Poland

by
Barbara Benisiewicz
1,
Sławomira Pawełczyk
1,
Francesco Niccoli
2,
Jerzy Piotr Kabala
2 and
Giovanna Battipaglia
2,*
1
Division of Geochronology and Environmental Isotopes, Institute of Physics Center for Science and Education, Silesian University of Technology, Konarskiego 22B, 44-100 Gliwice, Poland
2
Biological and Pharmaceutical Sciences and Technologies, Department of Environmental, University of Campania “L. Vanvitelli”, Via Vivaldi, 43, 81100 Caserta, Italy
*
Author to whom correspondence should be addressed.
Forests 2024, 15(5), 741; https://doi.org/10.3390/f15050741
Submission received: 23 March 2024 / Revised: 18 April 2024 / Accepted: 19 April 2024 / Published: 24 April 2024
(This article belongs to the Section Forest Ecophysiology and Biology)

Abstract

:
In recent years, several drought events hit Poland, affecting its forests. In Opole, Poland, tons of Pinus sylvestris L. deadwood is removed every year due to drought. Understanding the physiological mechanisms underlying tree vulnerability to drought, and tree responses, is important to develop forest management strategies to face the ongoing climate change. This research provides comprehensive local-scale analyses of the sensitivity of healthy and declining trees to drought. We used dendrochronology and stable isotope analysis to compare five healthy and five declining trees. The analysis focused particularly on comparisons of basal area increment (BAI), δ13C, and intrinsic water-use efficiency (iWUE), as well as tree resistance, resilience, and recovery in response to drought events and sensitivity to selected meteorological parameters. We observed a significant reduction in BAI values in declining trees after 2000. Fifteen years later, the reduction was also visible in the iWUE values of these trees. Despite similar δ13C chronology patterns, declining trees showed higher δ13C correlations with meteorological parameters. We have shown that dendrochronology enables early detection of poor forest health conditions. Differences in iWUE chronologies occurring in recent years suggest that trees of both groups have chosen different adaptive strategies to cope with drought stress.

1. Introduction

Global warming is a serious problem for forest ecosystems since the gradual increase in average temperatures is threatening forest health and its ecosystem services. According to the Intergovernmental Panel on Climate Change (IPCC) assessment report [1], 2011–2020 was considered the warmest decade in world history. During this period, Poland recorded an average of 13 days a year with a minimum temperature of 30 °C, while in the 1970s, it was only 4 days. One of the effects of global warming is an increase in the frequency and intensity of extreme weather phenomena, such as droughts [2]. The drought events have contributed to tree mortality in Europe [1]; particularly, in Poland, drought-related tree mortality doubled from 1984 to 2016 [3]. Higher frequencies of droughts not only lead to the death of trees but also increase their susceptibility to pests [4] and thus lead to the need to cut down large forest areas every year [5,6]. Some trees are more affected by drought than others, and even trees of the same species growing in the same area can respond differently to water shortage [7,8]. It is unclear what structural modifications and physiological and ecological mechanisms underlie the processes of tree dieback due to drought [9,10]. There is still great uncertainty about how forests will respond to further changes, so further research on trees’ sensitivity to drought is necessary to better understand this problem.
Eco-physiological mechanisms behind drought-induced tree mortality linked to the carbon and water economy have been evaluated in numerous research works [11,12,13]. The ability of trees to control water loss is crucial to their survival [11]. Trees can close their stomata to reduce water loss and resist severe drought conditions by preventing hydraulic dysfunctions. However, if stomatal closure persists, it may trigger a mechanism known as carbon starvation, which is detrimental to their health as well [13,14]: stomatal closure impairs the uptake of CO2, reducing photosynthesis. In the long term, this phenomenon reduces the carbohydrate pool available to the plant [15], threatening crucial physiological and ecological processes like biomass maintenance, growth, and reproduction [16,17,18]. Another mechanism leading to the death of trees is xylem hydraulic failure; according to many studies, a broad reduction in xylem conductivity causes tree mortality well before carbon starvation becomes deadly [13,19,20]. Although Pinus sylvestris L. is considered a drought-resistant species, recent studies carried out in southern and central Europe [21,22,23], and particularly in Poland [24,25], reported several episodes of drought-induced dieback in Scots pine.
One of the tools for examining the sensitivity of trees to drought is dendrochronology [26,27]. In forest stands under environmental stress, tree rings have often been used as indicators of tree vitality [28,29]. The formation of annual growth rings is a consequence of the micro/macroenvironmental conditions in which trees live [28]. Therefore, the reconstruction of stressful climatic events is possible with the use of tree rings. Analyzing the effects of disturbance events on ecological parameters is a common method used to determine the resilience and resistance of the ecosystems under study. Various approaches comparing disturbed and undisturbed ecosystems can be found in the literature [30,31,32]. In dendrochronological studies, the resilience, resistance, and recovery indices can be computed from the growth time series [33], and in recent years, it has become an established procedure [33,34]. Most often, for this kind of analysis, the BAI time series is employed [34].
Dendrochronology is often combined with the stable isotope analysis of tree rings, which provides more accurate insights into trees’ sensitivity to drought stress [7,28]. In effect, tree-ring stable isotopes can be used to reconstruct the effects of environmental disturbances on tree growth and vitality [28]. Changes in atmospheric CO2 concentrations (ca) and substomatal chamber or intercellular CO2 concentrations (ci) both have an impact on the carbon isotope ratio (δ13C) [28]. The stomata control the substomatal chamber’s CO2 input rate (gs), while CO2 assimilation (A) controls the output rate [28]. Environmental factors including light, temperature, and the availability of water and nutrients have a significant impact on these processes, and tree-ring stable isotopes reflect this influence [28]. Under stress conditions, like a water deficit, 13C discrimination decreases, which could be explained by partial or total stomatal closure during the water stress event, which results in reduced carbon isotope discrimination due to limited CO2 and H2O diffusion [35]. Furthermore, tree-ring δ13C has been frequently used to infer intrinsic water use efficiency in plants (iWUE) due to its link with the ratio between the intercellular and ambient CO2 partial pressures [36,37].
In the literature, several studies have considered the approaches mentioned above to explore tree sensitivity to drought in different conditions, both on a regional [38] and global scale [39,40], and comparing different tree species [26]. Colangelo et al. [41] conducted research on declining and nondeclining trees in two forests in Italy. The authors showed that growth data can provide early warning signals to forecast tree dieback [41]. Particularly, in the most drought-affected site, the authors noted that declining trees showed a decreased iWUE following the onset of dieback, which suggested an increased water loss [41]. Timofeeva et al. [7] studied Pinus sylvestris L. in various health conditions growing in one of the driest parts of the European Alps, which were subjected to a 10-year irrigation experiment. The authors observed that irrigated trees showed a continuous rise in growth and an immediate decrease in δ13C values, suggesting increased stomatal conductance and proving that water is a major growth-limiting factor [7]. Genetic differences may play a significant role in assessing phenomena such as drought-induced forest die-off [41,42,43]. LLoret and Garcia [42] examined the contribution of ecological, morphological, and genetic factors to the understanding of how trees react to extended drought. The authors conducted some empirical studies confirming the relationship between the response to drought stress at the individual level and the genetic background [42]. However, it was also shown that there is no relationship between plant performance and the average genetic relatedness between individuals in a plot [42]. The literature also provides examples of other factors operating at the microlocal or local scale that may cause differences in the response of trees to drought [44,45,46]. Galiano [44], based on the patchy damage pattern observed in their study area, suggests that microtopography, soil properties, and stand structure possibly related to prior management had an impact on predisposing trees to greater susceptibility to climatic drought. The sensitivity of individual Pinus sylvestris trees to drought is highly variable, even within groups of individuals with the same provenance [47]. In recent years, research aimed at providing a mechanistic or physiological explanation of this variability is gaining increased attention [48], as the problems related to climate change are becoming increasingly pressing.
Despite the presence of several studies in the literature, research on tree sensitivity to drought on a local scale is still scarce. Furthering this knowledge would enable an understanding of the drought responses of nearby trees, thus contributing to a better understanding of the mechanism underlying their decline. In this context, the aim of this research is to conduct a comparative analysis of trees experiencing drought, growing in the same area (at a distance of 0.5 m to 500 m between individual trees), but in different states of health: healthy and declining. We used dendrochronology coupled with measurements of stable carbon isotopes in tree rings to monitor growth trends and water-use dynamics of Pinus sylvestris, a species widely distributed in Poland and threatened by ongoing global warming. Our hypothesis is that despite similar growth conditions, nearby trees may show signs of dieback. We expect declining trees may exhibit early warning signals, such as reduced growth patterns, changes in water-use efficiency, and increased sensitivity to the meteorological parameters compared with healthy trees.

2. Materials and Methods
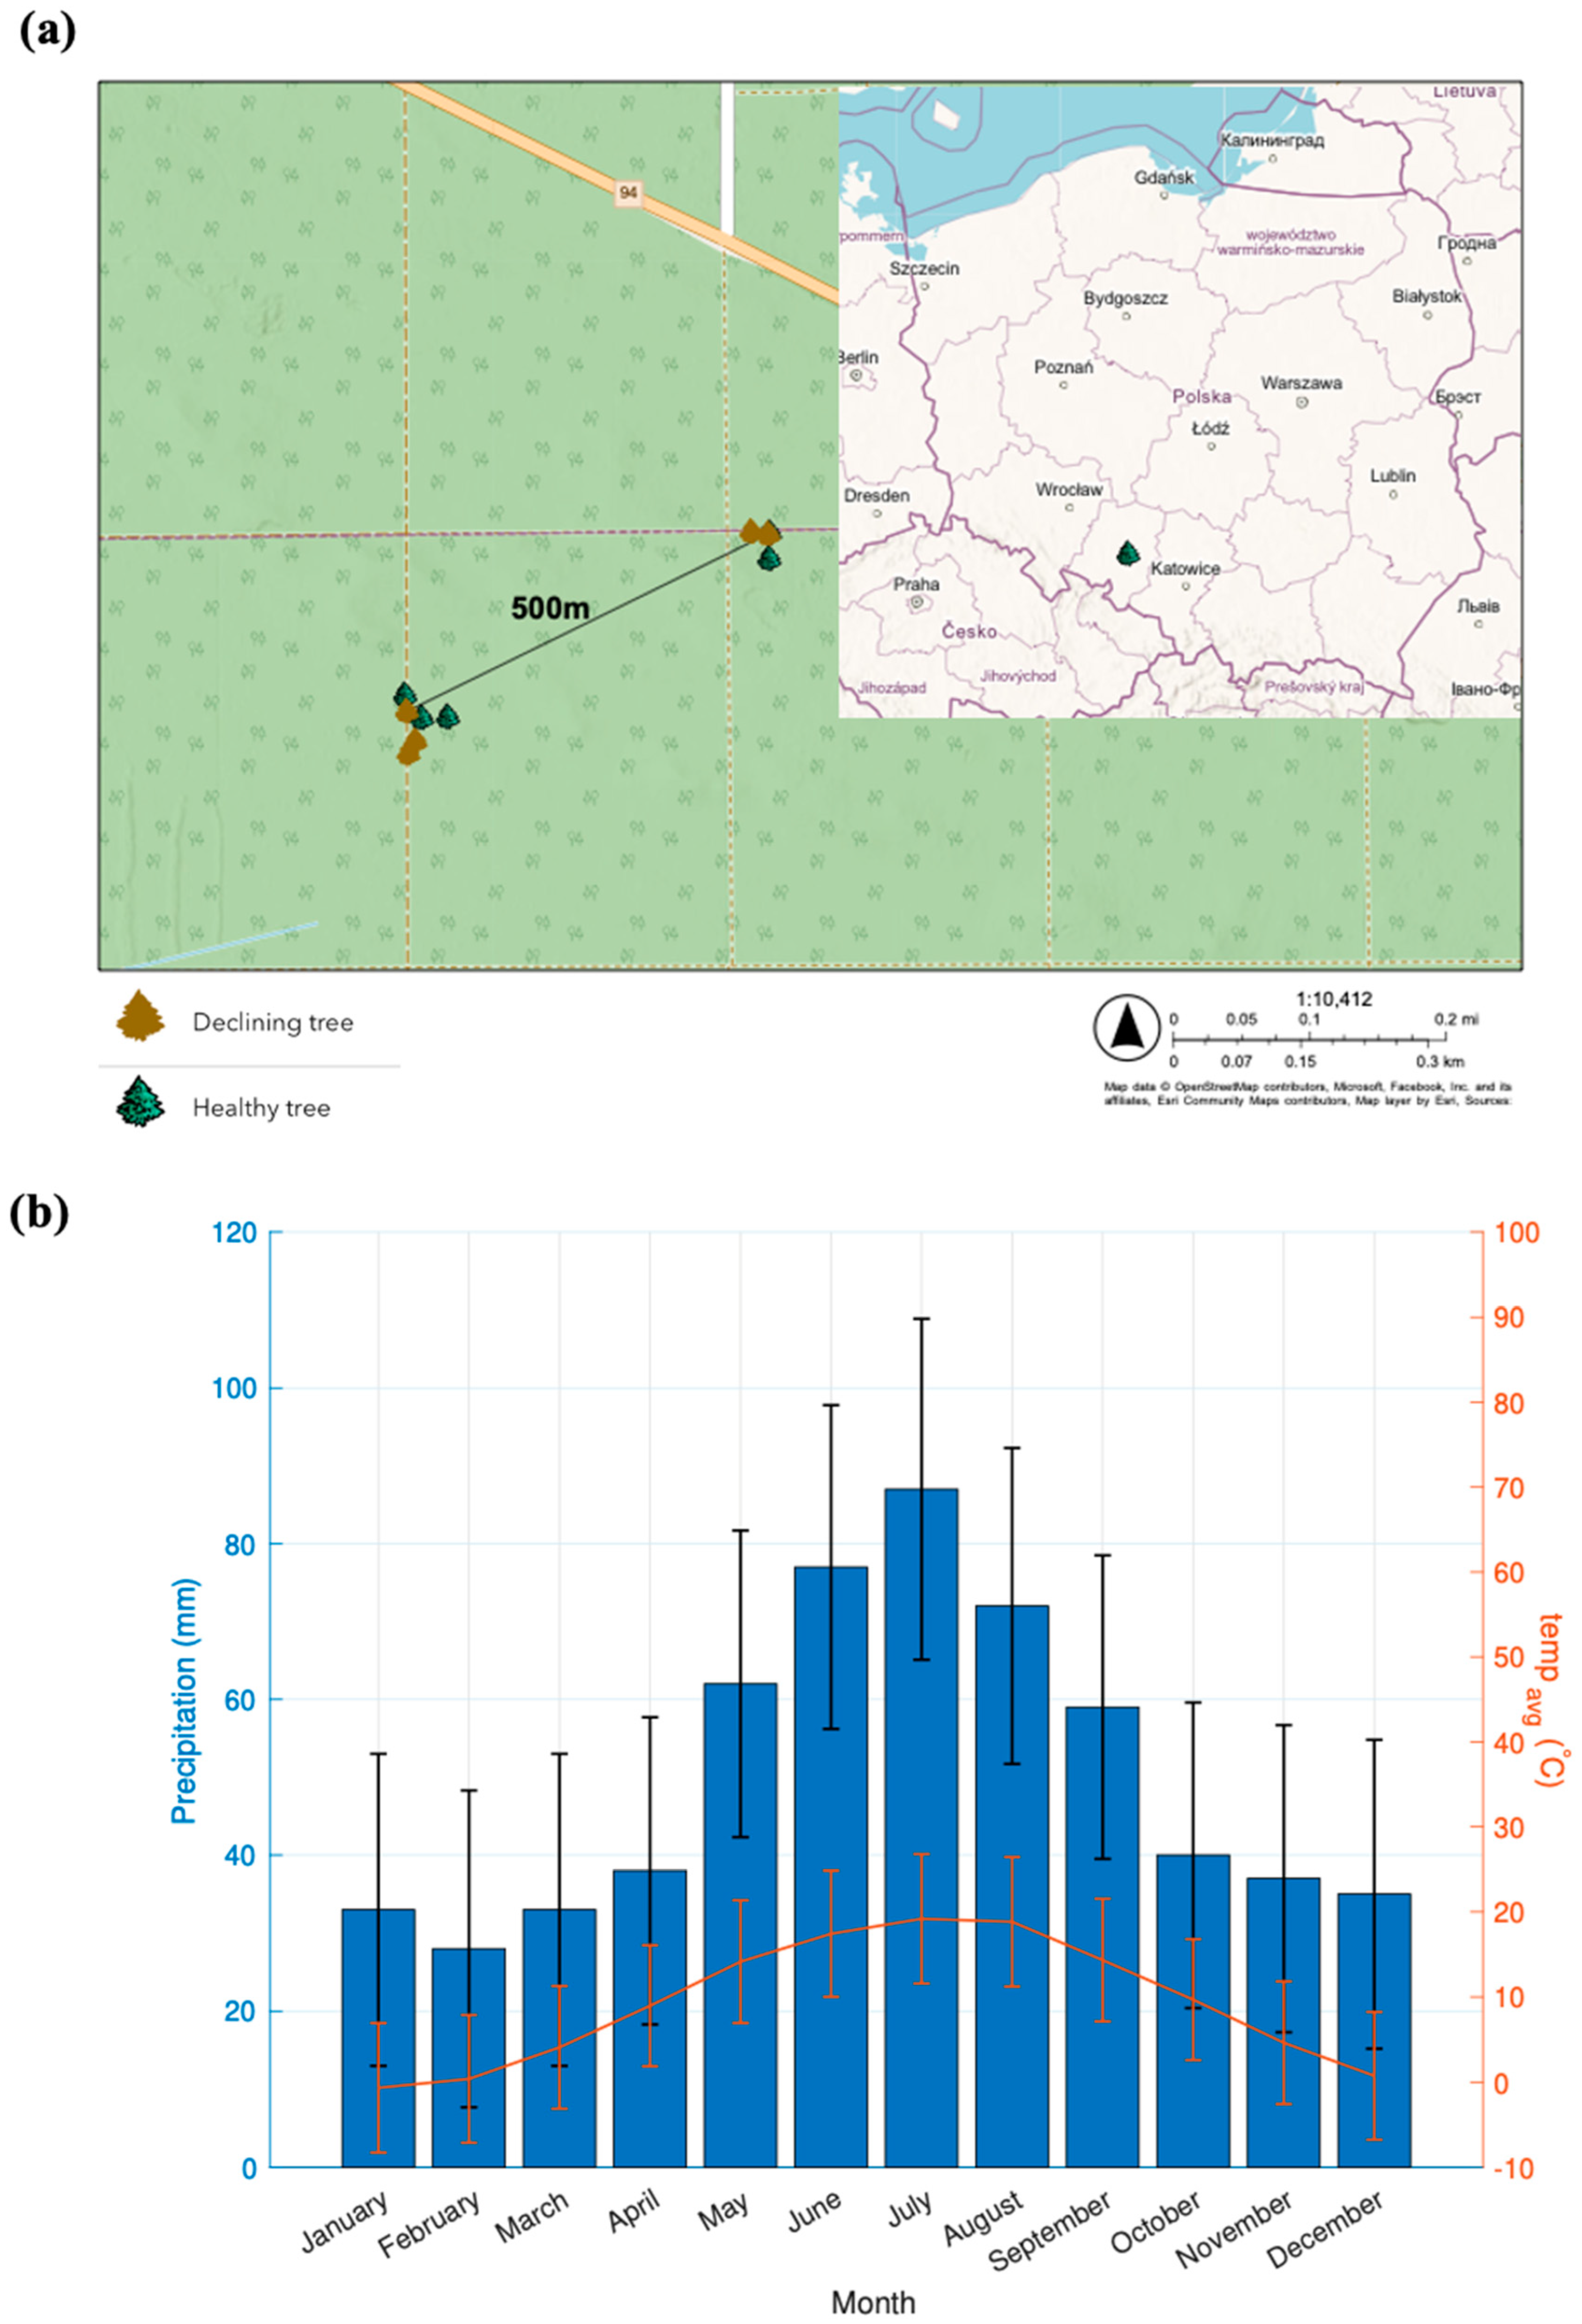
2.1. Study Area

The study region is situated in southern Poland’s Opole Forest District (50°37′19.8″ N 18°02′20.8″ E) (Figure 1a). The Forest District is 22,867.87 hectares in size, with 86% of that being made up of pine trees. The remaining areas are made up of 5% oaks, 4% birch, 3% alders, and 2% other species [49]. As reported by Lasy Państwowe [49], the majority of pine trees (57.2%) in Opole forests are between 50 and 100 years old. The lowland, periglacial, plain, and undulating environment of the sampling location is typified by gravel-type and sand-dominated soils [49].
Several drought definitions exist [50]; in our study, we chose the SPEI index for individuating droughty years. This is because SPEI is representative of the water availability to vegetation and has been widely used in forest research [6,51,52]. More specifically, we considered severely droughty years: all the years where the SPEI value was below 1.5 [53]. Opole’s forestry departments have been dealing with a major issue in recent years: an enormous number of pines (Pinus sylvestris L.) are dying each year as a result of drought events. Pine trees growing in Opole forests have been accustomed to growing in partially wet areas with high groundwater levels. As a result, the trees developed shallow root systems. A drought lasting several weeks in the summer of 2015 resulted in a decrease in the groundwater level and, as a result, cut off the pine trees from access to water. According to the study by Zespół Ochrony Lasu w Opolu [54], the amount of cut deadwood increased 17 times after the drought in 2015 compared with prior years. Prolonged low rainfall and high temperatures led to reduced pines’ resistance. The trees’ demise was accelerated by their increased susceptibility to mistletoe and bark beetle assaults [54]. At the nearby meteorological station, maximum growing-season temperatures have gradually increased over the past 20 years (by 1.3 °C relative to prior years). In the Opole Forest district, the problem of large-scale stand dieback, caused by drought, is much more serious than in other forests of southern Poland [55]. For that reason, the chosen site is a good one to study drought impact on Pinus sylvestris L. trees in various health conditions.
The Pinus sylvestrys L. species, commonly known as Scots Pine, is widespread throughout Europe, and its growth phenology varies based on latitude. In fact, the phenological cycle of the species is strongly influenced by environmental factors, such as temperature and water availability. Therefore, Scots Pine can thrive in various climatic conditions, extending or shortening its growing season. In previous studies conducted in Central Europe, the onset of cambial activity was often observed around April and lasted until autumn [56].
Monthly data on average and maximum temperatures, total monthly precipitation, and relative humidity were acquired for the examined period (1975–2022) from the “Opole” meteorological station (50°37′37″ N, 17°58′08″ E) (Figure 1a,b), which is the closest one to the sampling site (6 km). The information came from the Polish Institute of Meteorology and Water Management (IMGW-PIB) [57]. On the Opole meteorological station, the lowest temperatures are recorded in January, while the highest are in July (Figure 1b). The Standardized Precipitation–Evapotranspiration Index (SPEI-3) data at a monthly time resolution, with a 3-month backward accumulation window, were sourced from SPEIbase v.2.9 [58], and hereafter, we refer to them as “SPEI” for simplicity.

2.2. Dendrochronological Analyses

The sampling was performed in November 2022: wood cores were taken at a height of 1.3 m from the ground. From each tree, four wood cores were extracted in four different directions in space reaching the pith using a 5 mm increment borer (Haglöfs, Långsele, Sweden). Five declining trees were selected from among those marked to be fallen by foresters, based on visible signs of poor health: the presence of scant needles, poor, not plentiful crowns, and the presence of mistletoe. As a control, another 5 trees without any sign of decline were selected and sampled. Previous research confirms the effectiveness of using this number of trees in similar analyses [59,60]. Every sample was adhered to wooden stands and sanded with sandpaper of several grits (P60, P220, P400, P600) in order to improve the visibility of the annual rings. The samples processed in this way were examined using the LINTAB system, which consists of a stereo microscope connected to a computer, which records the measures of ring width with the TSAP-Win software version 0.3. The consistency of trends between several TRW series was assessed using the Gleichlaufigkeit (GLK) index [61]. The results were considered valid when they satisfied the criterion of having a GLK value higher than 60 [62]. The dplR package in RStudio [63] was used for cross-dating tree rings: the program calculated TRW correlation coefficients between a given sample and residual samples from different trees. To validate the consistency of the TRW series among trees from the same location, cross-dating quality was checked using COFECHA [64]. The bai.in function in the dplR package was used to compute BAI data [63].

2.3. Resistance, Resilience, and Recovery Indices

We estimated multiple interrelated but complementary indices to address tree health status, and in particular resistance, resilience, and recovery based on variations in tree ring width according to Lloret et al. [65]. For the computation, we assumed as reference the 5-year period preceding each drought event (identified using the low August SPEI) and used BAI as the growth indicator. The resistance index (Rt) was calculated as the ratio of growth during the drought to the growth observed in the predrought period. The resilience index (Rs) was assessed as the ratio of growth in the period after the drought to the growth in the period before the stress event. The recovery index (Rc) was obtained from the ratio of the average growth in the 5-year period after the drought and during the drought.

2.4. Isotopes Analysis and iWUE

After dendrochronological analysis, all samples were analyzed in a mass spectrometer to determine their carbon isotopic composition. We divided the samples into two groups: healthy trees and declining trees. Within each group, we analyzed mixed material from all trees. Due to the very small width of some increments (especially in the last 20 years), it was not possible to divide the samples into individual tree rings; therefore, each sample was divided into 3-year increments, starting from 1975–1977 and ending with 2020–2022. Whole wood samples were cut into small pieces and placed in tin capsules in an amount of 70–100 μg and then analyzed in IsoPrime mass spectrometer coupled with the EuroVector elementar analyzer to assess δ13C. Using the δ13C values of the divided tree ring, we estimated iWUE (μmol CO2 × mol H2O−1), which is defined as the ratio between photosynthesis rate (A) and its stomatal conductance (g), based on the following equation:
i W U E = ( c a c i ) 1.6 = A g ,
where ca is the concentration of CO2 in the atmosphere (estimated values are obtained from McCarroll, D.; Loader, N.J. [66]), ci is the concentration of CO2 inside cells, and 1.6 is the ratio of diffusivities of water and CO2 in the atmosphere. The following equation was used to determine the ci value:
c i = c a ( δ 13 C t r e e δ 13 C a i r + a ) / ( b a ) ,
where a is the fractionation factor due to CO2 diffusion through stomata (a = −4.4), and b is the fractionation factor due to Rubisco enzyme during photosynthesis (b = 27) [66]. The tree-ring data were corrected to remove atmospheric decline in δ13C, using the method proposed by McCarroll, D.; Loader, N.J. [66]. This correction was necessary because, since industrialization, the δ13C value of air has dropped by about 1.5‰, as burned coal and oil are depleted in 13C [66].
Plotting of δ13C records was performed with the dplR package [63]. Relationships between average temperature, maximum temperature, precipitation, humidity, SPEI, and δ13C were examined using the treeclim package [67]. In this package, correlations are estimated using Pearson’s linear correlation coefficient. Analyses were performed for the years 1975–2022, with the dendroclimatic window being set from May of the previous year to October of the current year. A 95% significance level (p < 0.05) was used to compute the static correlations. The differences between healthy and declining trees were examined using the two-tailed distribution of Student’s t-test, with statistically significant values for p < 0.05 [68].

3. Results

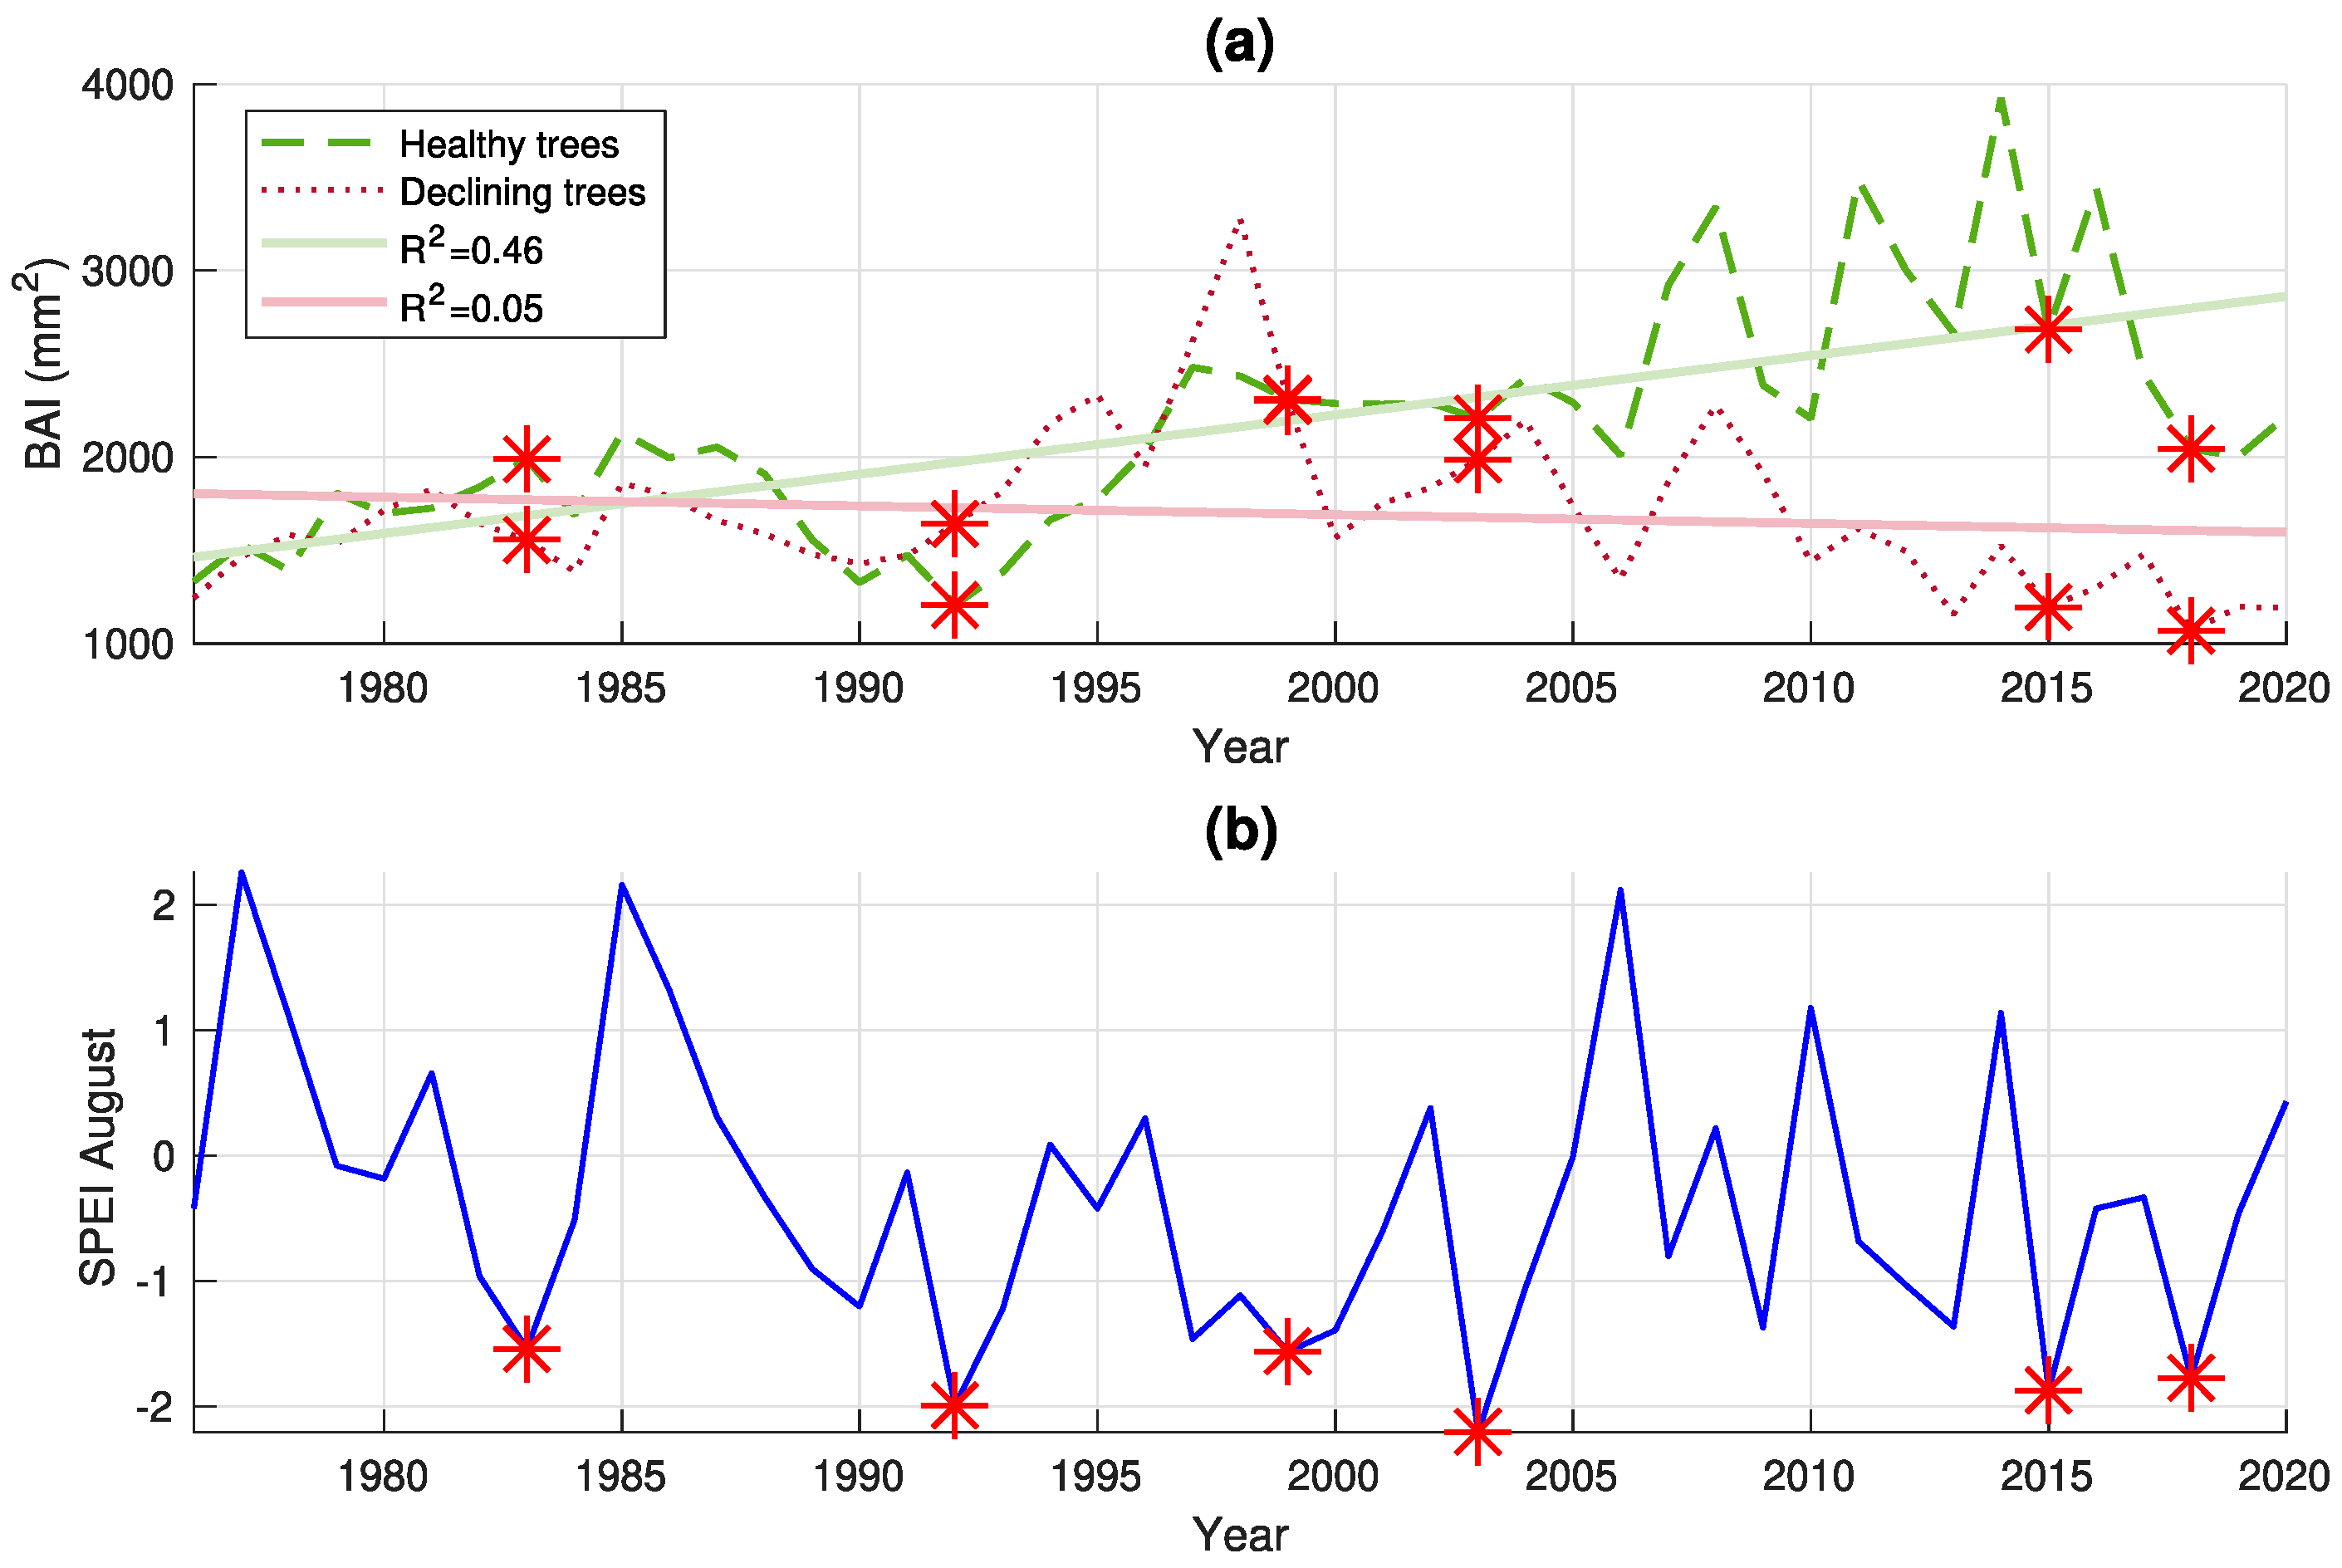
3.1. Tree Growth Analysis

The BAI chronology for healthy trees was characterized by an increasing trend (R2 = 0.46) (Figure 2a). In the case of declining trees, we did not observe a trend (R2 = 0.05) (Figure 2a). The average BAI value for healthy trees was 2177 mm2, while for declining trees, this value was 25% lower, amounting to 1675 mm2. Until 2000, the chronologies of both groups were similar; we did not observe statistically significant differences (p > 0.05). After 2000, BAI values for declining trees were clearly lower, and we observed a significant difference (p < 0.05) between the two groups of trees (Figure 2a).
In years when the August SPEI value was the lowest (SPEI < 1.5), we also observed reduced BAI values in trees of both groups (Figure 2a,b). In five of the six particularly dry years (1983, 1992, 1999, 2003, 2015, 2018), BAI values for declining trees were less than or equal to those for healthy trees (Figure 2a,b). The negative impact of drought on tree growth is supported by the calculated resistance index (Rt) (Table 1). In 9 out of 12 cases, this index was in decline (Rt < 1), indicating a reduction in tree growth for both groups during drought compared with the years preceding the drought stress occurrence (Table 1). Of the six droughts considered, only two events (1983, 1999) did not affect the Rt index of the healthy trees. In the case of declining trees, only the drought of 1992 did not influence their Rt index (Table 1). The droughts of 2015 and 2018 also led to a decrease in the resistance index value (Rs < 1) for both groups of trees, suggesting a decline in the average BAI values in the 5 years following the droughts (Table 1). Additionally, the droughts of 1999 and 2003 caused a decrease in the recovery index (Rc < 1) of declining trees, indicating a reduction in BAI over the 5 years following the drought event (Table 1). This effect was also observed in the case of healthy trees during the 2015 drought (Rc < 1) (Table 1).

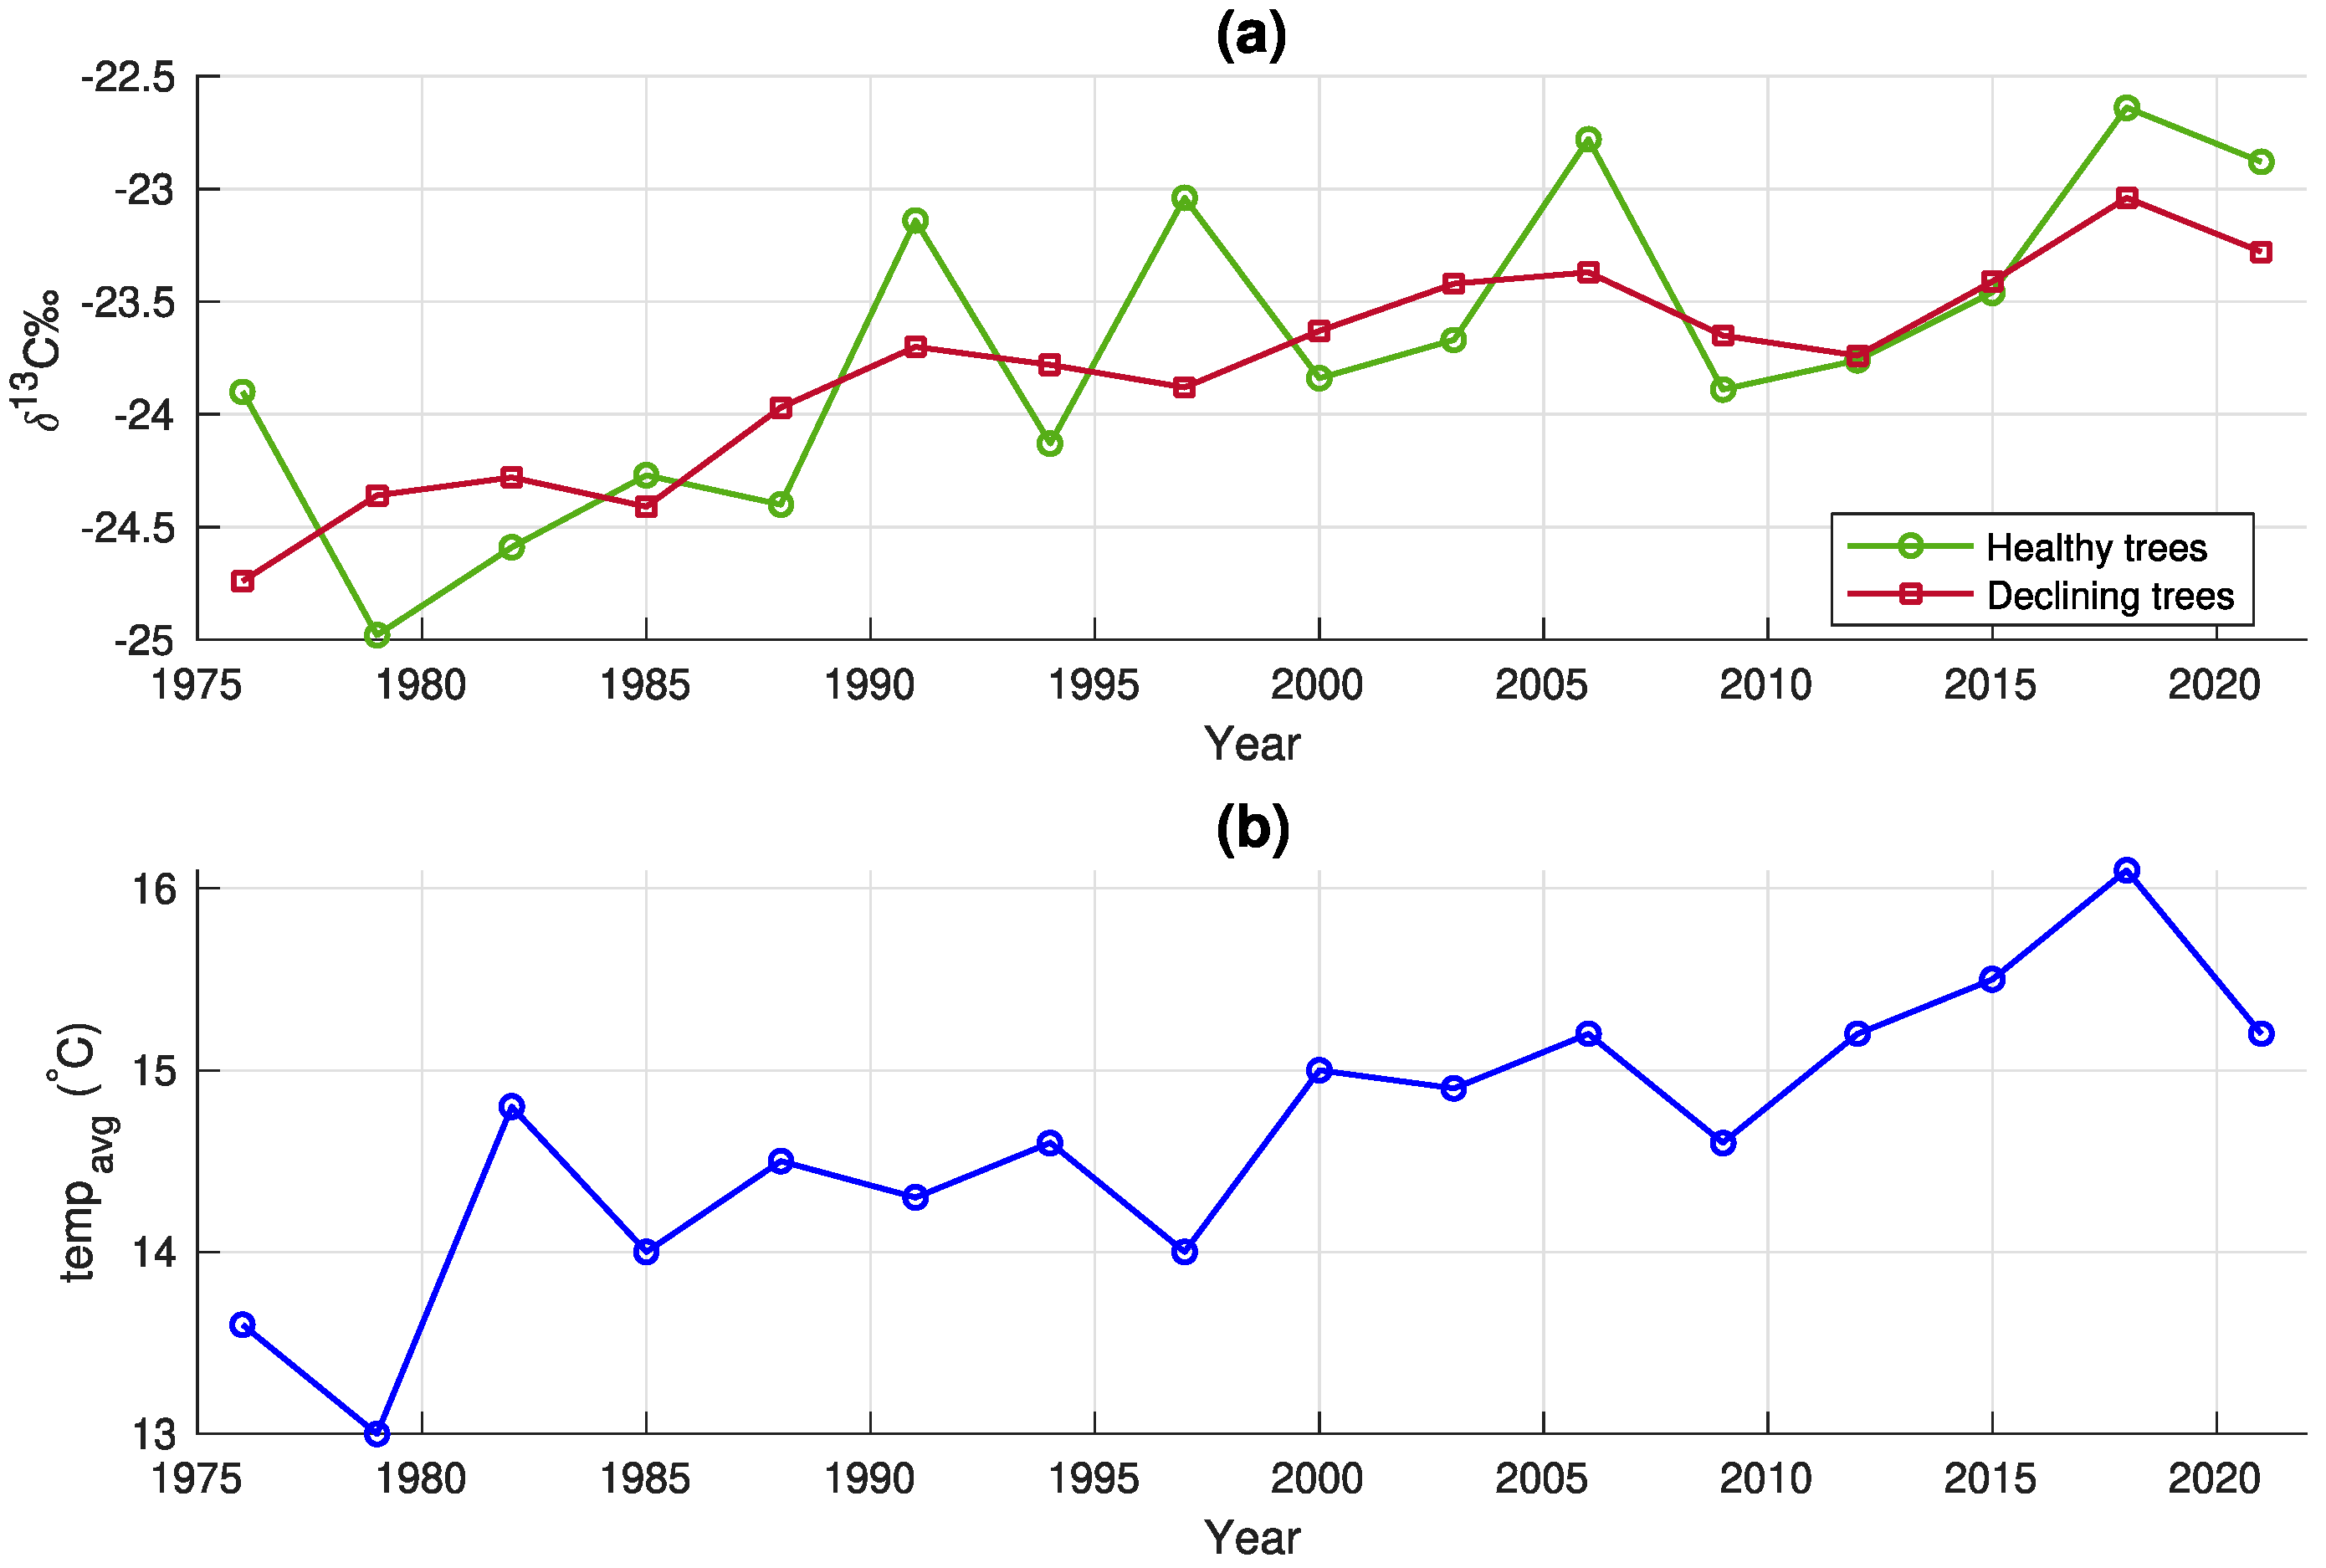
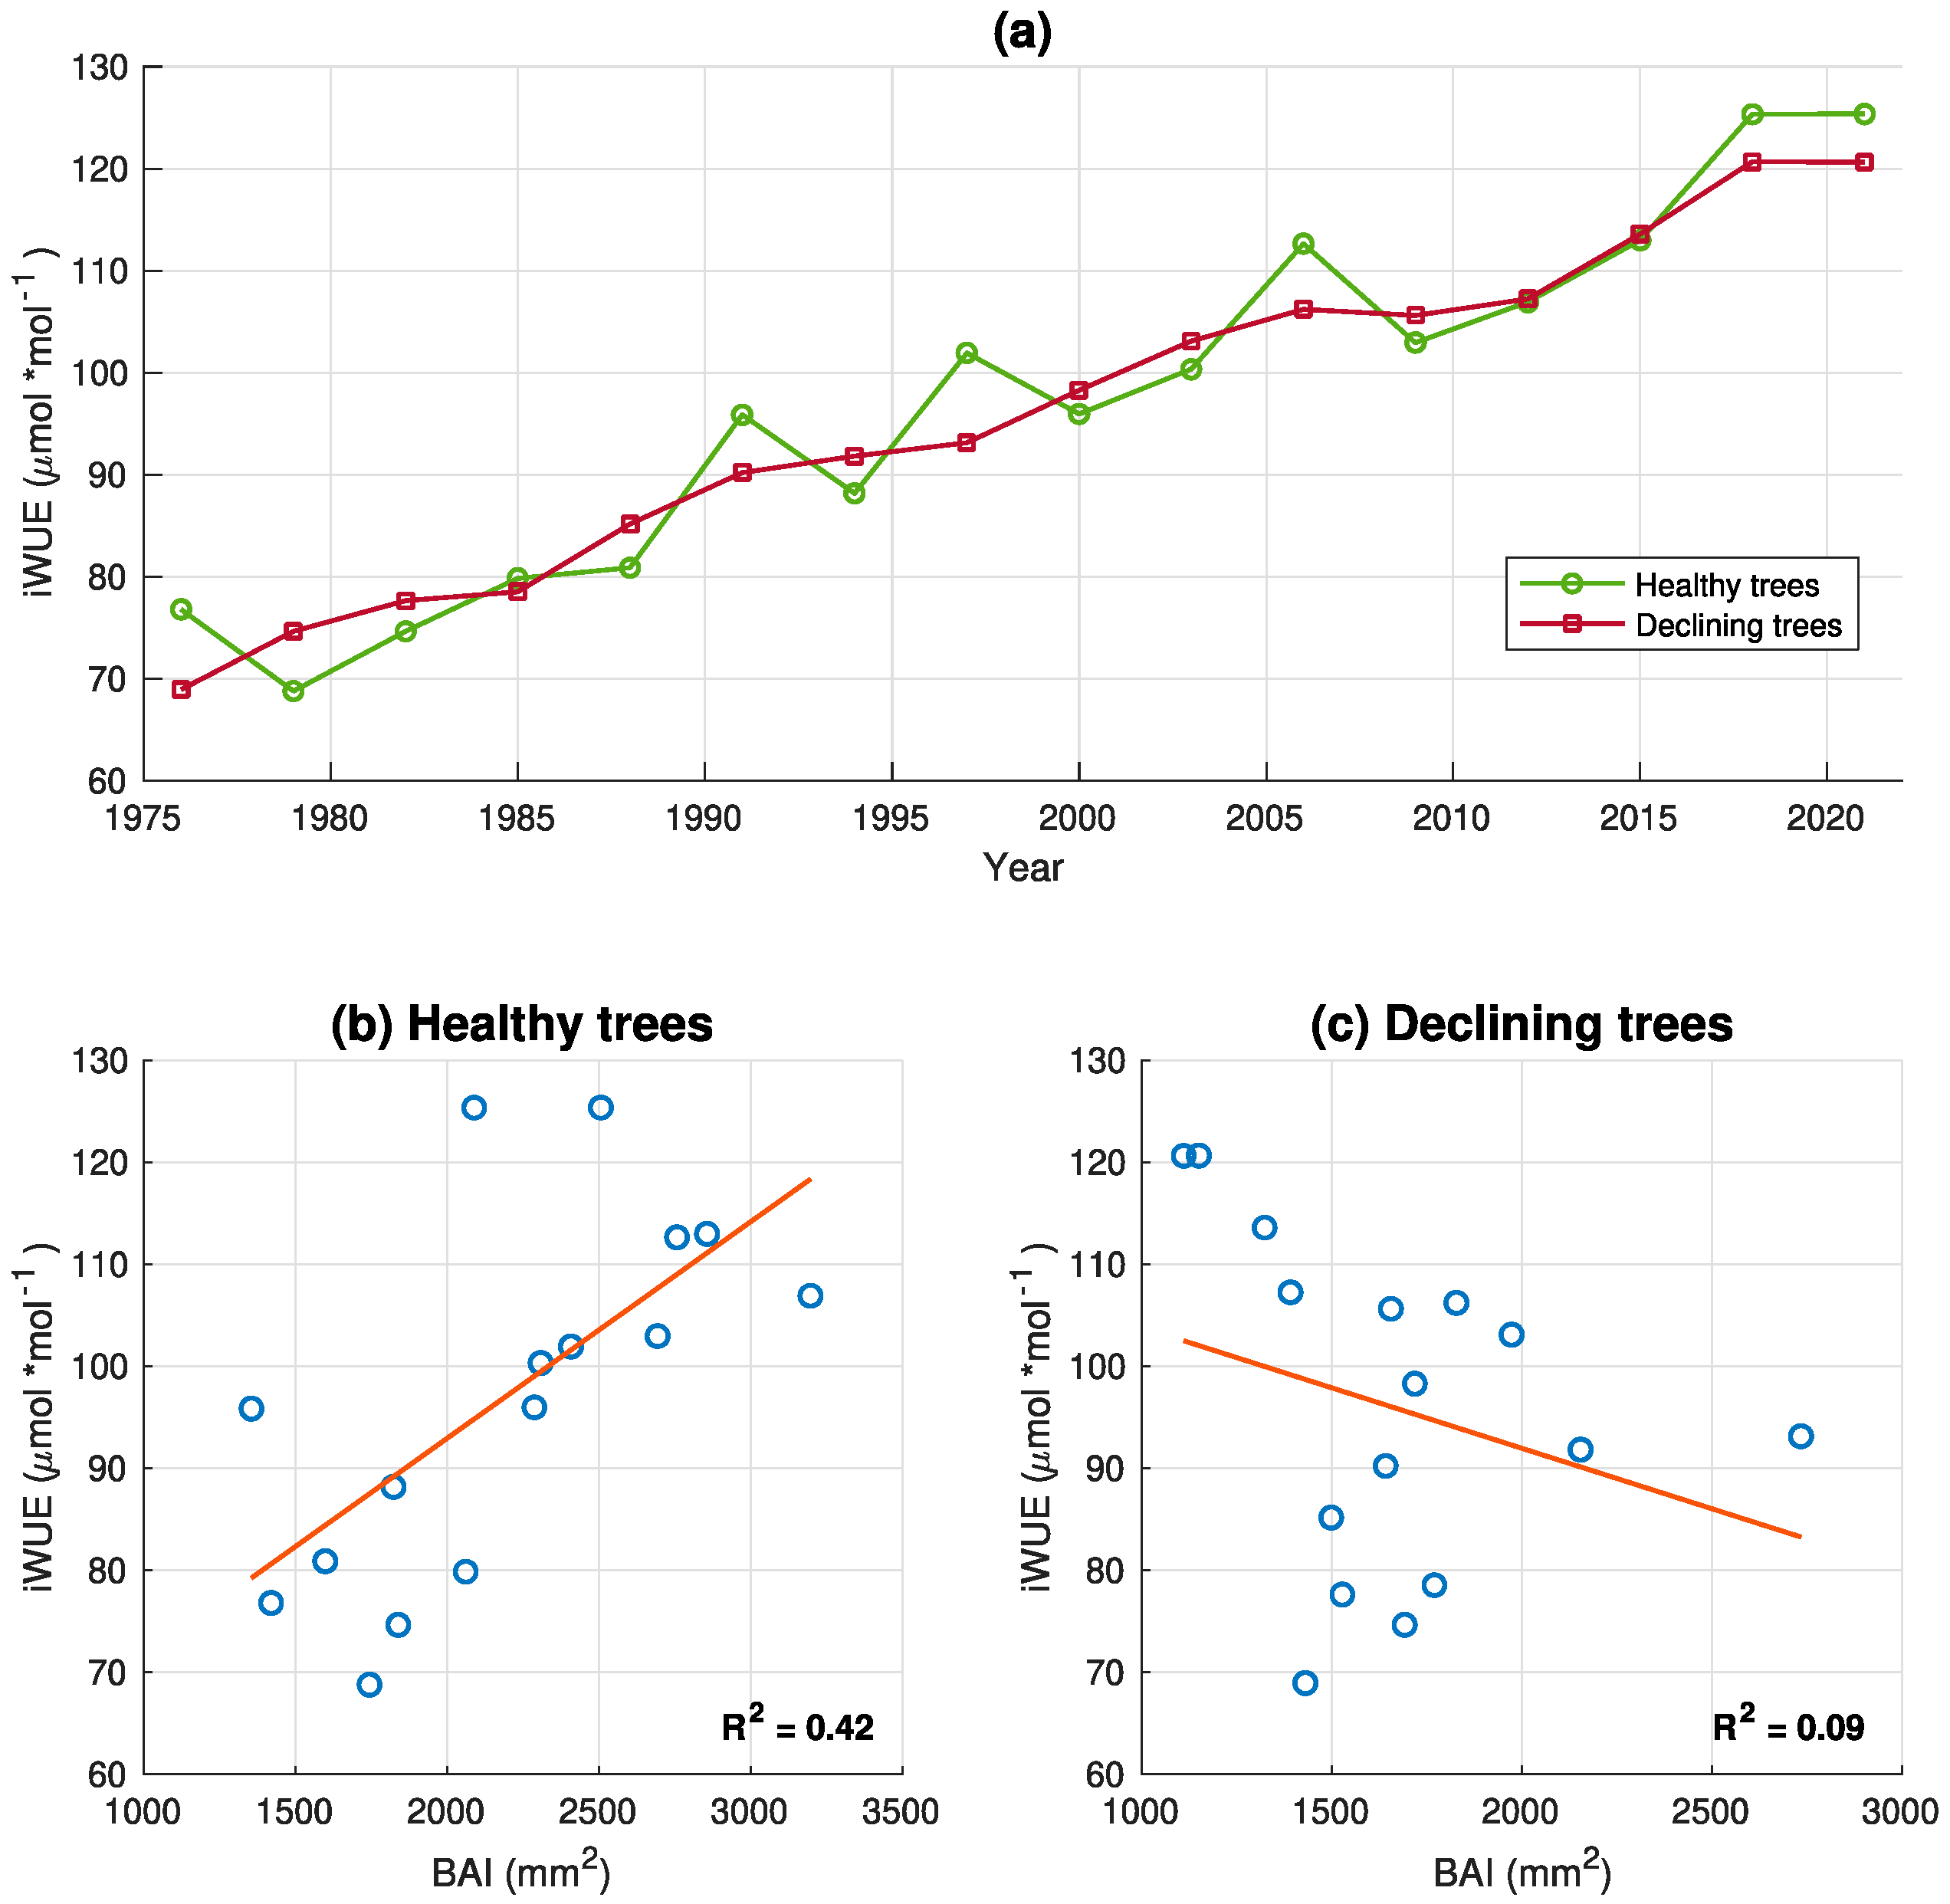
3.2. Isotope Analysis in Tree Rings

δ13C chronologies for healthy and declining trees were characterized by similar patterns (Figure 3a); we did not observe significant differences between them (p > 0.05). The average δ13C value for healthy trees was −23.71‰, and for declining trees, it was −23.79‰. Both chronologies showed an increasing trend: in the chronology of the healthy group of trees (R2 = 0.50) (Figure 3a), there were several fluctuations that were absent in the chronology of the declining trees, for which the increasing trend was stronger (R2 = 0.85) (Figure 3a). In Figure 3b, the average trend of average temperatures during the growing season is reported: in years with higher average temperatures, δ13C values of healthy trees increased.
Healthy trees showed no significant correlations of δ13C with humidity (Figure 4a). Precipitation at the beginning of the growing season in both the current and previous years influenced the δ13C values of healthy trees; we found three significant negative δ13C-precipitation correlations (Figure 4a). In the case of SPEI, one statistically significant positive δ13C-SPEI correlation occurred (June of the current year), which concerned healthy trees (Figure 4a). For this group of trees, we found one significant positive correlation for δ13C with average temperature (June of the current year) and did not find any correlation with maximum temperature (Figure 4a). Declining trees were more sensitive to changes in humidity, precipitation, and SPEI. This is evidenced by the correlation coefficients between δ13C and the indicated meteorological parameters, which were statistically significant (p < 0.05) for most of the considered months (Figure 4b). The parameter that had the greatest impact on the δ13C values of declining trees was humidity; in 13 of the 18 months analyzed, the correlation coefficients were statistically significant (negative correlations, p < 0.05) (Figure 4b). For δ13C-precipitation correlations, we also observed a high number of statistically significant correlations for declining trees that occurred in 10 months. Only correlations in the current year in April, and the previous November, were positive; the remaining correlations were negative (Figure 4b). Declining trees showed nine statistically significant δ13C-SPEI correlations. Correlations in November of the previous year and March of the current year were positive, while the remaining correlations were negative (Figure 4b). Similarly to healthy trees, declining trees showed only one significant positive correlation between δ13C and average temperature (current February) (Figure 4b). In the case of maximum temperature, we also observed one significant correlation for declining trees (negative correlation in November of the previous year).
The iWUE chronologies for healthy and declining trees showed similar patterns, and the values of the two groups did not differ significantly until 2015 (Figure 5a). After 2015, the iWUE of both groups increased, but the increase was significantly greater (p < 0.05) for healthy trees. A difference was observed between healthy and declining trees in terms of the relationship between iWUE and BAI (Figure 5b,c). In the case of healthy trees, the value of the coefficient of determination was higher (R2 = 0.42, p < 0.05), while for declining trees it was close to zero (R2 = 0.09, p < 0.05).

4. Discussion

In this study, we investigated the growth dynamics, eco-physiological responses, and intrinsic water-use efficiency of declining trees. The results of this study aim to fill the knowledge gap on the dynamics of decay of trees growing in close proximity but with different health statuses under identical climate conditions. The area selected for analysis falls within the Opole Forest District, which represents a significant critical region in Poland due to the substantial annual tree removal as a result of drought. This region also holds the record for the highest temperature ever recorded in Poland (40.2 °C).
Our results reveal distinct patterns in the BAI chronologies between the two groups, with declining trees displaying significantly lower radial growth post 2000. Droughts emerged as factors affecting both healthy and declining trees, with the latter showing greater sensitivity, marked by reduced BAI values. Carbon isotope discrimination (δ13C) patterns reflected differential sensitivities to environmental factors, with declining trees responding more significantly to changes in humidity, precipitation, and SPEI. Furthermore, the increasing trend in iWUE post 2015 highlighted a divergence between healthy and declining trees. Notably, the positive correlation between iWUE and BAI in healthy trees suggested an increase in photosynthetic rate with reduced water loss [69]. On the contrary, the lack of correlation between iWUE and BAI for declining trees could indicate the opposite, i.e., a greater water loss rather than carbon uptake [70].
The observed patterns in BAI chronologies provide valuable insights into the growth dynamics of healthy and declining trees in response to changing environmental conditions. Until the year 2000, both healthy and declining trees represented similar growth patterns. However, the difference appeared post 2000, with declining trees displaying significantly lower BAI values. The reduction in the BAI values in declining trees can be associated with the increased frequency of droughts in Poland over the last 10 years [71]. Foresters from the Opole Forest District began to observe a decline in trees in 2015 (after a severe drought); a decrease in BAI values in trees after 2000 may suggest that the decline process began earlier. The observed differences in growth patterns between healthy and declining trees are in line with findings from previous studies [72,73,74] that have reported compromised growth and productivity in trees under stress. Values of resilience, resistance, and recovery coefficients below 1 in years of reduced August SPEI for both groups of trees indicate a negative impact of drought on both declining and healthy trees [33]. The number of stress events resulting in a subsequent reduction in BAI (compared with previous years) was twice as high in the case of declining trees, which may suggest their greater sensitivity to unfavorable environmental conditions. There are many studies suggesting that low resilience to drought may actually increase the risk of mortality for the trees [75,76,77]. DeSoto et al. [39] analyzed over 3500 trees from 180 different sites and showed that trees that died due to drought were less resilient to droughts occurring decades before the event that led to their complete decline. We observed a similar pattern in our research. Declining trees showed lower resilience index (Rs) values than healthy trees during droughts (in 1983, 1999, 2003) preceding the beginning of their death, as indicated by foresters in 2015. Of the events preceding 2015, only in 1992 did we observe the opposite situation, where the resilience of healthy trees was lower than that of declining trees. However, for both groups of trees, the Rs index was greater than 1, indicating that this event may not have had a major impact on the trees. The differences within the sites in drought resilience between trees in various health states may be explained by differences in microenvironmental factors, such as intraplot heterogeneity and competition and soil properties (intrinsic) or in characteristics that dictate plant water and carbon economies (extrinsic) [11,78,79].
Although the δ13C chronologies of both groups of trees had similar overall patterns, with δ13C values increasing over time, there were notable differences in their sensitivity to specific climatic variables. Shestakova et al. [80] analyzed the sensitivity of pine trees (Pinus sylvestris L.) in European forests to changes in meteorological conditions. The δ13C values of all analyzed trees exhibited a positive correlation with average temperatures in June [80]. Specifically, trees in Finland, Norway, and Spain demonstrated significant (p < 0.05) positive δ13C–temperature correlations from June to August [80]. However, for trees in Poland, significant (p < 0.05) correlations were found only in June [80]. These findings align with our observations of δ13C average temperature correlations for healthy trees. Also, in the case of precipitation, the responses of healthy trees analyzed by us were similar to the δ13C–precipitation correlations obtained by Shestakova et al. [80] (significant negative correlation in June). This may indicate that healthy trees showed δ13C responses to average temperature and precipitation typical for the Pinus sylvestris L. species in Polish climatic conditions. Hemming et al. [81] analyzed the relationship between climate parameters and the carbon stable isotope composition of various tree species, including Pinus sylvestris L. trees in Great Britain. The authors found significant (p < 0.05) negative δ13C–precipitation correlations in June–August and negative δ13C–humidity correlations in June–September. Shestakova et al. [80] found significant (p < 0.05) negative δ13C–SPEI correlations in June and July, and positive correlation in the previous November. We also observed all the above-mentioned correlations (with precipitation, humidity, and SPEI); however, in the case of analyzed declining trees, we additionally observed significant correlations of δ13C with these parameters in other seasons (spring, winter, and autumn). Stomatal conductance may be essential for 13C discrimination in dry sites [82]. Low intercellular CO2 concentrations have been demonstrated to diminish 13C discrimination [83], raising δ13C levels. The increased δ13C values in the low total precipitation and humidity of summer months observed in our study can be the consequence of this decrease in discrimination. Negative correlations with SPEI indicate a high sensitivity of declining trees to drought conditions. Significant δ13C–SPEI correlations in the summer months confirm the impact of summer droughts (often occurring in this region) on trees. It was particularly evident in the reduction in BAI and SPEI in August for declining trees (Figure 2b). The presence of only a single significant correlation between δ13C and average and maximum temperature for both groups of trees, and many significant correlations between δ13C and humidity (especially for trees in decline), support the hypothesis that moisture-related variables play a crucial role in 13C discrimination [84].
The iWUE values we obtained are in the same range as those reported in the literature (e.g., [7,85,86]) for the same species in Europe. Further, the sharp increase in iWUE values that we observed for trees from both groups was also observed by other researchers (e.g., [87,88,89]). The largest increases in iWUE in Europe are recorded in temperate latitudes, which may be related to the drying trend, reflected in decreasing summer soil water content observed in this area [87]. Saurer M. et al. reported iWUE increases in several tree species in 35 locations in Europe between two periods: 1901–1910 and 1991–2000 [87]. The authors quantified a 39.8% increase in iWUE for Pinus sylvestris L. in Poland between the two periods specified [87]. The increase in iWUE found by us is higher (63% for healthy trees, 104% for declining trees) than the value found by Saurer M. et al. However, we underline that our analyses include data from the last 20 years, when the frequency of droughts was higher and the atmospheric CO2 was at record levels. Therefore, an accelerated increase in iWUE in this area could be explained as a cumulative effect of water scarcity and increasing CO2. Sangüesa-Barreda et al. [90] compared BAI, δ13C, and iWUE characteristics of trees infested and noninfested by mistletoe and contemporarily affected by drought. The authors found enhanced defoliation and a significant reduction in BAI of infested trees for more than 10 years prior to sampling. The changes in iWUE between the infested and noninfested groups were noticed only for the last 5 years [90]. We found a similar relationship: the differences in BAI between healthy and declining trees occurred approximately 15 years before changes were visible in iWUE. In a study realized by Linares and Camarero [91], drought-sensitive tree species were analyzed, some of which began to decline as a result of the drought, while some remained in good health condition. Both groups of trees showed an increasing trend in iWUE; however, in the case of healthy trees, the growth was much higher at the end of the analyzed time range than for declining trees [91]. In the case of nondeclining trees, the authors also observed a significant link between iWUE and growth, which did not occur in the case of declining trees [91]. Our findings are coherent with those. The lack of correlation between growth and iWUE in declining trees suggests a greater water loss compared with photosynthetic rates. Therefore, declining trees were less able to increase their water use efficiency compared with healthy trees. These trees may have reached a physiological threshold in their capacity to enhance iWUE when CO2 rises [9,92]. Differences in the results for healthy trees suggest that they chose a different adaptive strategy under drought stress (the increased photosynthetic rate or alternatively the reduced stomatal conductance likely served to minimize water loss during periods of drought) [93]. The significant positive correlation found in the healthy trees between BAI and iWUE (Figure 5b), as well as the increasing trend in BAI chronology (Figure 2a), seems to confirm their adaptive strategy, which resulted in faster growth [94].
Of course, we should be aware of the possibility of the occurrence of genetic differences and other factors operating at the microlocal or local scale between trees from both groups. However, in the case of our research, the small, coherent study site and the proximity of trees make it unlikely that soil properties and microclimatic conditions caused the observed differences in drought sensitivity between healthy and declining trees, allowing these factors to be partially excluded.

5. Conclusions

The increased frequency of drought events occurring in recent years led to an increase in the mortality of weaker tree specimens. Our research has shown that changes in growth patterns can appear long before changes that can be observed by visual assessment of a tree’s health (thinning tree crowns, presence of mistletoe, falling needles). Dendrochronological analyses might constitute a valuable tool enabling the early detection of poor forest conditions, thus allowing timely intervention aimed at preserving the ecosystem, its functions, and services. We also showed that trees growing in the same site condition may have different responses to the meteorological parameters and different resilience to drought. In particular, we demonstrated a much greater sensitivity of declining trees to changes in humidity, precipitation, and SPEI, as well as their lower resilience to drought episodes, which consequently led to their complete decline. The reduction in the iWUE value of declining trees compared with healthy trees, observed in the last 5 years of the analysis period, allow us to hypothesize that these trees were able to adopt different strategies to cope with drought stress. In particular, healthy trees minimized water loss during periods of drought, either through increased rates of photosynthesis or reduced stomatal conductance, which resulted in better condition of these trees.
Our study showed that dendrochronology enables early detection of poor forest health conditions and represents important knowledge for forest management strategies at local and regional scales.

Author Contributions

Conceptualization, B.B., G.B. and S.P. methodology, software: B.B., F.N. and J.P.K.; investigation, B.B., S.P., F.N., J.P.K. and G.B.; resources, S.P. and G.B.; writing—original draft preparation B.B.; writing—review and editing, B.B., S.P., F.N., J.P.K. and G.B.; supervision S.P. and G.B. All authors have read and agreed to the published version of the manuscript.

Funding

This research received no external funding.

Data Availability Statement

The data presented in this study are available on request from the corresponding author.

Acknowledgments

This research is linked to activities conducted within the MIUR Project (PRIN 2020) “Unravelling interactions between WATER and carbon cycles during drought and their impact on water resources and forest and grassland ecosySTEMs in the Mediterranean climate (WATERSTEM)” (protocol code: 20202WF53Z).

Conflicts of Interest

The authors declare no conflicts of interest.

References

  1. Parmesan, C.; Morecroft, M.D.; Trisurat, Y. Climate Change 2022: Impacts, Adaptation and Vulnerability; GIEC: Geneva, Switzerland, 2022; Available online: https://hal.science/hal-03774939 (accessed on 11 October 2023).
  2. Dai, A. Increasing Drought under Global Warming in Observations and Models. Nat. Clim. Chang. 2013, 3, 52–58. [Google Scholar] [CrossRef]
  3. Senf, C.; Pflugmacher, D.; Zhiqiang, Y.; Sebald, J.; Knorn, J.; Neumann, M.; Hostert, P.; Seidl, R. Canopy mortality has doubled in Europe’s temperate forests over the last three decades. Nat. Commun. 2018, 9, 4978. [Google Scholar] [CrossRef] [PubMed]
  4. Bansal, S.; Hallsby, G.; Löfvenius, M.O.; Nilsson, M.-C. Synergistic, additive and antagonistic impacts of drought and herbivory on Pinus sylvestris: Leaf, tissue and whole-plant responses and recovery. Tree Physiol. 2013, 33, 451–463. [Google Scholar] [CrossRef] [PubMed]
  5. Michalski, J.; Starzyk, J.; Kolk, A.; Grodzki, W. Threat of Norway spruce caused by the bark beetle Ips typographus (L.) in the stands of the Forest Promotion Complex “Puszcza Balowieska” in 2000–2002. Lesn. Pr. Badaw. 2004, 3, 5–30. [Google Scholar]
  6. Bokwa, A.; Klimek, M.; Krzaklewski, P.; Kukułka, W. Drought Trends in the Polish Carpathian Mts in the Years 1991–2020. Atmosphere 2021, 12, 1259. [Google Scholar] [CrossRef]
  7. Timofeeva, G.; Treydte, K.; Bugmann, H.; Rigling, A.; Schaub, M.; Siegwolf, R.; Saurer, M. Long-term effects of drought on tree-ring growth and carbon isotope variability in Scots pine in a dry environment. Tree Physiol. 2017, 37, 1028–1041. [Google Scholar] [CrossRef] [PubMed]
  8. Benisiewicz, B.; Pawelczyk, S.; Niccoli, F.; Kabala, J.; Battipaglia, G. Investigation of Trees’ Sensitivity to Drought: A Case Study in the Opole Region, Poland. Geochronometria 2024, 50, 135–143. [Google Scholar] [CrossRef]
  9. Carnicer, J.; Coll, M.; Ninyerola, M.; Pons, X.; Sánchez, G.; Peñuelas, J. Widespread crown condition decline, food web disruption, and amplified tree mortality with increased climate change-type drought. Proc. Natl. Acad. Sci. USA 2011, 108, 1474–1478. [Google Scholar] [CrossRef]
  10. Steinkamp, J.; Hickler, T. Is drought-induced forest dieback globally increasing? J. Ecol. 2015, 103, 31–43. [Google Scholar] [CrossRef]
  11. McDowell, N.; Pockman, W.T.; Allen, C.D.; Breshears, D.D.; Cobb, N.; Kolb, T.; Plaut, J.; Sperry, J.; West, A.; Williams, D.G.; et al. Mechanisms of plant survival and mortality during drought: Why do some plants survive while others succumb to drought? New Phytol. 2008, 178, 719–739. [Google Scholar] [CrossRef]
  12. Sevanto, S.; Mcdowell, N.G.; Dickman, L.T.; Pangle, R.; Pockman, W.T. How do trees die? A test of the hydraulic failure and carbon starvation hypotheses. Plant Cell Environ. 2014, 37, 153–161. [Google Scholar] [CrossRef] [PubMed]
  13. Adams, H.D.; Zeppel, M.J.B.; Anderegg, W.R.L.; Hartmann, H.; Landhäusser, S.M.; Tissue, D.T.; Huxman, T.E.; Hudson, P.J.; Franz, T.E.; Allen, C.D.; et al. A multi-species synthesis of physiological mechanisms in drought-induced tree mortality. Nat. Ecol. Evol. 2017, 1, 1285–1291. [Google Scholar] [CrossRef]
  14. Puchi, P.F.; Camarero, J.J.; Battipaglia, G.; Carrer, M. Retrospective analysis of wood anatomical traits and tree-ring isotopes suggests site-specific mechanisms triggering Araucaria araucana drought-induced dieback. Glob. Chang. Biol. 2021, 27, 6394–6408. [Google Scholar] [CrossRef] [PubMed]
  15. Martín-Gómez, P.; Aguilera, M.; Pemán, J.; Gil-Pelegrín, E.; Ferrio, J.P. Contrasting ecophysiological strategies related to drought: The case of a mixed stand of Scots pine (Pinus sylvestris) and a submediterranean oak (Quercus subpyrenaica). Tree Physiol. 2017, 37, 1478–1492. [Google Scholar] [CrossRef] [PubMed]
  16. Jaeger, A.C.H.; Hartmann, M.; Conz, R.F.; Six, J.; Solly, E.F. Drought-induced tree mortality in Scots pine mesocosms promotes changes in soil microbial communities and trophic groups. Appl. Soil Ecol. 2024, 194, 105198. [Google Scholar] [CrossRef]
  17. Shestakova, T.A.; Sin, E.; Gordo, J.; Voltas, J. Tree-ring isotopic imprints on time series of reproductive effort indicate warming-induced co-limitation by sink and source processes in stone pine. Tree Physiol. 2023, 44, tpad147. [Google Scholar] [CrossRef] [PubMed]
  18. Solly, E.F.; Jaeger, A.C.H.; Barthel, M.; Werner, R.A.; Zürcher, A.; Hagedorn, F.; Six, J.; Hartmann, M. Water limitation intensity shifts carbon allocation dynamics in Scots pine mesocosms. Plant Soil 2023, 490, 499–519. [Google Scholar] [CrossRef] [PubMed]
  19. Kursar, T.A.; Engelbrecht, B.M.J.; Burke, A.; Tyree, M.T.; EI Omari, B.; Giraldo, J.P. Tolerance to low leaf water status of tropical tree seedlings is related to drought performance and distribution. Funct. Ecol. 2009, 23, 93–102. [Google Scholar] [CrossRef]
  20. Anderegg, W.R.L.; Klein, T.; Bartlett, M.; Sack, L.; Pellegrini, A.F.A.; Choat, B.; Jansen, S. Meta-analysis reveals that hydraulic traits explain cross-species patterns of drought-induced tree mortality across the globe. Proc. Natl. Acad. Sci. USA 2016, 113, 5024–5029. [Google Scholar] [CrossRef]
  21. Buras, A.; Schunk, C.; Zeiträg, C.; Herrmann, C.; Kaiser, L.; Lemme, H.; Straub, C.; Taeger, S.; Gößwein, S.; Klemmt, H.-J.; et al. Are Scots pine forest edges particularly prone to drought-induced mortality? Environ. Res. Lett. 2018, 13, 025001. [Google Scholar] [CrossRef]
  22. Camarero, J.J.; Gazol, A.; Galván, J.D.; Sangüesa-Barreda, G.; Gutiérrez, E. Disparate effects of global-change drivers on mountain conifer forests: Warming-induced growth enhancement in young trees vs. CO2 fertilization in old trees from wet sites. Glob. Chang. Biol. 2015, 21, 738–749. [Google Scholar] [CrossRef] [PubMed]
  23. Etzold, S.; Ziemińska, K.; Rohner, B.; Bottero, A.; Bose, A.K.; Ruehr, N.K.; Zingg, A.; Rigling, A. One Century of Forest Monitoring Data in Switzerland Reveals Species- and Site-Specific Trends of Climate-Induced Tree Mortality. Front. Plant Sci. 2019, 10, 436319. [Google Scholar] [CrossRef] [PubMed]
  24. Taeger, S.; Zang, C.; Liesebach, M.; Schneck, V.; Menzel, A. Impact of climate and drought events on the growth of Scots pine (Pinus sylvestris L.) provenances. For. Ecol. Manag. 2013, 307, 30–42. [Google Scholar] [CrossRef]
  25. Boczoń, A.; Kowalska, A.; Dudzińska, M.; Wróbel, M. Drought in Polish Forests in 2015. Pol. J. Environ. Stud. 2016, 25, 1857–1862. [Google Scholar] [CrossRef]
  26. Camarero, J.; Colangelo, M.; Gazol, A.; Azorin-Molina, C. Drought and cold spells trigger dieback of temperate oak and beech forests in northern Spain. Dendrochronologia 2021, 66, 125812. [Google Scholar] [CrossRef]
  27. Bose, A.K.; Gessler, A.; Bolte, A.; Bottero, A.; Buras, A.; Cailleret, M.; Camarero, J.J.; Haeni, M.; Hereş, A.-M.; Hevia, A.; et al. Growth and resilience responses of Scots pine to extreme droughts across Europe depend on predrought growth conditions. Glob. Chang. Biol. 2020, 26, 4521–4537. [Google Scholar] [CrossRef] [PubMed]
  28. Cherubini, P.; Battipaglia, G.; Innes, J.L. Tree Vitality and Forest Health: Can Tree-Ring Stable Isotopes Be Used as Indicators? Curr. For. Rep. 2021, 7, 69–80. [Google Scholar] [CrossRef]
  29. Tallieu, C.; Badeau, V.; Allard, D.; Nageleisen, L.-M.; Bréda, N. Year-to-year crown condition poorly contributes to ring width variations of beech trees in French ICP level I network. For. Ecol. Manag. 2020, 465, 118071. [Google Scholar] [CrossRef]
  30. Griffiths, B.S.; Ritz, K.; Bardgett, R.D.; Cook, R.; Christensen, S.; Ekelund, F.; Sørensen, S.J.; Bååth, E.; Bloem, J.; De Ruiter, P.C.; et al. Ecosystem response of pasture soil communities to fumigation-induced microbial diversity reductions: An examination of the biodiversity-ecosystem function relationship. Oikos 2000, 90, 279–294. [Google Scholar] [CrossRef]
  31. Wardle, D.A.; Bonner, K.I.; Barker, G.M. Stability of ecosystem properties in response to above-ground functional group richness and composition. Oikos 2000, 89, 11–23. [Google Scholar] [CrossRef]
  32. Orwin, K.H.; Wardle, D.A. New indices for quantifying the resistance and resilience of soil biota to exogenous disturbances. Soil Biol. Biochem. 2004, 36, 1907–1912. [Google Scholar] [CrossRef]
  33. Lloret, F.; Keeling, E.G.; Sala, A. Components of tree resilience: Effects of successive low-growth episodes in old ponderosa pine forests. Oikos 2011, 120, 1909–1920. [Google Scholar] [CrossRef]
  34. Schwarz, J.; Skiadaresis, G.; Kohler, M.; Kunz, J.; Schnabel, F.; Vitali, V.; Bauhus, J. Quantifying Growth Responses of Trees to Drought—A Critique of Commonly Used Resilience Indices and Recommendations for Future Studies. Curr. For. Rep. 2020, 6, 185–200. [Google Scholar] [CrossRef]
  35. Becker, M.; Bräker, O.; Kenk, G.; Schneider, O.; Schweingruber, F. Crown condition and growth of forest trees over recent decades in the area where Germany, France and Switzerland meet. Allg. Forstz. 1990, 11, 263–274. [Google Scholar]
  36. Adams, M.; Buckley, T.; Turnbull, T. Diminishing CO2-driven gains in water-use efficiency of global forests. Nat. Clim. Chang. 2020, 10, 466–471. [Google Scholar] [CrossRef]
  37. Farquhar, G.D.; Ehleringer, J.R.; Hubick, K.T. Carbon Isotope Discrimination and Photosynthesis. Annu. Rev. Plant Physiol. Plant Mol. Biol. 1989, 40, 503–537. [Google Scholar] [CrossRef]
  38. Bryukhanova, M.; Vaganov, E.A.; Mund, M.; Knohl, A.; Linke, P.; Boerner, A.; Schulze, E. Inter-annual and seasonal variability of radial growth, wood density and carbon isotope ratios in tree rings of beech (Fagus sylvatica) growing in Germany and Italy. Trees 2006, 20, 571–586. [Google Scholar] [CrossRef]
  39. DeSoto, L.; Cailleret, M.; Sterck, F.; Jansen, S.; Kramer, K.; Robert, E.M.R.; Aakala, T.; Amoroso, M.M.; Bigler, C.; Camarero, J.J.; et al. Low growth resilience to drought is related to future mortality risk in trees. Nat. Commun. 2020, 11, 545. [Google Scholar] [CrossRef] [PubMed]
  40. Senf, C.; Buras, A.; Zang, C.S.; Rammig, A.; Seidl, R. Excess forest mortality is consistently linked to drought across Europe. Nat. Commun. 2020, 11, 6200. [Google Scholar] [CrossRef]
  41. Colangelo, M.; Camarero, J.; Battipaglia, G.; Borghetti, M.; Micco, V.; Gentilesca, T.; Ripullone, F. A multi-proxy assessment of dieback causes in a Mediterranean oak species. Tree Physiol. 2017, 37, 617–631. [Google Scholar] [CrossRef]
  42. Lloret, F.; García, C. Inbreeding and neighbouring vegetation drive drought-induced die-off within juniper populations. Funct. Ecol. 2016, 30, 1696–1704. [Google Scholar] [CrossRef]
  43. Jump, A.S.; Peñuelas, J. Running to stand still: Adaptation and the response of plants to rapid climate change. Ecol. Lett. 2005, 8, 1010–1020. [Google Scholar] [CrossRef]
  44. Galiano, L.; Martinez Vilalta, J.; Sabaté, S.; Lloret, F. Determinants of drought effects on crown condition and their relationship with depletion of carbon reserves in a Mediterranean Holm oak forest. Tree Physiol. 2012, 32, 478–489. [Google Scholar] [CrossRef]
  45. Bigler, C.; Bräker, O.U.; Bugmann, H.; Dobbertin, M.; Rigling, A. Drought as an Inciting Mortality Factor in Scots Pine Stands of the Valais, Switzerland. Ecosystems 2006, 9, 330–343. [Google Scholar] [CrossRef]
  46. Galiano, L.; Martinez Vilalta, J.; Lloret, F. Drought-Induced Multifactor Decline of Scots Pine in the Pyrenees and Potential Vegetation Change by the Expansion of Co-occurring Oak Species. Ecosystems 2010, 13, 978–991. [Google Scholar] [CrossRef]
  47. Garcia-Forner, N.; Sala, A.; Biel, C.; Savé, R.; Martínez-Vilalta, J. Individual traits as determinants of time to death under extreme drought in Pinus sylvestris L. Tree Physiol. 2016, 36, 1196–1209. [Google Scholar] [CrossRef] [PubMed]
  48. Herrero, A.; González-Gascueña, R.; González-Díaz, P.; Ruiz-Benito, P.; Andivia, E. Reduced growth sensitivity to water availability as potential indicator of drought-induced tree mortality risk in a Mediterranean Pinus sylvestris L. forest. Front. For. Glob. Chang. 2023, 6, 1249246. [Google Scholar] [CrossRef]
  49. Lasy Państwowe. Bank Danych o Lasach (Forest Data Bank); Lasy Państwowe: Warszawa, Poland, 2023. Available online: https://www.bdl.lasy.gov.pl/portal/ (accessed on 11 October 2023).
  50. Van Loon, A.F.; Stahl, K.; Di Baldassarre, G.; Clark, J.; Rangecroft, S.; Wanders, N.; Gleeson, T.; Van Dijk, A.I.J.M.; Tallaksen, L.M.; Hannaford, J.; et al. Drought in a human-modified world: Reframing drought definitions, understanding, and analysis approaches. Hydrol. Earth Syst. Sci. 2016, 20, 3631–3650. [Google Scholar] [CrossRef]
  51. Somorowska, U. Changes in Drought Conditions in Poland over the Past 60 Years Evaluated by the Standardized Precipitation-Evapotranspiration Index. Acta Geophys. 2016, 64, 2530–2549. [Google Scholar] [CrossRef]
  52. Liu, C.; Yang, C.; Yang, Q.; Wang, J. Spatiotemporal drought analysis by the standardized precipitation index (SPI) and standardized precipitation evapotranspiration index (SPEI) in Sichuan Province, China. Sci. Rep. 2021, 11, 1280. [Google Scholar] [CrossRef]
  53. Shekhar, A.; Shapiro, C.A. What do meteorological indices tell us about a long-term tillage study? Soil Tillage Res. 2019, 193, 161–170. [Google Scholar] [CrossRef]
  54. Zespół Ochrony Lasu w Opolu. Sośniny w Dalszym Ciągu Zagrożone (Sośniny Are Still Under Threat). 2019. Available online: https://www.zolopole.lasy.gov.pl (accessed on 14 April 2023).
  55. RDLP Katowice. Ochrona Lasów na Terenie RDLP w Katowicach (Protection of Forests in the RDLP in Katowice). 2022. Available online: https://www.katowice.lasy.gov.pl/ochrona-lasu1#.VqXyuFIXukQ (accessed on 14 April 2023).
  56. Swidrak, I.; Gruber, A.; Kofler, W.; Oberhuber, W. Effects of environmental conditions on onset of xylem growth in Pinus sylvestris under drought. Tree Physiol. 2011, 31, 483–493. [Google Scholar] [CrossRef] [PubMed]
  57. Polish Institute of Meteorology and Water Management (IMGW-PIB). 2022. Available online: https://danepubliczne.imgw.pl (accessed on 3 December 2022).
  58. Beguería, S.; Serrano, S.M.V.; Reig-Gracia, F.; Garcés, B.L. SPEIbase v.2.9 (Dataset). DIGITAL.CSIC. Version 2.9. 2023. Available online: http://hdl.handle.net/10261/332007 (accessed on 17 December 2023).
  59. Leonelli, G.; Battipaglia, G.; Cherubini, P.; Saurer, M.; Siegwolf, R.T.W.; Maugeri, M.; Stenni, B.; Fusco, S.; Maggi, V.; Pelfini, M. Larix decidua δ18O tree-ring cellulose mainly reflects the isotopic signature of winter snow in a high-altitude glacial valley of the European Alps. Sci. Total Environ. 2017, 579, 230–237. [Google Scholar] [CrossRef] [PubMed]
  60. Leonelli, G.; Pelfini, M.; Panseri, S.; Battipaglia, G.; Vezzola, L.; Giorgi, A. Tree-ring stable isotopes, growth disturbances and needles volatile organic compounds as environmental stress indicators at the debris covered miage glacier (Monte Bianco Massif, European Alps). Geogr. Fis. Din. Quat. 2015, 37, 101–111. [Google Scholar] [CrossRef]
  61. Eckstein, D.; Bauch, J. Beitrag zur Rationalisierung eines dendrochronologischen Verfahrens und zur Analyse seiner Aussagesicherheit. Forstwiss. Cent. 1969, 88, 230–250. [Google Scholar] [CrossRef]
  62. Niccoli, F.; Pelleri, F.; Manetti, M.C.; Sansone, D.; Battipaglia, G. Effects of thinning intensity on productivity and water use efficiency of Quercus robur L. For. Ecol. Manag. 2020, 473, 118282. [Google Scholar] [CrossRef]
  63. Bunn, A.G. A dendrochronology program library in R (dplR). Dendrochronologia 2008, 26, 115–124. [Google Scholar] [CrossRef]
  64. Holmes, R.L. Computer-Assisted Quality Control in Tree-Ring Dating and Measurement. Tree-Ring Bull. 1983, 43, 51–67. [Google Scholar]
  65. John, E. The Balance of Nature? Ecological Issues in the Conservation of Species and Communities by Stuart L. Pimm (University of Chicago Press, Chicago and London, 1992, ISBN 0 226 66830 4, 434 pp., SB £21.50/$26.95). Oryx 1993, 27, 125–126. [Google Scholar] [CrossRef]
  66. McCarroll, D.; Loader, N.J. Stable isotopes in tree rings. Quat. Sci. Rev. 2004, 23, 771–801. [Google Scholar] [CrossRef]
  67. Zang, C.; Biondi, F. Treeclim: An R package for the numerical calibration of proxy-climate relationships. Ecography 2015, 38, 431–436. [Google Scholar] [CrossRef]
  68. Kim, T.K. T test as a parametric statistic. Korean J. Anesthesiol. 2015, 68, 540–546. [Google Scholar] [CrossRef] [PubMed]
  69. Silva, L.C.; Anand, M.; Leithead, M.D. Recent widespread tree growth decline despite increasing atmospheric CO2. PLoS ONE 2010, 5, e11543. [Google Scholar] [CrossRef] [PubMed]
  70. Lévesque, M.; Siegwolf, R.; Saurer, M.; Eilmann, B.; Rigling, A. Increased water-use efficiency does not lead to enhanced tree growth under xeric and mesic conditions. New Phytol. 2014, 203, 94–109. [Google Scholar] [CrossRef]
  71. Pińskwar, I.; Choryński, A.; Kundzewicz, Z.W. Severe Drought in the Spring of 2020 in Poland—More of the Same? Agronomy 2020, 10, 1646. [Google Scholar] [CrossRef]
  72. Petrucco, L.; Nardini, A.; von Arx, G.; Saurer, M.; Cherubini, P. Isotope signals and anatomical features in tree rings suggest a role for hydraulic strategies in diffuse drought-induced die-back of Pinus nigra. Tree Physiol. 2017, 37, 523–535. [Google Scholar] [CrossRef] [PubMed]
  73. Das, A.J.; Battles, J.J.; Stephenson, N.L.; van Mantgem, P.J. The relationship between tree growth patterns and likelihood of mortality: A study of two tree species in the Sierra Nevada. Can. J. For. Res. 2007, 37, 580–597. [Google Scholar] [CrossRef]
  74. Cavin, L.; Mountford, E.P.; Peterken, G.F.; Jump, A.S. Extreme drought alters competitive dominance within and between tree species in a mixed forest stand. Funct. Ecol. 2013, 27, 1424–1435. [Google Scholar] [CrossRef]
  75. Johnstone, J.F.; Allen, C.D.; Franklin, J.F.; Frelich, L.E.; Harvey, B.J.; Higuera, P.E.; Mack, M.C.; Meentemeyer, R.K.; Metz, M.R.; Perry, G.L.W.; et al. Changing disturbance regimes, ecological memory, and forest resilience. Front. Ecol. Environ. 2016, 14, 369–378. [Google Scholar] [CrossRef]
  76. Mitchell, P.J.; O’Grady, A.P.; Pinkard, E.A.; Brodribb, T.J.; Arndt, S.K.; Blackman, C.J.; Duursma, R.A.; Fensham, R.J.; Hilbert, D.W.; Nitschke, C.R.; et al. An ecoclimatic framework for evaluating the resilience of vegetation to water deficit. Glob. Chang. Biol. 2016, 22, 1677–1689. [Google Scholar] [CrossRef]
  77. Trugman, A.T.; Detto, M.; Bartlett, M.K.; Medvigy, D.; Anderegg, W.R.L.; Schwalm, C.; Schaffer, B.; Pacala, S.W. Tree carbon allocation explains forest drought-kill and recovery patterns. Ecol. Lett. 2018, 21, 1552–1560. [Google Scholar] [CrossRef] [PubMed]
  78. Hagedorn, F.; Joseph, J.; Peter, M.; Luster, J.; Pritsch, K.; Geppert, U.; Kerner, R.; Molinier, V.; Egli, S.; Schaub, M.; et al. Recovery of trees from drought depends on belowground sink control. Nat. Plants 2016, 2, 16111. [Google Scholar] [CrossRef] [PubMed]
  79. Poyatos, R.; Aguadé, D.; Galiano, L.; Mencuccini, M.; Martínez-Vilalta, J. Drought-induced defoliation and long periods of near-zero gas exchange play a key role in accentuating metabolic decline of Scots pine. New Phytol. 2013, 200, 388–401. [Google Scholar] [CrossRef]
  80. Shestakova, T.; Voltas, J.; Saurer, M.; Berninger, F.; Esper, J.; Andreu-Hayles, L.; Daux, V.; Helle, G.; Leuenberger, M.; Loader, N.; et al. Spatio-temporal patterns of tree growth as related to carbon isotope fractionation in European forests under changing climate. Glob. Ecol. Biogeogr. 2019, 28, 1295–1309. [Google Scholar] [CrossRef]
  81. Hemming, D.L.; Switsur, V.R.; Waterhouse, J.S.; Heaton, T.H.E.; Carter, A.H.C. Climate variation and the stable carbon isotope composition of tree ring cellulose: An intercomparison of Quercus robur, Fagus sylvatica and Pinus silvestris. Tellus Ser. B Chem. Phys. Meteorol. 1998, 50, 25–33. [Google Scholar] [CrossRef]
  82. Gessler, A.; Ferrio, J.P.; Hommel, R.; Treydte, K.; Werner, R.A.; Monson, R.K. Stable isotopes in tree rings: Towards a mechanistic understanding of isotope fractionation and mixing processes from the leaves to the wood. Tree Physiol. 2014, 34, 796–818. [Google Scholar] [CrossRef]
  83. Farquhar, G.; O’Leary, M.H.O.; Berry, J. On the relationship between carbon isotope discrimination and the intercellular carbon dioxide concentration in leaves. Aust. J. Plant Physiol. 1982, 9, 121–137. [Google Scholar] [CrossRef]
  84. Nagavciuc, V.; Kern, Z.; Ionita, M.; Hartl, C.; Konter, O.; Esper, J.; Popa, I. Climate signals in carbon and oxygen isotope ratios of Pinus cembra tree-ring cellulose from the Călimani Mountains, Romania. Int. J. Climatol. 2020, 40, 2539–2556. [Google Scholar] [CrossRef]
  85. Olano, J.; Linares, J.; García-Cervigón, A.; Arzac, A.; Delgado Huertas, A.; Rozas, V. Drought-induced increase in water-use efficiency reduces secondary tree growth and tracheid wall thickness in a Mediterranean conifer. Oecologia 2014, 176, 273–283. [Google Scholar] [CrossRef]
  86. Waterhouse, J.S.; Switsur, V.R.; Barker, A.C.; Carter, A.H.; Hemming, D.L.; Loader, N.J.; Robertson, I. Northern European trees show a progressive diminishing response to increasing atmospheric carbon dioxide concentrations. Quat. Sci. Rev. 2004, 23, 803–810. [Google Scholar] [CrossRef]
  87. Saurer, M.; Spahni, R.; Frank, D.C.; Joos, F.; Leuenberger, M.; Loader, N.J.; McCarroll, D.; Gagen, M.; Poulter, B.; Siegwolf, R.T.; et al. Spatial variability and temporal trends in water-se efficiency of European forest. Glob. Chang. Biol. 2014, 20, 3700–3712. [Google Scholar] [CrossRef] [PubMed]
  88. Silva, L.; Horwath, W. Explaining Global Increases in Water Use Efficiency: Why Have We Overestimated Responses to Rising Atmospheric CO2 in Natural Forest Ecosystems? PLoS ONE 2013, 8, e53089. [Google Scholar] [CrossRef] [PubMed]
  89. Chen, Z.; Zhang, Y.; Li, Z.; Han, S.; Wang, X. Climate change increased the intrinsic water use efficiency of Larix gmelinii in permafrost degradation areas, but did not promote its growth. Agric. For. Meteorol. 2022, 320, 108957. [Google Scholar] [CrossRef]
  90. Sangüesa-Barreda, G.; Linares, J.C.; Julio Camarero, J. Drought and mistletoe reduce growth and water-use efficiency of Scots pine. For. Ecol. Manag. 2013, 296, 64–73. [Google Scholar] [CrossRef]
  91. Linares, J.C.; Camarero, J.J. From pattern to process: Linking intrinsic water-use efficiency to drought-induced forest decline. Glob. Chang. Biol. 2012, 18, 1000–1015. [Google Scholar] [CrossRef]
  92. Peñuelas, J.; Hunt, J.M.; Ogaya, R.; Jump, A.S. Twentieth century changes of tree-ring δ13C at the southern range-edge of Fagus sylvatica: Increasing water-use efficiency does not avoid the growth decline induced by warming at low altitudes. Glob. Chang. Biol. 2008, 14, 1076–1088. [Google Scholar] [CrossRef]
  93. Hentschel, R.; Rosner, S.; Kayler, Z.E.; Andreassen, K.; Børja, I.; Solberg, S.; Tveito, O.E.; Priesack, E.; Gessler, A. Norway spruce physiological and anatomical predisposition to dieback. For. Ecol. Manag. 2014, 322, 27–36. [Google Scholar] [CrossRef]
  94. Urrutia-Jalabert, R.; Malhi, Y.; Barichivich, J.; Lara, A.; Delgado Huertas, A.; Rodríguez, C.; Cuq, E. Increased water use efficiency but contrasting tree-growth patterns in Fitzroya cupressoides forests of southern Chile during recent decades. J. Geophys. Res. Biogeosci. 2015, 120, 2505–2524. [Google Scholar] [CrossRef]
Figure 1. (a) Location of the sampled trees in Opole and Poland and scale; (b) the average monthly sum of precipitation (blue bars) and average temperature (red line) at the meteorological station in Opole; the error bars show the standard deviation. Reference period 1975–2022.
Forests 15 00741 g001
Figure 2. (a) Annual Basal Area Increment (BAI) for healthy and declining groups of trees with fitted trend lines. (b) Standardized Precipitation–Evapotranspiration Index (SPEI) data for August. The asterisk symbol indicates years (1983, 1992, 1999, 2003, 2015, 2018), with particularly low August SPEI (<1.5).
Forests 15 00741 g002
Figure 3. (a) δ13C chronologies for healthy and declining trees, and (b) average values of average monthly temperatures during the growing season (April–October).
Forests 15 00741 g003
Figure 4. Correlation coefficients between δ13C and meteorological parameters (relative humidity, precipitation, SPEI, maximum temperature, average temperature) for (a) healthy trees and (b) declining trees. Months in lowercase refer to the previous year, while months in capital refer to the current year. The correlation’s average is represented by the point, and its 95% confidence interval, derived from 1000 bootstrap samples, is shown by the error bar [67]. Red bars indicate a statistically significant correlation (p < 0.05).
Forests 15 00741 g004
Figure 5. (a) iWUE chronologies for healthy and declining trees; (b) relationship between Basal Area Increments (BAI) and intrinsic water-use efficiency (iWUE) for healthy trees (c) and declining trees.
Forests 15 00741 g005
Table 1. Resistance, resilience, and recovery coefficients for healthy and declining trees in years with the lowest August SPEI (<1.5). Bold letters indicate values less than 1.
GroupResistance Index (Rt)Resilience Index (Rs)Recovery Index (Rc)Year with Lowest
August SPEI
Healthy1.18 (±0.11)1.16 (±0.11)0.98 (±0.08)1983
Declining0.94 (±0.06)1.00 (±0.13)1.06 (±0.10)
Healthy0.73 (±0.12)1.12 (±0.23)1.55 (±0.13)1992
Declining1.08 (±0.07)1.43 (±0.11)1.33 (±0.11)
Healthy1.11 (±0.18)1.11 (±0.15)0.99 (±0.03)1999
Declining0.93 (±0.19)0.76 (±0.32)0.81 (±0.16)
Healthy0.95 (±0.02)1.12 (±0.16)1.18 (±0.16)2003
Declining0.93 (±0.30)0.88 (±0.43)0.95 (±0.21)
Healthy0.88 (±0.17)0.80 (±0.37)0.91 (±0.24)2015
Declining0.83 (±0.10)0.86 (±0.20)1.04 (±0.12)
Healthy0.67 (±0.12)0.76 (±0.27)1.13 (±0.09)2018
Declining0.80 (±0.10)0.87 (±0.16)1.08 (±0.06)
Disclaimer/Publisher’s Note: The statements, opinions and data contained in all publications are solely those of the individual author(s) and contributor(s) and not of MDPI and/or the editor(s). MDPI and/or the editor(s) disclaim responsibility for any injury to people or property resulting from any ideas, methods, instructions or products referred to in the content.

