
Response of Soil Fungal-Community Structure to Crop-Tree Thinning in Pinus massoniana Plantation
by
 , and
, and
Qian Lyu
1,
Huiqin Yang
1,
Biran Yin
1,
Yongqi Xiang
1,2,
Kuangji Zhao
1,2,
Guirong Hou
1,2,
Gang Chen
1,2,
Chuan Fan
1,2 and
Xianwei Li
1,2,* 1
College of Forestry, Sichuan Agricultural University, Chengdu 611130, China
2
National Forestry and Grassland Administration Key Laboratory of Forest Resources Conservation and Ecological Safety on the Upper Reaches of the Yangtze River & Forestry Ecological Engineering in the Upper Reaches of the Yangtze River Key Laboratory of Sichuan Province, Chengdu 611130, China
*
Author to whom correspondence should be addressed.
Forests 2024, 15(5), 743; https://doi.org/10.3390/f15050743
Submission received: 26 March 2024
/
Revised: 19 April 2024
/
Accepted: 22 April 2024
/
Published: 24 April 2024
(This article belongs to the Special Issue Aboveground and Belowground Interaction and Forest Carbon Cycling—Volume II)
Abstract
:To address the ecological challenges arising from pure forest plantations and the wood supply–demand imbalance, implementing sustainable forest management is paramount. Accordingly, we studied crop trees at three densities (100, 150, and 200 N/ha) in a subtropical Pinus massoniana plantation. Our study revealed that the dominant phyla and genera within the fungal community remained largely consistent, with Basidiomycota and Ascomycota occupying prominent positions. Notably, the β diversity of the fungal community exhibited significant changes. Ectomycorrhizal and saprophytic fungi emerged as crucial functional guilds, and crop-tree thinning contributed to increased complexity within the fungal network, with a prevalence of positive rather than negative correlations among genera. The significant roles played by Camphor plants and ferns were evident in the fungal networks. Additionally, under crop-tree thinning, plant diversity experienced a significant boost, fostering interactions with the fungal community. Herb diversity played a vital role in the fungal community, affecting it either directly or indirectly, by altering the content of total phosphorus or organic matter in the soil. This study underscores the relationship between undergrowth plants and soil fungal communities, offering a scientific basis for evaluating the sustainability of restoring inefficient forest-plantation ecosystems.
1. Introduction
The rapid development of forest plantations has partly satisfied the timber needs of humans and the market. However, due to the lack of scientific theoretical guidance and practical sustainable management technology over an extended period, it has deviated from the inherent laws governing forest survival and development [1]. Consequently, a contradiction arises as the area of forest plantations continues to expand, while their quality significantly declines [2]. Thinning, as a common forest-management measure, proves effective in maintaining the ecological service function of protected forests [3] and enhancing the soil quality and ecosystem function of inefficient forests [4]. Crop-tree thinning, a specialized method, achieves this by increasing the proportion of high-quality trees (crop trees) while removing similar-sized trees (e.g., low-forked and undesirable forms) that have limited economic value and lack a competitive position [5]. Although many studies have explored the impact of crop-tree thinning on stand growth structure [6] and plant diversity [7] in forest plantations, they often overlook the interaction of the aboveground vegetation community and the underground microbial community. Understanding this relationship is crucial in comprehending the transformation of inefficient plantations and the consequent effects on ecosystem restoration through crop-tree thinning.
The soil microbial community plays a crucial role in supporting ecosystem services and human well-being [8]. It fosters ecosystem versatility by facilitating processes like litter decomposition and organic mineralization, which involve the transfer of matter and energy between aboveground and underground communities [9]. The soil microbial community is also important for soil mineralization [10], especially undisturbed soil. Fungi, as a primary component of soil microbiota, are instrumental in providing diverse ecological functions [11]. They establish mycorrhizal associations, actively contribute to soil formation and the development of plant communities, and regulate interactions between soil processes and plants [12]. Moreover, fungi enhance phosphorus acquisition, mitigating the limitations caused by acidification, and act as the primary agents in nutrient cycling [13]. Hence, gaining insights into how forest thinning influences the structure of fungal communities can offer valuable knowledge about the ecological impacts of these management practices and their effects on the overall health and functionality of forest ecosystems.
Within the ecological network, soil microorganisms engage in direct or indirect interactions, creating complex symbiotic networks and robust coexisting ecological clusters [14]. Highly connected taxa (unrelated hubs) in this network are expected to support a higher level of ecosystem functions compared to those with fewer connections [15]. Microbial-network analysis enables us to gain an the understanding of species interactions, identify key taxa, and assess their responses to environmental factors [16]. For instance, a study on the seasonal variation in soil fungal communities and symbiotic networks in a cold temperate zone revealed that the nine module nodes in the co-occurrence network were ascomycetes, and the key fungal groups exhibited niche differentiation between seasons [17]. Other research has indicated that drought promotes instability in soil bacterial rather than fungal symbiotic networks [18]. The characteristics of the ecological network of fungal communities have a profound impact on the response of the community to environmental changes. The existence and division of negative interactions among populations contribute to the stability of fungal networks under disturbance [19,20]. Therefore, performing network analyses of soil fungal communities after crop-tree thinning can unveil symbiotic or potential interactions within these communities and provide information on their responses to and recovery from environmental disturbances.
Forests with abundant vegetation can enhance both aboveground and underground litter productivity, leading to an increase in litter diversity. This, in turn, promotes the proliferation of available food resources for soil microorganisms, thus expanding their niche [21]. However, some studies have highlighted that, irrespective of the tree species, litter, roots, and nitrogen treatments, the ratio of soil carbon to nitrogen remains the most critical factor affecting soil microbial communities [22]. Thinning processes in forests create gaps that stimulate the growth of lower vegetation and rare fungal communities [23]. Furthermore, research indicates that plant interactions in mixed forests foster increased diversity in soil bacteria and fungi, leading to enhanced network stability as well as specialized key bacterial and fungal groups, and also improve the availability of soil nutrients [24]. However, existing studies primarily focus on population-based ecological indicators such as plant diversity or biomass. They have not fully explored the specific roles of individual plant species in shaping the soil microbial community or the interaction patterns between aboveground and underground communities.
Pinus massoniana plantations occupy an important position in China’s subtropical forests [25]. To address the decline in ecological function resulting from reduced soil fertility and diversity caused by artificial monoculture, and to meet the demand for large-diameter wood, this study employed crop-tree thinning in a P. massoniana plantation. The main purpose of this study is to explore whether and how crop-tree thinning affects soil fungal communities in plantations with different crop-tree densities. Our first hypothesis is that crop-tree thinning will increase the complexity of the network of fungal communities due to the enhancement in environmental heterogeneity. The second hypothesis is that the fungal groups will be subject to regulation by both the aboveground vegetation communities and soil conditions.
2. Materials and Methods
2.1. Study Site and Sampling Design
This study was carried out on Tianchi Forest Farm (30°20′29″ N, 106°47′30 E), located in Huaying City, Sichuan Province, China. This region has a subtropical humid monsoon climate, characterized by mild weather, abundant rainfall, uneven precipitation, and significant temperature variations. For many years, the average temperature has remained around 17.2 °C, and the annual precipitation is plentiful, with an average of 1087.84 mm. The maximum recorded precipitation is 1441.7 mm, while the minimum is 854.9 mm. The elevation of the study area ranges from 450 to 555 m a.s.l, with an average slope of 27–34°. Before crop-tree thinning, the stand density was approximately 1257 N/ha. The total area of the studied plantation is 0.8004 ha. The soil in the study area is classified as Nitisol, characterized by low fertility. The P. massoniana plantation comprises a single tree layer; the shrub layer is primarily composed of Mallotus barbatus (Wall.), Quercus serrata Thunb, and Cinnamomum camphora; and the herb layer is predominantly covered with ferns [7].
After carrying out a forest farm survey, we selected 12 permanent plots, each with an area of 667 m2 and in a 33-year-old P. massoniana plantation. These plots shared uniform site conditions, stand ages, and management history, making them ideal candidates for crop-tree thinning. Nine of these plots were used for the crop-tree thinning treatment, which was begun in January 2015. Six, nine, and twelve P. massoniana were selected as the crop trees in each plot, labeled WA, WB, and WC, respectively (Figure 1), and each treatment was repeated three times. Concurrently, we set up three control plots (WCK) devoid of crop-tree thinning to serve as reference points for comparison. We employed specific criteria to identify suitable crop trees, selecting trees that closely matched the average diameter at Breast height (DBH) of the stand, had straight trunks, exhibited vigorous growth, and were devoid of pests and diseases. The selected trees were located within the primary forest [5]. Any tree that impeded the growth of the crop trees was labeled an interference tree. Interference trees were identified as those whose crowns touched the surrounding dominant or sub-dominant trees at a certain distance, competing with the crop trees for sunlight and upward-growth space. Boundary trees were those on the boundary of the sample plot. After the interference trees were cut down, trees on the plot that were not considered crop trees or boundary trees were labeled general trees. To initiate the thinning process, we felled interfering trees on the three plots of different crop-tree densities. The resultant stand density after crop-tree thinning averaged around 1000 N/ha, but the crop-tree densities were different, at 100 N/ha, 150 N/ha, and 200 N/ha, respectively. An overview of the sample plot is shown in Table 1.
2.2. Soil Sampling and Survey of Vegetation
In November 2022, after removing the litter, we utilized a soil drill with a diameter of 5 cm to collect random soil samples from the topsoil layer (0–10 cm depth) around five crop trees within each plot, maintaining a distance of 1.5–2.5 m from the tree trunk [26]. The collected soil samples underwent artificial uniform mixing and the elimination of any impurities, such as stones and residual plant roots. Following this, the soil-composite samples were divided into two parts for further analysis. The first part was placed in a sterile centrifuge tube for soil fungal-community (ITS) sequencing, and the second was used to determine the chemical properties of the soil. The soil bulk density (SBD) was assessed using the cutting-ring method [27].
Five small 5 m × 5 m squares were systematically arranged within each plot to serve as shrub squares. These squares were placed in the four corners and at the center of each plot. Additionally, ten 1 m × 1 m squares were set up in each plot as herb squares. A total of 60 shrub squares and 120 herb squares were established, allowing for a comprehensive study of plant species. For each shrub and herb quadrat, meticulous records were kept, including the species name, plant number per cluster, height, coverage, and crown width of each plant. To ensure accuracy, authoritative references such as the National Plant Specimen Resource Center (http://www.cvh.ac.cn, (accessed on 10th December 2022)) and “Flora Reipublicae Popularis Sinicae” [23] were consulted for plant identification. Then, we conducted a statistical analysis on the diversity index and importance value of shrubs and herbs. Based on the data collected during the sample plot survey, we calculated the importance value (IV) of the plants observed in each plot. Subsequently, we used this information to determine plant diversity, based on the richness (R), Simpson (D), Shannon–Wiener (H), and Pielou (J) indices [28], providing valuable insights into the ecological significance of the plant species within the study area.
IV = (Relative density + Relative frequency + Relative coverage)/3
2.3. Analysis of Soil Physical and Chemical Properties
Total nitrogen (TN) was measured using the semi-micro Kjeldahl method [29]; total phosphorus (TP) was determined using H2SO4–HClO4 digestion and HCl–H2SO4 extraction and analyzed using the molybdenum blue method; and total potassium (TK) was determined using flame photometry. In order to determine NO3− and NH4+, 5 g of fresh soil was added to 25 mL of a 2 mol L−1 KCl solution. After shaking for 45 min, the extractant was filtered through a Whatman 42 filter [24]. Soil organic matter (SOM) was determined through potassium dichromate oxidation colorimetry. Water and soil were mixed in a ratio of 1:2.5 and left to stand for 1 h, after which we measured the soil pH with an electronic pH meter.
2.4. DNA Extraction, PCR Amplification, and ITS Sequencing
Total microbial genomic DNA was extracted from the soil samples using an E.Z.N.A.® soil DNA Kit (Omega Bio-tek, Norcross, GA, USA) according to manufacturer’s instructions. The quality and concentration of DNA were determined using 1.0% agarose gel electrophoresis and a NanoDrop® ND-2000 spectrophotometer (Thermo Scientific, Waltham, MA, USA), and the samples were kept at −80 °C until further use. ITSs (internal transcribed spacers) were amplified using ITS3F (5′-GCATCGATGAAGAACGCAGC) and ITS4R, (5′-TCCTCCGCTTATTGATATGC) via an ABI GeneAmp® 9700 PCR thermocycler (ABI, Waltham, MA, USA). The PCR amplification cycling conditions were as follows: initial denaturation at 95 °C for 3 min, followed by 27 cycles of denaturing at 95 °C for 30 s, annealing at 55 °C for 30 s, extension at 72 °C for 45 s, and a single extension at 72 °C for 10 min, ending at 4 °C.
The PCR product was extracted from 2% agarose gel, purified using the AxyPrep DNA Gel Extraction Kit (Axygen Biosciences, Union City, CA, USA) according to the manufacturer’s instructions, and quantified using a Quantus™ Fluorometer (Promega, Madison, WI, USA). The product was then paired-end sequenced on an Illumina MiSeq platform (Illumina, San Diego, CA, USA) according to the standard protocol of Majorbio Bio-Pharm Technology Co., Ltd. (Shanghai, China). The raw sequencing reads were deposited in the NCBI Sequence Read Archive (SRA) database (Accession number: PRJNA997115). The raw FASTQ files were de-multiplexed using an in-house Perl script, and then quality-filtered using fastq version 0.19.6 and merged using FLASH version 1.2.7 [30]. Then, the optimized sequences were clustered into operational taxonomic units (OTUs) with 97% sequence similarity using UPARSE 7.1 [31]. The most abundant sequence for each OTU was selected as a representative sequence. The taxonomy of each ITS sequence was analyzed using the Unite database (Release 8.0 http://unite.ut.ee/index.php, (accessed on 2 December 2022)). For the functional classification of fungi, we used the Fungi Functional Guild database [32].
2.5. Statistical Analyses
A one-way ANOVA was used to assess the differences in soil physicochemical properties, plant diversity, and the relative abundance of major fungal phyla and genera in different treatments. The similarity among the fungal communities in different samples was determined via principal coordinate analysis (PCoA) based on Bray–Curtis dissimilarity using the Vegan v2.5-3 package, and the significance was tested through an analysis of similarities (ANOSIM) in R (ver.4.3.1) [33]. We utilized Networkx (version 1.11) [27] to conduct a co-occurrence analysis of fungal communities, which was based on phylum-level distinctions in various treatments. The Benjamini–Hochberg method was employed to perform cut-off filtering of correlated data, with the threshold of the absolute correlation coefficient set at 0.5 and a significance level of p < 0.05 [34]. We conducted a single-factor correlation network analysis among the soil fungal communities using Spearman’s rank correlation for fungi in the top 50 most abundant genera, and Gephi v0.10.1 was used for visualization. Two-factor correlation network analysis was used to detect the Spearman correlations between fungal communities in the top 100 most abundant genera and the plants that appeared in each plot, and Cytoscape v3.10.0 was used for visualization. Topological properties encompass metrics such as the positive or negative correlation count, the number of edges and nodes, degree, closeness centrality, and betweenness centrality [35].
We developed an a priori model using existing knowledge concerning the interactions among plant-community composition, plant diversity, soil characteristics, and fungal-community composition [36]. According to the hypothetical causality, a structural equation model (SEM) in Amos 26.0 software was used to examine the direct and indirect effects of shrub-layer plant diversity, herb-layer plant composition, and soil factors on fungal-community composition. Using SPSS (27.0) to normalize the relative abundance of soil fungal-community composition (phylum level), the four diversity indices of the herb layer, and the community composition of the shrub layer (the importance value of each shrub), we conducted a principal component analysis (PCA). The first component PC1 of each explanatory group was used as an input for the SEM analysis. The suitability of the model was evaluated using various testing methods, such as chi-square, P-value evaluation, comparative goodness of fit (CFI), goodness of fit (GFI), and approximation root mean square error (RMSEM). Based on the results of the tests, less predictive measures, non-significant indicators, and non-significant paths were excluded, retaining the most informative variables. The final model that best fit the data was obtained by progressively removing unimportant components from the model.
3. Results
3.1. Response of Understory Plant Diversity and Soil Physicochemical Properties to Crop-Tree Thinning
Compared with WCK, the SBD in the WA and WB plots decreased significantly (Table S1), with the TP and NH4+ of the WB plot decreasing significantly. The SOM in the WA plot was significantly higher than that of WCK. Crop-tree thinning significantly increased NO3− compared with WCK, increasing in WA, WB, and WC by 19.68%, 4.47%, and 17.54%, respectively. Crop-tree thinning had no significant effect on TK, pH, and TN.
As the crop-tree density increased, R1, D1, and H1 all showed a significant increasing trend (Table 2). For J1, only WC was significantly different from the control. In terms of herbaceous layer diversity, each crop-tree-thinning treatment significantly increased R2, D2, and H2 compared with the control. In terms of J2, the herbaceous layer diversity in the WA plot was significantly lower than in the control plot, and other crop-tree-thinning treatments had no significant effect on J2. The species of the herb layer in WC were the most abundant in all treatments. Under crop-tree thinning, the dominant species in the shrub layer and herb layer changed noticeably, the composition of vegetation was more abundant, and we noted many plants that could adapt to different environments (Table S2).
3.2. Soil Fungal-Community Composition, Diversity, and Functional Groups
At the genus level, the soil fungal communities comprised Saitozyma and Russula (Figure 2a). Crop-tree thinning had no significant effect on the dominant genera, but resulted in significant differences for other rare fungi (such as Colletotrichum, Rhexodenticula, etc.) (Figure S1a). The fungal communities were dominated by Basidiomycota and Ascomycota (Figure 2b). Crop-tree thinning significantly increased the proportion of Basidiomycota but significantly decreased the proportion of Ascomycota, Mucoromycota, and Entorrhizomycota (Figure S1b). The first two axes together explain 65.40% of the total variance in the fungal community (Figure 3). The fungal communities differed significantly between the control and crop-tree-thinning groups (p = 0.002), and crop-tree thinning had no significant effect on the alpha diversity of the soil fungal community (Table S3). Ectomycorrhizal, an undefined saprotroph and fungal parasite, represented most of the observed fungal functional groups (more than 60%). The relative abundance of ectomycorrhizal in WB and WC was higher than that in the other treatment plots, and the relative abundance of undefined saprotroph was the highest in the WA-treatment plot (Figure 4).
3.3. Network of Soil Fungal Community
At the phylum level of the fungal community, the importance and tight connectivity of the whole network in the crop-tree-thinning plots in the whole network were significantly higher than the control (Table S4; Figure S2). The WA plot had the highest degree centrality, closeness centrality, and betweenness centrality, and the WB and WC plots occupied the same position in the network. The important nodes of the fungal community shown in the collinear network were consistent with the composition of the dominant bacteria. Even some rare fungi, such as Basidiobolomycota, Calcarisporiellomycota, and Kickxellomycota, demonstrated the same importance as the dominant fungi in this network.
We conducted a network analysis of the top 50 fungi in terms of total abundance at the genus level, of which 48 fungi had p values <0.05, and we observed more positive correlations (57.81%) than negative correlations (42.19%) (Figure 5). Sagenomella played a central role in the network (high degree), but it was not the dominant genus in the fungal community, and its relative abundance was low. However, Saitozyma and Russula, which ranked in the top two in terms of relative abundance, only had three-degree and one-degree connectivity, respectively, in the fungal-network structure (Table S5).
3.4. Relationship between Understory Vegetation, Soil Physicochemical Properties, and Fungal Communities
Understory vegetation regulated the composition of fungi. As a key fungal genus (degree = 7) in the network, Trichophaea was negatively correlated with B, BD, and BG, but positively correlated with AO, A, and M (Figure S3). U and BC (degree = 11) and AN and BB (degree = 10), which were found to be key plants and dominant species (Table S6) in the plant community, are related to multiple fungal genera and regulate multiple functional communities, such as ectomycorrhizal and endophytic mycorrhiza.
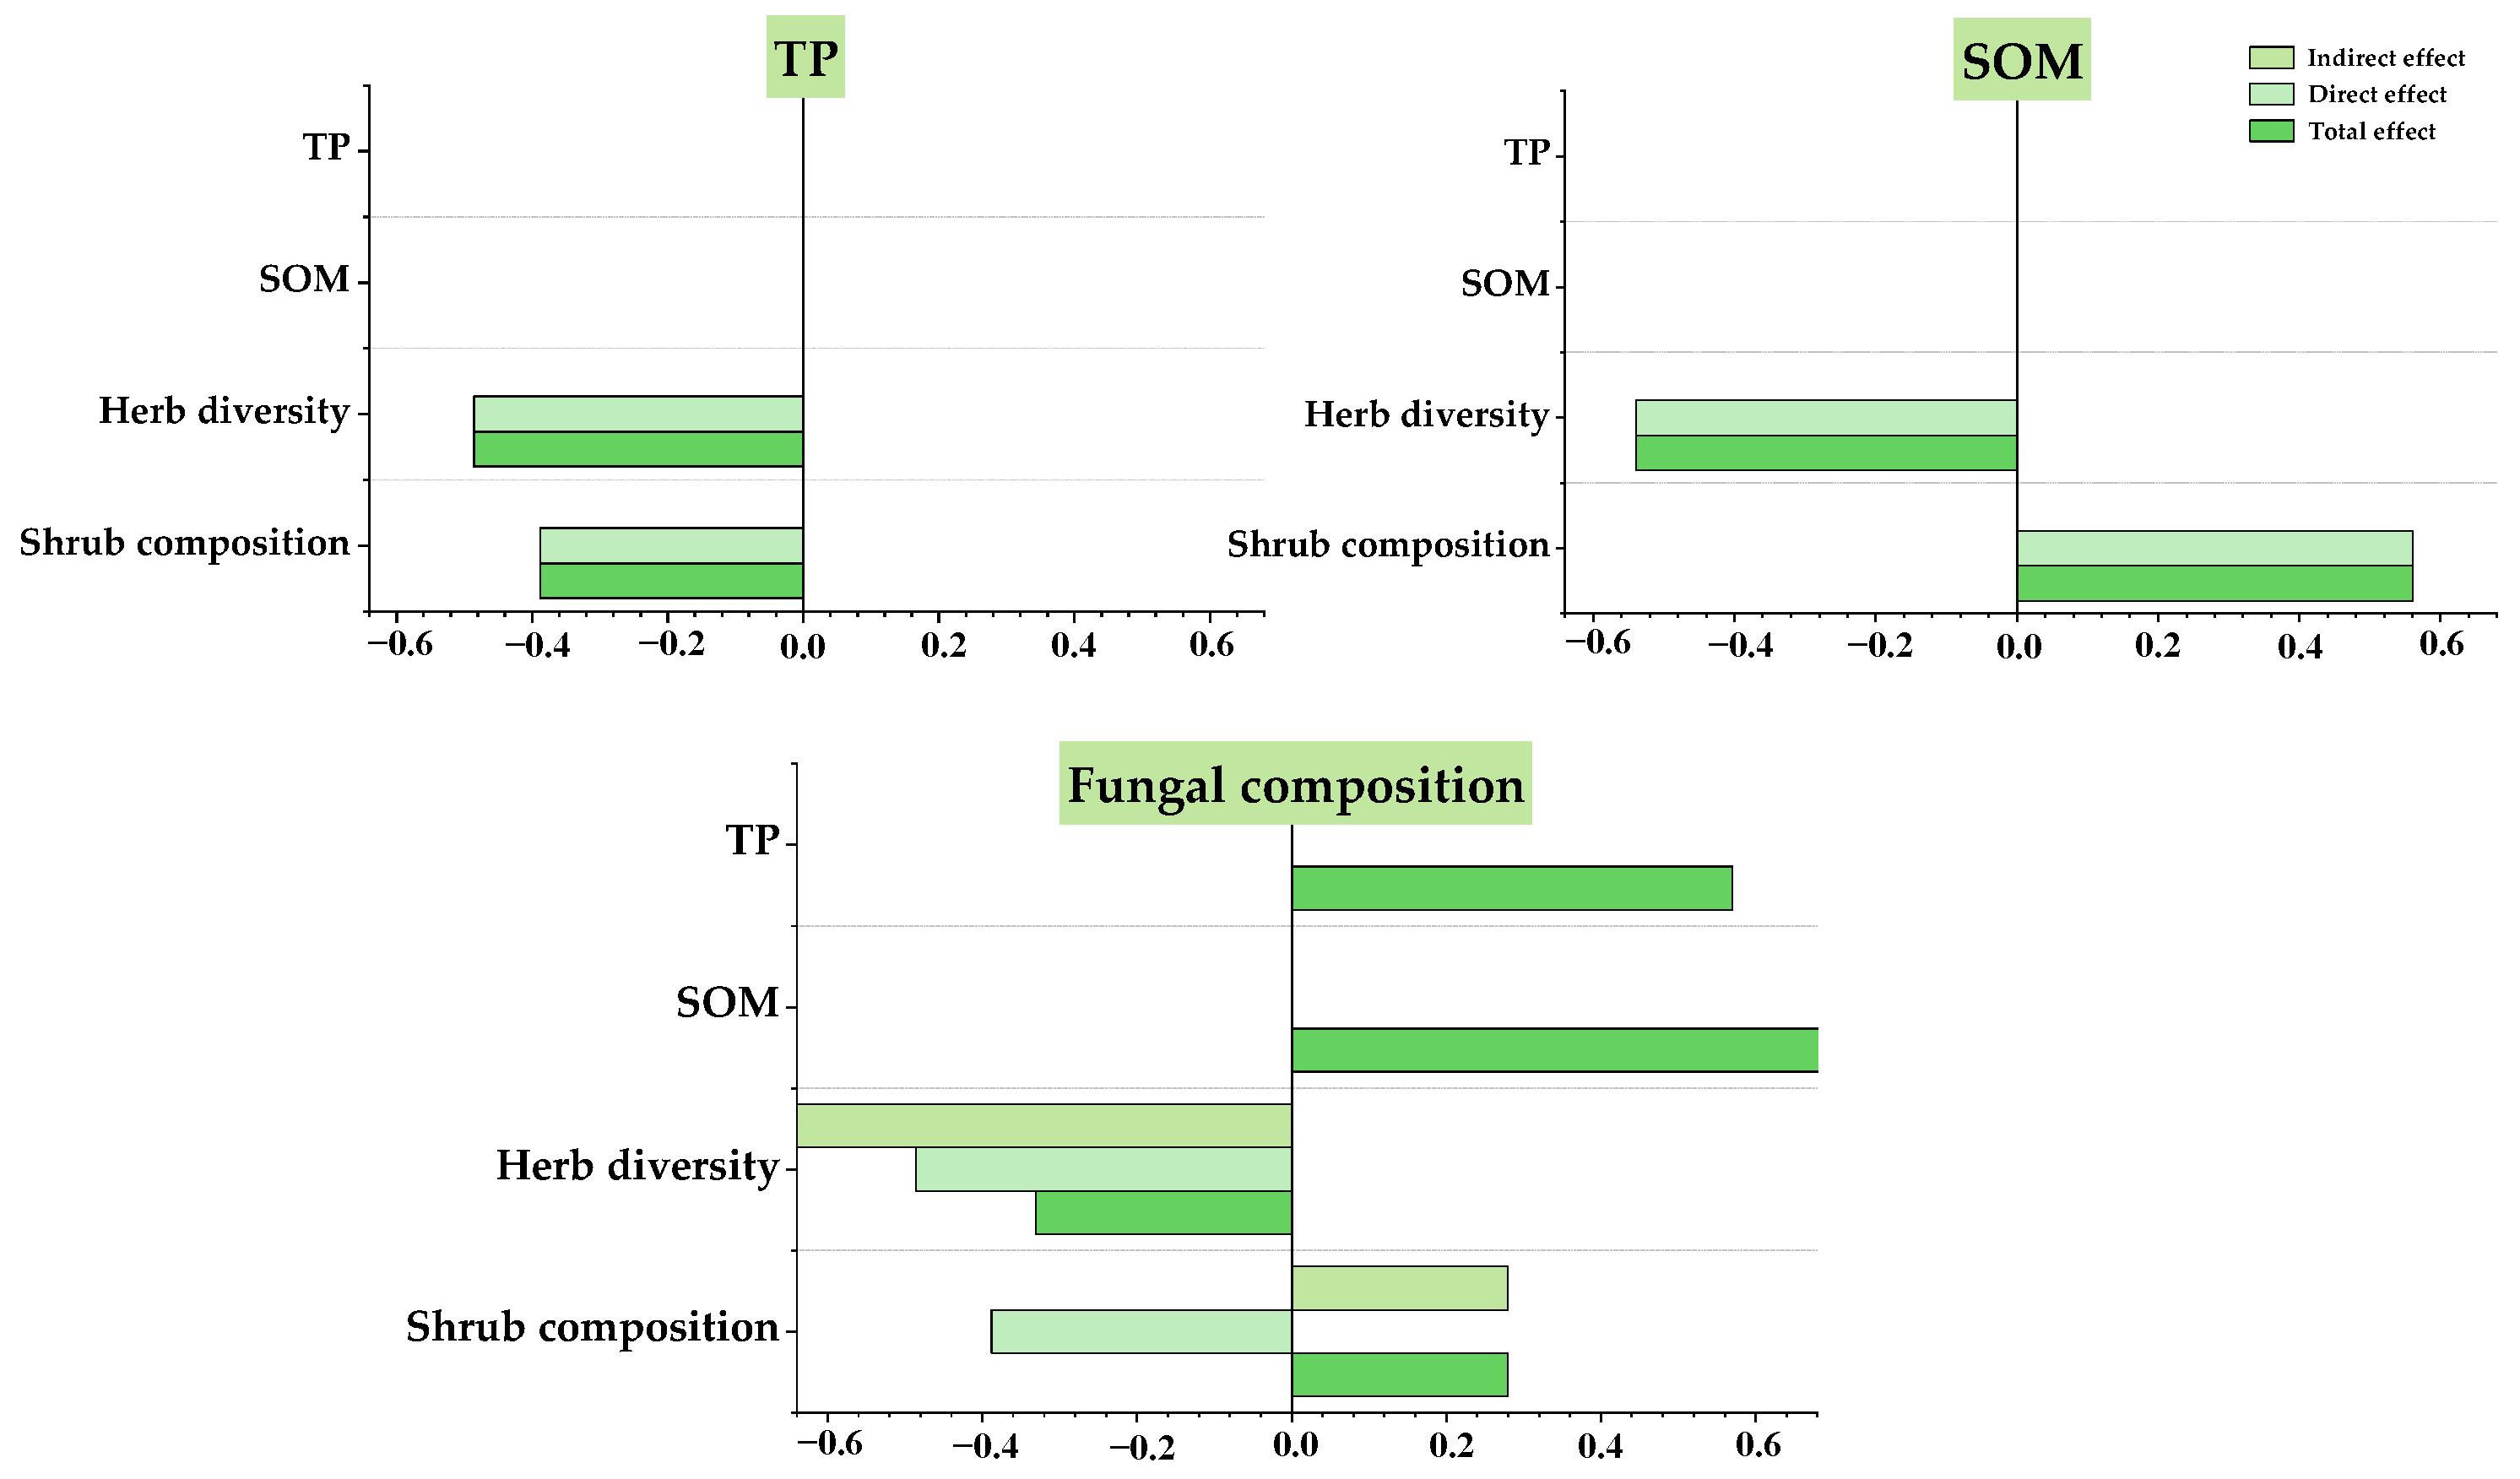
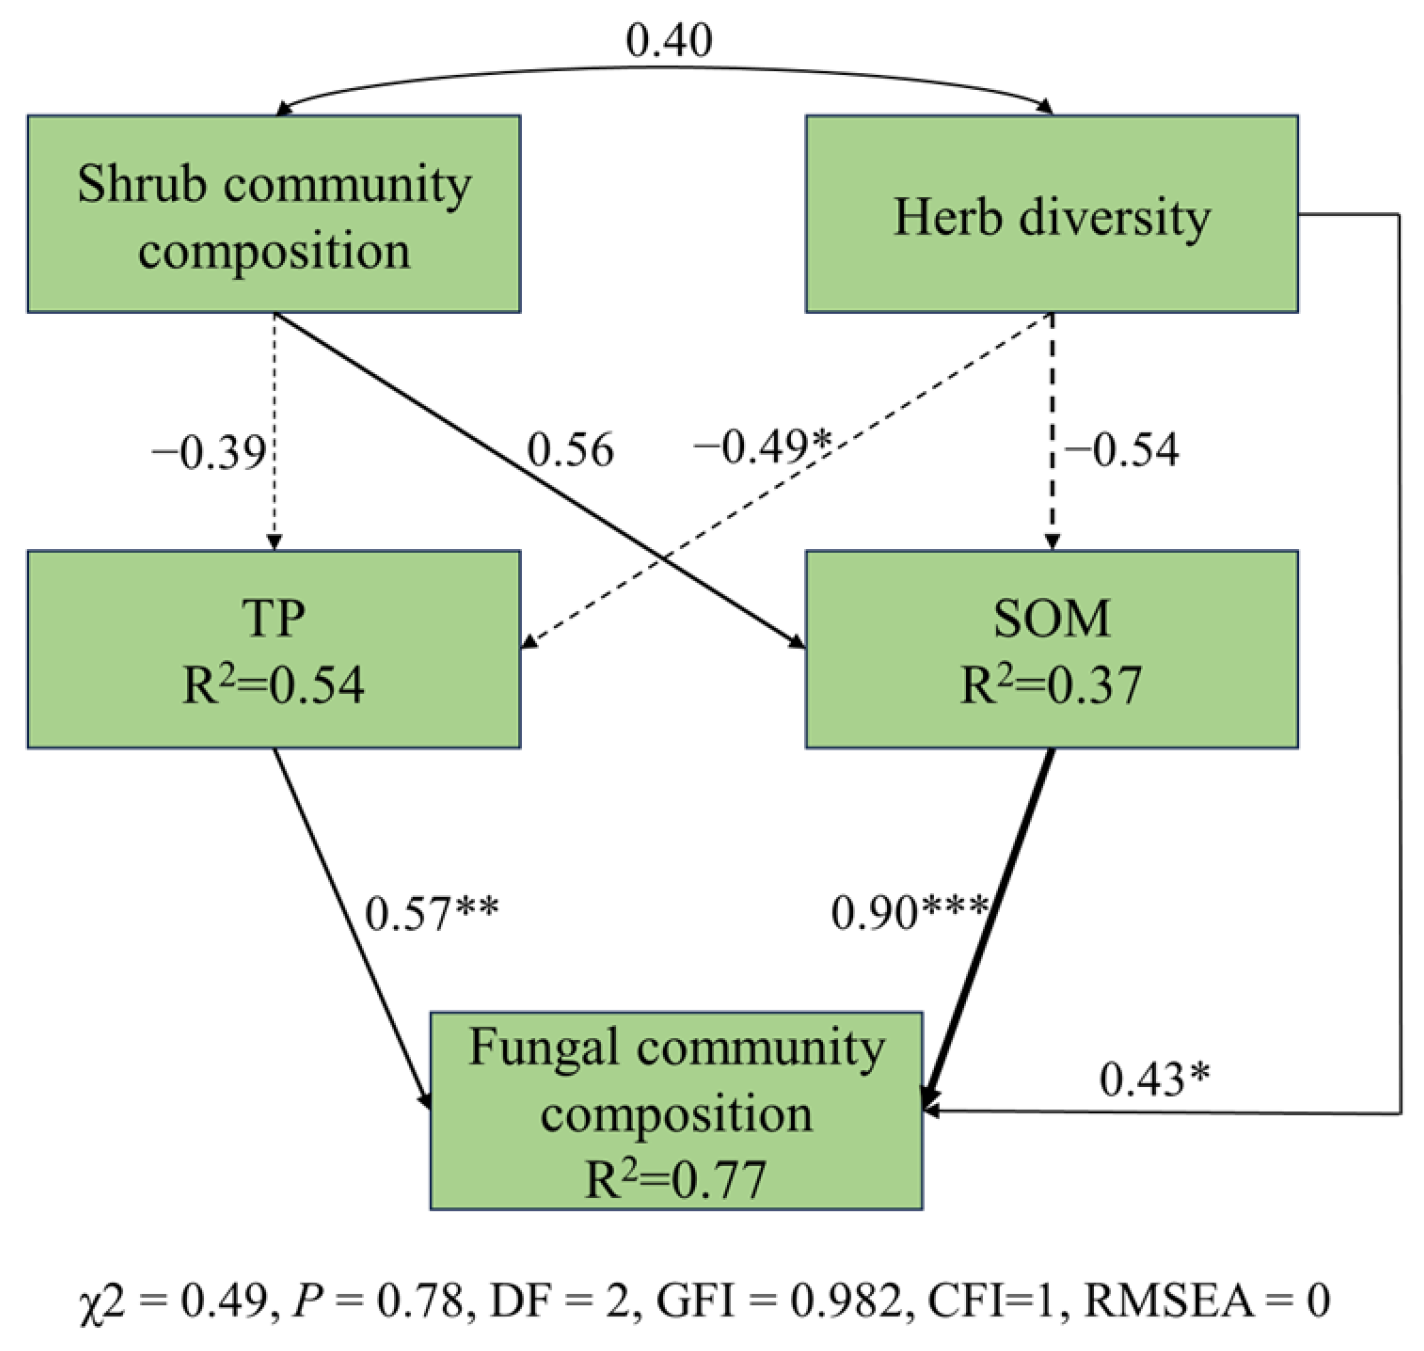
In total, 77% of the variation in soil fungal-community composition can be explained by plant and soil properties (Figure 6). The total effect of SOM was highest on the composition of the soil fungal community, and they had a positive correlation. Herb diversity had the highest direct and indirect effect on the composition of the soil fungal community (Figure 7). Herb diversity can not only directly affect the composition of the fungal community, but also indirectly affect it by significantly altering the TP content.
4. Discussion
4.1. Responses of Understory Plant Diversity to Crop-Tree Thinning
Understory vegetation harbors a vast array of plant diversity, making it a critical component of forest ecosystems with pivotal roles in functions and services like forest productivity and nutrient cycling [37]. In this study, after crop-tree thinning, the plant diversity in the forest understory was significantly improved. The primary factor influencing understory plant diversity is light availability [38]. In dense canopy areas, limited light resources and restricted space curtail the growth and reproduction of many plant species [39]. However, crop-tree thinning effectively increases photosynthetic active radiation within the forest, extends the duration of light exposure, and expands the plant-growth space. This, in turn, promotes seed growth and reproduction, and enhances plant regeneration within the forest. As a result, the environmental heterogeneity and resource allocation fostered by crop-tree thinning impact the vegetation-renewal strategy, leading to increased plant diversity and improved plant composition [40]. The act of felling trees directly interferes with the understory vegetation and creates soil disturbance, which provides important micro-sites for plant establishment, thus improving the diversity of the understory vegetation [41]. Crop-tree thinning significantly enhances the richness index of the herb layer, indicating an improvement in herbaceous plant diversity and the overall habitat of the plant community. The herb layer is more sensitive to environmental changes and can quickly reflect the impact of transformations [42]. In a P. massoniana plantation, ferns dominate the herb layer’s plant composition. The inner canopy of P. massoniana likely provides more favorable abiotic growth conditions for ferns, with higher soil accumulation in the branches and balanced climatic conditions [41]. Ferns are known for their strong photosynthetic capabilities, significantly influencing nutrient cycling and plant-community succession in the soil ecosystem [43].
4.2. Responses of Soil Fungal-Community Structure to Crop-Tree Thinning
The functional and taxonomic diversity of fungi is important for ensuring the growth and resilience of plantations [44]. The thinning management of different intensities will affect tree growth, and change soil nutrient availability, and thus affect the composition and structure of soil fungal communities [45]. In our study, Basidiomycetes and Ascomycetes emerged as the dominant fungi across all plots, and our results are consistent with most studies [46,47]. Notably, compared to the control, the WB treatment resulted in a significant decrease in the relative abundance of Basidiomycetes but a simultaneous increase in the relative abundance of Ascomycetes. This shift might be attributed to the preference of Ascomycetes for environments abundant in unstable carbon and featuring a fast net-carbon-mineralization rate, as they mainly constitute saprophytic fungi [48]. At the genus level, crop-tree thinning led to a reduction in the relative abundance of Russula but an increase in the relative abundance of Clavulina. Both belong to ectomycorrhizal (ECM) fungi; however, their responses to habitat heterogeneity were not consistent, potentially due to their distinct adaptation strategies [49]. In our study, crop-tree thinning significantly influenced the β diversity of the fungal community but had no significant effect on its α diversity. This suggests that the fungal-community composition demonstrated a certain degree of resilience to environmental changes. However, the notable differentiation in β diversity indicates that crop-tree thinning significantly impacted the habitat environment of fungi, resulting in variations in fungal species.
Under crop-tree thinning, the change in the stand environment brought about by the accelerated growth of trees is bound to have an impact on the fungal community. At the same time, vegetation with rich species diversity in the forest understory will produce more complex communication between the root system and the tree-root system [50]. Determining the changes in the fungal community under disturbance will help to clarify the underground ecological process of plantation transformation. After fire disturbance, it was found that the soil fungal communities along a time series were mainly saprophytic fungi and ectomycorrhizal fungi [51]. Additionally, after thinning interference, with an increase in organic-matter removal, saprophytic fungi increased and ectomycorrhizal decreased [52]. Generalists within the saprophytic and ECM communities possess widespread transmission abilities [53], granting them a dominant position within fungal functional communities. In the context of forest management, ectomycorrhizal fungi hold particular importance [54], and our study observed that WB and WC treatments increased their relative abundance; this is essential, because these fungi form reciprocal symbiotic relationships with P. massoniana, a key organism involved in plant nutrition and the carbon cycle [54]. Our findings also revealed that saprophytic fungi constituted the majority of fungal functional groups. The differences in nutrient composition between plant species and their litter make them specific substrates for various types of saprophytic fungi, thus promoting the colonization of saprophytic fungal communities and their participation in decomposition processes [55].
The correlation among fungal groups holds significant importance in predicting how fungal communities respond to environmental changes [17]. Fungal communities consist of intricate combinations of highly interactive taxa, and the complexity of their symbiotic networks determines their ability to withstand environmental impacts [56]. Topological characteristics, such as degree centrality, closeness centrality, and betweenness centrality, serve as key indicators of microbial-community correlations [57]. Our findings revealed that all crop-tree-thinning plots exhibited a higher degree of centrality, closeness centrality, and betweenness centrality compared to the control plot, which validates the first hypothesis of our study. Notably, the network center coefficient of the WA treatment was the highest, indicating an increased complexity of the fungal-community symbiotic network following crop-tree thinning. This could be attributed to the felling of interfering trees, expanding the niche breadth of the fungal community habitat, enhancing woodland space and light radiation within the forest, and enriching the nutrient content in the soil environment [7]. Ascomycetes played a predominant role in the network, and the correlation among genera belonging to ascomycetes was positive, consistent with the findings of Faust and Raes [58]. Furthermore, the positive correlation among fungal communities was stronger than the negative correlation, indicating greater cooperation among different fungal groups in the soil ecosystem.
4.3. Relationships between Plants, Soil Factors, and Fungal Community
The enriched resources in the forest following crop-tree thinning favor the selected population and foster numerous interactions among fungal nodes, indicating potential symbiotic patterns. The interaction between the fungal and plant modules supports the concept of a resource-driven symbiotic model [59]. The majority of fungi closely associated with both the herbaceous and shrub layers in relation to fungal communities were saprophytic fungi. One of the reasons for this is the quantity of logging debris left on site after crop-tree thinning, which also affects vegetation, as logging debris alters the soil moisture and nutrient availability, soil temperature, and physical conditions for seedbeds, accelerating the interaction between saprophytic fungi and plants [60]. In the correlation network, Microlepia hancei (degree = 11) held the most important position, with the majority of entities significantly correlated with saprophytic fungi. Soil planted with coniferous species tends to have a high cellulose and low lignin content, favoring the activity of the decomposer community and strengthening the presence of saprophytic fungi [61]. Pteridium aquilinum (degree = 10) emerged as the second key contributor to plant–fungal-community interaction in the herb layer. As a sun-loving plant, its importance value decreased after crop-tree thinning, likely due to the significant increase in species richness in the herb layer, allowing other plants to occupy more resource positions. The abundant growth space and hydrothermal resources following crop-tree thinning allowed for more lower species to coexist through niche separation [62], leading to a more complex plant-life-form structure [63]. In the shrub layer, C. camphora (degree = 10) and Litsea cubeba (degree = 11) emerged as the species with the strongest association with fungal communities. Both C. camphora and L. cubeba were found to be associated with both saprophytic fungi and ectomycorrhizal fungi. ECM and SAP guilds share the same habitat and interact with each other [64], they belong to the same family, Lauraceae, and are neutral-to-sunny plants. They prefer warm and humid climates, are native tree species in the area, dominating tropical and subtropical forests [65], and can form a good symbiotic relationship with Masson pine.
Some studies have highlighted that changes in vegetation in the forest understory can directly impact the soil microbial community by altering plant–microbial interactions, root exudate, and litter quantities, as well as indirectly influencing the soil microbial population through changes in soil physicochemical properties [66]. The structural equation model we constructed aligns with their findings. Plant diversity in the herb layer directly affects the composition of the soil fungal community and can also indirectly impact it by influencing the content of total phosphorus or soil organic matter, which supports our second hypothesis. The total effect of TP on the fungal community was found to be positive. This can be attributed to saprophytic fungi, which constitute a significant portion of the fungal community. Saprophytic fungi can store phosphorus in its mineral form within their mycelia and absorb phosphorus in its organic form [67]. Additionally, the rich plant species and abundance of vegetation in the forest understory accelerate the absorption of available phosphorus [68], preventing the forest from reaching a “balance of revenue and expenditure” of phosphorus. Moreover, mycorrhizal fungi that are abundant in the forest contribute to an increase in available soil phosphorus [69]. Soil fungi play crucial roles in biochemical processes, such as organic matter decomposition, humus formation, and soil nutrient cycling, all of which are closely related to SOM [70].
Our study further confirms that soil organic matter is a powerful factor influencing the composition of fungal communities. The presence of soil organic matter provides a stable water environment, promoting fungal root growth and mycelium expansion [71]. Additionally, the richness of soil organic matter supplies ample nutrition for fungi, facilitating their reproduction and growth. In conclusion, our study highlights the close relationship between vegetation communities, soil factors, and fungal community composition, wherein they mutually reinforce each other to enhance the plantation ecosystem.
5. Conclusions
Crop-tree thinning exerted a positive influence on the regeneration of plants in the forest understory, leading to increased plant diversity and significantly improving the β diversity of the soil fungal community. Notably, it had a considerable impact on key fungal groups. The WA treatment played a particularly significant role in the overall network system. Changes in diversity within the herb layer, mediated by crop-tree thinning, directly or indirectly affected the composition of the fungal community through alterations in the soil fungal network and soil characteristics. In conclusion, crop-tree thinning can improve the ecosystem service value of forest plantations and improve inefficient plantations by enriching plant diversity and enhancing soil fungal function.
Supplementary Materials
The following supporting information can be downloaded at https://www.mdpi.com/article/10.3390/f15050743/s1, Figure S1: The One-way ANOVA test examines fungal abundance at both the genera (a) and phyla (b) levels; Figure S2: Collinear networks at the phyla level of the soil fungal communities; Figure S3: Network of fungal composition and plant species; Table S1: Soil physical and chemical properties; Table S2: Importance value (%) of understory vegetation; Table S3: Alpha diversity of soil fungal community; Table S4: Network center coefficient of soil fungal community at the phyla level; Table S5: Network center coefficient of soil fungal community at the genera level; Table S6: Degree values of different species.
Author Contributions
Conceptualization: Q.L.; methodology, Q.L.; software, Y.X.; validation, X.L., G.C., K.Z., G.H. and C.F.; investigation: Q.L., H.Y., B.Y. and Y.X.; resources, X.L.; data curation, Q.L.; writing—original draft preparation, Q.L.; writing—review and editing, X.L., G.C., K.Z., G.H. and C.F.; visualization, G.C.; supervision, X.L.; project administration, X.L. All authors have read and agreed to the published version of the manuscript.
Funding
This research was supported by the Multi-functional Cultivation Technology of P. massoniana Artificial Forest project of the 14th Five-Year Plan National Key R&D Program (Grant No. 2023YFD2200901); the Natural Science Foundation of Sichuan Province (Grant No. 2022NSFSC1014); and the Forest Ecosystem Improvement in the Upper Reaches of Yangtze River Basin Program of World Bank (Grant No. 2019-510000-02-01-400761). Q.L. is grateful for the financial support from the China Scholarship Council (Grant No. 202206910054), and we express our gratitude to the online tool MajorBio Cloud Platform.
Data Availability Statement
The data is not displayed because of privacy.
Acknowledgments
This study was supported by the abovementioned project. We also thank all the professors who provided helpful guidance for this research.
Conflicts of Interest
The authors declare no conflicts of interest.
References
- Ding, X.; Liu, G.; Fu, S.; Chen, H.Y.H. Tree Species Composition and Nutrient Availability Affect Soil Microbial Diversity and Composition across Forest Types in Subtropical China. Catena 2021, 201, 105224. [Google Scholar] [CrossRef]
- Zhou, L.; Cai, L.; He, Z.; Wang, R.; Wu, P.; Ma, X. Thinning Increases Understory Diversity and Biomass, and Improves Soil Properties without Decreasing Growth of Chinese Fir in Southern China. Environ. Sci. Pollut. Res. 2016, 23, 24135–24150. [Google Scholar] [CrossRef] [PubMed]
- Zhang, Z.; Hao, M.; Yu, Q.; Dun, X.; Xu, J.; Gao, P. The Effect of Thinning Intensity on the Soil Carbon Pool Mediated by Soil Microbial Communities and Necromass Carbon in Coastal Zone Protected Forests. Sci. Total Environ. 2023, 881, 163492. [Google Scholar] [CrossRef] [PubMed]
- Li, Y.; Dong, Z.; Chen, D.; Zhao, S.; Zhou, F.; Cao, X.; Fang, K. Growth Decline of Pinus Massoniana in Response to Warming Induced Drought and Increasing Intrinsic Water Use Efficiency in Humid Subtropical China. Dendrochronologia 2019, 57, 125609. [Google Scholar] [CrossRef]
- Ward, J.S. Twenty-Five Year Response of Non-Crop Trees to Partial Release during Precommercial Crop Tree Management. For. Ecol. Manag. 2017, 387, 12–18. [Google Scholar] [CrossRef]
- Idol, T.W.; Morales, R.M.; Friday, J.B.; Scowcroft, P.G. Precommercial Release Thinning of Potential Acacia Koa Crop Trees Increases Stem and Crown Growth in Dense, 8-Year-Old Stands in Hawaii. For. Ecol. Manag. 2017, 392, 105–114. [Google Scholar] [CrossRef]
- Lyu, Q.; Shen, Y.; Li, X.; Chen, G.; Li, D.; Fan, C. Early Effects of Crop Tree Management on Undergrowth Plant Diversity and Soil Physicochemical Properties in a Pinus Massoniana Plantation. PeerJ 2021, 9, e11852. [Google Scholar] [CrossRef] [PubMed]
- Delgado-Baquerizo, M.; Maestre, F.T.; Reich, P.B.; Jeffries, T.C.; Gaitan, J.J.; Encinar, D.; Berdugo, M.; Campbell, C.D.; Singh, B.K. Microbial Diversity Drives Multifunctionality in Terrestrial Ecosystems. Nat. Commun. 2016, 7, 10541. [Google Scholar] [CrossRef] [PubMed]
- Hooper, D.U.; Bignell, D.E.; Brown, V.K.; Brussaard, L.; Dangerfield, J.M.; Wall, D.H.; Wardle, D.A.; Coleman, D.C.; Giller, K.E.; Lavelle, P.; et al. Interactions between Aboveground and Belowground Biodiversity in Terrestrial Ecosystems: Patterns, Mechanisms, and Feedbacks: We Assess the Evidence for Correlation between Aboveground and Belowground Diversity and Conclude That a Variety of Mechanisms Co. Bioscience 2000, 50, 1049–1061. [Google Scholar] [CrossRef]
- Zheng, J.; Mao, X.; Jan van Groenigen, K.; Zhang, S.; Wang, M.; Guo, X.; Yu, W.; Luo, L.; Chang, J.; Shi, Z.; et al. Decoupling of Soil Carbon Mineralization and Microbial Community Composition across a Climate Gradient on the Tibetan Plateau. Geoderma 2024, 441, 116736. [Google Scholar] [CrossRef]
- Mukhtar, S.; Mirza, B.S.; Mehnaz, S.; Mirza, M.S.; Mclean, J.; Malik, K.A. Impact of Soil Salinity on the Microbial Structure of Halophyte Rhizosphere Microbiome. World J. Microbiol. Biotechnol. 2018, 34, 136. [Google Scholar] [CrossRef] [PubMed]
- Gil-Martínez, M.; López-García, Á.; Domínguez, M.T.; Kjøller, R.; Navarro-Fernández, C.M.; Rosendahl, S.; Marañón, T. Soil Fungal Diversity and Functionality Are Driven by Plant Species Used in Phytoremediation. Soil Biol. Biochem. 2021, 153, 108102. [Google Scholar] [CrossRef]
- Hu, Y.; Chen, J.; Hui, D.; Wang, Y.P.; Li, J.; Chen, J.; Chen, G.; Zhu, Y.; Zhang, L.; Zhang, D.; et al. Mycorrhizal Fungi Alleviate Acidification-Induced Phosphorus Limitation: Evidence from a Decade-Long Field Experiment of Simulated Acid Deposition in a Tropical Forest in South China. Glob. Chang. Biol. 2022, 28, 3605–3619. [Google Scholar] [CrossRef]
- Toju, H.; Peay, K.G.; Yamamichi, M.; Narisawa, K.; Hiruma, K.; Naito, K.; Fukuda, S.; Ushio, M.; Nakaoka, S.; Onoda, Y.; et al. Core Microbiomes for Sustainable Agroecosystems. Nat. Plants 2018, 4, 247–257. [Google Scholar] [CrossRef]
- Shi, Y.; Delgado-Baquerizo, M.; Li, Y.; Yang, Y.; Zhu, Y.G.; Peñuelas, J.; Chu, H. Abundance of Kinless Hubs within Soil Microbial Networks Are Associated with High Functional Potential in Agricultural Ecosystems. Environ. Int. 2020, 142, 105869. [Google Scholar] [CrossRef] [PubMed]
- Fuhrman, J.A. Microbial Community Structure and Its Functional Implications. Nature 2009, 459, 193–199. [Google Scholar] [CrossRef] [PubMed]
- Ji, L.; Shen, F.; Liu, Y.; Yang, Y.; Wang, J.; Purahong, W.; Yang, L. Contrasting Altitudinal Patterns and Co-Occurrence Networks of Soil Bacterial and Fungal Communities along Soil Depths in the Cold-Temperate Montane Forests of China. Catena 2022, 209, 105844. [Google Scholar] [CrossRef]
- De Vries, F.T.; Griffiths, R.I.; Bailey, M.; Craig, H.; Girlanda, M.; Gweon, H.S.; Hallin, S.; Kaisermann, A.; Keith, A.M.; Kretzschmar, M.; et al. Soil Bacterial Networks Are Less Stable under Drought than Fungal Networks. Nat. Commun. 2018, 9, 3033. [Google Scholar] [CrossRef] [PubMed]
- Coyte, K.Z.; Schluter, J.; Foster, K.R. The Ecology of the Microbiome: Networks, Competition, and Stability. Science (80-) 2015, 350, 663–666. [Google Scholar] [CrossRef]
- Neutel, A.M.; Heesterbeek, J.A.P.; De Ruiter, P.C. Stability in Real Food Webs: Weak Links in Long Loops. Science (80-) 2002, 296, 1120–1123. [Google Scholar] [CrossRef]
- Xiao, W.; Chen, C.; Chen, X.; Huang, Z.; Chen, H.Y.H. Functional and Phylogenetic Diversity Promote Litter Decomposition across Terrestrial Ecosystems. Glob. Ecol. Biogeogr. 2020, 29, 2261–2272. [Google Scholar] [CrossRef]
- Wan, X.; Huang, Z.; He, Z.; Yu, Z.; Wang, M.; Davis, M.R.; Yang, Y. Soil C:N Ratio Is the Major Determinant of Soil Microbial Community Structure in Subtropical Coniferous and Broadleaf Forest Plantations. Plant Soil 2015, 387, 103–116. [Google Scholar] [CrossRef]
- Qiang, W.; Gunina, A.; Kuzyakov, Y.; Luo, R.; Zhang, Y.; Liu, B.; Pang, X. Shifts of Understory Vegetation Induced by Thinning Drive the Expansion of Soil Rare Fungi. J. Environ. Manag. 2023, 342, 118119. [Google Scholar] [CrossRef] [PubMed]
- Li, W.; Liu, Q.; Xie, L.; Yin, C. Interspecific Plant-Plant Interactions Increase the Soil Microbial Network Stability, Shift Keystone Microbial Taxa, and Enhance Their Functions in Mixed Stands. For. Ecol. Manag. 2023, 533, 120851. [Google Scholar] [CrossRef]
- Huang, L.; Pan, X.; Ma, J.; Jian, R.; Zhang, H.; Bai, K.; Mo, Y.; Zhang, Q.; Yang, Z. Assembly of Understory Woody Communities during the Close-to-Nature Restoration of a Pinus Massoniana Lamb. Plantation in the Southern Subtropical Region of China: From Environmental Filtering to Competitive Exclusion. For. Ecol. Manage. 2023, 541, 121060. [Google Scholar] [CrossRef]
- Yin, H.; Su, Y.; Liu, S.; Li, X.; Li, X.; Fan, C.; Guan, P.; Xie, Z.; Wang, S.; Scheu, S.; et al. Consistent Response of Nematode Communities to Management of Coniferous Plantations. For. Ecosyst. 2022, 9, 100045. [Google Scholar] [CrossRef]
- Ren, C.; Chen, J.; Deng, J.; Zhao, F.; Han, X.; Yang, G.; Tong, X.; Feng, Y.; Shelton, S.; Ren, G. Response of Microbial Diversity to C:N:P Stoichiometry in Fine Root and Microbial Biomass Following Afforestation. Biol. Fertil. Soils 2017, 53, 457–468. [Google Scholar] [CrossRef]
- Wang, J.; Zhao, W.; Zhang, X.; Liu, Y.; Wang, S.; Liu, Y. Effects of Reforestation on Plant Species Diversity on the Loess Plateau of China: A Case Study in Danangou Catchment. Sci. Total Environ. 2019, 651, 979–989. [Google Scholar] [CrossRef] [PubMed]
- Pruden, G.; Kalembasa, S.J.; Jenkinson, D.S. Reduction of Nitrate Prior to Kjeldahl Digestion. J. Sci. Food Agric. 1985, 36, 71–73. [Google Scholar] [CrossRef]
- Magoč, T.; Salzberg, S.L. FLASH: Fast Length Adjustment of Short Reads to Improve Genome Assemblies. Bioinformatics 2011, 27, 2957–2963. [Google Scholar] [CrossRef]
- Edgar, R.C.; Haas, B.J.; Clemente, J.C.; Quince, C.; Knight, R. UCHIME Improves Sensitivity and Speed of Chimera Detection. Bioinformatics 2011, 27, 2194–2200. [Google Scholar] [CrossRef] [PubMed]
- Nguyen, N.H.; Song, Z.; Bates, S.T.; Branco, S.; Tedersoo, L.; Menke, J.; Schilling, J.S.; Kennedy, P.G. FUNGuild: An Open Annotation Tool for Parsing Fungal Community Datasets by Ecological Guild. Fungal Ecol. 2016, 20, 241–248. [Google Scholar] [CrossRef]
- Fernández-Guisuraga, J.M.; Ansola, G.; Pinto, R.; Marcos, E.; Calvo, L.; Sáenz de Miera, L.E. Resistance of Soil Bacterial Communities from Montane Heathland Ecosystems in the Cantabrian Mountains (NW Spain) to a Gradient of Experimental Nitrogen Deposition. Sci. Total Environ. 2024, 920, 171079. [Google Scholar] [CrossRef] [PubMed]
- Benjamini, Y.; Hochberg, Y. Controlling the False Discovery Rate: A Practical and Powerful Approach to Multiple Testing. J. R. Stat. Soc. Ser. B 1995, 57, 289–300. [Google Scholar] [CrossRef]
- Gui, H.; Breed, M.; Li, Y.; Xu, Q.; Yang, J.; Wanasinghe, D.N.; Li, Y.; Xu, J.; Mortimer, P. Continental-Scale Insights into the Soil Microbial Co-Occurrence Networks of Australia and Their Environmental Drivers. Soil Biol. Biochem. 2023, 186, 109177. [Google Scholar] [CrossRef]
- Jin, X.; Liu, Y.; Hu, W.; Wang, G.; Kong, Z.; Wu, L.; Ge, G. Soil Bacterial and Fungal Communities and the Associated Nutrient Cycling Responses to Forest Conversion after Selective Logging in a Subtropical Forest of China. For. Ecol. Manag. 2019, 444, 308–317. [Google Scholar] [CrossRef]
- Landuyt, D.; De Lombaerde, E.; Perring, M.P.; Hertzog, L.R.; Ampoorter, E.; Maes, S.L.; De Frenne, P.; Ma, S.; Proesmans, W.; Blondeel, H.; et al. The Functional Role of Temperate Forest Understorey Vegetation in a Changing World. Glob. Chang. Biol. 2019, 25, 3625–3641. [Google Scholar] [CrossRef] [PubMed]
- Marialigeti, S.; Tinya, F.; Bidlo, A.; Odor, P. Environmental Drivers of the Composition and Diversity of the Herb Layer in Mixed Temperate Forests in Hungary. Plant Ecol. 2016, 217, 549–563. [Google Scholar] [CrossRef]
- Chen, Y.L.; Xu, T.L.; Veresoglou, S.D.; Hu, H.W.; Hao, Z.P.; Hu, Y.J.; Liu, L.; Deng, Y.; Rillig, M.C.; Chen, B.D. Plant Diversity Represents the Prevalent Determinant of Soil Fungal Community Structure across Temperate Grasslands in Northern China. Soil Biol. Biochem. 2017, 110, 12–21. [Google Scholar] [CrossRef]
- Cho, S.; Myeong, H.-H.; Choung, Y. Promotion of Plant Species Diversity of Artificial Plantations in Korean National Parks through Thinning. J. Asia Pac. Biodivers. 2020, 13, 631–636. [Google Scholar] [CrossRef]
- Von Oheimb, G.; Härdtle, W. Selection Harvest in Temperate Deciduous Forests: Impact on Herb Layer Richness and Composition. Biodivers. Conserv. 2009, 18, 271–287. [Google Scholar] [CrossRef]
- Gallet, S.; Roze, F. Resistance of Atlantic Heathlands to Trampling in Brittany (France): Influence of Vegetation Type, Season and Weather Conditions. Biol. Conserv. 2001, 97, 189–198. [Google Scholar] [CrossRef]
- Li, X.; Lu, Y.; Huang, A.; Yuan, R.; Li, J.; Hu, D.; Zhong, Q.; Cheng, D. Light Response Model Fitting and Photosynthetic Characteristics of Ten Different Fern Species in Subtropics. ACTA Ecol. Sin. 2022, 42, 3333–3344. [Google Scholar] [CrossRef]
- Qu, Z.L.; Santalahti, M.; Köster, K.; Berninger, F.; Pumpanen, J.; Heinonsalo, J.; Sun, H. Soil Fungal Community Structure in Boreal Pine Forests: From Southern to Subarctic Areas of Finland. Front. Microbiol. 2021, 12, 653896. [Google Scholar] [CrossRef] [PubMed]
- Caihong, Z.; Nier, S.; Hao, W.; Honglin, X.; Hailong, S.; Ling, Y. Effects of Thinning on Soil Nutrient Availability and Fungal Community Composition in a Plantation Medium-Aged Pure Forest of Picea Koraiensis. Sci. Rep. 2023, 13, 2492. [Google Scholar] [CrossRef] [PubMed]
- Sui, X.; Zeng, X.; Li, M.; Weng, X.; Frey, B.; Yang, L.; Li, M. Influence of Different Vegetation Types on Soil Physicochemical Parameters and Fungal Communities. Microorganisms 2022, 10, 829. [Google Scholar] [CrossRef] [PubMed]
- Arunrat, N.; Sansupa, C.; Sereenonchai, S.; Hatano, R. Short-Term Response of Soil Bacterial and Fungal Communities to Fire in Rotational Shifting Cultivation, Northern Thailand. Appl. Soil Ecol. 2024, 196, 105303. [Google Scholar] [CrossRef]
- Yao, F.; Yang, S.; Wang, Z.; Wang, X.; Ye, J.; Wang, X.; DeBruyn, J.M.; Feng, X.; Jiang, Y.; Li, H. Microbial Taxa Distribution Is Associated with Ecological Trophic Cascades along an Elevation Gradient. Front. Microbiol. 2017, 8, 2071. [Google Scholar] [CrossRef] [PubMed]
- Högberg, M.N.; Bååth, E.; Nordgren, A.; Arnebrant, K.; Högberg, P. Contrasting Effects of Nitrogen Availability on Plant Carbon Supply to Mycorrhizal Fungi and Saprotrophs—A Hypothesis Based on Field Observations in Boreal Forest. New Phytol. 2003, 160, 225–238. [Google Scholar] [CrossRef] [PubMed]
- Prashar, P.; Kapoor, N.; Sachdeva, S. Rhizosphere: Its Structure, Bacterial Diversity and Significance. Rev. Environ. Sci. Biotechnol. 2014, 13, 63–77. [Google Scholar] [CrossRef]
- Orumaa, A.; Agan, A.; Anslan, S.; Drenkhan, T.; Drenkhan, R.; Kauer, K.; Köster, K.; Tedersoo, L.; Metslaid, M. Long-Term Effects of Forest Fires on Fungal Community and Soil Properties along a Hemiboreal Scots Pine Forest Fire Chronosequence. Sci. Total Environ. 2022, 851, 158173. [Google Scholar] [CrossRef] [PubMed]
- Mushinski, R.M.; Gentry, T.J.; Boutton, T.W. Organic Matter Removal Associated with Forest Harvest Leads to Decade Scale Alterations in Soil Fungal Communities and Functional Guilds. Soil Biol. Biochem. 2018, 127, 127–136. [Google Scholar] [CrossRef]
- Shigyo, N.; Hirao, T. Saprotrophic and Ectomycorrhizal Fungi Exhibit Contrasting Richness Patterns along Elevational Gradients in Cool-Temperate Montane Forests. Fungal Ecol. 2021, 50, 101036. [Google Scholar] [CrossRef]
- Khalid, M.; ur Rahman, S.; Liu, X.; Rehman, A.; Jumpponen, A.; Johan Kotze, D.; Setälä, H.; Hui, N. Exploring the Impact of Urbanization and Vegetation Type on Fungal Communities: Insights into Divergent, Mycorrhizal, and Saprophytic Associations Driven by Climate Patterns. Catena 2024, 238, 107860. [Google Scholar] [CrossRef]
- Li, D.H.; Han, Z.L.; Wu, Q.G.; Luo, G.R.; Liang, M.X.; Chen, J. Review of Functional Characteristics of Saprophytic Fungi Affecting the Decomposition of Fine Roots in Forest Ecosystem. World For. Res. 2021, 34, 26–31. [Google Scholar]
- Banerjee, S.; Walder, F.; Büchi, L.; Meyer, M.; Held, A.Y.; Gattinger, A.; Keller, T.; Charles, R.; van der Heijden, M.G.A. Agricultural Intensification Reduces Microbial Network Complexity and the Abundance of Keystone Taxa in Roots. ISME J. 2019, 13, 1722–1736. [Google Scholar] [CrossRef]
- Ma, B.; Wang, H.; Dsouza, M.; Lou, J.; He, Y.; Dai, Z.; Brookes, P.C.; Xu, J.; Gilbert, J.A. Geographic Patterns of Co-Occurrence Network Topological Features for Soil Microbiota at Continental Scale in Eastern China. ISME J. 2016, 10, 1891–1901. [Google Scholar] [CrossRef] [PubMed]
- Faust, K.; Raes, J. Microbial Interactions: From Networks to Models. Nat. Rev. Microbiol. 2012, 10, 538–550. [Google Scholar] [CrossRef]
- Banerjee, S.; Kirkby, C.A.; Schmutter, D.; Bissett, A.; Kirkegaard, J.A.; Richardson, A.E. Network Analysis Reveals Functional Redundancy and Keystone Taxa amongst Bacterial and Fungal Communities during Organic Matter Decomposition in an Arable Soil. Soil Biol. Biochem. 2016, 97, 188–198. [Google Scholar] [CrossRef]
- Peter, D.H.; Harrington, T.B. Effects of Forest Harvesting, Logging Debris, and Herbicides on the Composition, Diversity and Assembly of a Western Washington, USA Plant Community. For. Ecol. Manag. 2018, 417, 18–30. [Google Scholar] [CrossRef]
- Likulunga, L.E.; Rivera Pérez, C.A.; Schneider, D.; Daniel, R.; Polle, A. Tree Species Composition and Soil Properties in Pure and Mixed Beech-Conifer Stands Drive Soil Fungal Communities. For. Ecol. Manag. 2021, 502, 119709. [Google Scholar] [CrossRef]
- Nakashizuka, T. Species Coexistence in Temperate, Mixed Deciduous Forests. Trends Ecol. Evol. 2001, 16, 205–210. [Google Scholar] [CrossRef] [PubMed]
- Wang, Z.; Yang, H.; Dong, B.; Zhou, M.; Ma, L.; Jia, Z.; Duan, J. Regeneration Response to Canopy Gap Size in a Chinese Pine Plantation: Species Diversity Patterns, Size Structures and Spatial Distributions. For. Ecol. Manag. 2017, 397, 97–107. [Google Scholar] [CrossRef]
- Awad, A.; Majcherczyk, A.; Schall, P.; Schröter, K.; Schöning, I.; Schrumpf, M.; Ehbrecht, M.; Boch, S.; Kahl, T.; Bauhus, J.; et al. Ectomycorrhizal and Saprotrophic Soil Fungal Biomass Are Driven by Different Factors and Vary among Broadleaf and Coniferous Temperate Forests. Soil Biol. Biochem. 2019, 131, 9–18. [Google Scholar] [CrossRef]
- Tan, C.; Ferguson, D.K.; Tang, Z.; Yang, Y. Distribution and Conservation of the Lauraceae in China. Glob. Ecol. Conserv. 2023, 46, e02566. [Google Scholar] [CrossRef]
- Liu, L.; Zhu, K.; Krause, S.M.B.; Li, S.; Wang, X.; Zhang, Z.; Shen, M.; Yang, Q.; Lian, J.; Wang, X.; et al. Changes in Assembly Processes of Soil Microbial Communities during Secondary Succession in Two Subtropical Forests. Soil Biol. Biochem. 2021, 154, 108144. [Google Scholar] [CrossRef]
- Ceci, A.; Pinzari, F.; Russo, F.; Maggi, O.; Persiani, A.M. Saprotrophic Soil Fungi to Improve Phosphorus Solubilisation and Release: In Vitro Abilities of Several Species. Ambio 2018, 47, 30–40. [Google Scholar] [CrossRef]
- Niu, K.; He, J.S.; Zhang, S.; Lechowicz, M.J. Grazing Increases Functional Richness but Not Functional Divergence in Tibetan Alpine Meadow Plant Communities. Biodivers. Conserv. 2016, 25, 2441–2452. [Google Scholar] [CrossRef]
- Liu, Z.; Li, J.; Bayaerta; Niu, K. Biodiversity in Mosaic Communities: Soil Microbial Diversity Associates with Plant Functional Groups Relating to Soil Available Phosphorus in Tibetan Alpine Meadow. Eur. J. Soil Biol. 2023, 116, 103479. [Google Scholar] [CrossRef]
- Bridge, P.; Spooner, B. Soil Fungi: Diversity and Detection. Plant Soil 2001, 232, 147–154. [Google Scholar] [CrossRef]
- Hagenbo, A.; Kyaschenko, J.; Clemmensen, K.E.; Lindahl, B.D.; Fransson, P. Fungal Community Shifts Underpin Declining Mycelial Production and Turnover across a Pinus Sylvestris Chronosequence. J. Ecol. 2018, 106, 490–501. [Google Scholar] [CrossRef]
Figure 1.
Schematic diagram of sample plot. (a) Sample plots without crop-tree thinning, (b) a sample plot of 6 crop trees, (c) a sample plot of 9 crop trees, and (d) a sample plot of 12 crop trees.
Figure 1.
Schematic diagram of sample plot. (a) Sample plots without crop-tree thinning, (b) a sample plot of 6 crop trees, (c) a sample plot of 9 crop trees, and (d) a sample plot of 12 crop trees.
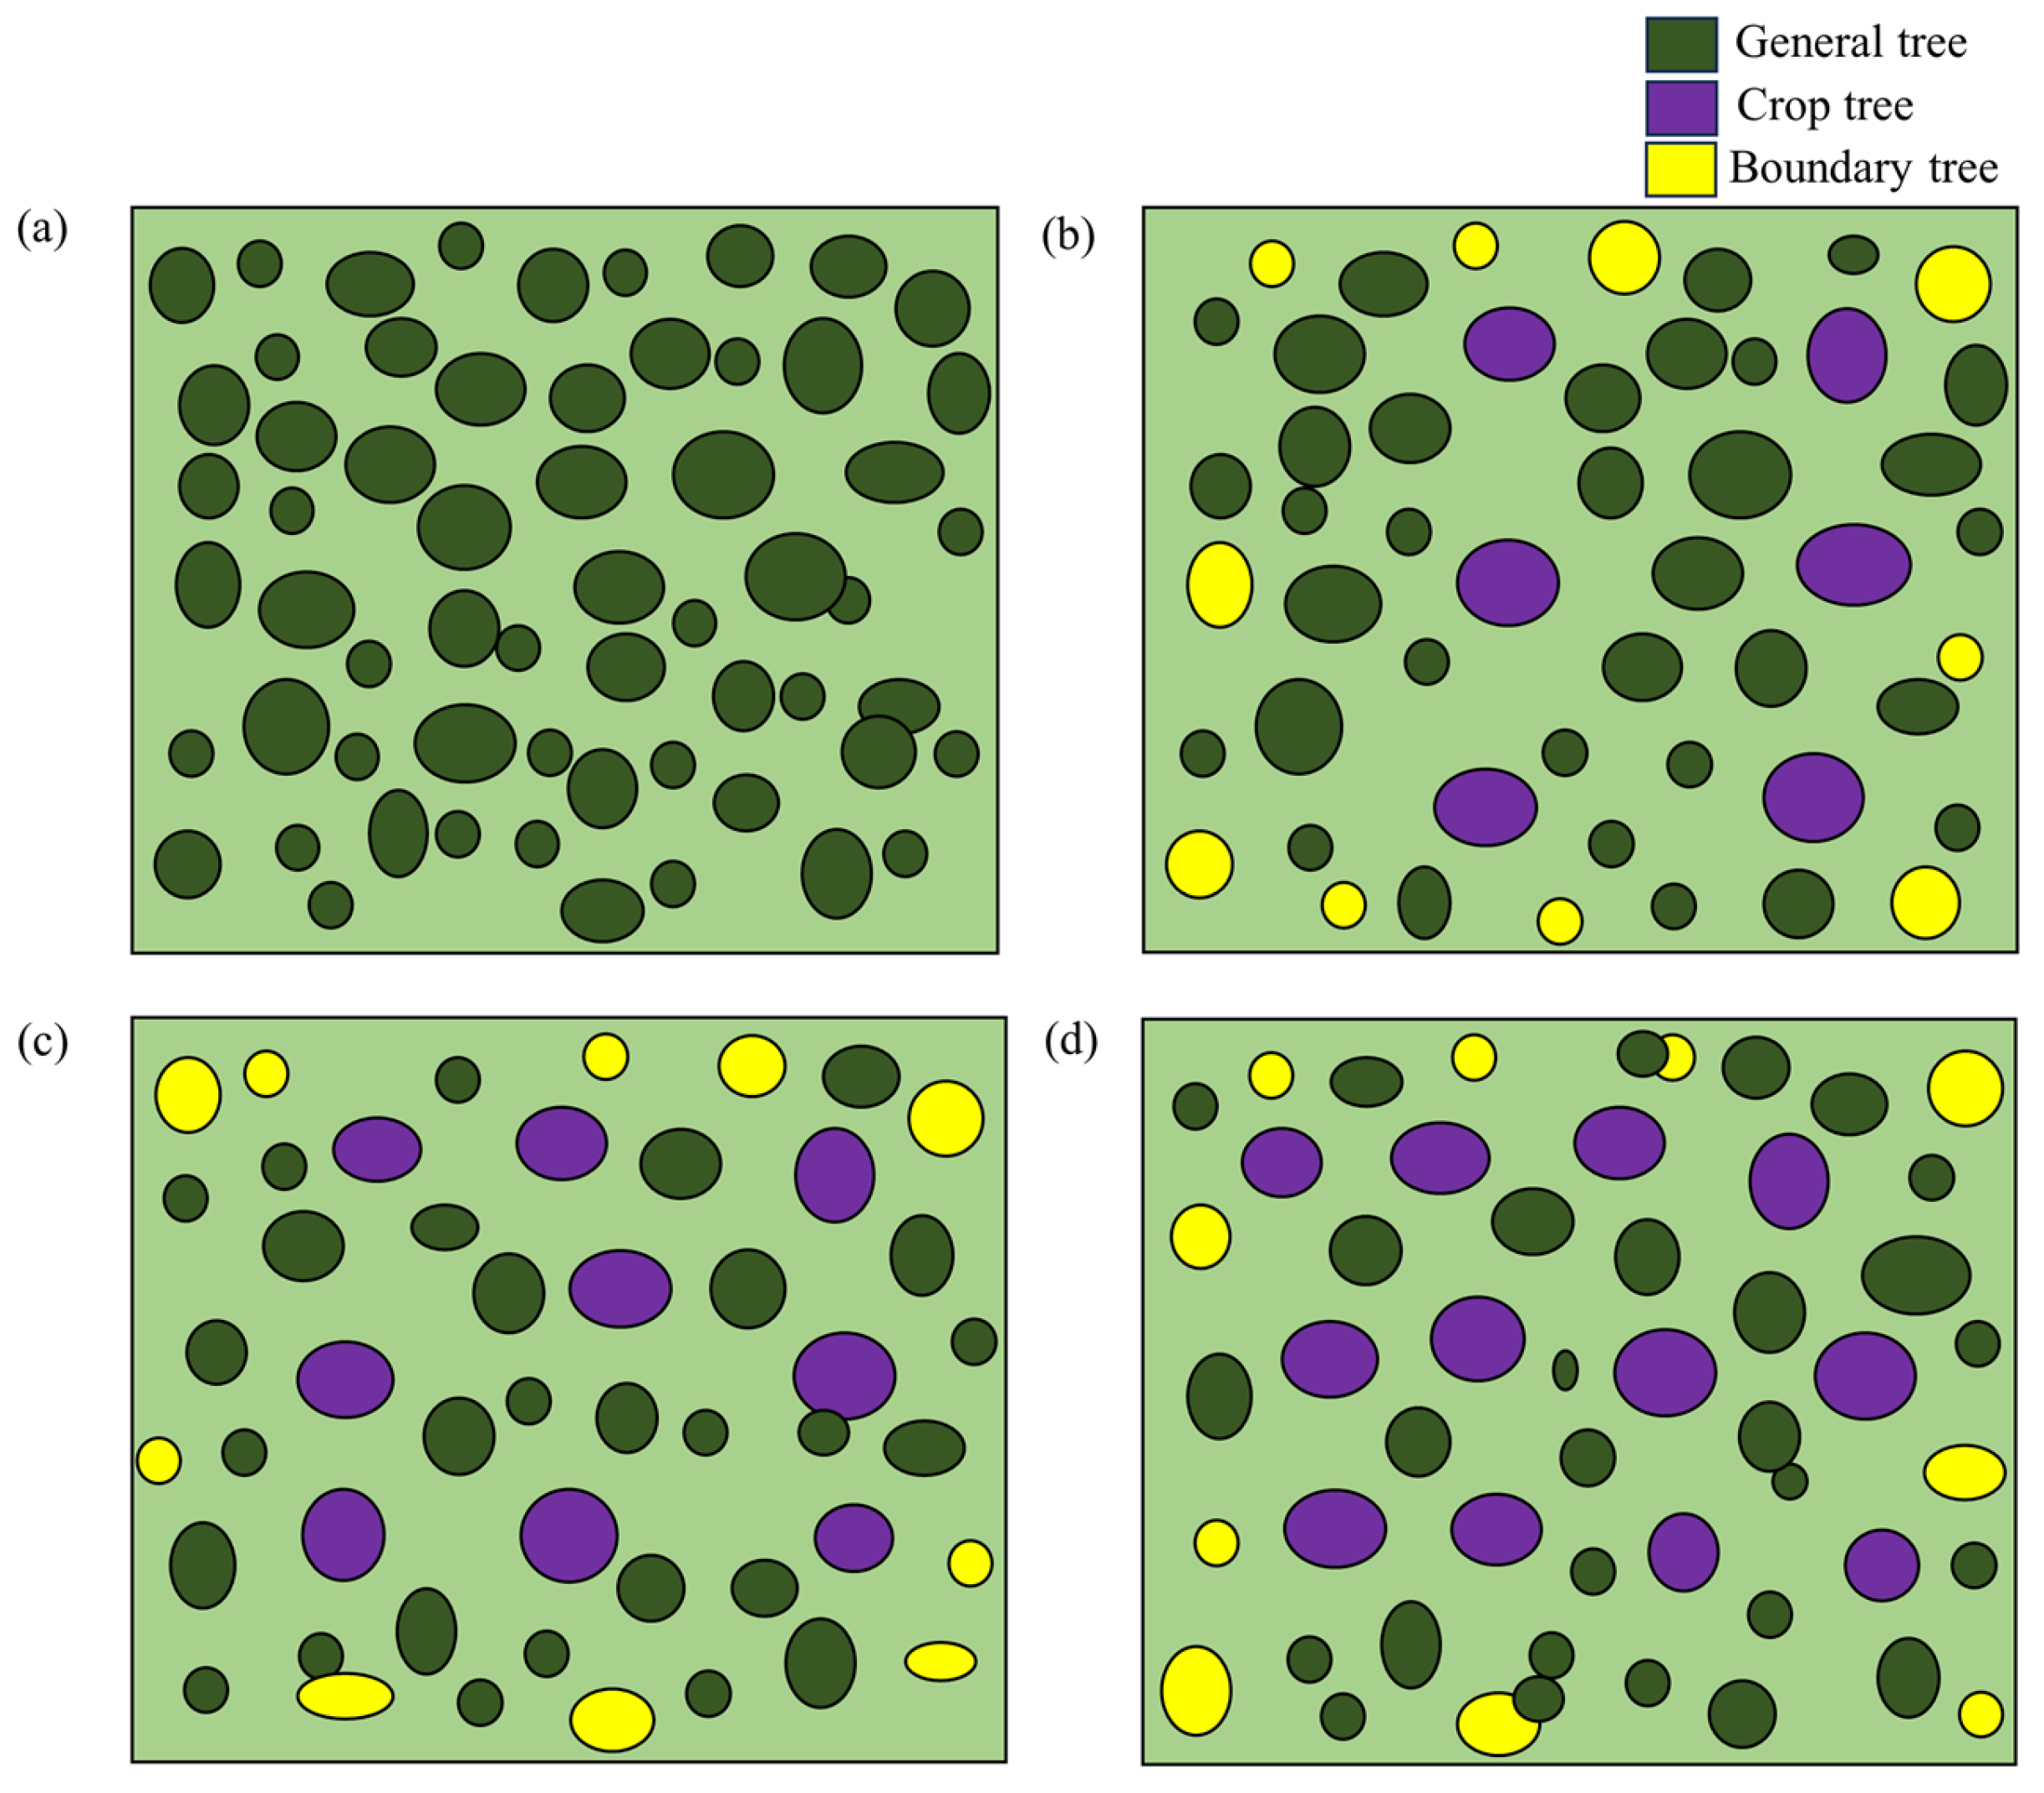
Figure 2.
Fungal-community composition based on the genus (a) and phylum (b) levels.
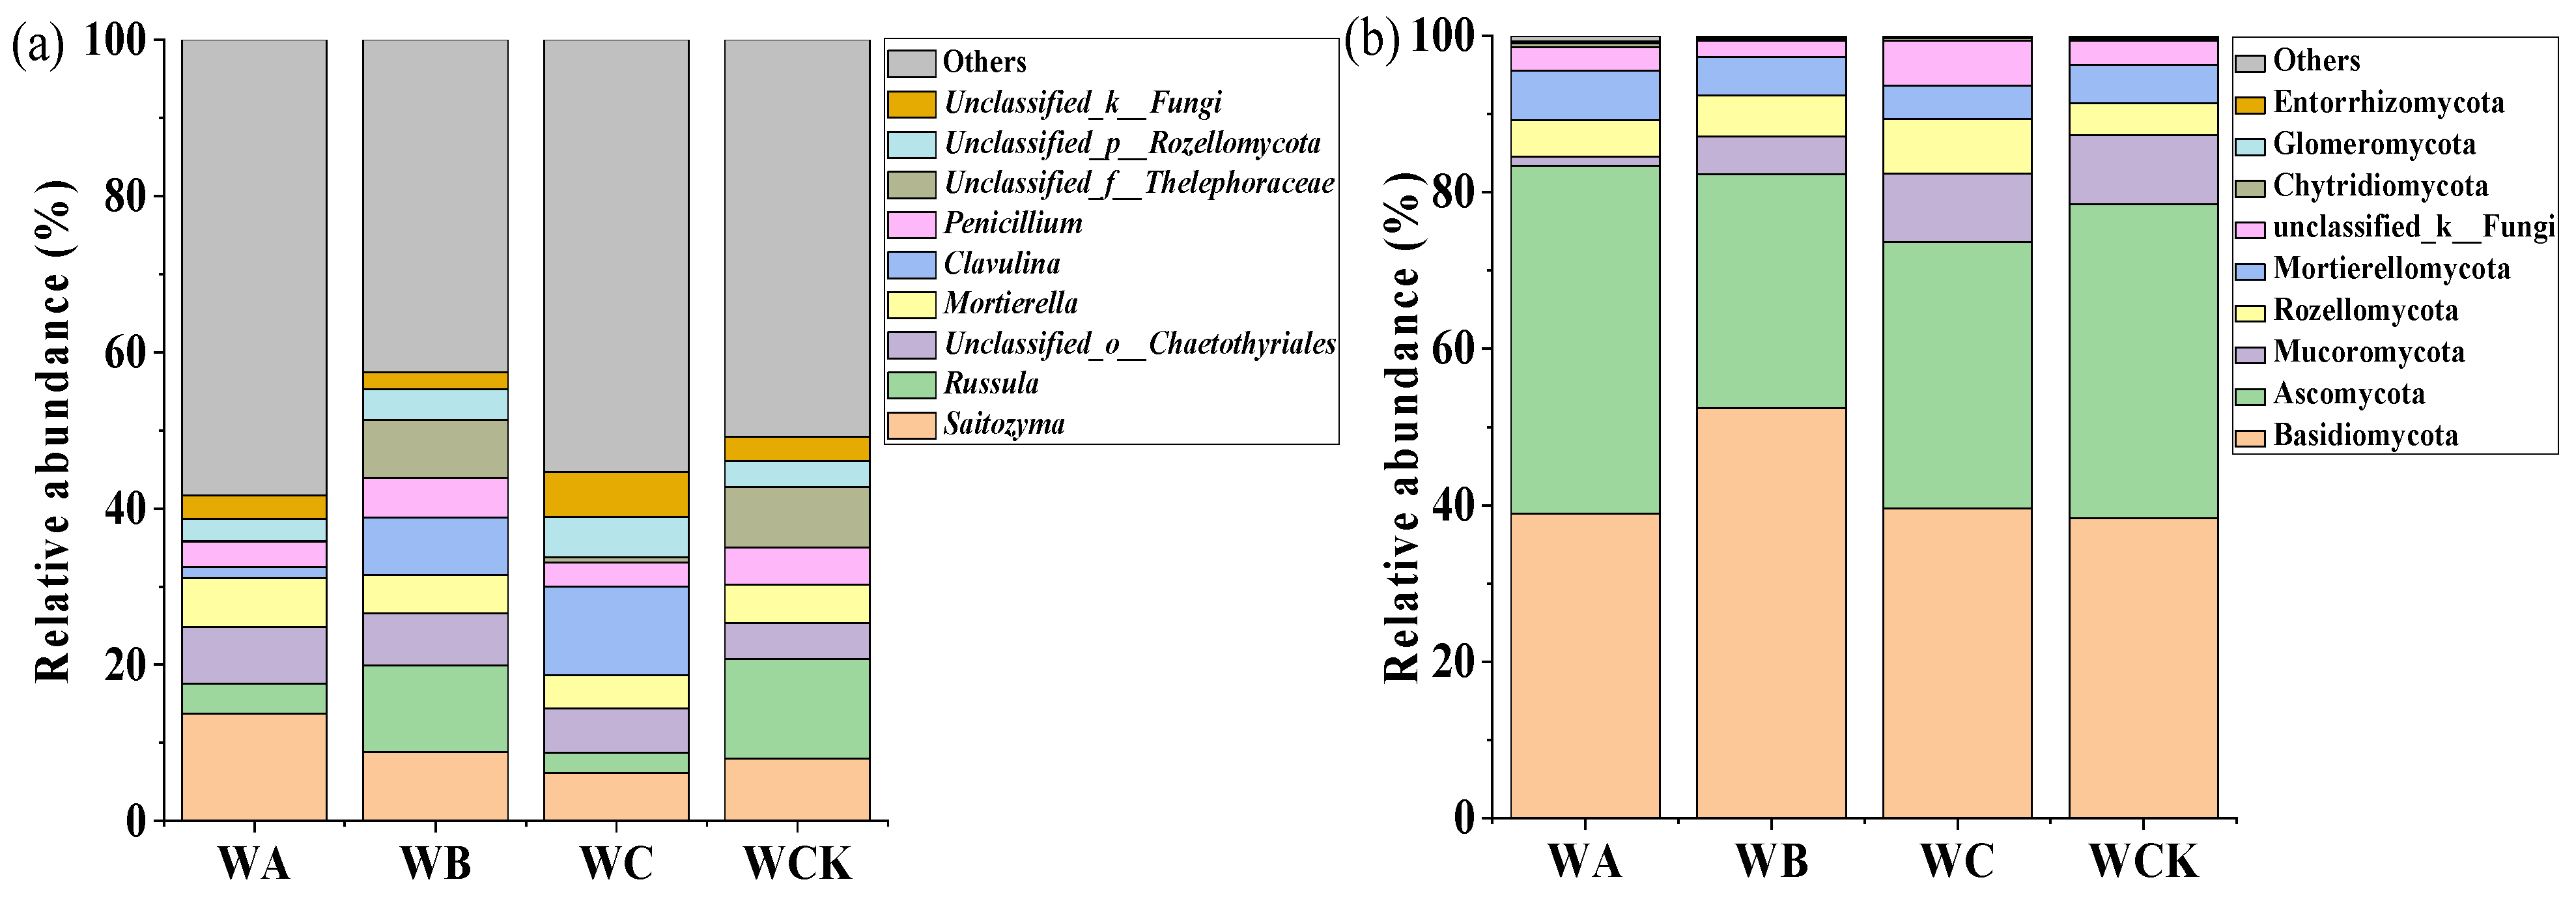
Figure 3.
Principal coordinate analysis (PCoA) of fungal composition based on Bray–Curtis distances.
Figure 3.
Principal coordinate analysis (PCoA) of fungal composition based on Bray–Curtis distances.
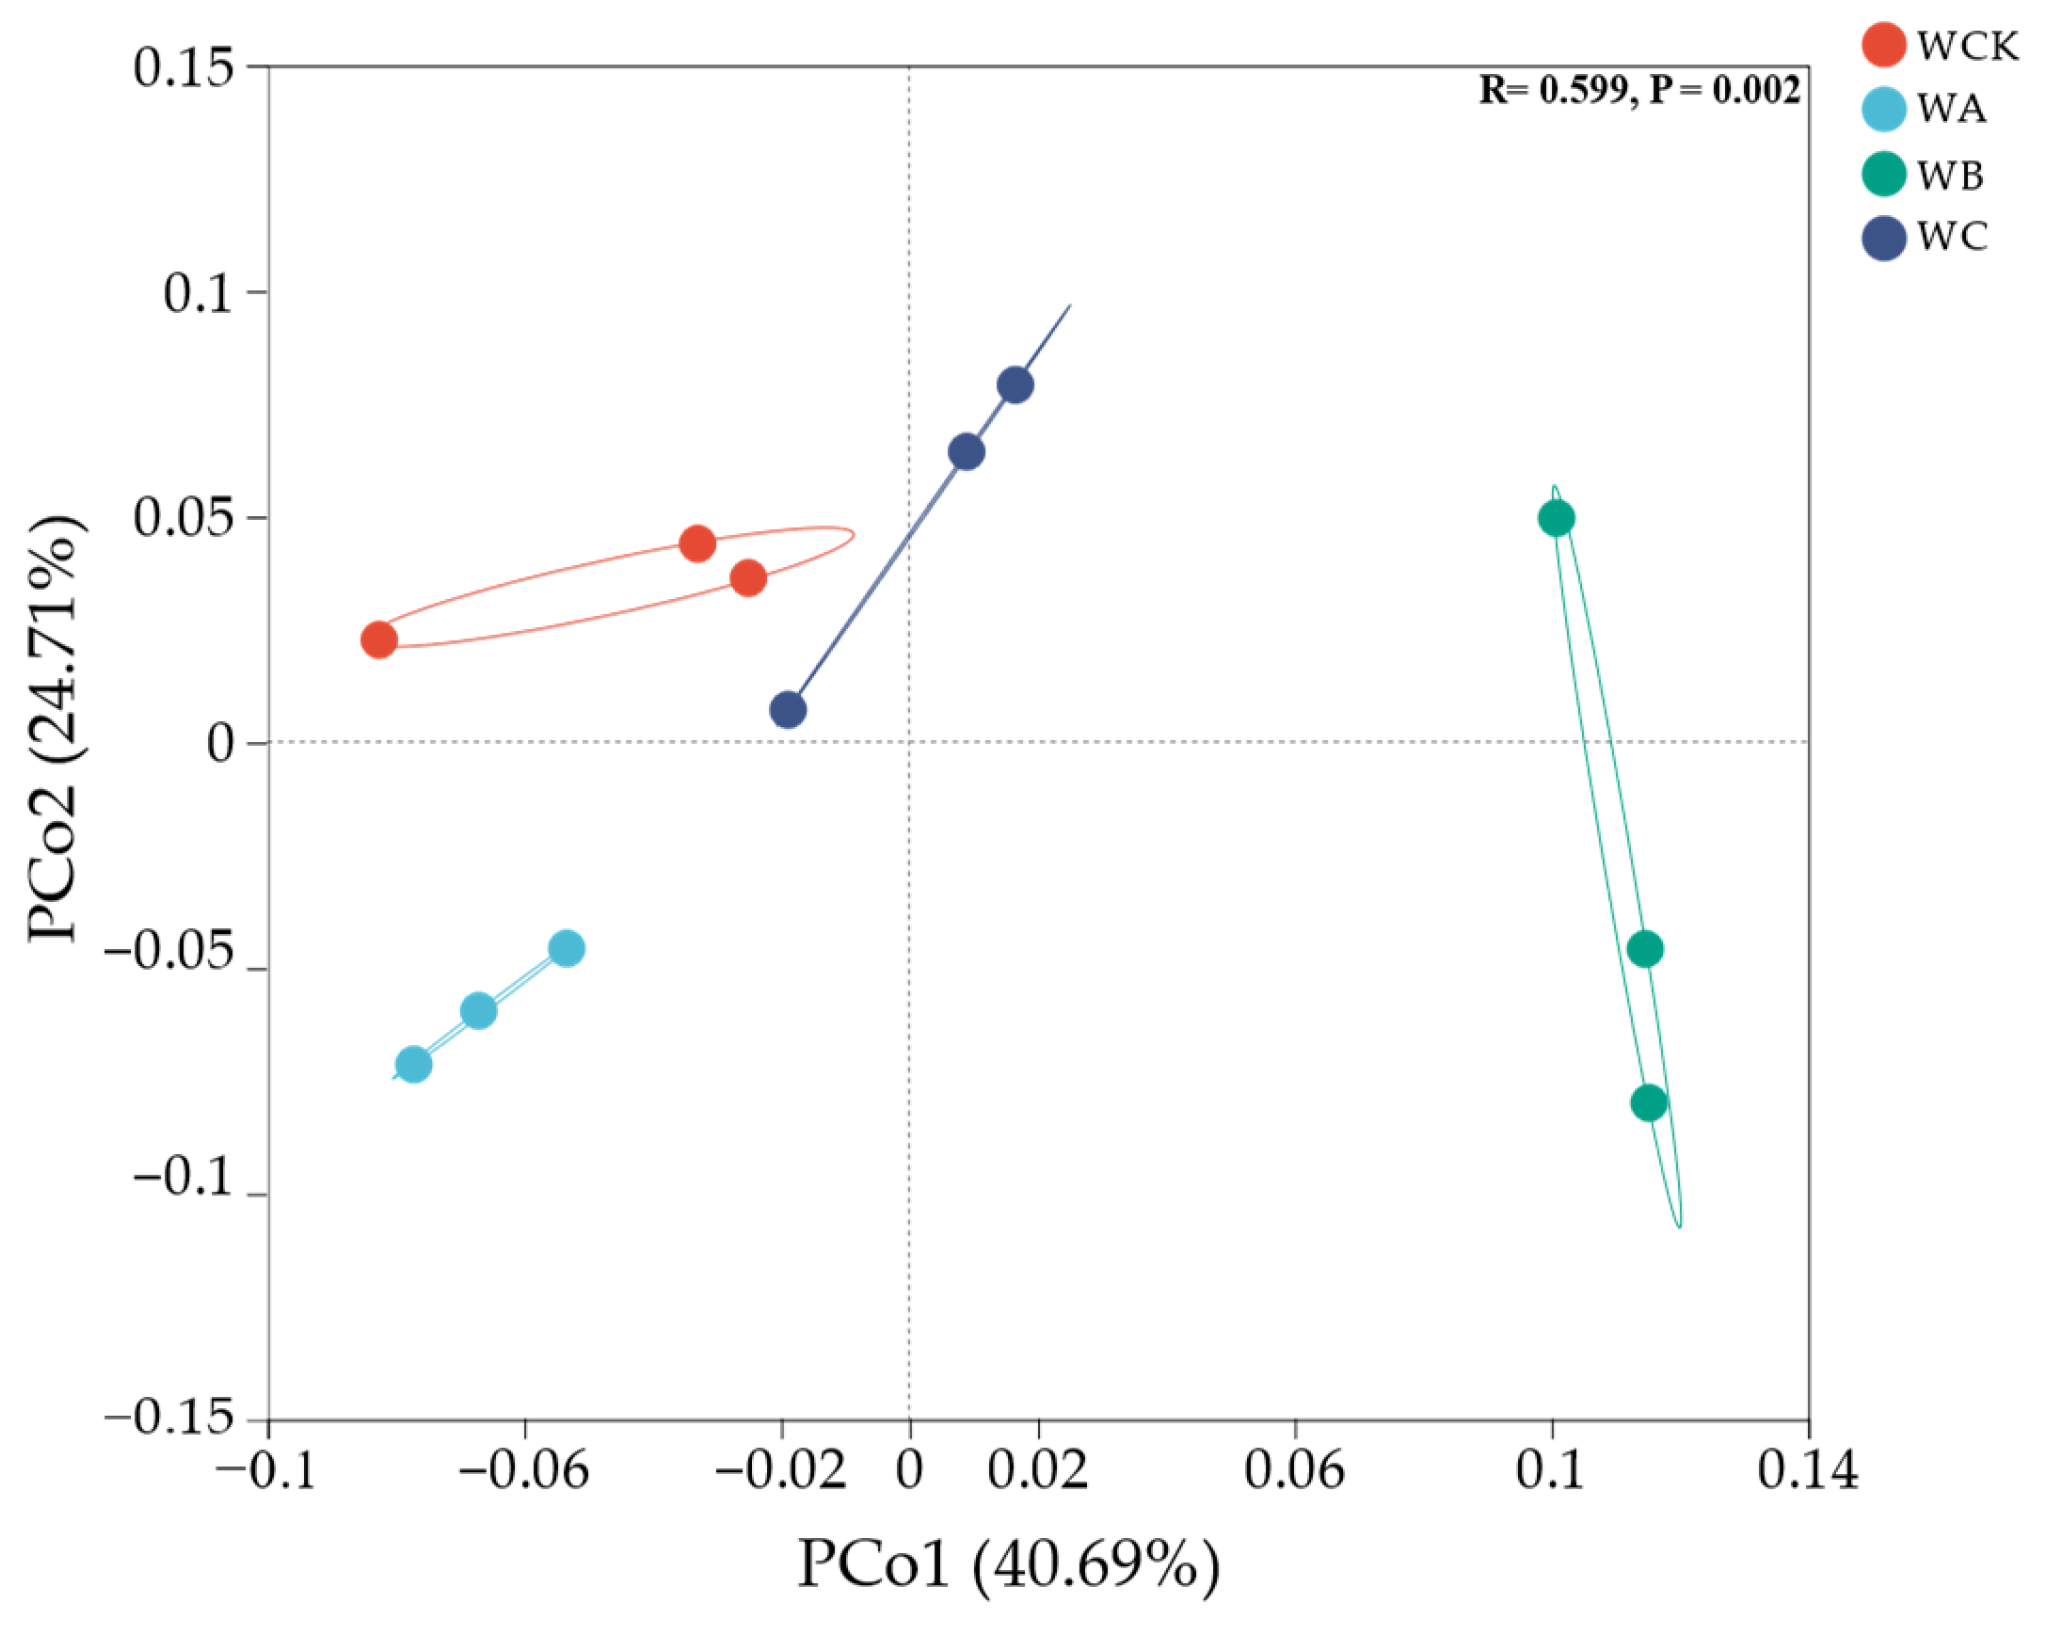
Figure 4.
The relative abundances of fungal functional groups.
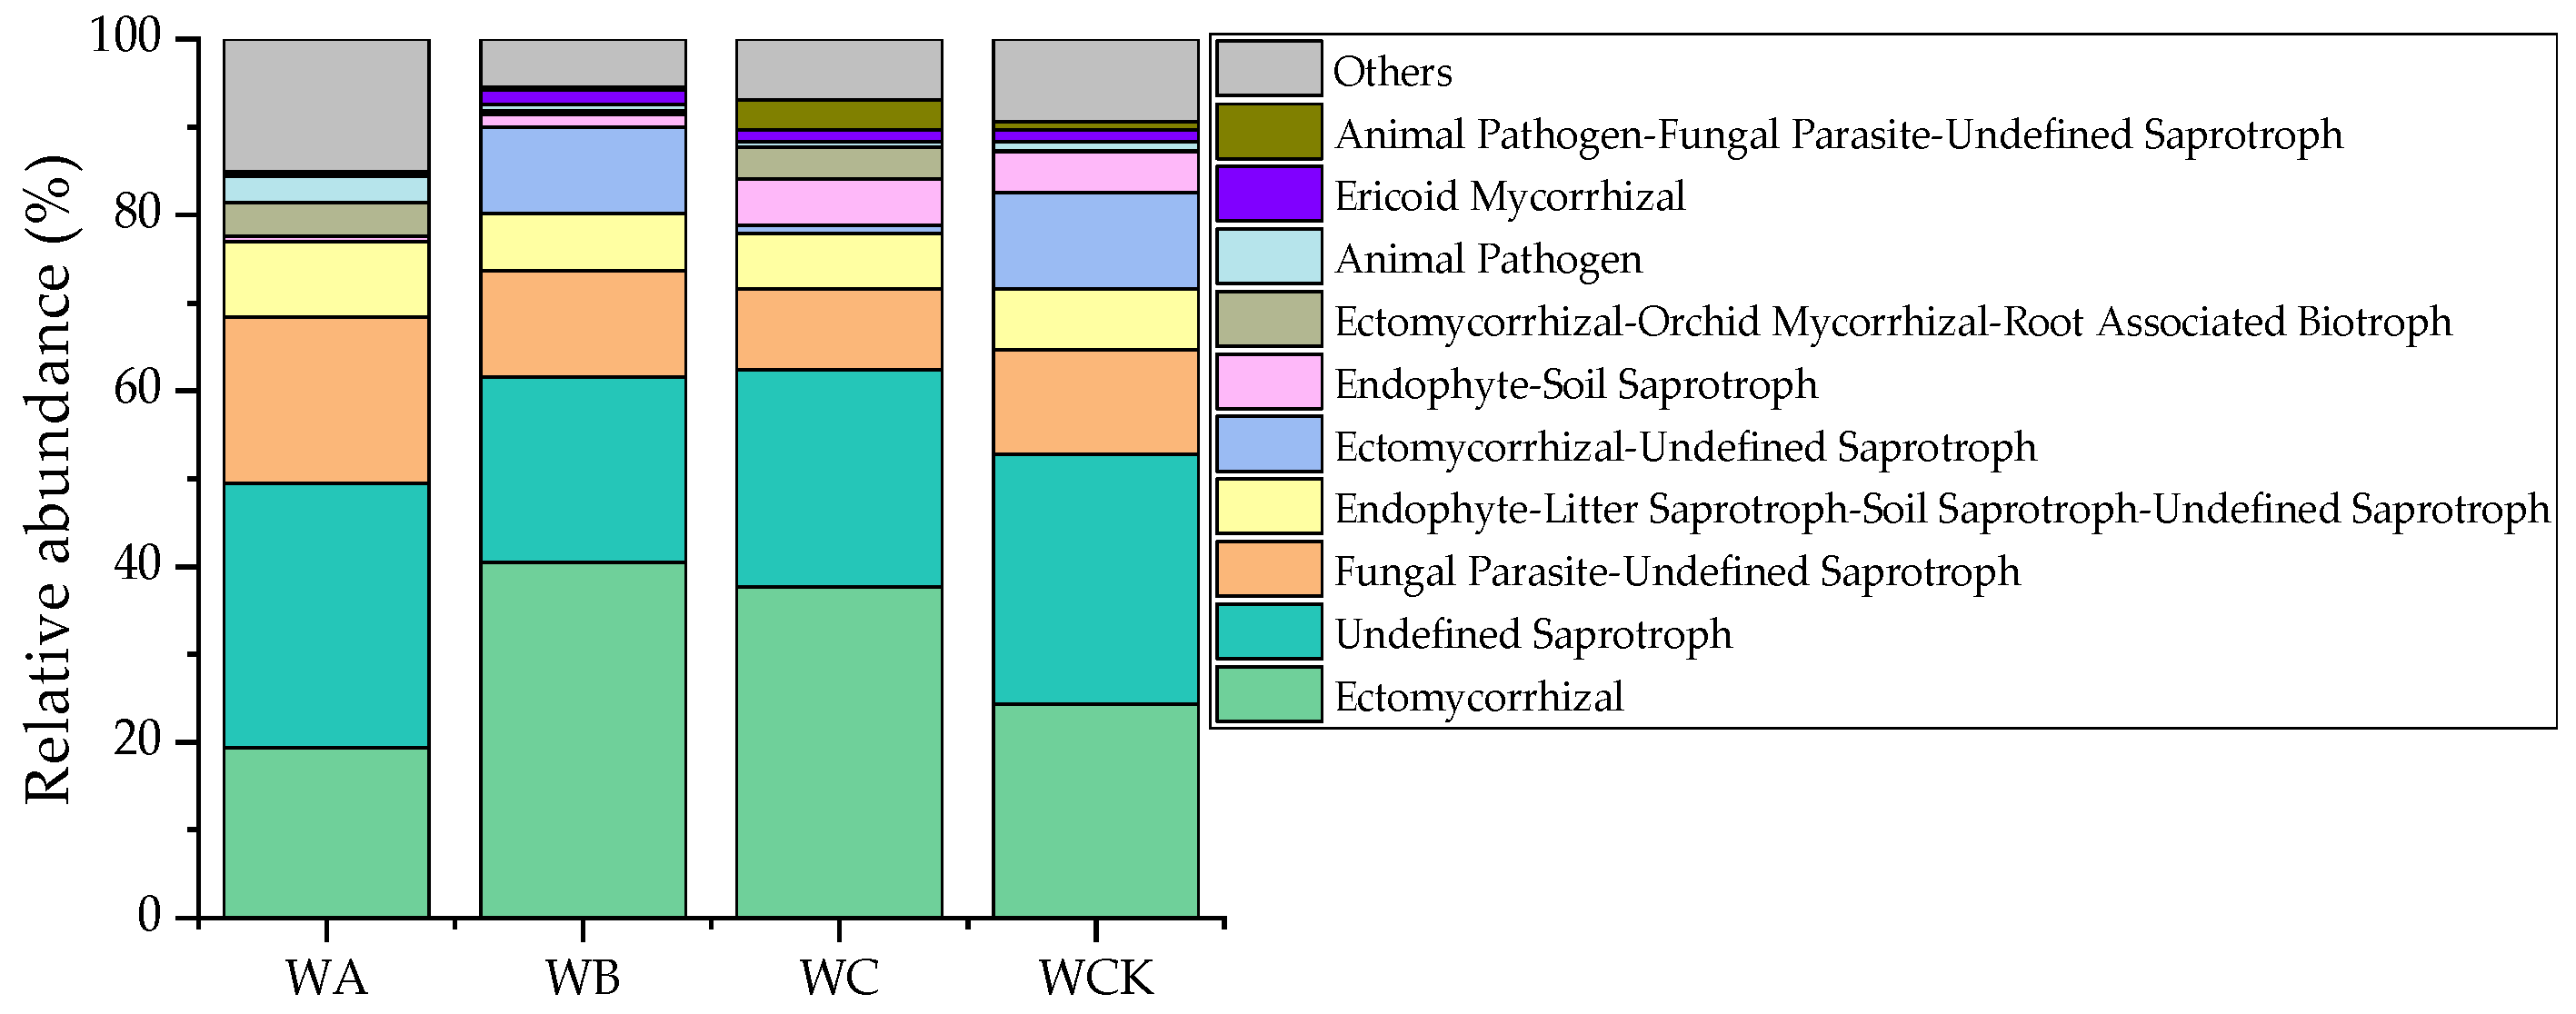
Figure 5.
Co-occurrence networks at the genus level of the soil fungal communities. Red lines indicate positive correlations, and blue lines indicate negative correlations. The blue nodes represent the fungal genera. The number corresponding to the taxa name: 1: Saitozyma; 2: Russula; 3: Unclassified_o__Chaetothyria; 4: Mortierella; 5: Clavulina; 6: Penicillium; 7: Unclassified_f__Thelephoraceae; 8: Unclassified_p__Rozellomycota; 9: Unclassified_k__Fungi; 10: Umbelopsis; 11: Tomentella; 12: Unclassified_p__Ascomycota; 13: Trichoderma; 14: Unclassified_c__Eurotiomycetes; 15: Geminibasidium; 16: Bifiguratus; 17: Unclassified_o__Venturiales; 18: Unclassified_o__Helotiales; 19: Unclassified_o__GS11; 20: Helvellosebacina; 21: Talaromyces; 22: Inocybe; 23: Unclassified_o__Sordariales; 24: Rhizopogon; 25: Oidiodendron; 26: Metarhizium; 27: Unclassified_f__Herpotrichiellaceae; 28: Unclassified_c__Agaricomycetes; 29: Unclassified_c__Dothideomycetes; 30: Tolypocladium; 31: Sagenomella; 32: Unclassified_f__Agaricaceae; 33: Unclassified_o__Leucosporidiales; 34: Chaetosphaeria; 35: Trichophaea; 36: Amanita; 37: Tylospora; 38: Unclassified_f__Hyaloscyphaceae; 39: Scytalidium; 40: Penicillifer; 41: Cladophialophora; 42: Paraboeremia; 43: Chloridium; 44: Unclassified_o__GS23; 45: Unclassified_f__Ceratobasidiaceae; 46: Membranomyces; 47: Fusicolla; and 48: Pseudopithomyces.

Figure 6.
Structural equation model of fungal composition, understory vegetation, and soil factors. Solid arrows indicate significant effects (p < 0.05). The arrow width corresponds directly to the standardized path coefficient. Numbers adjacent to arrows are standardized path coefficients and indicative of the effect size of the relationship. Solid lines represent positive effects, while dotted lines represent negative effects. R2 values associated with response variables indicate the proportion of explained variation by relationships with other variables. Shrub community composition: important values of all plants in the shrub layer; herb diversity; richness index; Simpson index; Shannon–Wiener index; and Pielou index of herb layer; TP: the total phosphorus; and SOM: soil organic matter. *** p < 0.001; ** p < 0.01; * p < 0.05.

Figure 7.
Standardized total, direct, and indirect effects derived from the structural equation modeling of TP, SOM, and fungal-community composition.
Figure 7.
Standardized total, direct, and indirect effects derived from the structural equation modeling of TP, SOM, and fungal-community composition.

Table 1.
General description of each sample plot.
| Plot | Number of Crop Trees (N/667 m2) | Number of Crop Trees (N/ha) | Stand Density (trees/ha) | DBH (cm) | Average Height (m) | Altitude (m) | Slope (°) | Slope Aspect |
|---|---|---|---|---|---|---|---|---|
| WA | 6 | 100 | 1000 | 32.7 ± 6.5 | 14.5 ± 1.8 | 507 | 29 | South by west |
| WB | 9 | 150 | 1014 | 33.4 ± 4.5 | 12.9 ± 1.1 | 529 | 32 | North by west |
| WC | 12 | 200 | 1005 | 27.6 ± 5.2 | 13.0 ± 1.3 | 508 | 34 | North by west |
| WCK | 0 | 0 | 1252 | 26.1 ± 1.4 | 12.3 ± 0.2 | 479 | 27 | South by west |
Table 2.
Changes in understory plant diversity.
| Plot | R1 | D1 | H1 | J1 | R2 | D2 | H2 | J2 |
|---|---|---|---|---|---|---|---|---|
| WA | 22.67 ± 0.58 c | 0.91 ± 0.002 b | 1.17 ± 0.01 c | 0.86 ± 0.01 b | 14.00 ± 1.00 b | 0.83 ± 0.02 c | 0.91 ± 0.05 c | 0.80 ± 0.02 b |
| WB | 30.00 ± 1.73 b | 0.95 ± 0.001 a | 1.34 ± 0.03 b | 0.90 ± 0.04 ab | 16.33 ± 0.58 a | 0.92 ± 0.002 a | 1.14 ± 0.04 a | 0.94 ± 0.02 a |
| WC | 32.67 ± 1.53 a | 0.96 ± 0.003 a | 1.42 ± 0.03 a | 0.94 ± 0.01 a | 17.33 ± 0.58 a | 0.91 ± 0.01 a | 1.14 ± 0.02 a | 0.92 ± 0.01 a |
| WCK | 18.67 ± 1.53 d | 0.91 ± 0.01 b | 1.12 ± 0.03 c | 0.89 ± 0.03 b | 12.33 ± 0.58 c | 0.89 ± 0.01 b | 1.01 ± 0.03 b | 0.93 ± 0.01 a |
All data are presented as means ± SD (n = 3). Different lowercase letters in the same column indicate statistically significant differences under different treatments (p < 0.05). R1, the richness index of the shrub layer; R2, the richness index of the herb layer; D1, the Simpson index of the shrub layer; D2, the Simpson index of the herb layer; H1, the Shannon–Wiener index of the shrub layer; H2, the Shannon–Wiener index of the herb layer; J1, the Pielou index of the shrub layer; and J2, the Pielou index of the herb layer.
Disclaimer/Publisher’s Note: The statements, opinions and data contained in all publications are solely those of the individual author(s) and contributor(s) and not of MDPI and/or the editor(s). MDPI and/or the editor(s) disclaim responsibility for any injury to people or property resulting from any ideas, methods, instructions or products referred to in the content. |
© 2024 by the authors. Licensee MDPI, Basel, Switzerland. This article is an open access article distributed under the terms and conditions of the Creative Commons Attribution (CC BY) license (https://creativecommons.org/licenses/by/4.0/).
Share and Cite
MDPI and ACS Style
Lyu, Q.; Yang, H.; Yin, B.; Xiang, Y.; Zhao, K.; Hou, G.; Chen, G.; Fan, C.; Li, X. Response of Soil Fungal-Community Structure to Crop-Tree Thinning in Pinus massoniana Plantation. Forests 2024, 15, 743. https://doi.org/10.3390/f15050743
AMA Style
Lyu Q, Yang H, Yin B, Xiang Y, Zhao K, Hou G, Chen G, Fan C, Li X. Response of Soil Fungal-Community Structure to Crop-Tree Thinning in Pinus massoniana Plantation. Forests. 2024; 15(5):743. https://doi.org/10.3390/f15050743
Chicago/Turabian StyleLyu, Qian, Huiqin Yang, Biran Yin, Yongqi Xiang, Kuangji Zhao, Guirong Hou, Gang Chen, Chuan Fan, and Xianwei Li. 2024. "Response of Soil Fungal-Community Structure to Crop-Tree Thinning in Pinus massoniana Plantation" Forests 15, no. 5: 743. https://doi.org/10.3390/f15050743
Note that from the first issue of 2016, this journal uses article numbers instead of page numbers. See further details here.