Review

Automated Ultrafiltration Device for Environmental Nanoparticle Research and Implications: A Review

1
The Experimental Forest, National Taiwan University, Nantou 55750, Taiwan
2
The School of Forestry and Resource Conservation, National Taiwan University, Taipei 10617, Taiwan
3
Department of Geosciences, National Taiwan University, Taipei 10617, Taiwan
4
Department of Agricultural Chemistry, National Taiwan University, Taipei 10617, Taiwan
*
Author to whom correspondence should be addressed.
Micromachines 2013, 4(2), 215-231; https://doi.org/10.3390/mi4020215
Submission received: 28 February 2013 / Revised: 16 May 2013 / Accepted: 17 May 2013 / Published: 3 June 2013
(This article belongs to the Special Issue Micromachined Tools for Nanoscale Science and Technology)

Abstract

:
Nanoparticle research and development have brought significant breakthroughs in many areas of basic and applied sciences. However, efficiently collecting nanoparticles in large quantities in pure and natural systems is a major challenge in nanoscience. This review article has focused on experimental investigation and implications of nanoparticles in soil, clay, geological and environmental sciences. An automated ultrafiltration device (AUD) apparatus was used to demonstrate efficient collection and separation of nanoparticles in highly weathering red soils, black soils, and gouge of earthquake fault, as well as zeolite. The kaolinite, illite, goethite, and hematite were identified in highly weathering red soils. Transmission electron microscopic (TEM) images showed the presence of hematite nanoparticles on the surface coating of kaolinite nanoparticles and aggregated hematite nanoparticles overlapping the edge of a kaolinite flake in a size range from 4 to 7 nm. The maximum crystal violet (CV) and methylene blue (MB) adsorption amount of smectite nanoparticles (<100 nm) separated by black soils were about two to three times higher than those of bulk sample (<2000 nm). The smectite nanoparticles adsorb both CV and MB dyes efficiently and could be employed as a low-cost alternative to remove cationic dyes in wastewater treatment. Quartz grain of <50 nm was found in the gouge of fault by X-ray diffraction (XRD) analysis and TEM observation. Separated quartz could be used as the index mineral associated with earthquake fracture and the finest grain size was around 25 nm. Comparing the various particle-size fractions of zeolite showed significant differences in surface area, Si to Al molar ratio, morphology, crystallinity, framework structure, and surface atomic structure of nanoparticles from those of the bulk sample prior to particle-size fractionations. The AUD apparatus has the characteristics of automation, easy operation, and high efficiency in the separation of nanoparticles and would, thus, facilitate future nanoparticle research and developments in basic and applied sciences.

1. Introduction

Nanoparticles, which are smaller than 100 nm, are important in industrial and environmental applications because of their high specific surface area (SSA) and surface reactivity and their associated properties of adsorbing or binding to organic and trace metal contaminants. For example, in industrial applications, SSA and porosity properties of fine particles, including nanoparticles are of important properties in many field researches, especially the surface and interface reaction of solids such as catalyzed reaction [1,2,3,4,5], adsorption reaction in liquid [6,7] and gas adsorption on solid surface [8,9]. In environmental applications, Mayo et al. (2007) [10] reported that 12-nm magnetite particles were roughly 200 times more effective in removing As(III) and As(V) from water than 20 and 300 nm ones, indicating significant size-dependent effects. This is most likely due, at least in part, to differences in surface and near-surface atomic structure, as well as crystal shape and surface topography as a function of size in this smallest of size regimes [11]. A relatively large proportion of the exposed Al and Si atoms of nanoparticles are on or near their surfaces, showing cracks, crevices or pores within their structure [12]. This causes nanoparticles to exhibit distinctly different properties from the same material in the bulk sample, which are strongly dependent on the extent of structural alteration, the nature of their porosity, and resultant changes in magnitude of their SSA and surface charge properties [13,14].
Nanoparticle collection techniques have been developed for micro/nano-particle separation, such as split-flow lateral-transport thin-cell fractionation [15], field-flow fractionation [16], or analytical centrifugation and ultracentrifugation [17,18]. All these techniques, however, are more expensive and cumbersome than filtration method. The filtration methods, such as microfiltration and ultrafiltration have been widely used for separating fine particles, colloids, and microbes for basic chemicals and synthetic fertilizers, environmental protection and waste water treatment, and the food industry, as well as others [19,20,21,22]. The efficiency of membrane filtration is dependent on the particle size, membrane pore size, and pressure, which are major factors affecting the solid/liquid separation because the flow resistance increases with decreasing particle and membrane pore sizes [19,23,24,25]. The use of additional force (e.g., vacuum/pressure pump, ultrasound) to aid filtration for separating micro- and nanoparticles has been reported in the literature [20,26,27,28,29]. The mechanical dewatering of fine particle suspensions is time-consuming and laborious to use ultrafiltration membranes for solid/liquid separation because of limitations of human physical strength by using hand operation. Much research evidence indicated that the operating pressures of microfiltration and ultrafiltration during the membrane filtration process are available in the range of the <2 and 1 to 10 kg cm−2, respectively [26]. However, very little is known on the feasibility of using ultrafiltration membranes with the pore size of 1 to 100 nm. Ultracentrifugation and ultrafiltration methods are time consuming to separate and obtain large quantities of nanoparticles [30]. For this reason, an automated ultrafiltration device (AUD) was developed to overcome this problem of efficiently collecting nanoparticles, which had been proved to be more efficient than the conventional ultracentrifugation and syringe filtration methods [30,31]. The AUD utilizes an automatic hydraulic ram to facilitate collection of nanoparticles using the ultrafiltration membrane with pore size in the range of 1 to 100 nm. Microfiltration membranes with pore sizes of 450, 300, 220, and 100 nm were commonly used in general laboratories. Ultrafiltration membranes with pore sizes of 50, 25, and 1 nm were also commercially available, and thus it was convenient to use these membranes to separate nanoparticles [30].
The purpose of this review article was to present an overview of publications related to the separation and collection of nanoparticles in basic and applied sciences. In some cases references to experimental investigation and implications of nanoparticles are given the separation and efficiency collect nanoparticles in pure and natural systems. Those are valuable studies linking separation and collection methods studies from highly weathered red soils with mineral nanoparticles, black soils rich in smectite nanoparticles, and gouge of earthquake fault containing quartz nanoparticles in natural system, as well as zeolite nanoparticles in pure system.

2. Description of the Automated Ultrafiltration Device (AUD)

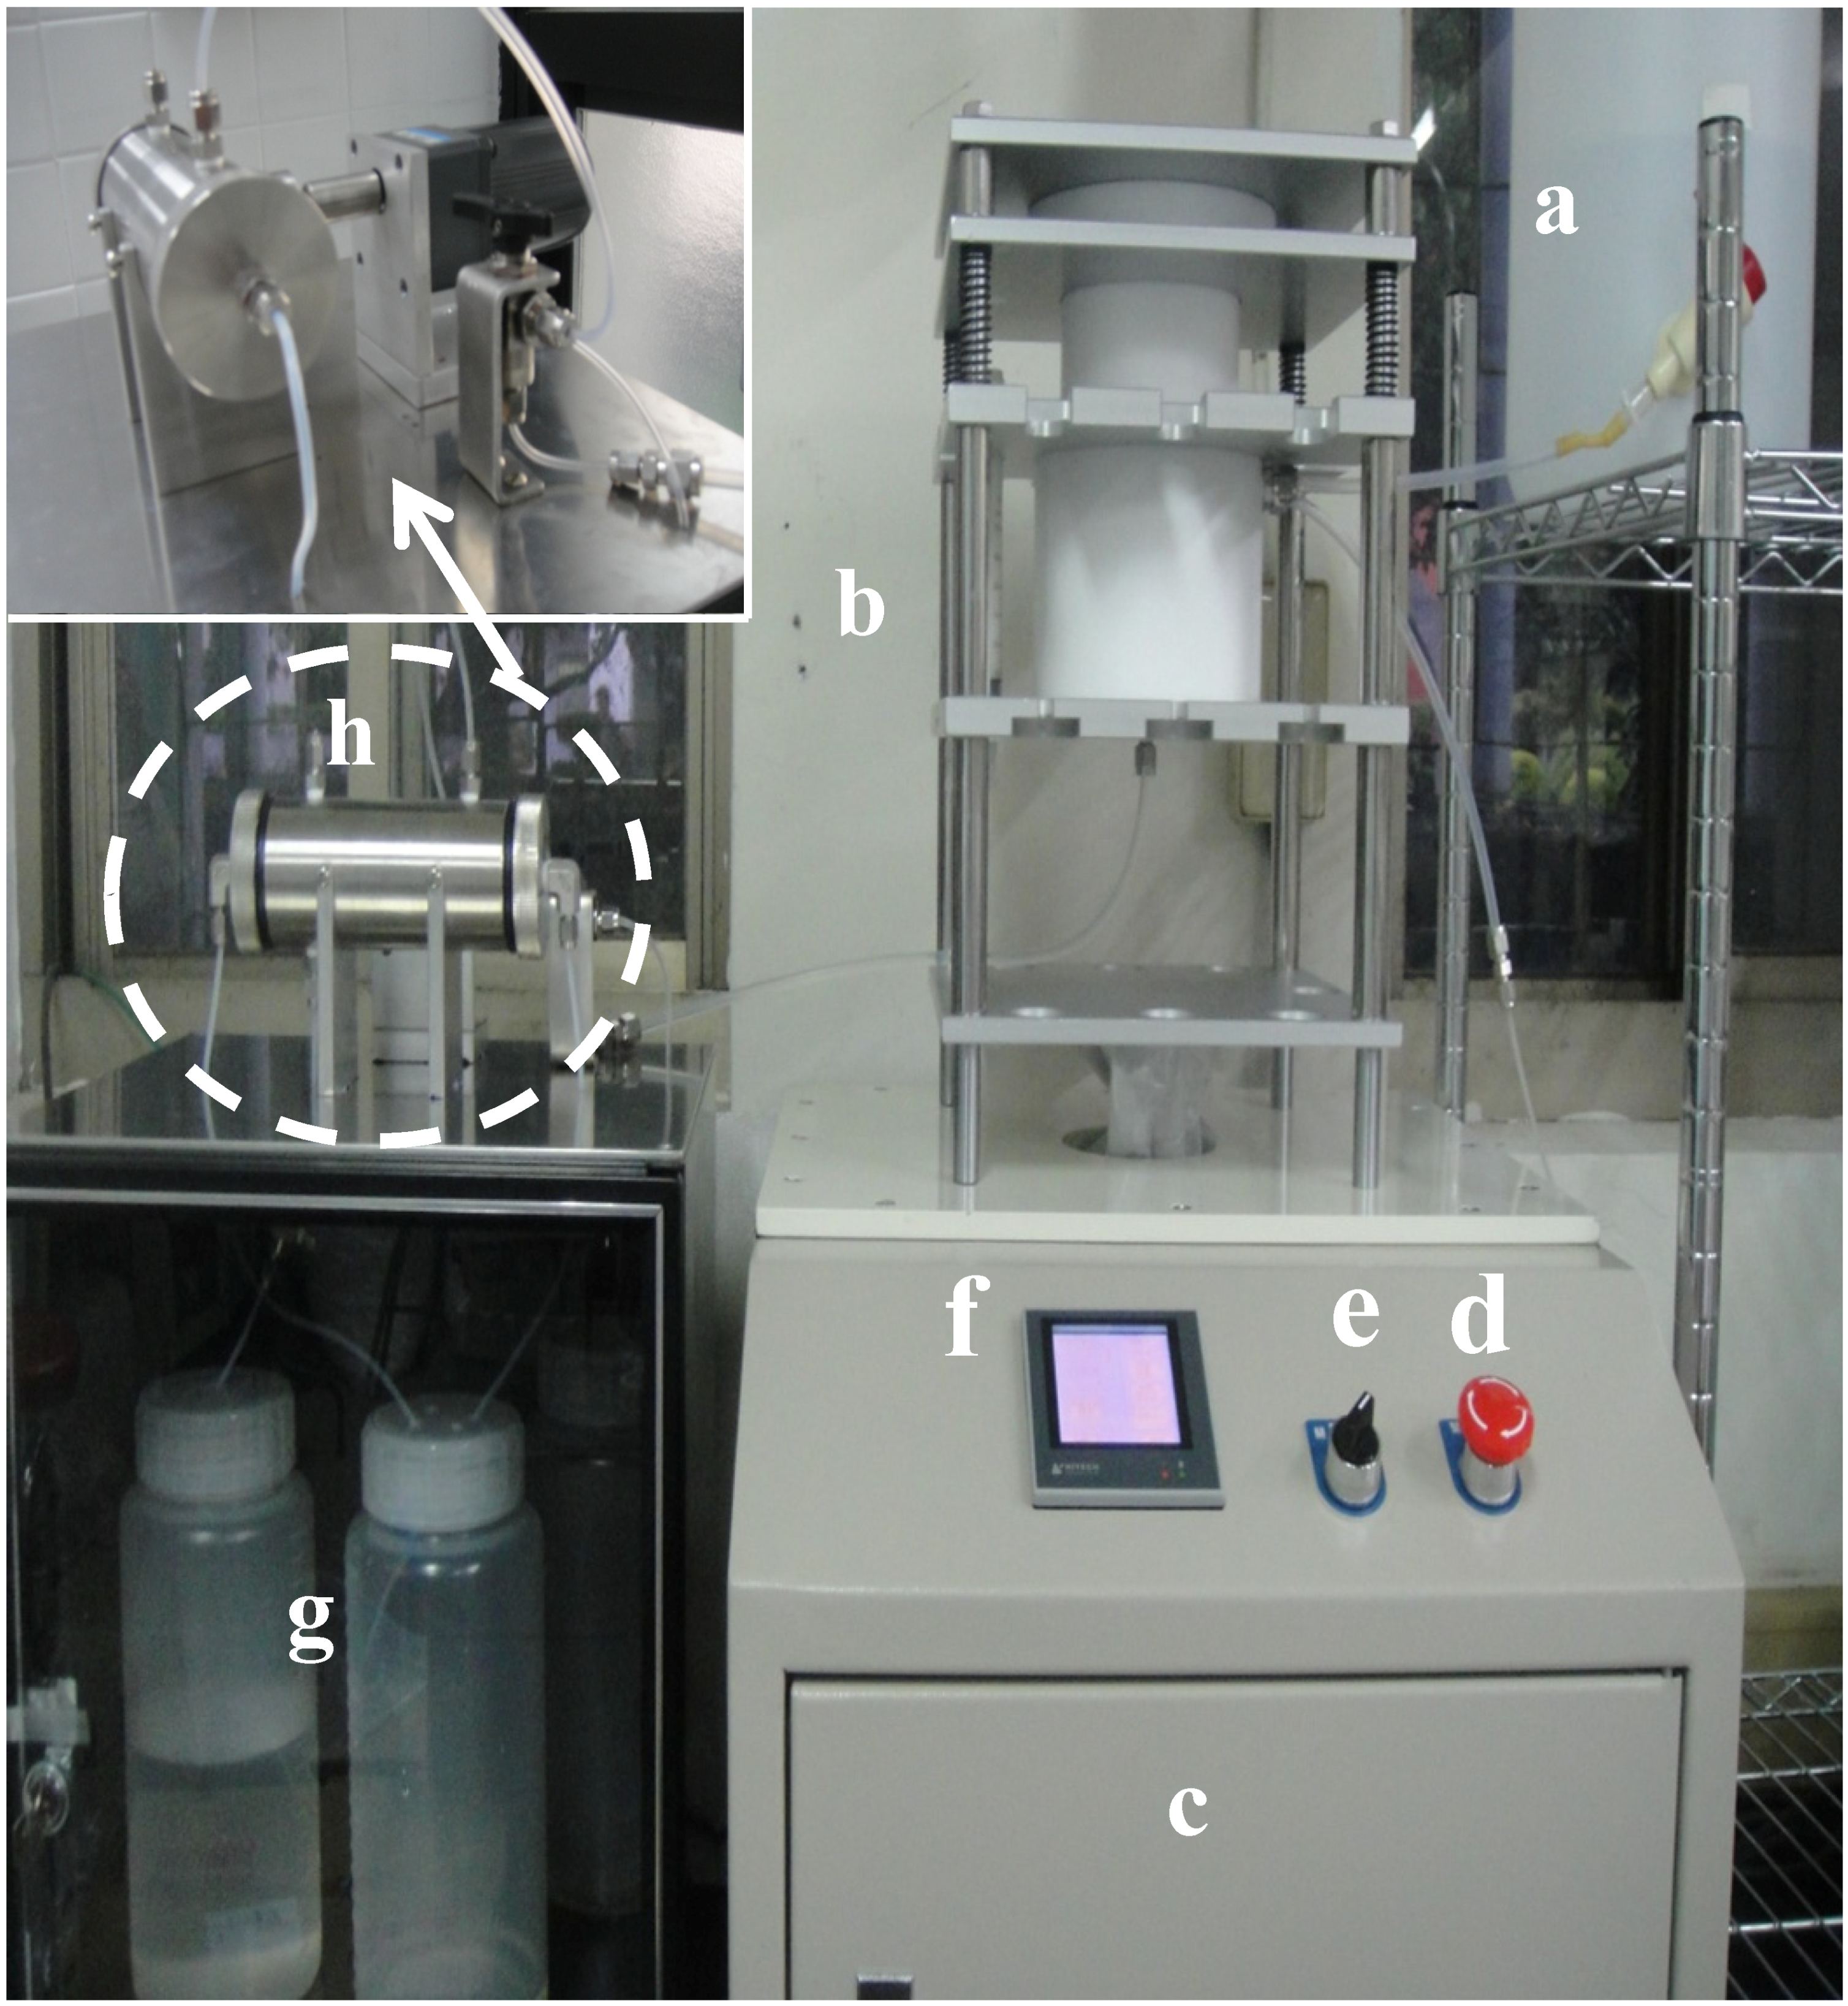
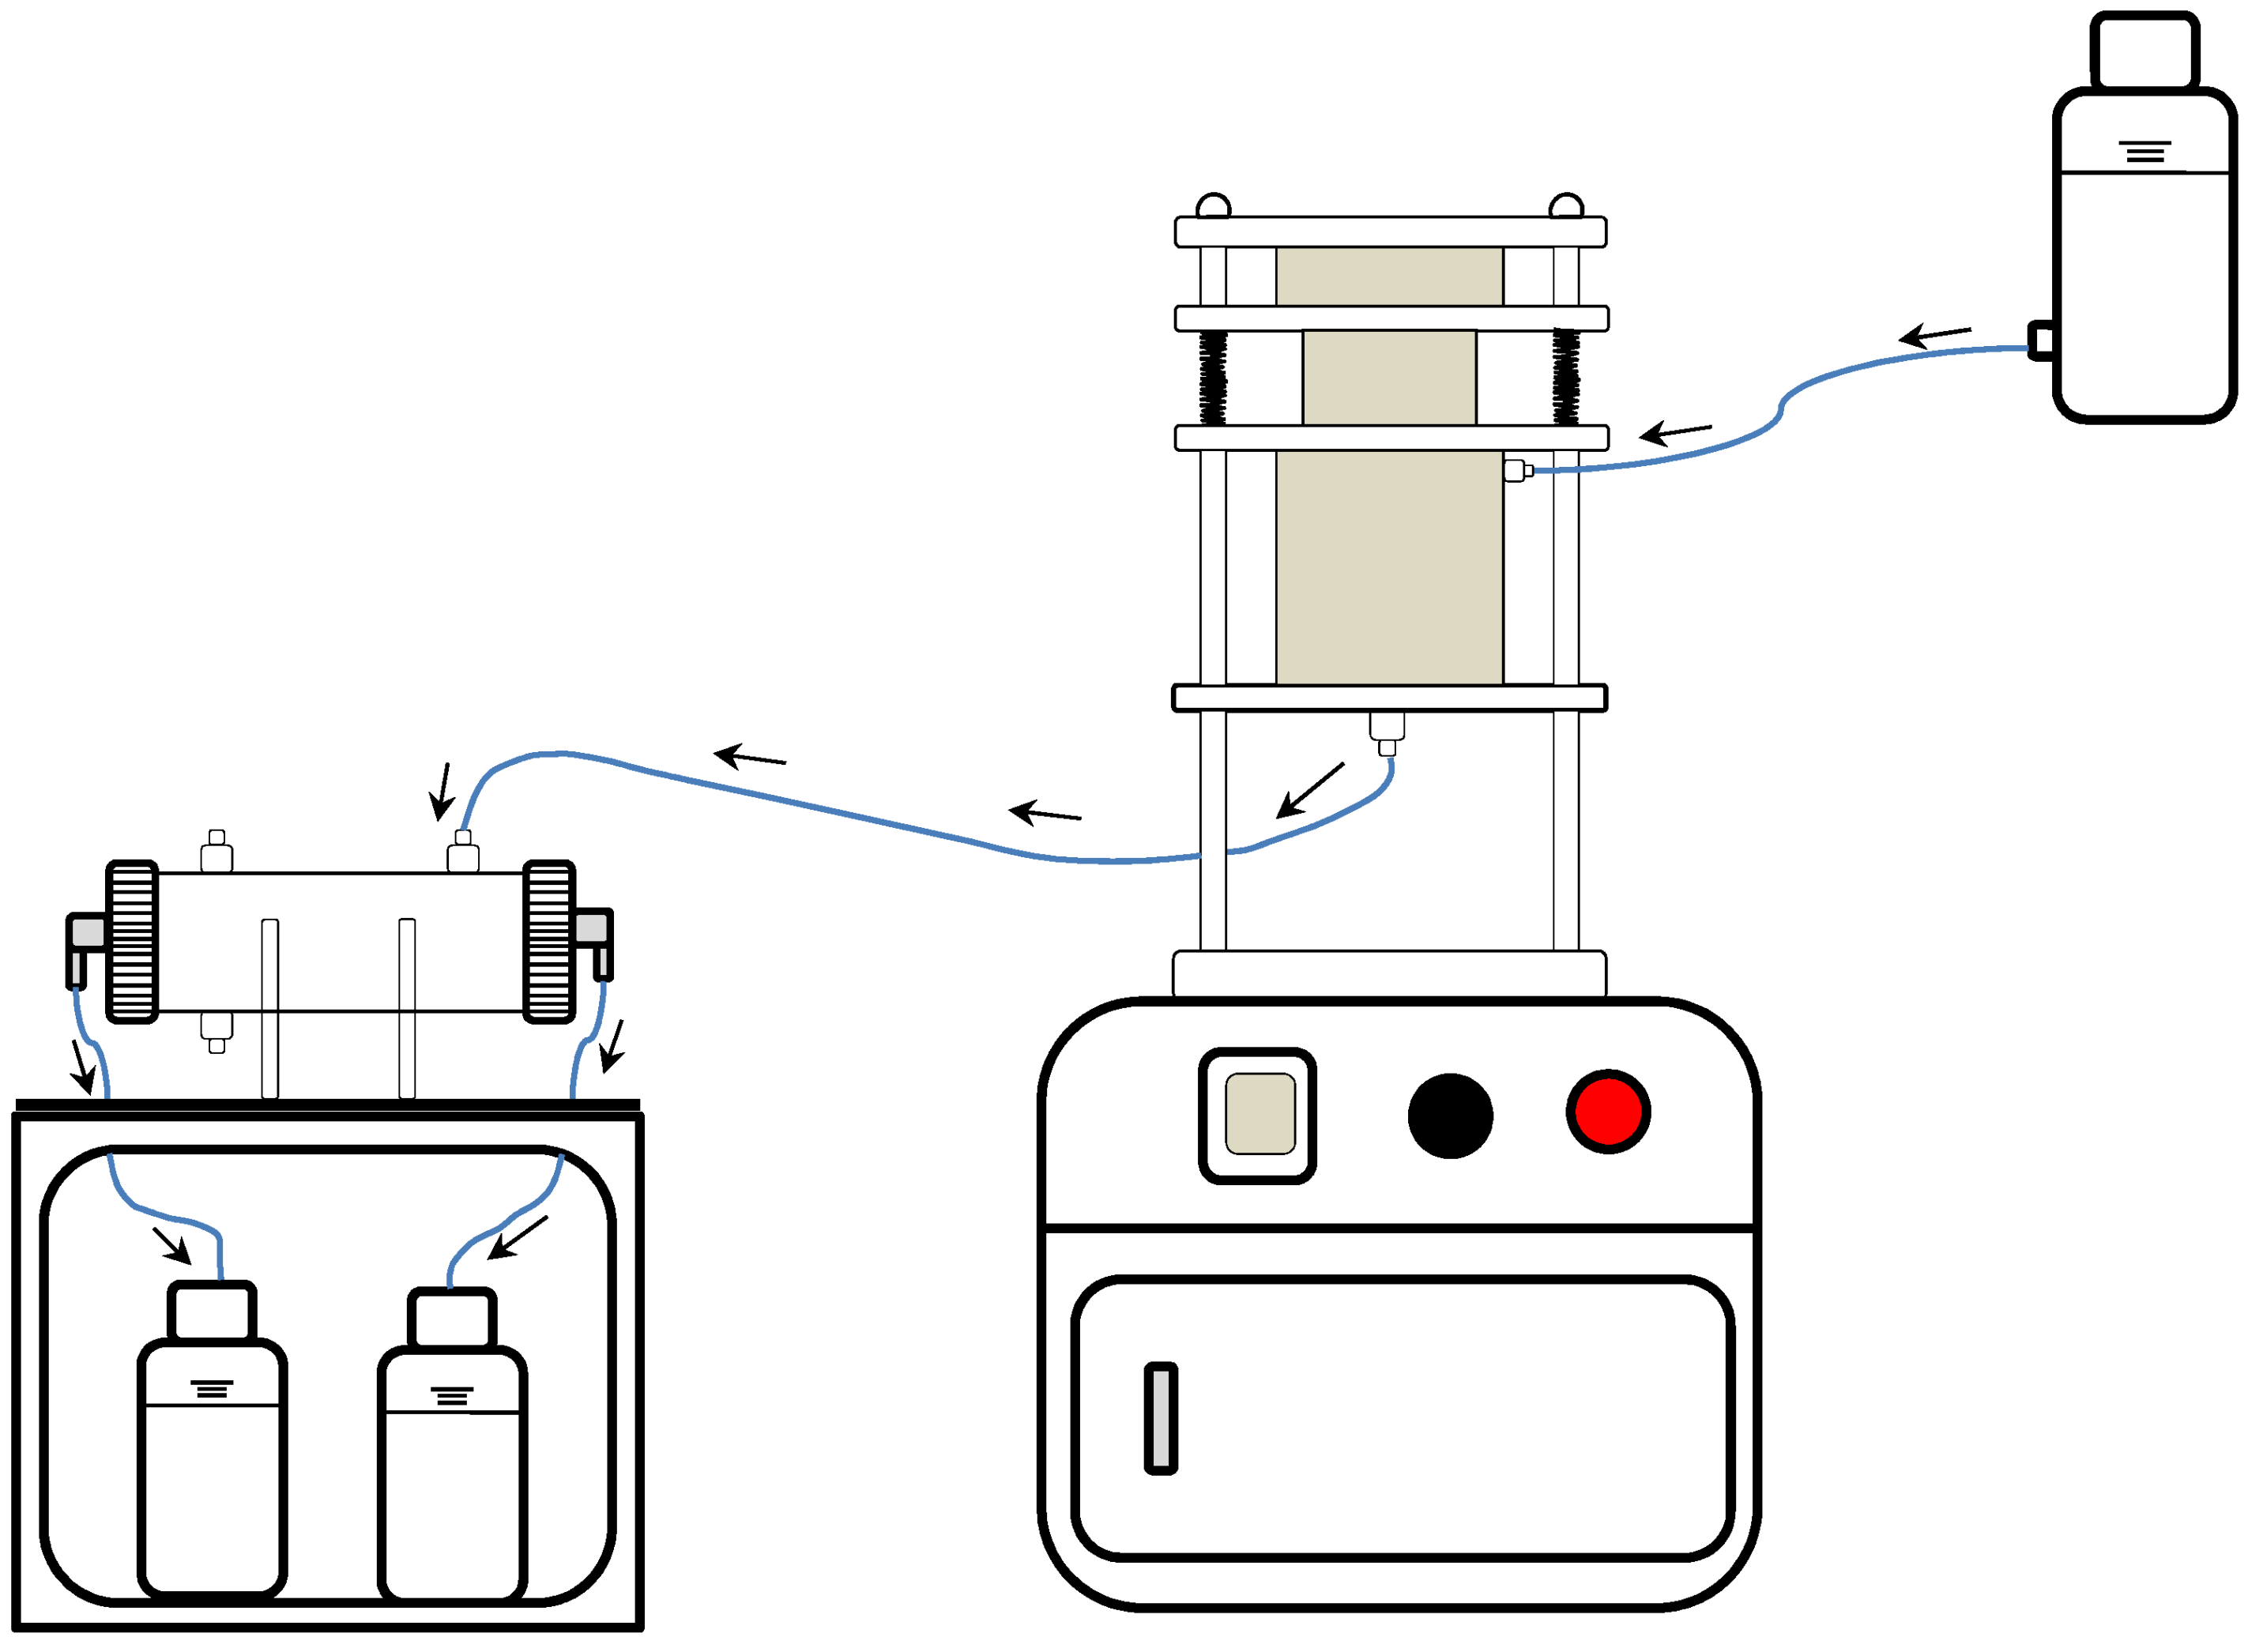
2.1. First-Generation AUD Apparatus

The first-generation AUD apparatus included the power system for automated hydraulic operation and the syringe device and the filtration and collection systems for collecting nanoparticles [30,31]. The power system provided a hydraulic power to the collection system to cause the cylinder to push down the plunger of the syringe device so that the sample suspensions were pushed into the filtration device for collecting nanoparticles. When the filtration work was completed, the cylinder was stopped and then moved back to a normal position for the next filtration cycle. Nanoparticles were collected on the filter membrane when filtration was completed. The maximum hydraulic power of the system was 87 kg cm−2. In order to provide a suitable power to membrane filters with the pore sizes of 450, 100, 50, 25, and 1 nm, the power values used were 1.9, 5.3, 6.5, 8.1, and 14.2 kg cm−2, respectively.
The filtration and collection system included eight syringe devices (35 mL × 8) (Terumo, Tokyo, Japan), filtering devices (25-mm filter discs × 8) (Pall, New York, NY, USA) and eight collecting bottles (50 mL × 8). Each of the syringe devices included a syringe barrel and a plunger assembly. The syringe device had a male luer inlet at a sample receiving end of the barrel to which the filtering device was attached. The filtering device included a cone-shaped lid, an O-ring, a membrane filter and a cylindrical holder assembly. The cone-shaped lid had a female luer inlet on its top connected to the syringe device for flow of the suspensions to the membrane filter where the nanoparticles were collected by hydraulic power. The filtrates were gathered in a collecting bottle.

2.2. Second-Generation AUD Apparatus

For collecting a large quantity of nanoparticles, the second-generation AUD apparatus was developed, which included sampling suspension bottle, container device, power system, filtering mixer device, and collecting bottle (Figure 1). A large Teflon container (diameter 12 cm, length 9 cm, volume 1018 mL) in central part of the third plate (Figure 1b). The teflon container included a plunger rod and a barrel assembly. The plunger rod had a sealing plug on its top connected to the barrel. The barrel had one male luer installed under its bottom to connect the stirring filtration device by a teflon pipe in order to allow the suspensions to flow to the membrane filters in its left and right sides, where the nanoparticles were collected into a collecting bottle.
The power system (Figure 1c) provided hydraulic power to the container device to cause the cylinder to push down the plunger of the container device so that the sample suspensions were pushed into the stirring filtration device for filtering nanoparticles. When the filtration work was completed, the cylinder was stopped and then moved back to a normal position for the next filtration cycle. Nanoparticles were collected in collecting bottle. Figure 2 indicates a schematic diagram of the second-generation AUD apparatus to show a flowing suspension of particles in the system.

3. Efficiency Collection of the AUD Apparatus

Separation and collection methods of nanoparticles are of paramount importance in research on their nature and physicochemical properties, for understanding their associated properties of adsorbing or binding to organic and trace metal contaminants, as well as in industrial applications (e.g., adsorbent and catalytic, reinforcing and waterproofing agents). However, how to collect nanoparticles with high efficiency and in large quantities in natural systems is a challenge in environmental sciences. Nanoparticles will aggregate and settle from solution very quickly by coagulation because of their surface reactivity at the nano-scale and their relatively large surface area. This characteristic presents great difficulty in collecting nanoparticles. For this reason, methods of collecting nanoparticles generally allow nanoparticles to well disperse in suspensions. In coagulation sedimentation-processes, large particles (i.e., >2 μm) are rapidly affected by gravitation, whereas nano-scale particles remain suspended in solution because of Brownian movement [32,33]. Therefore, equipment such as vacuum disc filters, centrifuges, or freeze-driers have been used to remove the liquid from suspensions to obtain particles with sizes ranging from nanometers to several micrometers for use in industries and academia [34].

3.1. Efficiency of the AUD Apparatus and Conventional Syringe Methods

Microfiltration membranes with pore sizes of 450, 300, 220, and 100 nm were commonly used in general laboratories. Ultrafiltration membranes with pore sizes of 50, 25 and 1 nm were also commercially available, and thus it was convenient to use these membranes to separate nanoparticles. The syringe method was adequate for separation of particles by using a microfiltration membrane with the pore size of 450 nm [30]. The filtration time required for the 450–2000 nm size fraction by the syringe method with the pore size of 450 nm was 4.7 s, whereas the filtration time required by the AUD was 11.3 s. This was attributed to the longer time required for automated hydraulic operation in the latter method. The filtration time increased with decreasing pore size of the membrane filter in both methods.
Figure 1. Photograph showing the second-generation automated ultrafiltration device (AUD) apparatus for separation of nanoparticles. The sampling suspensions were gathered in a bottle of 10 L (Figure 1a). One large Teflon container (diameter 12 cm, length 9 cm, volume 1018 mL) was set up in central part of the third plate (Figure 1b). The power system (Figure 1c) included a cylinder, flow and pressure valves, hydraulic valves, oil tank (volume 5 L), pump (output flow 1.5 cc rev1), and motor (output power 1/2 HP, 4 poles, 1720 rpm). The functions of button switches were: stop (Figure 1d), power (Figure 1e), human machine interface (Figure 1f), and collecting bottle (Figure 1g). The human machine interface included control functions of manual or automatic operation, counter, working timer, and stopping timer. In Figure 1h, stirring filtration device (diameter 5 cm, length 12 cm, volume 236 mL) included two filter holder in lift and right sides, stirring fan rod within device, and motor (output power 6 W, 175 rpm). Filtrates were gathering in collecting bottle (2000 mL × 2) (Figure 1g). The teflon container, in which suspensions from the suspension bottlewere installed, had one male luer installed under the barrel bottom to connect the stirring filtration device in order to allow the suspensions to flow to the membrane filters in its left and light sides, where the nanoparticles were collected into a collecting bottle.
Micromachines 04 00215 g001
Figure 2. Schematic diagram of the second-generation AUD apparatus to show a flowing suspension of particles in the system.
Micromachines 04 00215 g002
However, compared with the syringe method, much less filtration time was required for the 450–2000 nm size fraction by the AUD when the pore size of the membrane filter decreased from 450 nm to ≤50 nm. For the 100–450 and 25–100 nm size fractions, except for the membrane filter with the pore size of 450 nm, the AUD was always substantially better than the conventional syringe method. For the 1–25 nm size fraction, the time required to complete the ultrafiltration with the membrane pore size of 1 nm by the AUD was 2.8 h [30]. It was not feasible to use the conventional syringe method to conduct filtration using the 1 nm-pore size ultrafiltration membrane filter because an analyst cannot continue to maintain the pressure manually over the prolonged filtration period.
Generally, membrane clogging during filtration decreases the effective pore size and causes the retention of increasing quantities of particles [35,36]. However, using the AUD, particles smaller than the pore size of the membrane filter were forced to flow through the membrane filter under hydraulic pressure. This would alleviate the membrane clogging problem. Furthermore, except for the membrane filter with the pore size of 1 nm, the difference in the filtration time required for various particle-size fractions to pass through the membrane filter with the same pore size was virtually within the range of experimental error when the AUD was used. In contrast, when the conventional syringe method was used, the filtration time required to pass through the membrane filters with the pore sizes of 25, 50, and 100 nm increased substantially with the decrease of the size fraction by as much as 20 times [30]. This was attributed to the lack of hydraulic pressure in the conventional syringe method.

3.2. Collecting Large Quantities of Nanoparticles

For decreasing the filtration time required, the AUD apparatus would facilitate the collection of large quantities of environmental nanoparticles. The AUD had one large container (volume 1018 mL) in the filtration system for collecting large quantities of the filtrate [30]. By contrast, the conventional syringe method commonly used at present has only two types of syringe capacities (25 and 35 mL). Quantities of nanoparticles collected by the AUD developed can be about 30 to 40 times greater than those collected by the conventional syringe method. Furthermore, it is not practical to use the syringe method to handle such large quantities of suspension samples because of the limitations of human manual strength by using hand operation.

4. The AUD Apparatus in Applications of Different Scientific Field

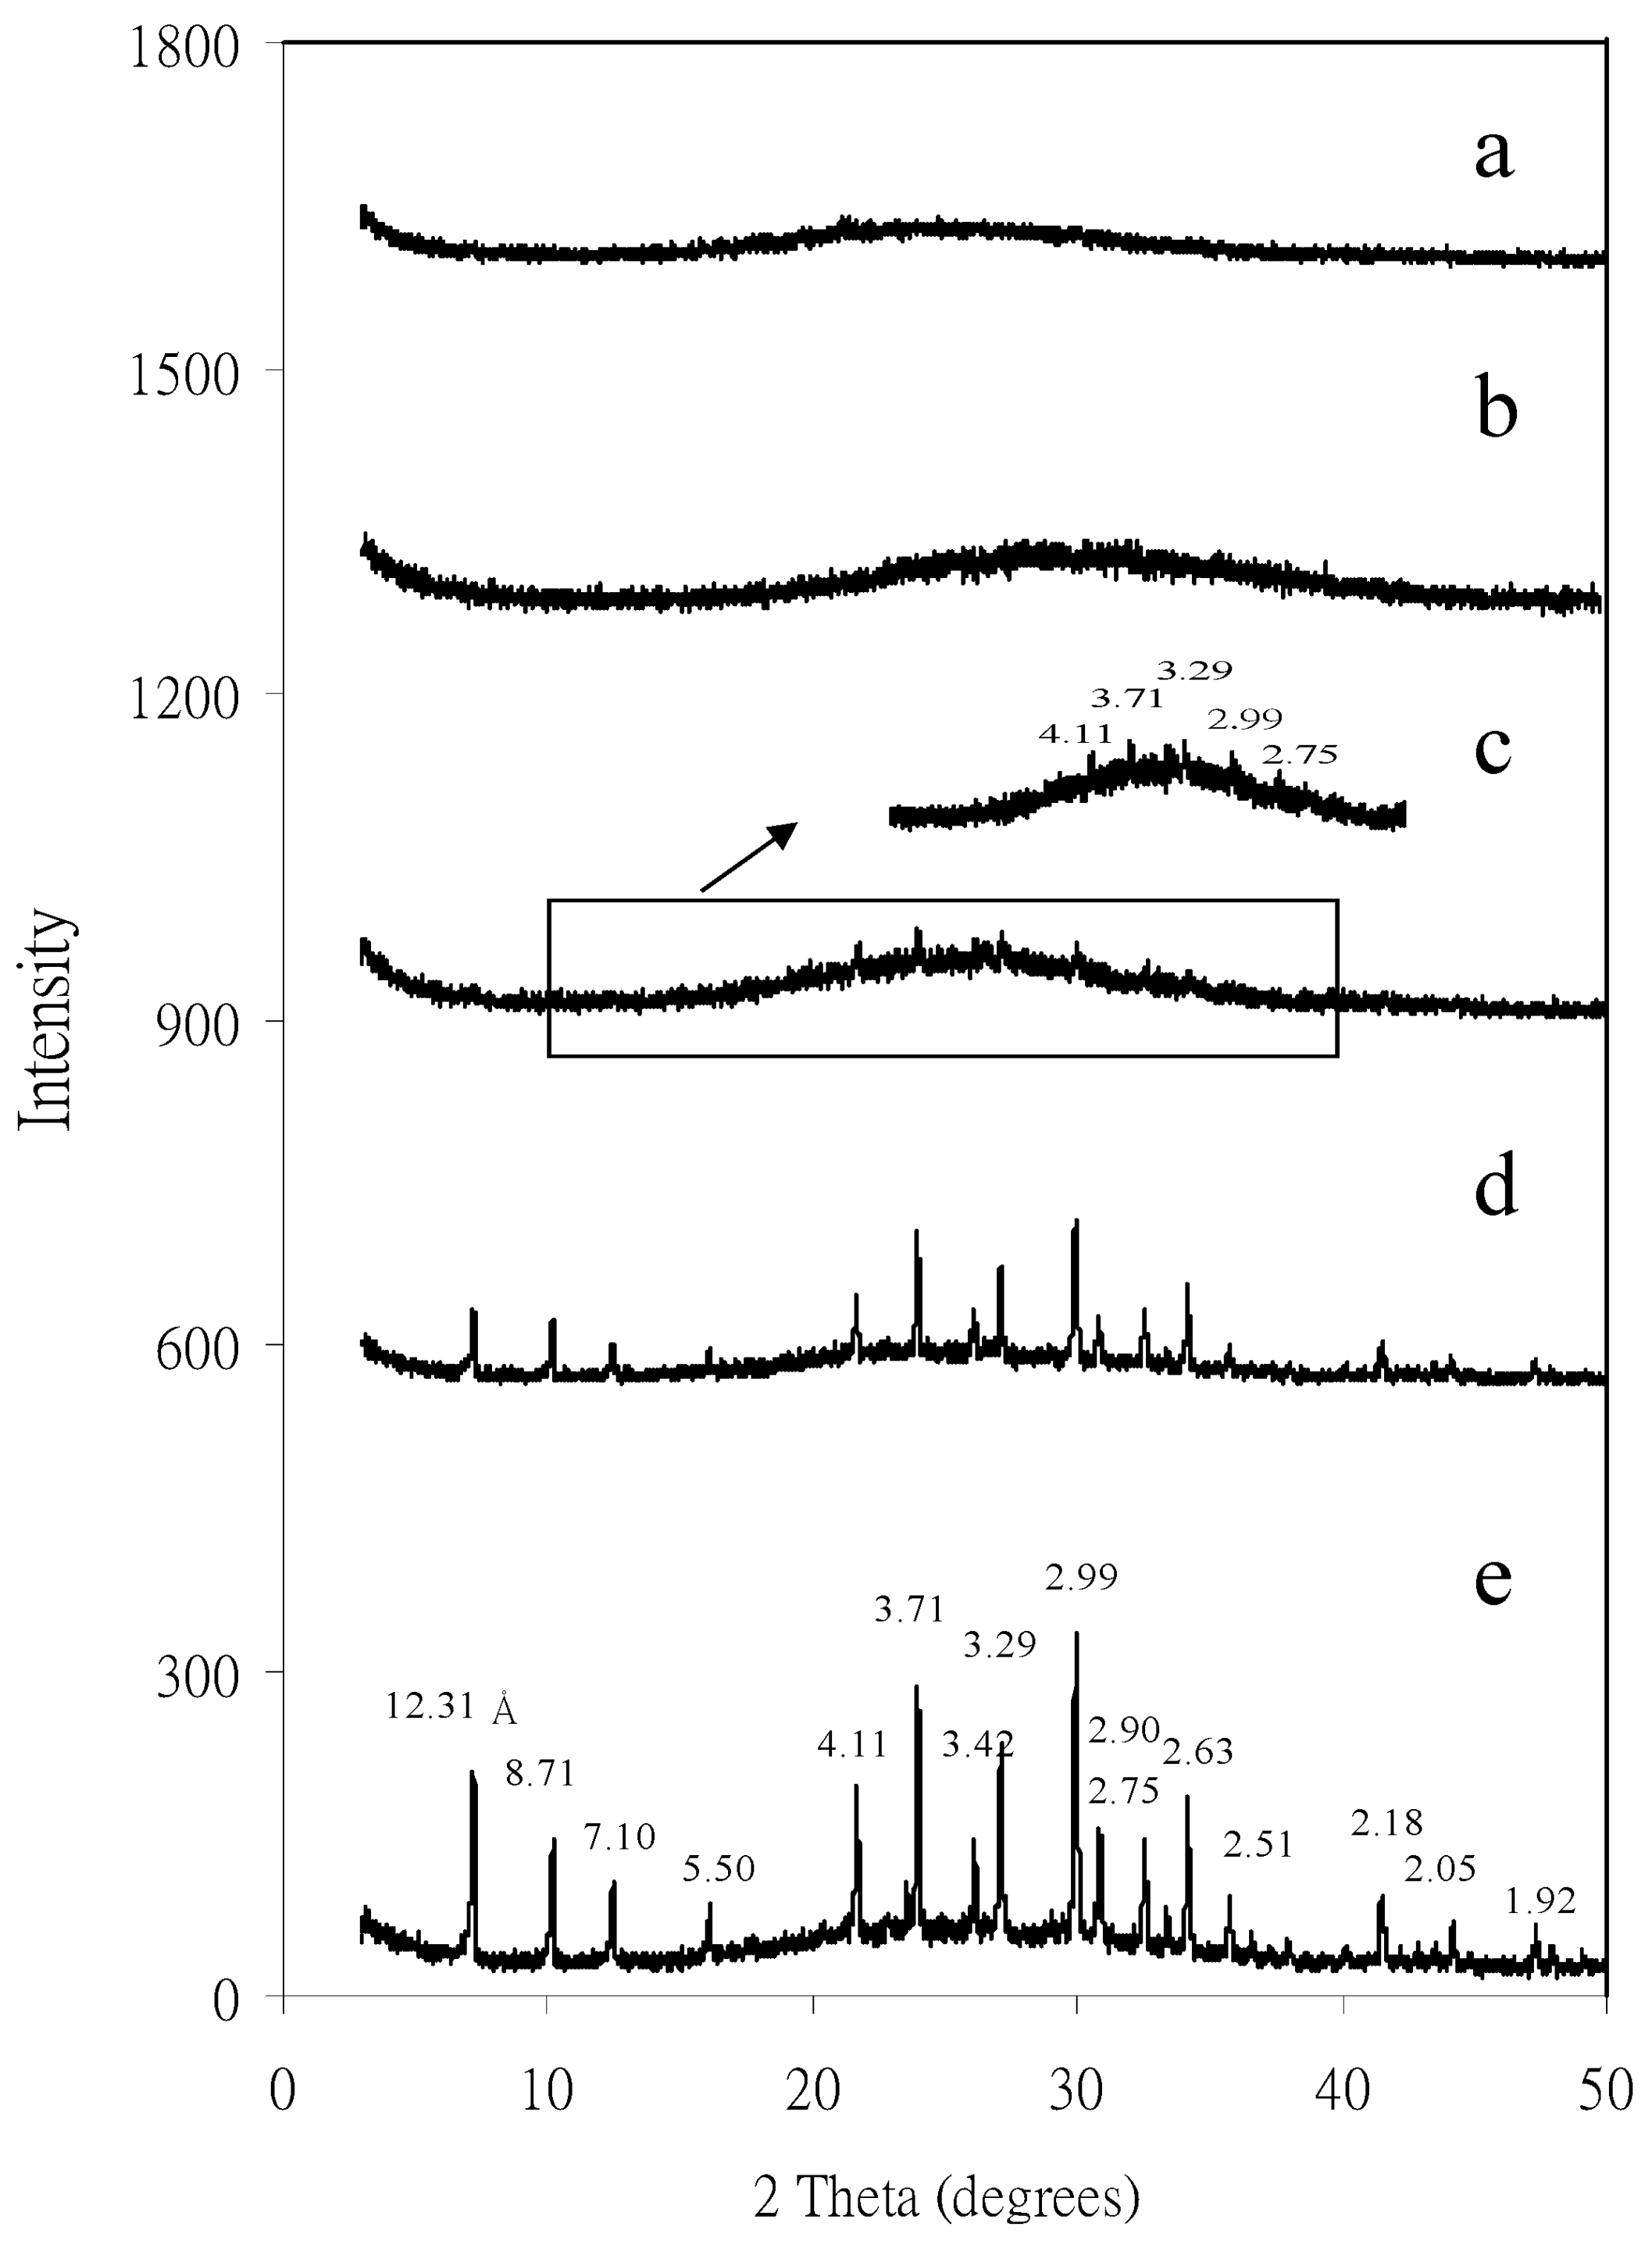
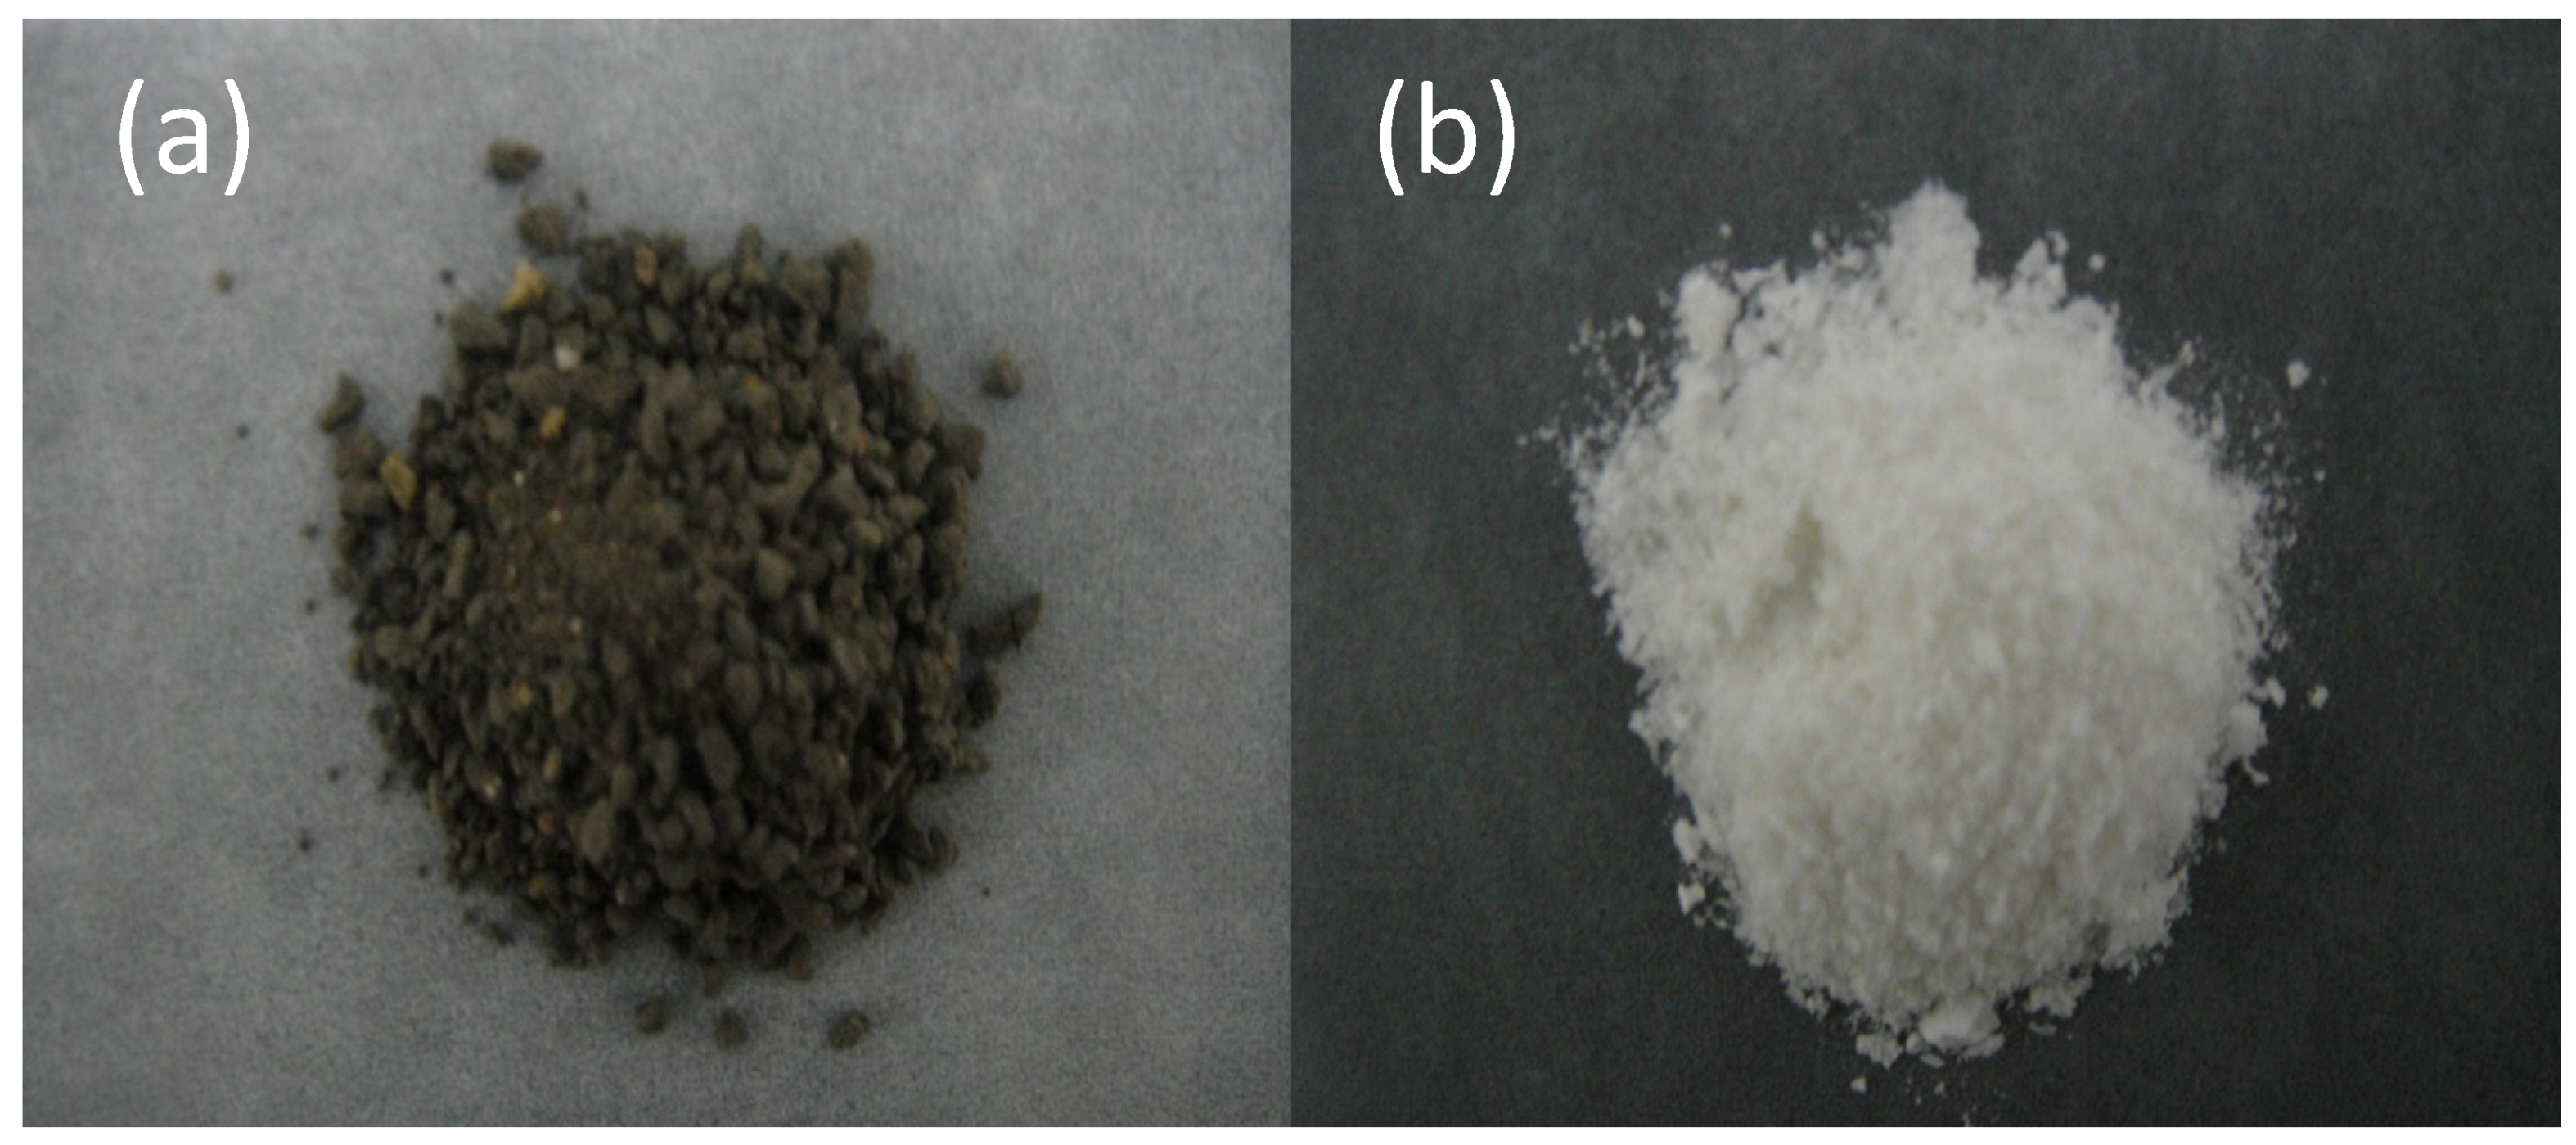
4.1. Separation and Physicochemical Properties of Zeolite Nanoparticles

Commercial type zeolite LTA (The International Zeolite Association Code Linde Type A), supplied by Mallinckrodt Baker Inc., Philipsburg, NJ, was used as the model nanoparticle sample for the fractionation of nanoparticles. The samples (≥100 mg) were suspended in DDW (500 mL), and dispersed by ultrasonification at 170 W and 60 kHz for 1 min by a NEY 300 ultrasonic instrument (NEY, Barkmeyer Division, Yucaipa, CA, USA). The suspension was then passed through a 300-mesh sieve (50 μm) to remove the sand fraction (50 μm–2 mm) from the suspension of dispersed mineral particles by wet sieving. Then, the silt (2000 nm–50 μm) and clay (<2000 nm) fractions were collected by sedimentation according to Stokes’ Law [37,38,39]. The time required for separating particle size fractions (PSFs) of 450–2000 and 100–450 nm was calculated by the modified Stokes’ equation [40,41]. In order to collect the size fraction of 450–2000 nm, the suspension (<2000 nm size fraction) was centrifuged at 980× g (3370 rpm) for 6 min at 4 °C using a Hitachi CR21 refrigerated centrifuge, which had a R12A3 rotor with polycarbonate tubes (250 mL × 6) and settling sample height of 10 cm within centrifuge tube. The settled particles were re-suspended in double distilled water (DDW) and sonicated at 170 W and 60 kHz for 1 min. The dispersed suspension was then repeatedly centrifuged and washed 7 times using the same centrifugation and dispersion methods to obtain the size fraction of 450–2000 nm. Following the above-mentioned centrifugation method, we collected 100–450 nm and <100 nm size fractions (6840× g, 9000 rpm for 15 min) in the sediments. The collected suspension (<100 nm size fraction) was filtered by the AUD, using the Sigma ultrafiltration disk membrane (NMWL: 1000 Da–equivalent to 1 nm in diameter) to collect the size fraction of 1–100 nm. Details concerning the separation and collection of various PSFs have been reported previously [30]. The Sigma ultrafiltration disk membrane can be used to collect the 1–100 nm size fraction by the AUD apparatus, if necessary, changing ultrafiltration membranes (e.g., pore size of 25 nm) to collect the 1–25 and 25–100 nm size fractions.
Based on elemental dispersive spectroscopic (EDS) analysis, the chemical formula and Si to Al molar ratio of zeolite A raw sample were K8Na1.4 (Al9.4Si14.6O48) and 1.6, respectively. Its crystal system and diagnostic d(100) value are cubic and 12.31 Å, respectively [42]. The Si to Al molar ratios of various PSFs were 1.8, 2.1, 2.7, 4.3, respectively, indicating that increasing Si to Al molar ratios with decreasing particle size (Table 1). The XRD patterns of the bulk sample and size fraction of 450–2000 nm match the data reported in the literature [42]. There were only 4.11 (221 of hkl), 3.71 (311), 3.29 (321), 2.99 (410) and 2.75 (420) Å of XRD reflection peaks presented in the size fraction of 100–450 nm, indicating that the repetitions of unit cells were apparently low because of preferential structural disruption of other crystal planes caused by pressure-induced phase transition in the fine size fractions. However, size fractions of 1–100 nm (i.e., less than 81 repetitions of unit cells) was noncrystalline to XRD due to low repetitions of unit cells. With decreasing in particle size, nanoparticles of 1–100 nm was XRD noncrystalline to conventional XRD analysis, indicating its structural transformation from well crystalline to short-range-ordered (SRO) particles (Figure 3) [12].
Table 1. Selected physicochemical properties of the 1–25, 25–100, 100–450, and 450–2000 nm size fractions and the bulk sample (<2000 nm) prior to the particle-size fractionation [12].
Size (nm)Atom per unit cell Si/AlSurface area
KNaAlSiOratio(m2 g−1)
1–253.70.23.920.1485.2514
25–1004.20.34.519.5484.3120
100–4506.20.36.517.5482.775
450–20007.40.47.816.2482.146
<20007.51.08.515.5481.824
Structural formula for unit cell: [(Mx+, My2+)(Al(x+2y)Sin-(x+2y)O2n)·mH2O].
Figure 3. X-ray diffractograms of the (a) 1–25, (b) 25–100, (c) 100–450, (d) 450–2000 nm size fractions, and (e) bulk sample (<2000 nm) prior to particle-size fractionation. With decrease in particle size, nanoparticles of 25–100 and 1–25 nm are XRD noncrystalline, indicating its structural transformation from well crystalline to short-range-ordered (SRO) particles [12].
Micromachines 04 00215 g003
Tsao et al. (2009) [30] reported that particles of irregular shapes were present in size fractions of 450–2000 and 100–450 nm from TEM images. In contrast, the particles in size fraction of 1–100 nm were virtually spherical. The physicochemical properties of zeolite A are related to their chemical compositions and various PSFs. The increase in Si to Al molar ratio with decreasing particle size is attributed to the loss of the double four-ring (D4-R) units as the external linkage to each sodalite by FT-IR and NMR analyses [12].

4.2. Mineral Nanoparticles in Red Soils

Red soils are the most common soil types in the subtropical and tropical regions of the world that are low in fertility [43,44,45,46,47,48]. Composed mainly of kaolinite, Al- and Fe-oxides, quartz, and organic matter, red soils occur in soil moisture regimes ranging from aridic to perudic and aquic. In northwestern Taiwan, red soils, known as laterites, occur extensively in the Taoyuan area and have been used for brick making. The lateritic terrace deposits are widely distributed in the rolling hills as well as coastal and river terraces of northwestern Taiwan [49].
Red soil minerals contain mainly phyllosilicate and sesquioxide minerals, which strongly influence both the chemical and physical properties of soils because of their generally fine particle sizes, high surface areas, and unique cation exchange properties. A clear understanding of the phyllosilicate and sesquioxide minerals is central to understanding clay mineralogy and many paleo-environmental processes. Red soil samples were separated and collected to various particle-size fractions (<2000, 450–2000, 100–450 and 1–100 nm) for experimental investigation. Illite nanoparticles were identified in the red soils from XRD analysis and TEM observations (Figure 4). Feldspar were decomposed and transferred into illite through the diagenetic process, thus forming authigenic lath-shaped illite particles [50]. Goethite and hematite are present as X-ray noncrystalline minerals, which are finer than 100 nm, thus we cannot obtain intense peak by conventional powder XRD analysis. From synchrotron random powder XRD analysis, the quartz, illite, and kaolinite were identified in the <2000 nm and 450–2000 nm size fractions. The XRD patterns in the 100–450 and 1–100 nm size fractions were similar, thus, 1–100 nm size fractions employed to synchrotron XRD analysis to illustrate the high resolution XRD patterns [50]. The illite, kaolinite, goethite, and hematite nanoparticles were particularly identified in the 1–100 nm size fraction by synchrotron high-resolution XRD patterns. It is worth noting that synchrotron XRD patterns provided unequivocal evidence of goethite and hematite existence in the 1–100 nm size fraction, which was different to the XRD patterns analyzed by conventional and synchrotron XRD analyses [50].
Figure 4. TEM images of the (a) kaolinite nanoparticles aggregated hematite nanoparticles overlapping the edge of a kaolinite flake and (b) illite nanoparticles with aggregated hematite nanoparticles. I: illite; K: kaolinite; G: goethite; H: hematite [50].
Micromachines 04 00215 g004
From TEM observations, well-crystalline kaolinite in nanoparticle was present in the red soils. Morphology of kaolinite nanoparticles was expressed to overlap flakes, showing hexagonal shape and well-defined angles, and a particle size of less than 50 nm by TEM observation [50]. Hematite nanoparticles were also found on kaolinite flakes, and the TEM images are actually aggregates of many fine-grained particles, with aggregated hematite nanoparticles overlapping the edge of a kaolinite flake in size range of 4 to 7 nm. Thus, TEM images confirmed the existence of kaolinite, goethite, and hematite nanoparticles in the TY-I pedon.
Illite, kaolinite, gibbsite, quartz, goethite, and hematite were identified in clay fractions and nanoparticles of highly weathering red soils by conventional and synchrotron XRD analyses. Fe-oxides (goethite and hematite nanoparticles) were present as surface coating of kaolinite nanoparticles. TEM images showed the presence of hematite nanoparticles on the surface coating of kaolinite nanoparticles and aggregated hematite nanoparticles overlapping the edge of a kaolinite flake.
In general, the presence of Fe-oxides, which can bear a positive charge at acidic soil environments, results in attractive interactions of the colloids with negatively charged clay minerals [51,52]. This could have several important implications. For example, Fe-oxide coatings play an important role in colloid transport; that is, the mobility of these colloids, and associated pollutants can be strongly influenced by their Fe content in the environmental polluted soils [51,52].

4.3. Smectite Nanoparticles in Black Soil

Environmental soil nano-clays were found in the pedosphere and their biogeochemical and ecological impacts are some of the fastest growing areas of research today, especially pollutants adsorption reaction. However, how to separate and collect a single species nano-clay with high efficiency and in large quantities in soils is a challenge. In this section, the black soil rich in nano-smectite clay was used as a model soil in the separation and collection experiments to compare the pollutants adsorption reaction. The black soil was obtained from the Taitung Prefecture of eastern Taiwan (Shi-yu-san, SYS) and the low elevation of sample sites were between latitudes 23°02'20"N to 23°51'47"N and longitudes 121°11'27"E to 121°32'52"E [53]. The SYS black soil has a high clay content and characteristic features that allow them to be classified as a fine, montmorillonitic, hyperthermic, or Vertic Endoaquoll [54,55,56].
Black soil samples were separated and collected to various particle-size fractions (<2000, 450–2000, 100–450 and 1–100 nm) for experimental investigation (Figure 5). The low-cost readily available soil nano-clays (particle size < 100 nm) were collected by the AUD apparatus. The specific surface areas of smectite nano-clays (<100 nm) were 87.3 m2 g−1 by N2 adsorption/desorption isotherm. It can be clearly observed that the soil nano-clays (<100 nm) have shown an X-ray poor crystalline structure of smectite materials (d = 1.25 nm). The soil smectite was also characterized by XRD analysis with a saturation of Mg and glycerol solvation, showing the expansion of 1.70 nm reflection peak in XRD analysis [53].
Figure 5. Photograph showing the (a) bulk sample (<2000 nm) prior to particle-size fractionations, (b) smectite nanoparticles with 1–100 nm size fraction.
Micromachines 04 00215 g005
The removal of CV and MB dyes from the aqueous solution was investigated using soil nano-clays. It was experimentally concluded that soil nano-clays could be used as low-cost and relatively effective adsorbents for the removal of CV and MB basic dyes from wastewater. Soil nano-clays have greater adsorption amount compared with untreated soil clay minerals (<2000 nm) because of the increased surface are and greater pore volume. The maximum CV and MB adsorption amount of soil nano-clays were about two to three times higher than those of soil clays (<2000 nm). The sorption of dyes by the clays was affected by the contact time, adsorbent dose, pH, ionic strength, the initial concentration, and the temperature. The adsorption kinetics data could be well described with the pseudo-second-order kinetics model. By contrast, the Langmuir model was found to provide a good prediction for the adsorption of CV and MB dyes, indicating favorable for the removal of CV and MB on the clays. The adsorption processes for CV and MB dyes on either soil clays (<2000 nm) or soil nano-clays (<100 nm) were endothermic and spontaneous in nature. Thus, soil nano-clays can be recommended as a friendly sorbent for CV and MB removal.
The AUD (nano-technology) apparatus can be used to efficiently collect large quantities of soil and related environmental nanoparticles to investigate the nanoscale, structural characteristics, and surface properties of these particles. The soil nano-clays adsorb both CV and MB dyes efficiently and could be employed as a low-cost alternative to remove cationic dyes in wastewater treatment.

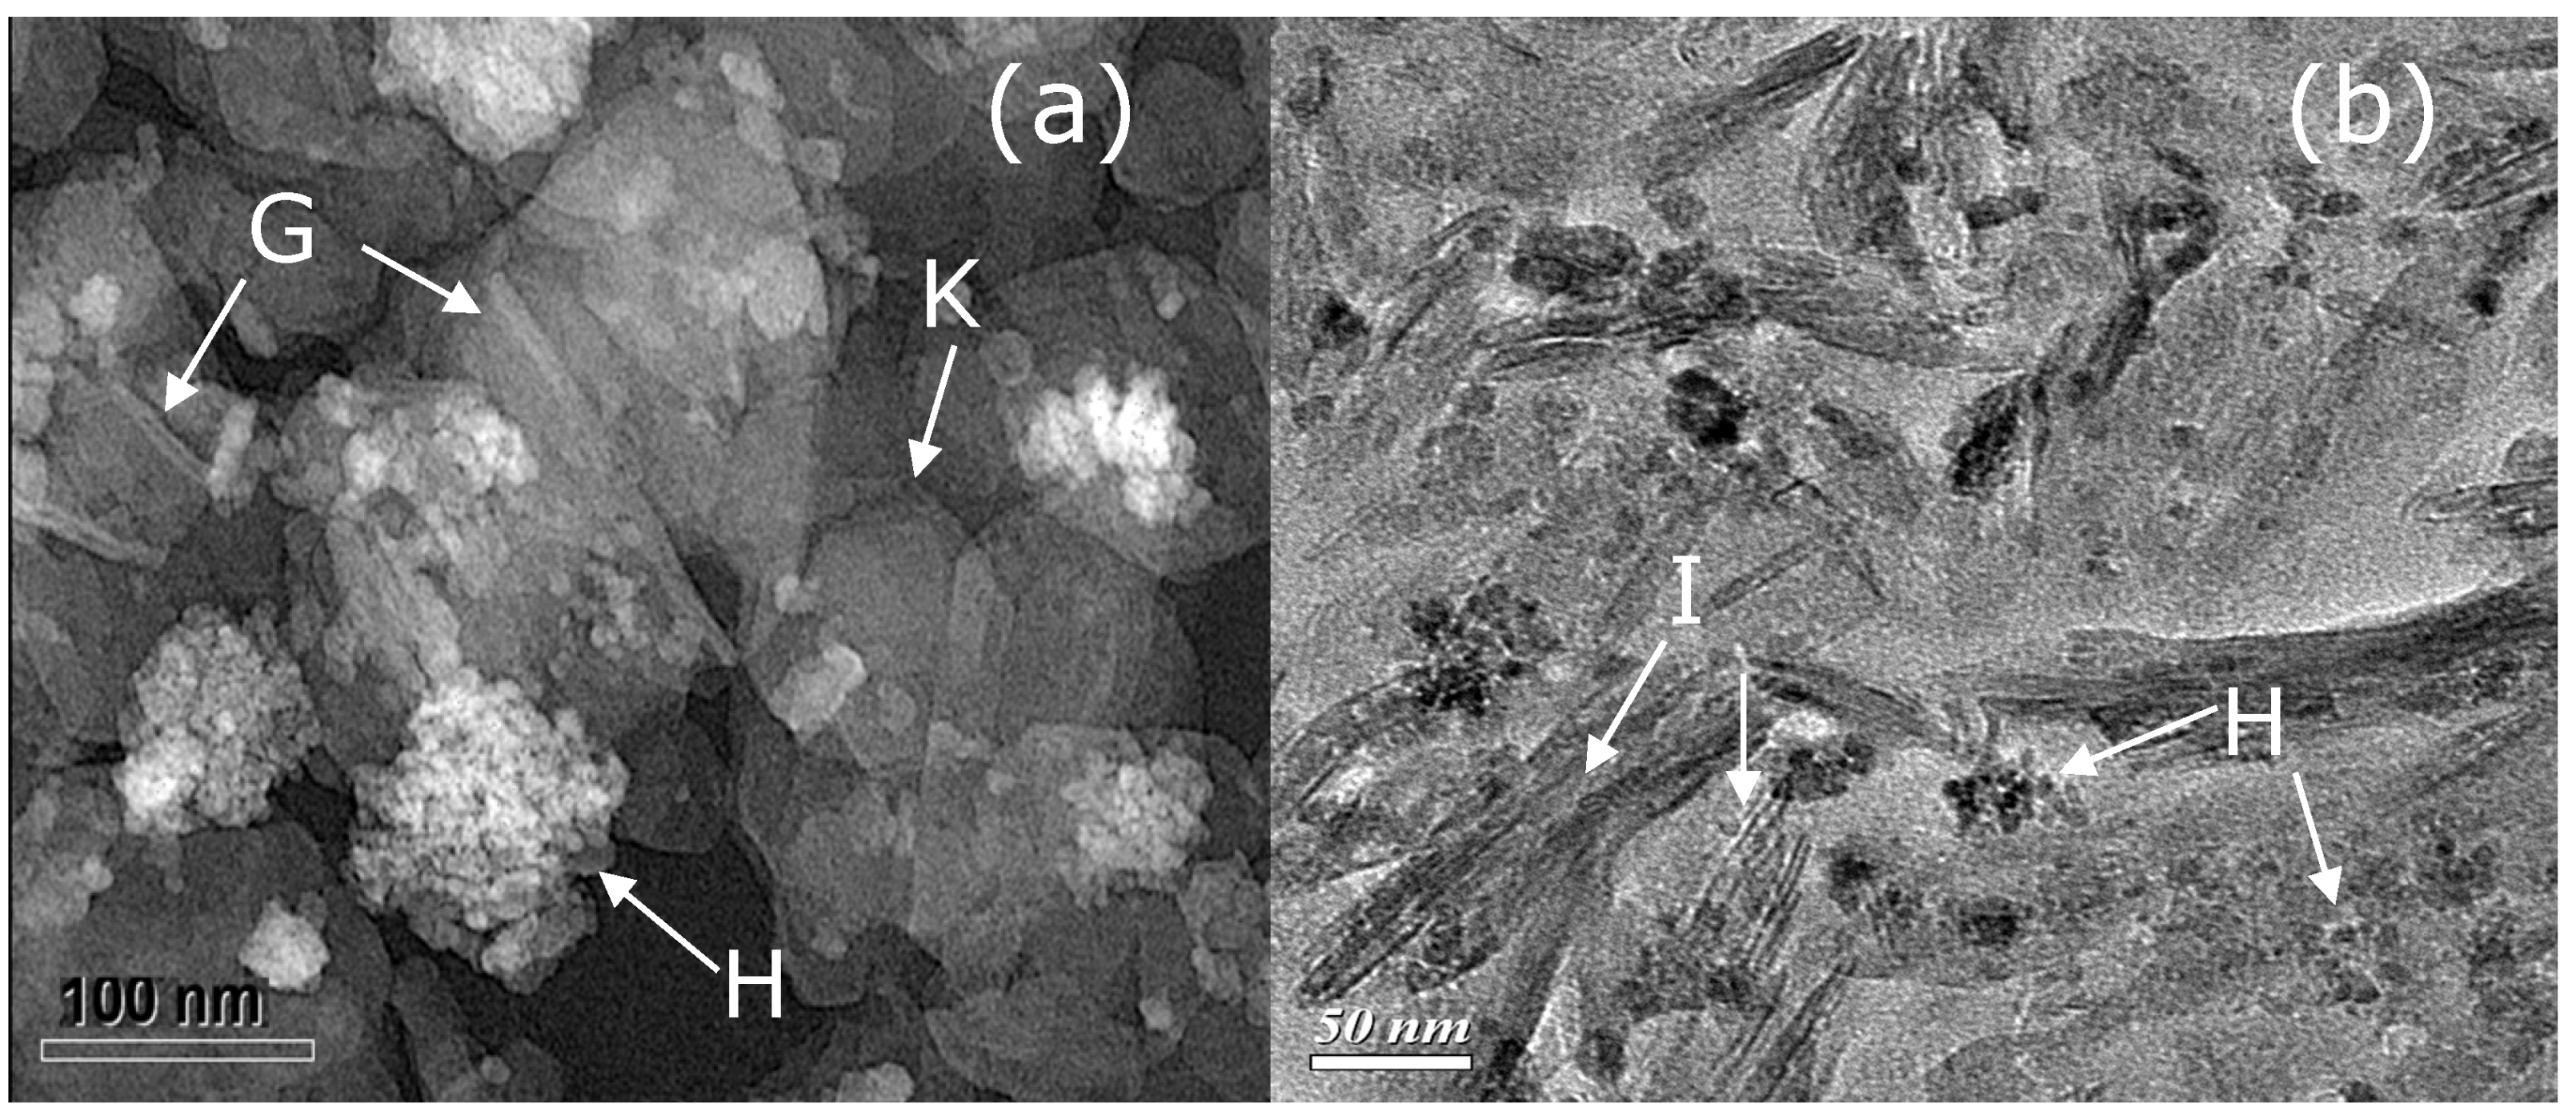
4.4. Quartz Nanoparticles in the Gouge of Fault of Chi-Chi Earthquake

The Chi-Chi earthquake (Mw 7.6) took place in the central Taiwan on 21 September 1999. The hypocenter was near Chi-Chi town (120.81°E, 23.86°N, depth ~10 km) [57]. The surface rupture was along the Chelungpu fault zone at about 85 km in length with large surface deformation [57,58,59]. The surface deformation provided us a good opportunity to sample outcrop fault gouge of recent earthquake. The gouge sample was caught from the Chelungpu fault branch of the 1999 Chi-Chi earthquake surface rapture passes though Wu-Feng down town in center Taiwan. The hanging wall raised a height about 2.5 m in the campus of Kuang-Fu Junior High School during the Chi-Chi earthquake. The sample was investigated from the outcrop of Chi-Chi fault gouge, which locates at riverbed behind campus.
For studying the physical and chemical process of earthquake, fault gouge sample is a key point to investigate the faulting mechanism. The energy releases of fault zone during an earthquake are still unknown clearly. In the past, numerous studies reported that analysis of particle size distribution within ultrafine gouge and calculation of total grain surface area by using microscope for estimation the fracture energy associated with gouge formation [60,61,62].
The grain size of ultrafine fractions within fault gouge could approach the nanometer scale during a fault slipping [61]. Chester et al. (2005) [62] observed the finest particle size is 1.6 nm within Punchbowl fault gouge as the lower cut-off for estimation of fracture energy. Ma et al. (2006) [63] observed the fault gouge of Taiwan Chelungpu-fault Drilling Project (TCDP) at depth about 1 km. They used grain sizes larger than 50 nm as lower cut-off for estimation of fracture energy. In order to investigate the smallest grain sizes formed by fracture within ultrafine gouge, analysis of the finest mineral composition and grain size distribution are requisites. The gouge samples in the 1999 Chi-Chi earthquake surface rupture were used to separate different particle size range from 50 μm to 1 nm by the centrifuge and AUD apparatus.
According to the synchrotron XRD analysis and transmission electron microscope observation, the major minerals of gouge were quartz, plagioclase, smectite, illite, chlorite, and kaolinite. The mineral composition of <100 nm particles were quartz, smectite, and illite. However, there were only semectite and illite without quartz in the size fractions of 1–25 nm. Quartz is most important target minerals associated with coseismic fracture, the minimum grain size about 25 nm [63,64]. Gibbs (1967) [65] reported that the minimum grain size of quartz was ~1 μm within the suspended solids at the mouth of Amazon River. Some experiences showed that quartz could be grinding to 30–50 nm in a stirred-media mill. Grain size reduction in the fault zone is caused of cracked grains result from original fragmentation by rupturing [66,67,68]. Quartz grain of <50 nm was in the gouge of fault from both results of XRD analysis and TEM observation. Separated quartz could be the index mineral associated with earthquake fracture and the finest grain size was about 25 nm.

5. Implications

Quantities of nanoparticles collected by the AUD apparatus developed can be greater than those collected by the conventional syringe method. Furthermore, it is not practical to use the syringe method to handle such large quantities of suspension samples because of the limitations of human manual strength by using hand operation. The AUD apparatus developed in the present review can be employed for efficient collection of large quantities of nanoparticles from several scientific fields such as soil science (e.g., black soils, red soils), geoscience (e.g., gouge of earthquake fault), material science (e.g., zeolite), clay science (e.g., illite, kaolinite, hematite, goethite, smectite), surface science (e.g., specific surface area), and environmental science (e.g., physicochemical property). In particular application to environmental science, the AUD apparatus would facilitate the investigation of the formation, transformation, nature and physicochemical properties of environmental nanoparticles, the kinetics and mechanisms of their interactions with metals, metalloids, and anthropogenic organic compounds and their biogeochemical and ecological impacts. The AUD apparatus would be a vital tool to further advance the knowledge on basic and applied sciences at the molecular level.

6. Conclusions

The AUD apparatus developed was based on a hydraulic ram with automatic operation to collect nanoparticles (1–100 nm) for scientific research in basic and applied sciences. The AUD apparatus was used to demonstrate efficient collection and separation of nanoparticles in highly weathering red and black soils, and gouge of earthquake fault, as well as zeolite. This apparatus would also be useful to a wide range of related sciences such as colloidal and interfacial sciences, biochemistry biotechnology, and material and health sciences. The AUD apparatus would, thus, substantially facilitate scientific research in nanotechnology and nanosciences. This would lead to further advancement of knowledge in this important and challenging area of science today and for the years to come.

Acknowledgements

This study was financially supported by the experimental forest, National Taiwan University under grant no. A14 project. We also express our deepest gratitude to the past P.M. Huang for valuable advice from Department of Soil Science, University of Saskatchewan, Canada.

References

  1. Zielinski, P.A.; van Neste, A.; Akolekar, D.B.; Kaliaguine, S. Effect of high-energy ball milling on the structural stability, surface and catalytic properties of small-, medium- and large-pore zeolites. Microporous Mater. 1995, 5, 123–133. [Google Scholar] [CrossRef]
  2. Kiang, C.H.; Goddard, W.A.; Salem, R.J.R.; Bethune, D.S. Catalytic effects of heavy metals on the growth of carbon nanotubes and nanoparticles. J. Phys. Chem. Solids 1996, 57, 35–39. [Google Scholar] [CrossRef]
  3. Kaskel, S.; Chapais, G.; Schlichte, K. Synthesis, characterization, and catalytic properties of high-surface-area aluminum silicon nitride based materials. Chem. Mater. 2005, 17, 181–185. [Google Scholar] [CrossRef]
  4. Ponce, A.A.; Klabunde, K.J. Chemical and catalytic activity of copper nanoparticles prepared via metal vapor synthesis. J. Mol. Catal. A 2005, 225, 1–6. [Google Scholar] [CrossRef]
  5. Shawkataly, O.B.; Jothiramalingam, R.; Adam, F.; Radhika, T.; Tsao, T.M.; Wang, M.K. Ru-nanoparticle deposition on naturally available clay and rice husk biomass materials—Benzene hydrogenation catalysis and synthetic strategies for green catalyst development. Catal. Sci. Technol. 2012, 2, 538–546. [Google Scholar] [CrossRef]
  6. Hu, J.; Chen, G.; Lo, I.M.C. Removal and recovery of Cr (VI) from wastewater by naghemite nanoparticles. Water Res. 2005, 39, 4528–4536. [Google Scholar] [CrossRef]
  7. Göppert, T.M.; Müller, R.H. Adsorption kinetics of plasma plasma proteins on solid lipid nanoparticles for drug targeting. Int. J. Pharm. 2005, 302, 172–186. [Google Scholar] [CrossRef]
  8. Schumacher, B.; Denkwitz, Y.; Plzak, V.; Kinne, M.; Behm, R.J. Kinetics, mechanism, and the influence of H2 on the oxidation reaction on an Au/TiO2 catalyst. J. Catal. 2004, 224, 449–462. [Google Scholar] [CrossRef]
  9. Levdansky, V.V.; Smolik, J.; Moravec, P. Influence of size effect and foreign gases on formation of nanoparticles. Int. Commun. Heat Mass Transf. 2006, 33, 56–60. [Google Scholar] [CrossRef]
  10. Mayo, J.T.; Yavuz, C.; Yean, S.; Cong, L.; Shipley, H.; Yu, W.; Falkner, J.; Kan, A.; Tomson, M.; Colvin, V.L. The effect of nanocrystalline magnetite size on arsenic removal. Sci. Technol. Adv. Mater. 2007, 8, 71–75. [Google Scholar] [CrossRef]
  11. Hochella, M.F., Jr.; Lower, S.K.; Mauice, P.A.; Penn, R.L.; Sahai, N.; Sparks, D.L.; Twining, B.S. Nanominerals, mineral nanoparticles, and earth systems. Science 2008, 319, 1631–1635. [Google Scholar] [CrossRef]
  12. Tsao, T.M.; Wang, M.K.; Huang, P.M. Structural transformation and physicochemical properties of environmental nanoparticles by comparison of various particle-size fractions. Soil Sci. Soc. Am. J. 2011, 75, 533–541. [Google Scholar] [CrossRef]
  13. Gregg, S.J.; Sing, K.S.W. Adsorption, Specific Surface Area and Porosity; Academic Press: New York, NY, USA, 1982. [Google Scholar]
  14. Webb, P.A.; Orr, C. Analytical Methods in Fine Particle Technology; Micromeritics Instrument Corp: Norcross, GA, USA, 1997. [Google Scholar]
  15. George, S.; Steinberg, S.M.; Hodge, V. The concentration, apparent molecular weight and chemical reactivity of silica from groundwater in southern Nevada. Chemosphere 2000, 40, 57–63. [Google Scholar] [CrossRef]
  16. Hassellöv, M.; Buesseler, K.O.; Pike, S.M.; Dai, M. Application of cross-flow ultrafi ltration for the determination of colloidal abundances in suboxic ferrous-rich ground waters. Sci. Total Environ. 2007, 372, 636–644. [Google Scholar] [CrossRef]
  17. Reid, P.M.; Wilkinson, A.E.; Tipping, E.; Jones, M.N. Determination of molecular weights of humic substances by analytical (UV scanning) ultracentrifugation. Geochim. Cosmochim. Acta 1990, 54, 131–138. [Google Scholar] [CrossRef]
  18. McFadyen, P.; Fairhurst, D. High-resolution particle size analysis from nanometers to microns. Clay Miner. 1993, 28, 531–537. [Google Scholar]
  19. Crespo, J.G.; Boddeker, K.W. Membrane Processes in Separation and Purification; Kulwer Academic Publishers: Dordrecht, The Netherlands, 1994. [Google Scholar]
  20. Grzenia, D.L.; Carlson, J.O.; Czermak, P.; Han, B.; Specht, R.K.; Wickramasinghe, S.R. Purification of densonucleosis virus by tangential flow ultrafiltration. Biotechnol. Prog. 2006, 22, 1346–1353. [Google Scholar]
  21. Sikdar, S.K.; Grosse, D.; Rogut, I. Membrane technologies for remediating contaminated soils: A critical review. J. Membr. Sci. 1998, 151, 75–85. [Google Scholar] [CrossRef]
  22. Scott, K. Handbook of Industrial Membranes; Elsevier Advanced Technology Press: Oxford, UK, 1995. [Google Scholar]
  23. Chceryan, M. Ultrafiltration and Microfiltration Handbook, 2nd ed; Technomic Publishing Co.: Lancaster, PA, USA, 1998. [Google Scholar]
  24. Schafer, A.I.; Mauch, R.; Waite, Y.D.; Fane, A.G. Charge effects in the fractionation of natural organics using ultrafiltration. Environ. Sci. Technol. 2002, 36, 2572–2580. [Google Scholar] [CrossRef]
  25. Zhang, M.; Song, L. Mechanisms and parameters affecting flux decline in cross-flow microfiltration and ultrafiltration of colloids. Environ. Sci. Technol. 2000, 34, 3767–3773. [Google Scholar] [CrossRef]
  26. Mulder, M. Basic Principles of Membrane Technology; Kluwer: Dordrecht, The Netherlands, 1991. [Google Scholar]
  27. Bandow, S.; Rao, A.M.; Williams, K.A.; Thess, A.; Smalley, R.E.; Eklund, P.C. Purification of single-wall carbon nanotubes by microfiltration. J. Phys. Chem. B 1997, 101, 8839–8842. [Google Scholar]
  28. Kyllönen, H.M.; Pirkonen, P.; Nystrom, M. Membrane filtration enhanced by ultrasound: A review. Desalination 2005, 181, 319–335. [Google Scholar] [CrossRef]
  29. Minhalma, M.; de Pinho, M.N. Flocculation/flotation/ultrafiltration integrated process for the treatment of cork processing wastewaters. Environ. Sci. Technol. 2001, 35, 4916–4921. [Google Scholar] [CrossRef]
  30. Tsao, T.M.; Wang, M.K.; Huang, P.M. Automated ultrafiltration device for efficient collection of environmental nanoparticles from aqueous suspensions. Soil Sci. Soc. Am. J. 2009, 73, 1808–1816. [Google Scholar] [CrossRef]
  31. Tsao, T.M.; Wang, M.K.; Huang, P.M. An Apparatus for Collecting Nanoparticles. U.S. Patent 7501063 B2, 10 March 2009. [Google Scholar]
  32. Napper, D.H. Polymeric Stabilization of Colloidal Dispersions; Academic Press: New York, NY, USA, 1983. [Google Scholar]
  33. Liang, W.; Kendall, K. Aggregate formation in colloidal dispersions. Colloids Surf. A 1998, 131, 193–201. [Google Scholar] [CrossRef]
  34. Chen, G.H.; Yue, P.L.; Mujumdar, A.S. Sludge dewatering and drying. Drying Technol. 2002, 20, 883–916. [Google Scholar] [CrossRef]
  35. Buffle, J.; Perret, D.; Newman, M. The use of filtration and ultrafiltration for size fractionation of aquatic particles, colloids, and macromolecules. In Environmental Particles, IUPAC Series on Environmental Analytical and Physical Chemistry; Buffle, J., van Leeuwen, H.P., Eds.; Lewis Publishers: Chelsea, MI, USA, 1992; Volume 1, pp. 171–230. [Google Scholar]
  36. Matthew, A.M.; Benoit, G. Environmental filtration artifacts caused by overloading membrane filters. Environ. Sci. Technol. 2001, 35, 3774–3779. [Google Scholar] [CrossRef]
  37. Tanner, C.B.; Jackson, M.L. Nomographs of sedimentation times for soil particles under gravity or centrifugal acceleration. Soil Sci. Soc. Am. Proc. 1947, 12, 60–65. [Google Scholar] [CrossRef]
  38. Williams, J.W.; Kensal, E.; van Holde, K.E.; Baldwin, R.L.; Fujita, H. The theory of sedimentation analysis. Chem. Rev. 1958, 58, 715–744. [Google Scholar] [CrossRef]
  39. Jackson, M.L. Soil Chemical Analysis: Advanced Course, 2nd ed; University of Wisconsin: Madison, WI, USA, 1979. [Google Scholar]
  40. Hiemenz, P.C. Principles of Colloid and Surface Chemistry, 2nd ed; Polytehnic University Press: Pomona, CA, USA, 1986. [Google Scholar]
  41. Laidlaw, I.; Steinmetz, M. Introduction to differential sedimentation. In Analytical Ultracentrifugation: Techniques and Methods; Scott, D.J., Harding, S.E., Rowe, A.J., Eds.; Royal Society of Chemistry: Cambridge, UK, 2005; pp. 270–290. [Google Scholar]
  42. Breck, D.W. Zeolite Molecular Sieves; John Wiley & Sons: New York, NY, USA, 1973. [Google Scholar]
  43. Mohr, E.C.J.; Baren, F.A.; van Schuylenborg, J. Tropical Soils: A Comprehensive Study of Their Genesis, 3rd ed; Monton-Ichitor: The Hague, The Netherlands, 1972. [Google Scholar]
  44. Sanchez, P. Properties and Management of Soils in the Tropics; Wiley: New York, NY, USA, 1976. [Google Scholar]
  45. Buol, S.W.; Sanchez, P.A. Red Soils in the Americas: Morphology, Classification and Management. In Proceedings of the International Symposium on Red Soil; Academia Sinica Institute of Soil Science, Ed.; China Science: Beijing, China, 1986. [Google Scholar]
  46. Eswaran, H.; Ikawa, H.; Kimble, J.M. Oxisols of the World. In Proceedings of the International Symposium on Red Soil; Academia Sinica Institute of Soil Science, Ed.; China Science: Beijing, China, 1986; pp. 90–123. [Google Scholar]
  47. China Soil Survey Office, China Soils; China Science: Beijing, China, 1987; (in Chinese with English abstract).
  48. IUSS Working Group WRB, World Reference Base for Soil Resources World Soil Resources Reports No. 103; FAO: Rome, Italy, 2006.
  49. Wan, H.M.; Chen, S.H. The relationship between laterization, chemical and mineralogical characterizations, and weathering of gravels in Linkuo terrace. Ti Chih. 1988, 8, 27–47, (in Chinese with English abstract). [Google Scholar]
  50. Tsao, T.M.; Chen, Y.M.; Sheu, H.S.; Zhuang, S.Y.; Shao, P.H.; Chen, H.W.; Shea, K.S.; Wang, M.K.; Shau, Y.H.; Chiang, K.Y.J. Red soil chemistry and mineralogy reflect uniform weathering environments in fluvial sediments, Taiwan. J. Soils Sediments 2012, 12, 1054–1065. [Google Scholar] [CrossRef]
  51. Schwertmann, U.; Taylor, R.M. Iron Oxides. In Minerals in Soil Environments, 2nd; Dixon, J.B., Weed, S.B., Eds.; SSSA: Madison, WI, USA, 1989; pp. 379–438. [Google Scholar]
  52. Ranville, J.F.; Chittleborough, D.J.; Beckett, R. Particle-size and element distributions of soil colloids: Implication for colloid transport. Soil Sci. Soc. Am. J. 2005, 69, 1173–1184. [Google Scholar] [CrossRef]
  53. Pai, C.W.; Wang, M.K.; Wang, W.M.; Houng, K.H. Smectites in iron rich calcareous soil and black soils of Taiwan. Clays Clay Miner. 1999, 47, 389–398. [Google Scholar]
  54. Soil Survey Staff, Key to Soil Tanonomy, 6th edUS Government Printing Office: Washington, DC, USA, 2006.
  55. Graham, R.C.; Southard, A.R. Genesis of a vertisol and an associated mollisol in Northern Utah. Soil Sci. Soc. Am. J. 1983, 47, 552–559. [Google Scholar]
  56. International Committee on Vertisols, Draft Keys; USDA-SMSS: Washington, DC, USA, 1990.
  57. Ma, K.F.; Lee, C.T.; Tsai, Y.B.; Shin, T.C.; Mori, J. The Chi-Chi, Taiwan earthquake: Large surface displacements on an inland thrust fault. Eos Trans. AGU 1999, 80, 605–611. [Google Scholar]
  58. Lee, J.C.; Chu, H.T.; Angelier, J.; Chan, Y.C.; Hu, J.C.; Lu, C.Y.; Rau, R.J.J. Geometry and structure of northern surface ruptures of the 1999 Mw = 7.6 Chi-Chi Taiwan earthquake: Influence from inherited fold belt structures. J. Struct. Geol. 2002, 24, 173–192. [Google Scholar]
  59. Angelier, J.; Lee, J.C.; Hu, J.C.; Chu, H.T.J. Three-dimensional deformation along the rupture trace of the September 21st, 1999, Taiwan earthquake: A case study in the Kuangfu school. In J. Struct. Geol.; 2003; Volume 25, pp. 351–370. [Google Scholar]
  60. Heaton, T.H. Evidence for and implications of self-healing pulses of slip in earthquake rupture. Phys. Earth Planet. Inter. 1990, 64, 1–20. [Google Scholar] [CrossRef]
  61. Wilson, B.; Dewers, T.; Reches, Z.E.; Brune, J. Particle size and energetics of gouge from earthquake rupture zones. Nature 2005, 434, 749–752. [Google Scholar] [CrossRef]
  62. Chester, J.S.; Chester, F.M.; Kronenberg, A.K. Fracture surface energy of the Punchbowl fault, San Andreas system. Nature 2005, 437, 133–136. [Google Scholar]
  63. Ma, K.-F.; Tanaka, H.; Song, S.-R.; Wang, C.-Y.; Hung, J.-H.; Tsai, Y.-B.; Mori, J.; Song, Y.-F.; Yeh, E.-C.; Soh, W.; et al. Slip zone and energetics of a large earthquake from the Taiwan Chelungpu-fault Drilling. Nature 2006, 444, 473–476. [Google Scholar]
  64. Chou, Y.M.; Tsao, T.M.; Song, S.R.; Yeh, E.C.; Wang, M.K.; Lin, C.S.; Lee, T.Q.; Chen, H.F. Preliminary Results of Nano-particle Analysis of Chelungpu-Fault Gouge in Wu-Feng, Central Taiwan; American Geophysical Union Fall Meeting: San Francisco, CA, USA, 2007. [Google Scholar]
  65. Gibbs, R.J. The geochemistry of the amazon river system: Part I. The factors that control the salinity and the composition and concentration of the suspended solids. Geol. Soc. Am. Bull. 1967, 78, 1203–1232. [Google Scholar] [CrossRef]
  66. Wang, Y.; Forssberg, E. Production of carbonate and silica nano-particles in stirred bead milling. Int. J. Miner. Process. 2006, 81, 1–14. [Google Scholar]
  67. Heilbronner, R.; Keulen, N. Grain size and grain shape analysis of fault rocks. Tectonophysics 2006, 427, 199–216. [Google Scholar]
  68. Sammis, C.G.; King, G.C.P. Mechanical origin of power law scaling in fault zone rock. Geophys. Res. Lett. 2007, 34, L04312. [Google Scholar] [CrossRef] [Green Version]

