Article

Assessing the Impact of Recycled Water Quality and Clogging on Infiltration Rates at A Pioneering Soil Aquifer Treatment (SAT) Site in Alice Springs, Northern Territory (NT), Australia

by
Karen E. Barry
1,*,
Joanne L. Vanderzalm
1,
Konrad Miotlinski
2 and
Peter J. Dillon
1
1
CSIRO Land and Water, Waite Road, Urrbrae 5064, SA, Australia
2
Departamento de Geologia Aplicada, Universidade Estadual Paulista (UNESP), Rio Claro 13506, SP, Brazil
*
Author to whom correspondence should be addressed.
Water 2017, 9(3), 179; https://doi.org/10.3390/w9030179
Submission received: 16 December 2016 / Revised: 27 February 2017 / Accepted: 27 February 2017 / Published: 2 March 2017
(This article belongs to the Special Issue Water Quality Considerations for Managed Aquifer Recharge Systems)

Abstract

:
Infiltration techniques for managed aquifer recharge (MAR), such as soil aquifer treatment (SAT) can facilitate low-cost water recycling and supplement groundwater resources. However there are still challenges in sustaining adequate infiltration rates in the presence of lower permeability sediments, especially when wastewater containing suspended solids and nutrients is used to recharge the aquifer. To gain a better insight into reductions in infiltration rates during MAR, a field investigation was carried out via soil aquifer treatment (SAT) using recharge basins located within a mixture of fine and coarse grained riverine deposits in Alice Springs, Northern Territory, Australia. A total of 2.6 Mm3 was delivered via five SAT basins over six years; this evaluation focused on three years of operation (2011–2014), recharging 1.5 Mm3 treated wastewater via an expanded recharge area of approximately 38,400 m2. Average infiltration rates per basin varied from 0.1 to 1 m/day due to heterogeneous soil characteristics and variability in recharge water quality. A treatment upgrade to include sand filtration and UV disinfection (in 2013) prior to recharge improved the average infiltration rate per basin by 40% to 100%.

1. Introduction

Infiltration techniques such as soil aquifer treatment (SAT) are attractive options in supporting irrigation as they are nominally lower in cost than well injection schemes [1] and they can take advantage of the potential for natural treatment through the unsaturated zone [2]. Australia has tremendous potential to increase the amount of water that is recycled via managed aquifer recharge (MAR), as a large proportion of the Australian landscape is covered in favorable sedimentary deposits of sand, gravel and limestone. However, to date there is only one operational SAT scheme in the Northern Territory, Australia, and this has a license to recharge 0.6 Mm3/year. Parsons et al. [3] reported on uncertainty regarding the feasibility of MAR schemes, owing largely to a lack of documented demonstration sites, as a key limitation to the use of MAR for water recycling in Australia. Uncertainty arises from challenges in the implementation of MAR in the presence of lower permeability sediments, such as silt and clay, and/or due to clogging processes, both of which inhibits infiltration rate. Clogging and its management remains a key operational challenge for all MAR schemes [4,5]. The clogging layer often referred to as the ‘schmutzdecke’ usually consists of a thin layer (millimeters to centimeters) thickness, which contains suspended solids, algae, microbes, dust, and salts. Houston et al. [6] defined this clogging layer as the zone of material over which a sharp drop in hydraulic head occurs as water infiltrates into a sedimentary profile.
Management strategies include pre-treatment of the recharge water to minimize clogging [7,8], along with remediation measures such as drying and desiccation of the basin surface [9]. Operation of SAT basins in alternating wet and dry cycles to develop anoxic and oxic conditions can optimize the potential for biological treatment processes [2]. Remediation measures are also influenced by the sediment properties of the individual basins [10]. Periodic scraping of the basins is a further management tool [11,12] which can impact on the economic feasibility [13]. Basin floor design using parallel ridges and furrows has been reported to reduce the need for maintenance [12].
The key objectives of this paper are to assess: (i) the impact of sediment properties; and (ii) recycled water pre-treatment on the infiltration rate of a SAT scheme in Alice Springs (NT), in order to identify improvements to the management of such schemes.

2. Materials and Methods

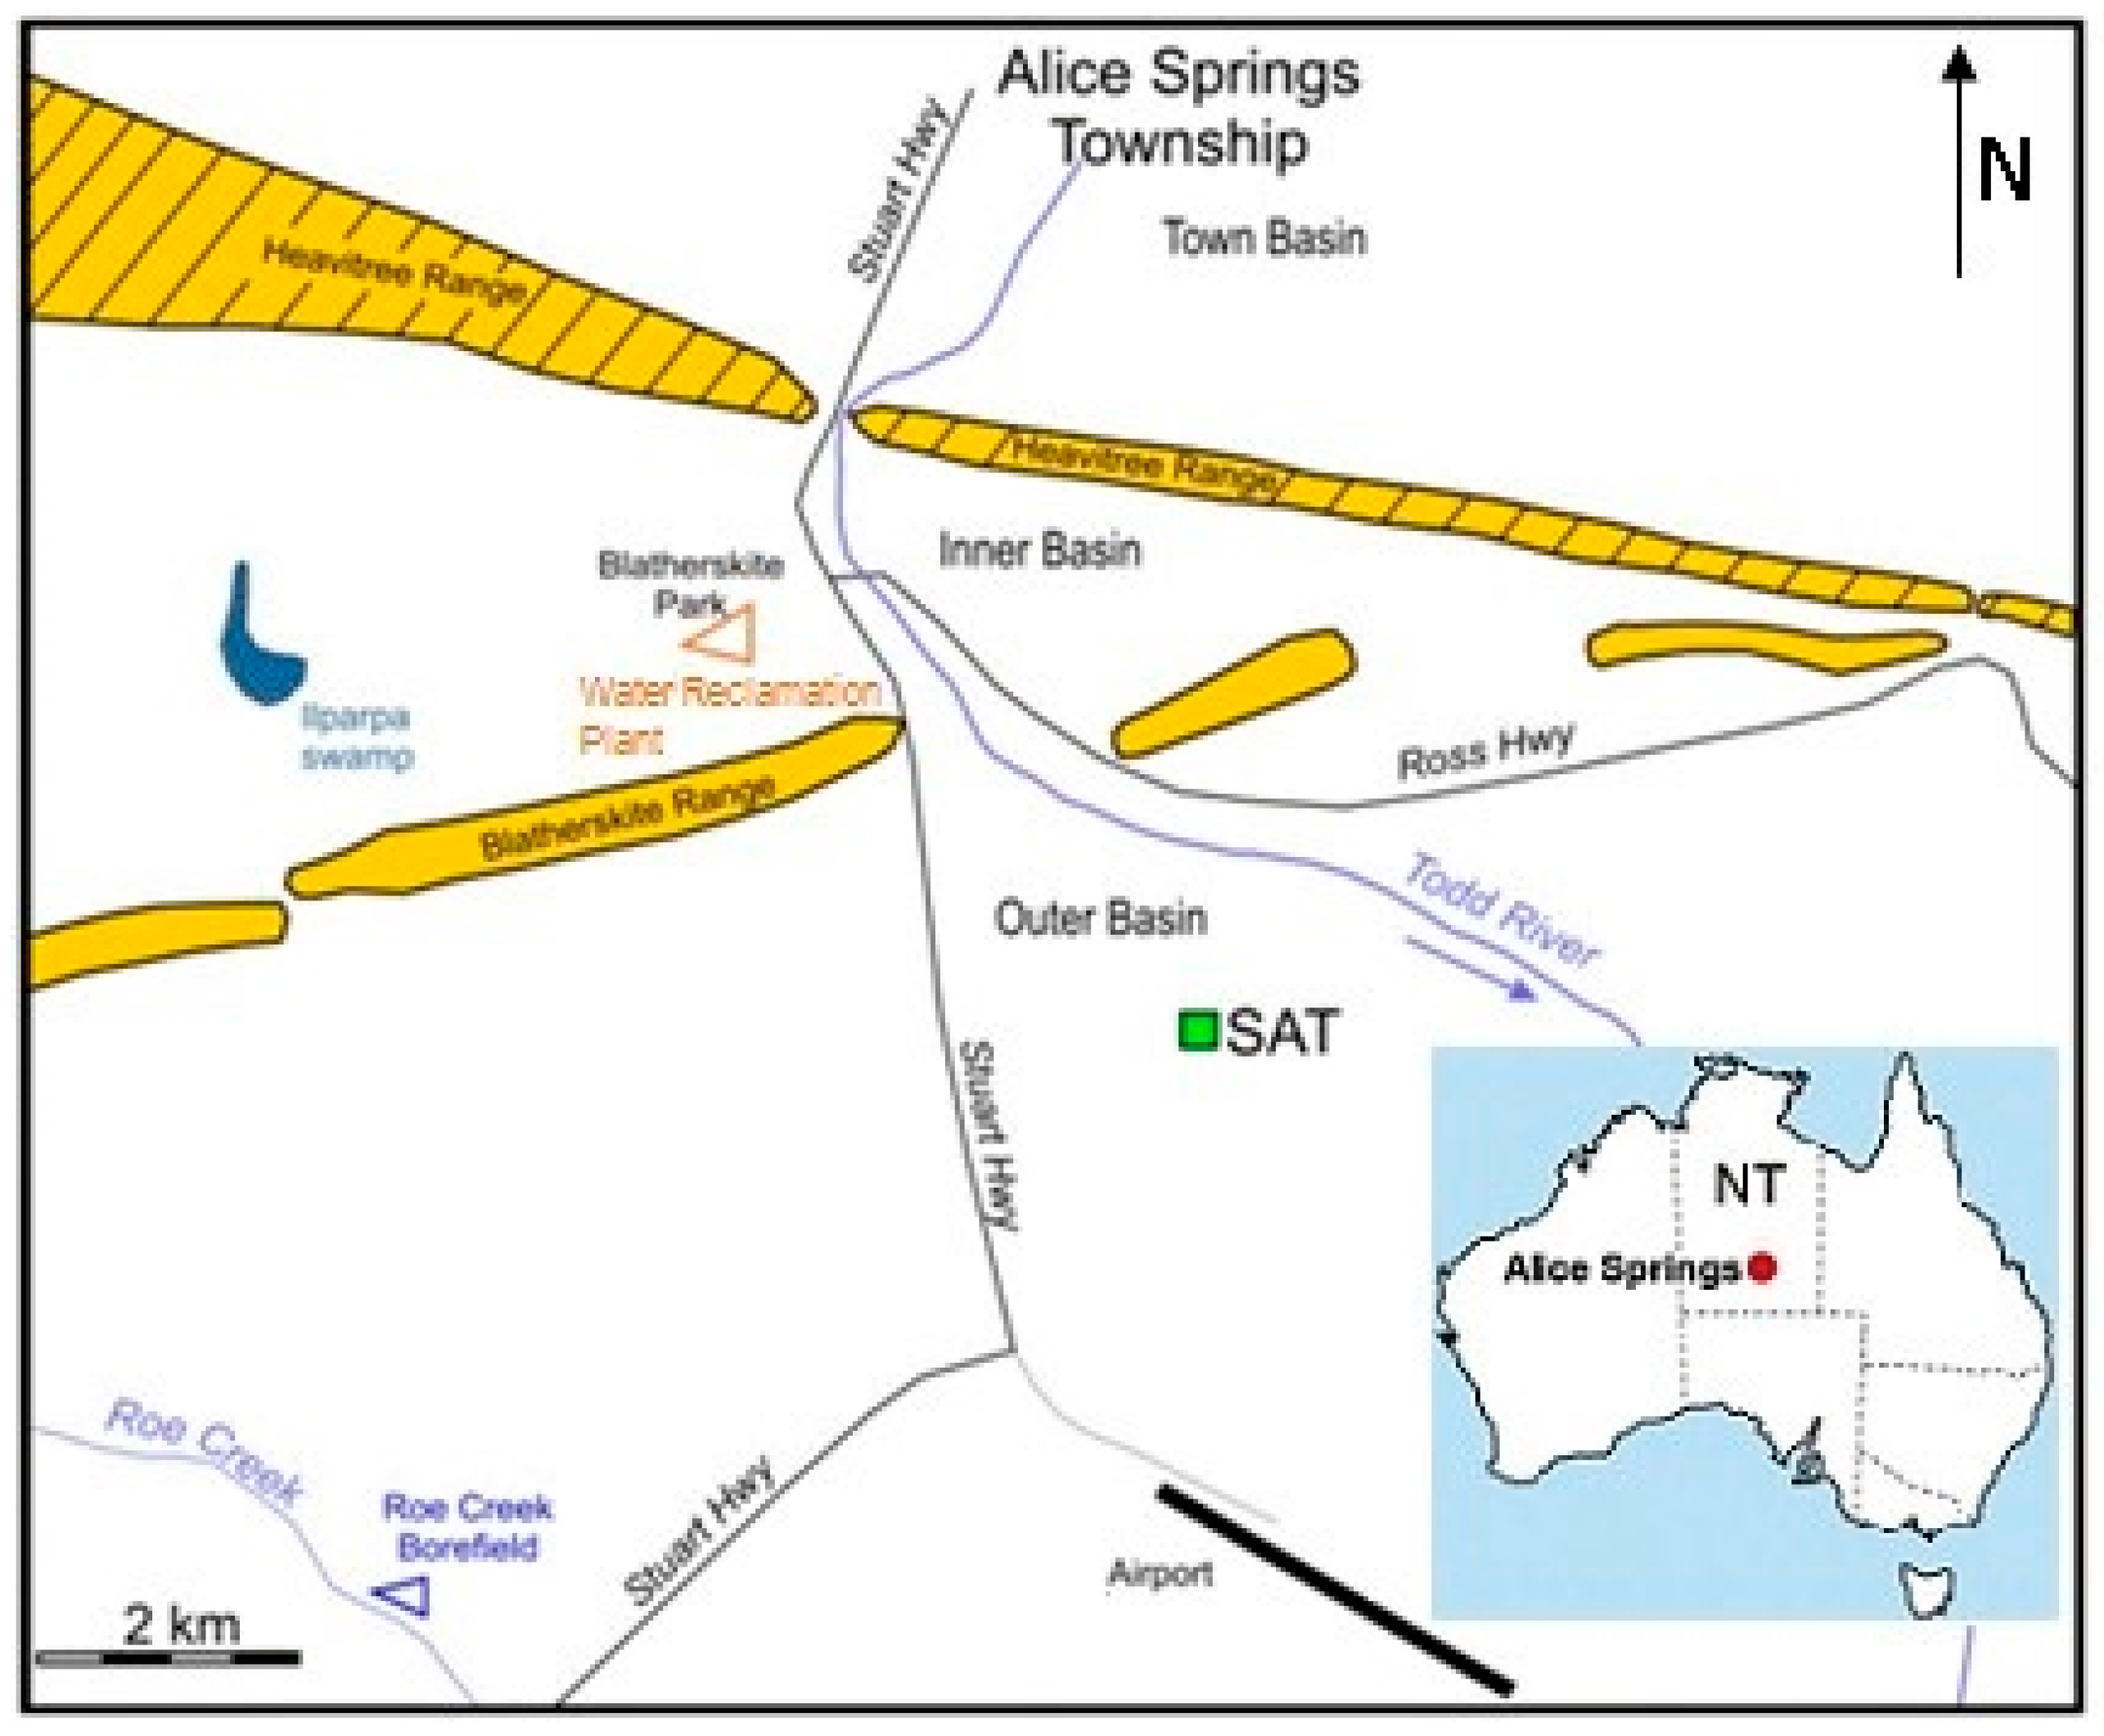
2.1. Study Site and Operations

Field investigations were carried out on MAR using SAT from 2008 to 2014, using recharge basins located within a mixture of fine and coarse grained riverine deposits near Alice Springs, Northern Territory, Australia [14,15]. The SAT scheme is operated by the Northern Territory Power and Water Corporation (PWC) and located approximately 7 km south of the Alice Springs Township (Figure 1) at the Arid Zone Research Institute (AZRI), in an area historically referred to as the Outer Farm Basin. The Alice Springs area is characterized by desert climate with high evaporation rates (3000 mm/year) and an annual average rainfall of 284 mm.
The recharge water is produced at the Water Reclamation Plant (WRP), which is situated next to Ilparpa Swamp adjacent to Blatherskite Park, approximately 5 km northwest of the site (Figure 1). Wastewater for recharge has been treated by stabilization ponds and Dissolved Air Flotation (DAF) since 2008, and in 2013 the DAF plant was upgraded to include a sand filtration step (DAFF) plus UV disinfection.
Recharge water targets a palaeochannel of the Todd River (which runs in a north west to south east direction), a Quaternary alluvial aquifer consisting of coarse grained sediments overlain by finer grained clayey silts, clays and sands [16] (Figure 2). Quinlan and Wooley [17] reviewed the hydraulic parameters of the Quaternary aquifers in the Town and Inner Farm Basins (Figure 1), and estimated an average hydraulic conductivity of 45 m/day (T = 310 m2/day) and a specific yield of 0.7. Berry’s [18] work on the Inner Farm Basin indicated a hydraulic conductivity range of 1 to 117 m/day, with higher values evident in the palaeochannel. Dual infiltration ring and soil permeameter tests carried out by Knapton et al. [16] in the Outer Farm Basin reported hydraulic conductivity ranging from 4 m/day in the silty sandy soil and up to 90 m/day in the gravelly sands. The natural depth to groundwater in the vicinity of the SAT scheme is approximately 18 m [19]. The alluvial aquifer system is comprised of three connected basins, Town, Inner and Outer, that extend beneath Alice Springs to south of the airport (Figure 1). The Alice Springs water supply comes from the underlying Mereenie Sandstone aquifer within the Amadeus Basin and is extracted via the Roe Creek bore field located approximately 7 km south west of the SAT site.
Water recycling via SAT was initially conceived to address public health concerns associated with sewage overflows into Ilparpa Swamp, increasing potential for mosquitoes to breed, and to provide an alternative water source to reduce the demand on the declining resource in the Mereenie Sandstone aquifer, where water levels have been declining.
Recharge to the SAT basins commenced in 2008, with a license for recharge of 0.6 Mm3/year treated wastewater. The scheme was initially established as four basins with a total recharge surface area of 7640 m2; in 2009 a fifth basin was commissioned bringing the capacity to 10,300 m2. There was a further expansion of the basins in 2011 as the recharge target had not been reached, and by September 2012 the five expanded basins now cover a total recharge area of approximately 38,400 m2. Basin A is approximately 7300 m2, Basin B is 8500 m2, Basin C is 8100 m2, Basin D is 6600 m2 and Basin E is 7900 m2. Figure 3 shows the outline of the current 5-basin configuration.
This evaluation is focused on the expanded basin configuration (2011–2014). Recharge to the basins was managed by intermittently filling each basin in turn to a depth of 0.3 m, as determined by Pavelic et al. [21], with treated wastewater from the Water Reclamation Plant. The recharge periods in each basin were limited to seven days so as to minimize the chance of mosquito breeding. Initially water flowed into the basin over a minimum two day period as long as the standing water level (measured with pressure transducer at the inlet) was below 0.3 m above the average basin floor level. If the level exceeded 0.3 mm, flow would stop to allow recharge, if the level dropped below 0.05 m flow continued to a maximum of 0.3 m. After two filling days, the basin was given a minimum of five days without water being added, to allow water to recharge through the soil profile.
Wetting intervals potentially enable anoxic conditions to develop beneath the basins, while drying periods result in aerobic conditions. This change in redox condition is favorable to enhance the potential for biodegradation of nutrients and pathogens [22]. Average drying intervals per basin ranged from 7 to 12 days; however drying time was highly variable.
There was no defined maintenance schedule for the basins, however operators would regularly visit the site to ensure optimum management of the flow valves to the recharge basins and to check the infiltration across the basins. The valve at Basin B did fail in 2012 resulting in a 4-month period of no infiltration, due to the delay in delivering new parts to the center of Australia. In the first year of operations, opportunistic vegetation began growing in the basins (mostly lovegrass and woody vegetation), attempts were made to regularly remove the vegetation, but it continued to spread extensively over the basin surfaces. For the remainder of the study, the vegetation was allowed to remain largely unmanaged as it was found that there was no improvement in infiltration rates with its removal, which was done by hand so as to avoid compaction of the basins with machinery.

2.2. Infiltration Rate

Pond levels in the basins were measured with pressure transducers at the pond inflow point. Water volumes delivered to the basins were measured using flow meters connected to the inflow pipeline. All sensors were monitored via a SCADA system (supervisory control and data acquisition) and valves could be actuated automatically or manually from the control room at the wastewater treatment plant. The infiltration rate in each recharge basin was estimated from the water level measured by a pressure transducer located close to the inlet. Infiltration rate was estimated over time using the change in water level (head) as measured by the pressure transducer at the outlet when the floor of the basin was fully covered with water and immediately after inflow had ceased using the following formula (Equation (1)):
I p = Δ h Δ t
where, Ip = infiltration rate (m/day), Δh = change of water level in a basin (m), Δt = time over which the change in water level takes place (day).
This method gives an approximation of the infiltration rates to enable comparisons to be made between the recharge basins. Calculating a stable infiltration rate is a challenge as the basin infiltrates while it is still spreading laterally across the basin and it is noted that at the beginning of application when the soil is dry, change in soil moisture and above ground storage is a major component of the mass balance equation. There are also other processes affecting water level in recharge basins that are not considered here. For example, the method does not include losses due to evaporation which on average was comparatively small (<5%) in relation to the daily infiltration rate nor gains due to rainfall. Though the basins would not usually be recharged during significant rainfall events (>5 mm). Lateral infiltration through the vertical walls of the basins was not included in these calculations. Geophysics surveys carried out using Nanotem EM and resistivity assessed the potential for lateral movement of water in the subsurface zone in addition to direct infiltration to the palaeochannel [15].
In an earlier laboratory and glasshouse column study of soil from this site characterized as sand and loam, the infiltration rate for water closest in quality to that applied in the field studies was 6–11 m/day in sand and 0.34–0.53 m/day in loam. However under glasshouse conditions, the infiltration rate for loam reduced to 0.13 m/day due to diurnal gas binding not observed in the laboratory [21]. An infrared spectral method to estimate physical and geochemical properties of soil at this site was developed [23], but has not subsequently been applied to characterize the infiltration at sub-basin scale.

2.3. Water Quality

Recharge water and groundwater quality data was provided by PWC. Groundwater was sampled at quarterly intervals from monitoring wells upgradient (600 m) from the SAT scheme, downgradient from the scheme (200 m, 500 m and 1000 m), in the basin and adjacent to Basin C. The wells adjacent to Basin C were nested piezometers installed at five different depths (2–6, 6–12, 12–18, 16–22 and 20–30 m), so as to monitor any groundwater mounding beneath the basins. Routine monthly sampling was undertaken of the recharge water. Analyses included field measurements of electrical conductivity (EC), pH, temperature, dissolved oxygen (DO) and turbidity; and laboratory analyses included total suspended solids (TSS), nitrogen species (ammonium, nitrate, nitrite, total Kjeldahl nitrogen), total and dissolved phosphorus, alkalinity, major ions, biological oxygen demand (BOD), total and dissolved organic carbon (DOC) and E. coli. Biodegradable dissolved oxygen (BDOC) and chlorophyll a were undertaken on four samples of recharge water during the study. Quarterly samples were collected of groundwater and recharge water for deuterium and 18O isotopes, so as to track the plume of recharge water along the palaeochannel.

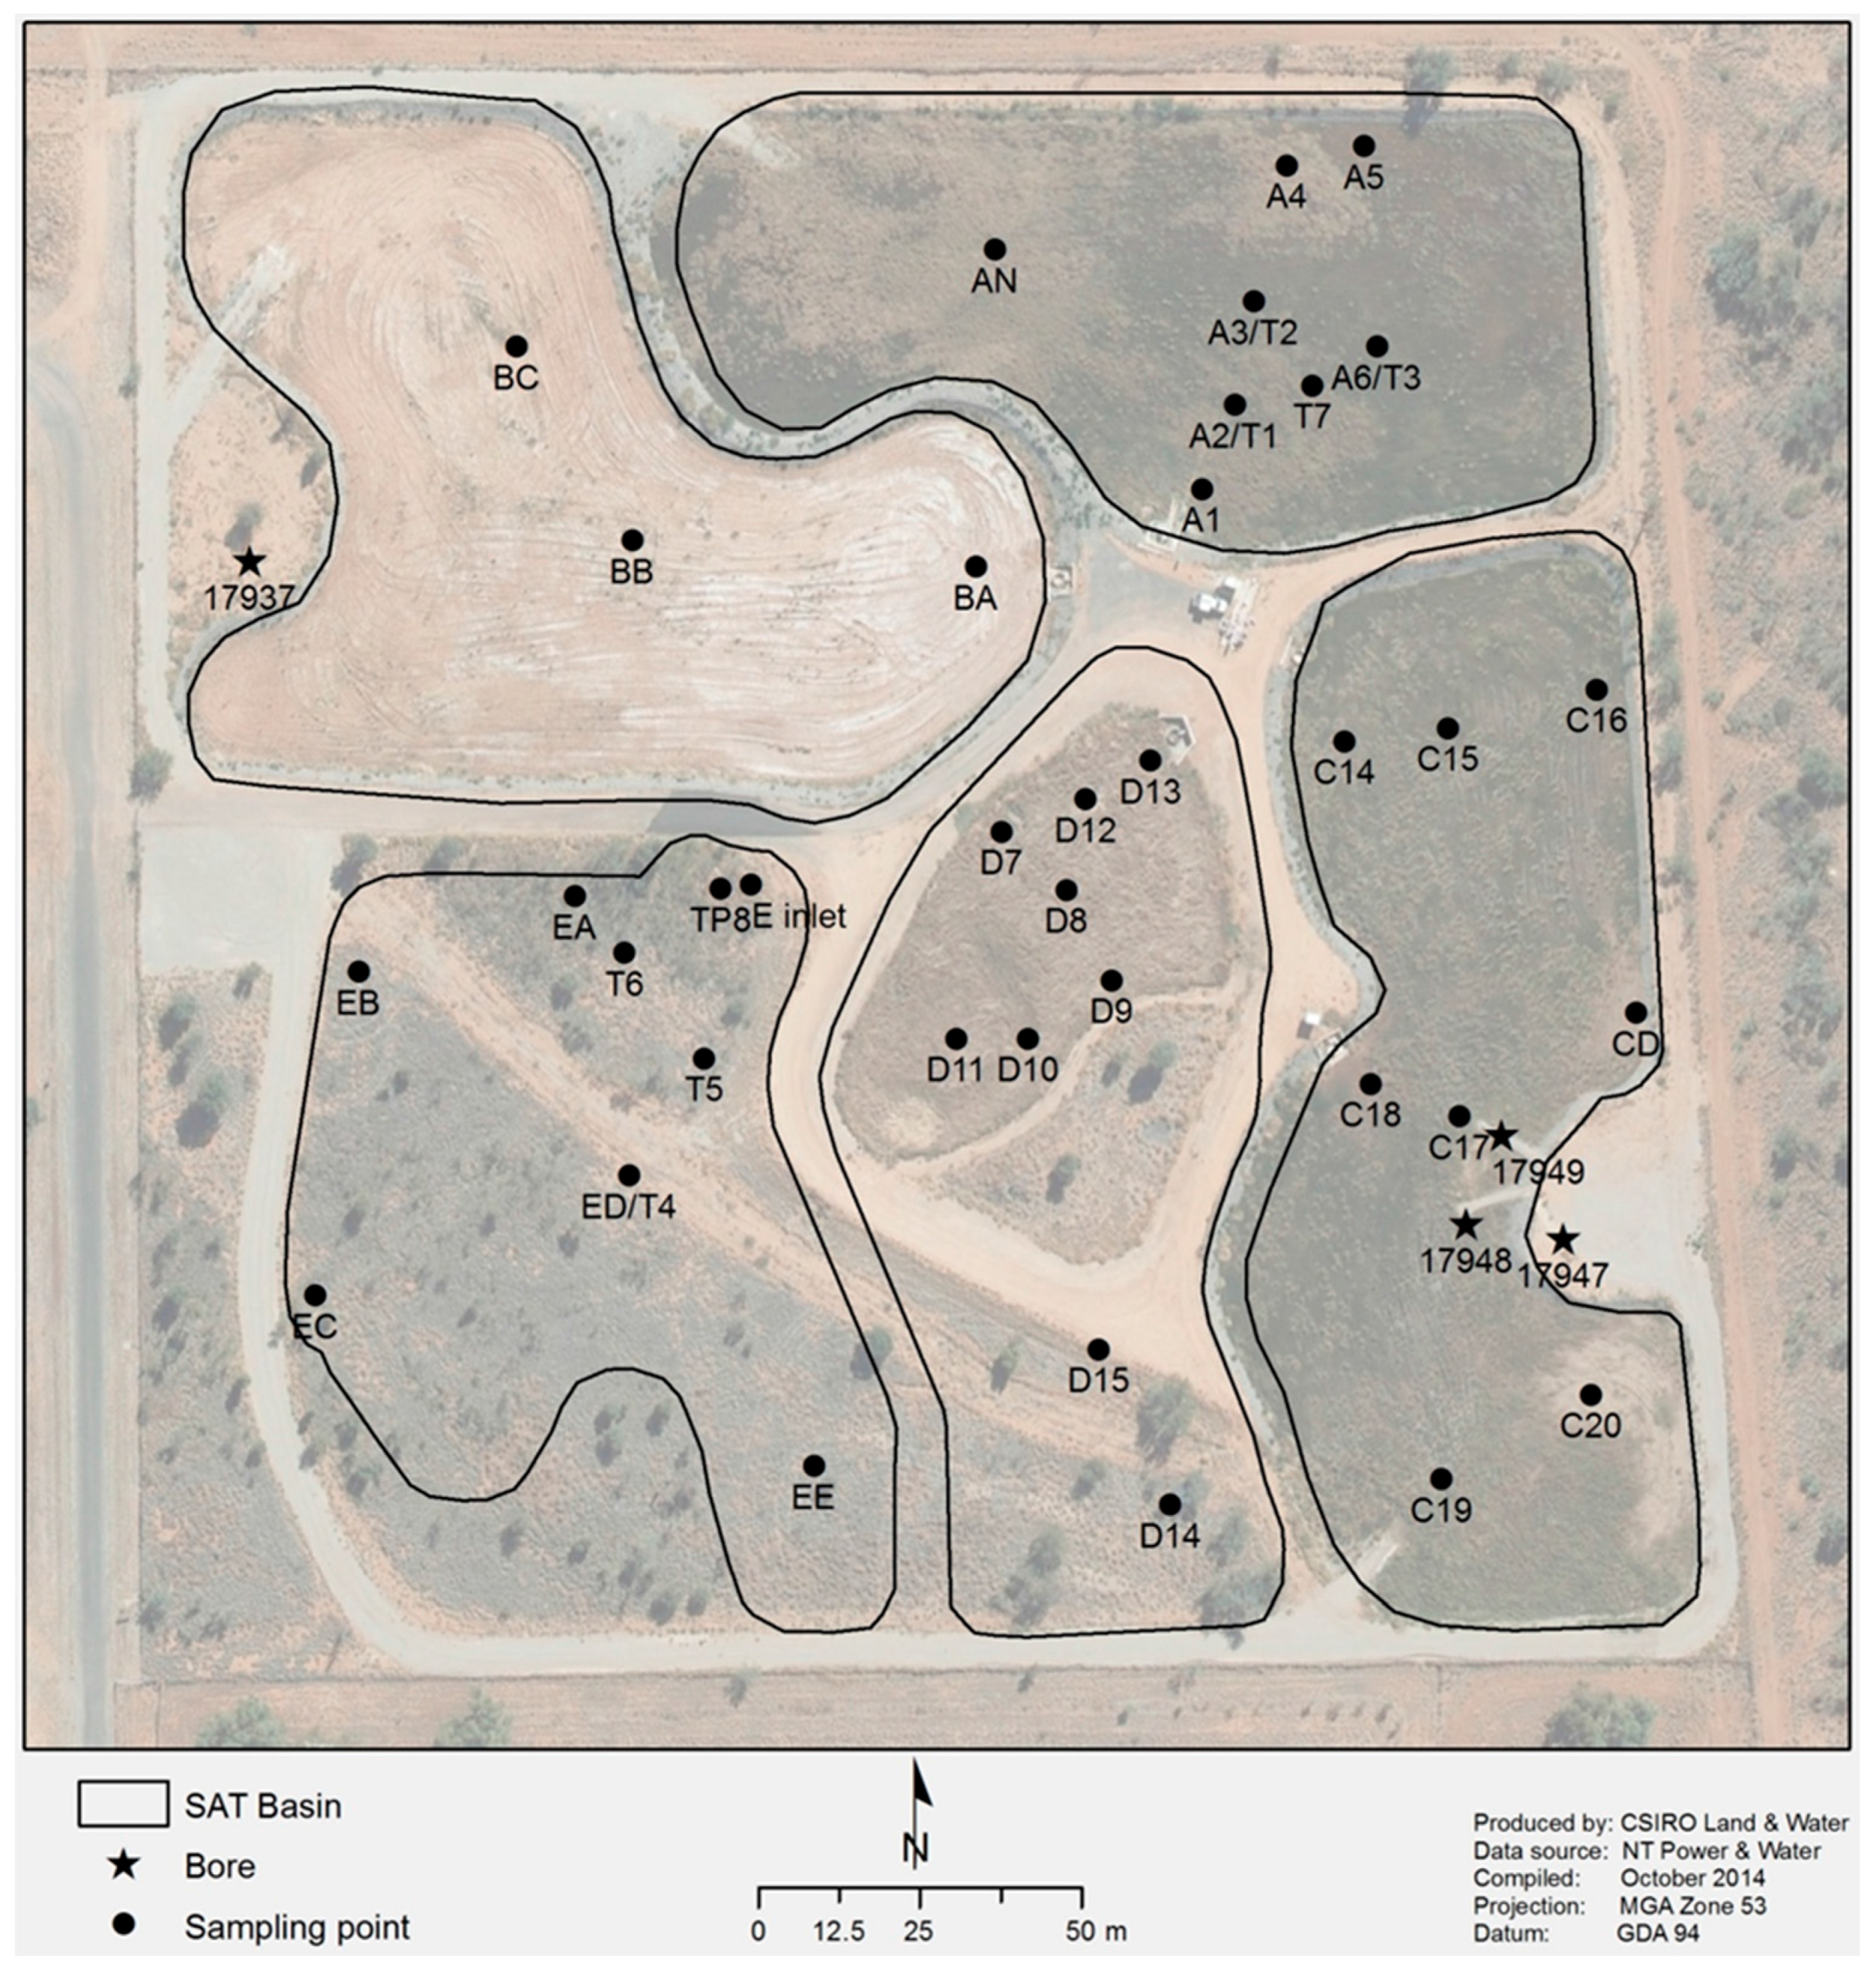
2.4. Sediment Sampling

In order to characterize the ‘schmutzdecke’ or basin clogging layer, the physical, chemical and microbial properties of soil beneath the basins and the wastewater were measured. Soil sampling focused on the bulk density, soil moisture, carbon and nitrogen concentrations in the soil profiles up to 1.5 m depth and surface layer (top 2 cm). This included an annual round of surface sampling at designated locations in 2012, 2013 and 2014 as well as periodic profile samples up to a depth of 2 m. Undisturbed soil samples were also collected for measurement of bulk density using stainless steel bulk density rings or PVC rings pounded in with a rubber mallet. Soil textures were determined using a ribboning technique [24]. Soil compaction was measured across multiple locations in the basins using a nuclear density tensiometer, in 2012. Figure 3 (Section 2.1) shows all soil sample locations through the study as well as the near basin monitoring wells (bores RN17937, RN17947, RN17948 and RN17949).

3. Results and Discussion

3.1. Recharge Water and Groundwater Quality

As typical for recycled water, the recharge water for SAT was higher in nutrients than the ambient groundwater in the alluvial aquifer (Table 1), it was also fresher with EC at an average of 1800 µS/cm (DAF and DAFF) compared with an average 2400 µS/cm in the ambient groundwater.
With the upgrade of the water treatment plant from DAF to DAFF in August 2013, the concentrations of TSS, BOD, reduced nitrogen (NH4-N) and phosphorus were found to be typically lower, while oxidized nitrogen (NO3-N) was little changed (Table 1). Pérez-Paricio [25] has recommended targets of <10 mg/L TSS and TOC < 10 mg/L to minimize clogging in limestone aquifers; DAFF treated recharge water complied with these targets. Average TSS was decreased from 9 to <5 mg/L, which reduced the potential for physical clogging. DOC showed a marginal decrease from 9.4 to 8.3 mg/L, while BOD showed a significant decline with the introduction of filtration to the DAF plant, reducing from 10 to 1.1 mg/L. Optimization of wastewater treatment via the lagoons and the DAFF plant resulted in greater removal of algae, indicated by a reduction in chlorophyll a concentrations in the recharge from 8 to 13 mg/L (n = 3) to less than 1 mg/L (n = 1). These reductions in organic matter and nutrients in the DAFF treated water reduced the potential for biological clogging caused by microbial and algal growth.
Table 1 also shows the average and standard deviations (over the study period) for water quality at one of the groundwater bores, RN17947 (Figure 3), which was located immediately adjacent to the basins with a slotted interval at a 20–30 m depth. Within one year from the start of operation at the SAT site, groundwater in bore RN17947 showed 100% breakthrough of recharge water, resulting in a decline in chloride concentration from 470 to 240 mg/L. In comparison, it took two years to reach 100% breakthrough at monitoring bores located south east 200 m downgradient and five years to reach those 1000 m downgradient (south east) (Figure 2).
The concentrations of nitrogen and carbon in the quarterly sampled groundwater varied throughout the study with nitrate-N concentrations ranging from <0.002 to 13.9, but typically remaining above 4 mg/L with an average of 9.4 mg/L. SAT has the potential to provide biodegradation of nutrients in the recharge water if anoxic conditions develop in the vadose zone [2]. The process of alternately wetting and drying the basins, besides managing clogging, is intended to allow aerobic and anoxic redox conditions to develop beneath the basins to facilitate nitrogen consumption. Typically, sufficient labile organic carbon must be present for nitrate removal via heterotrophic denitrification. However ammonia oxidation, called the ANAMMOX (Anaerobic Ammonium Oxidation) process is an alternative pathway for conversion of nitrate to nitrogen gas that does not require organic carbon [2], but does require anoxic conditions. Only 20% removal of total nitrogen occurred in the vadose zone beneath the SAT basins, suggesting nitrogen removal was limited in this study [24]. BDOC in the recharge water less than 5 mg/L (n = 4), with 90% of BDOC in the wastewater removed within the facultative wastewater treatment ponds. Presumably, these low labile organic carbon concentrations inhibited denitrification during infiltration.

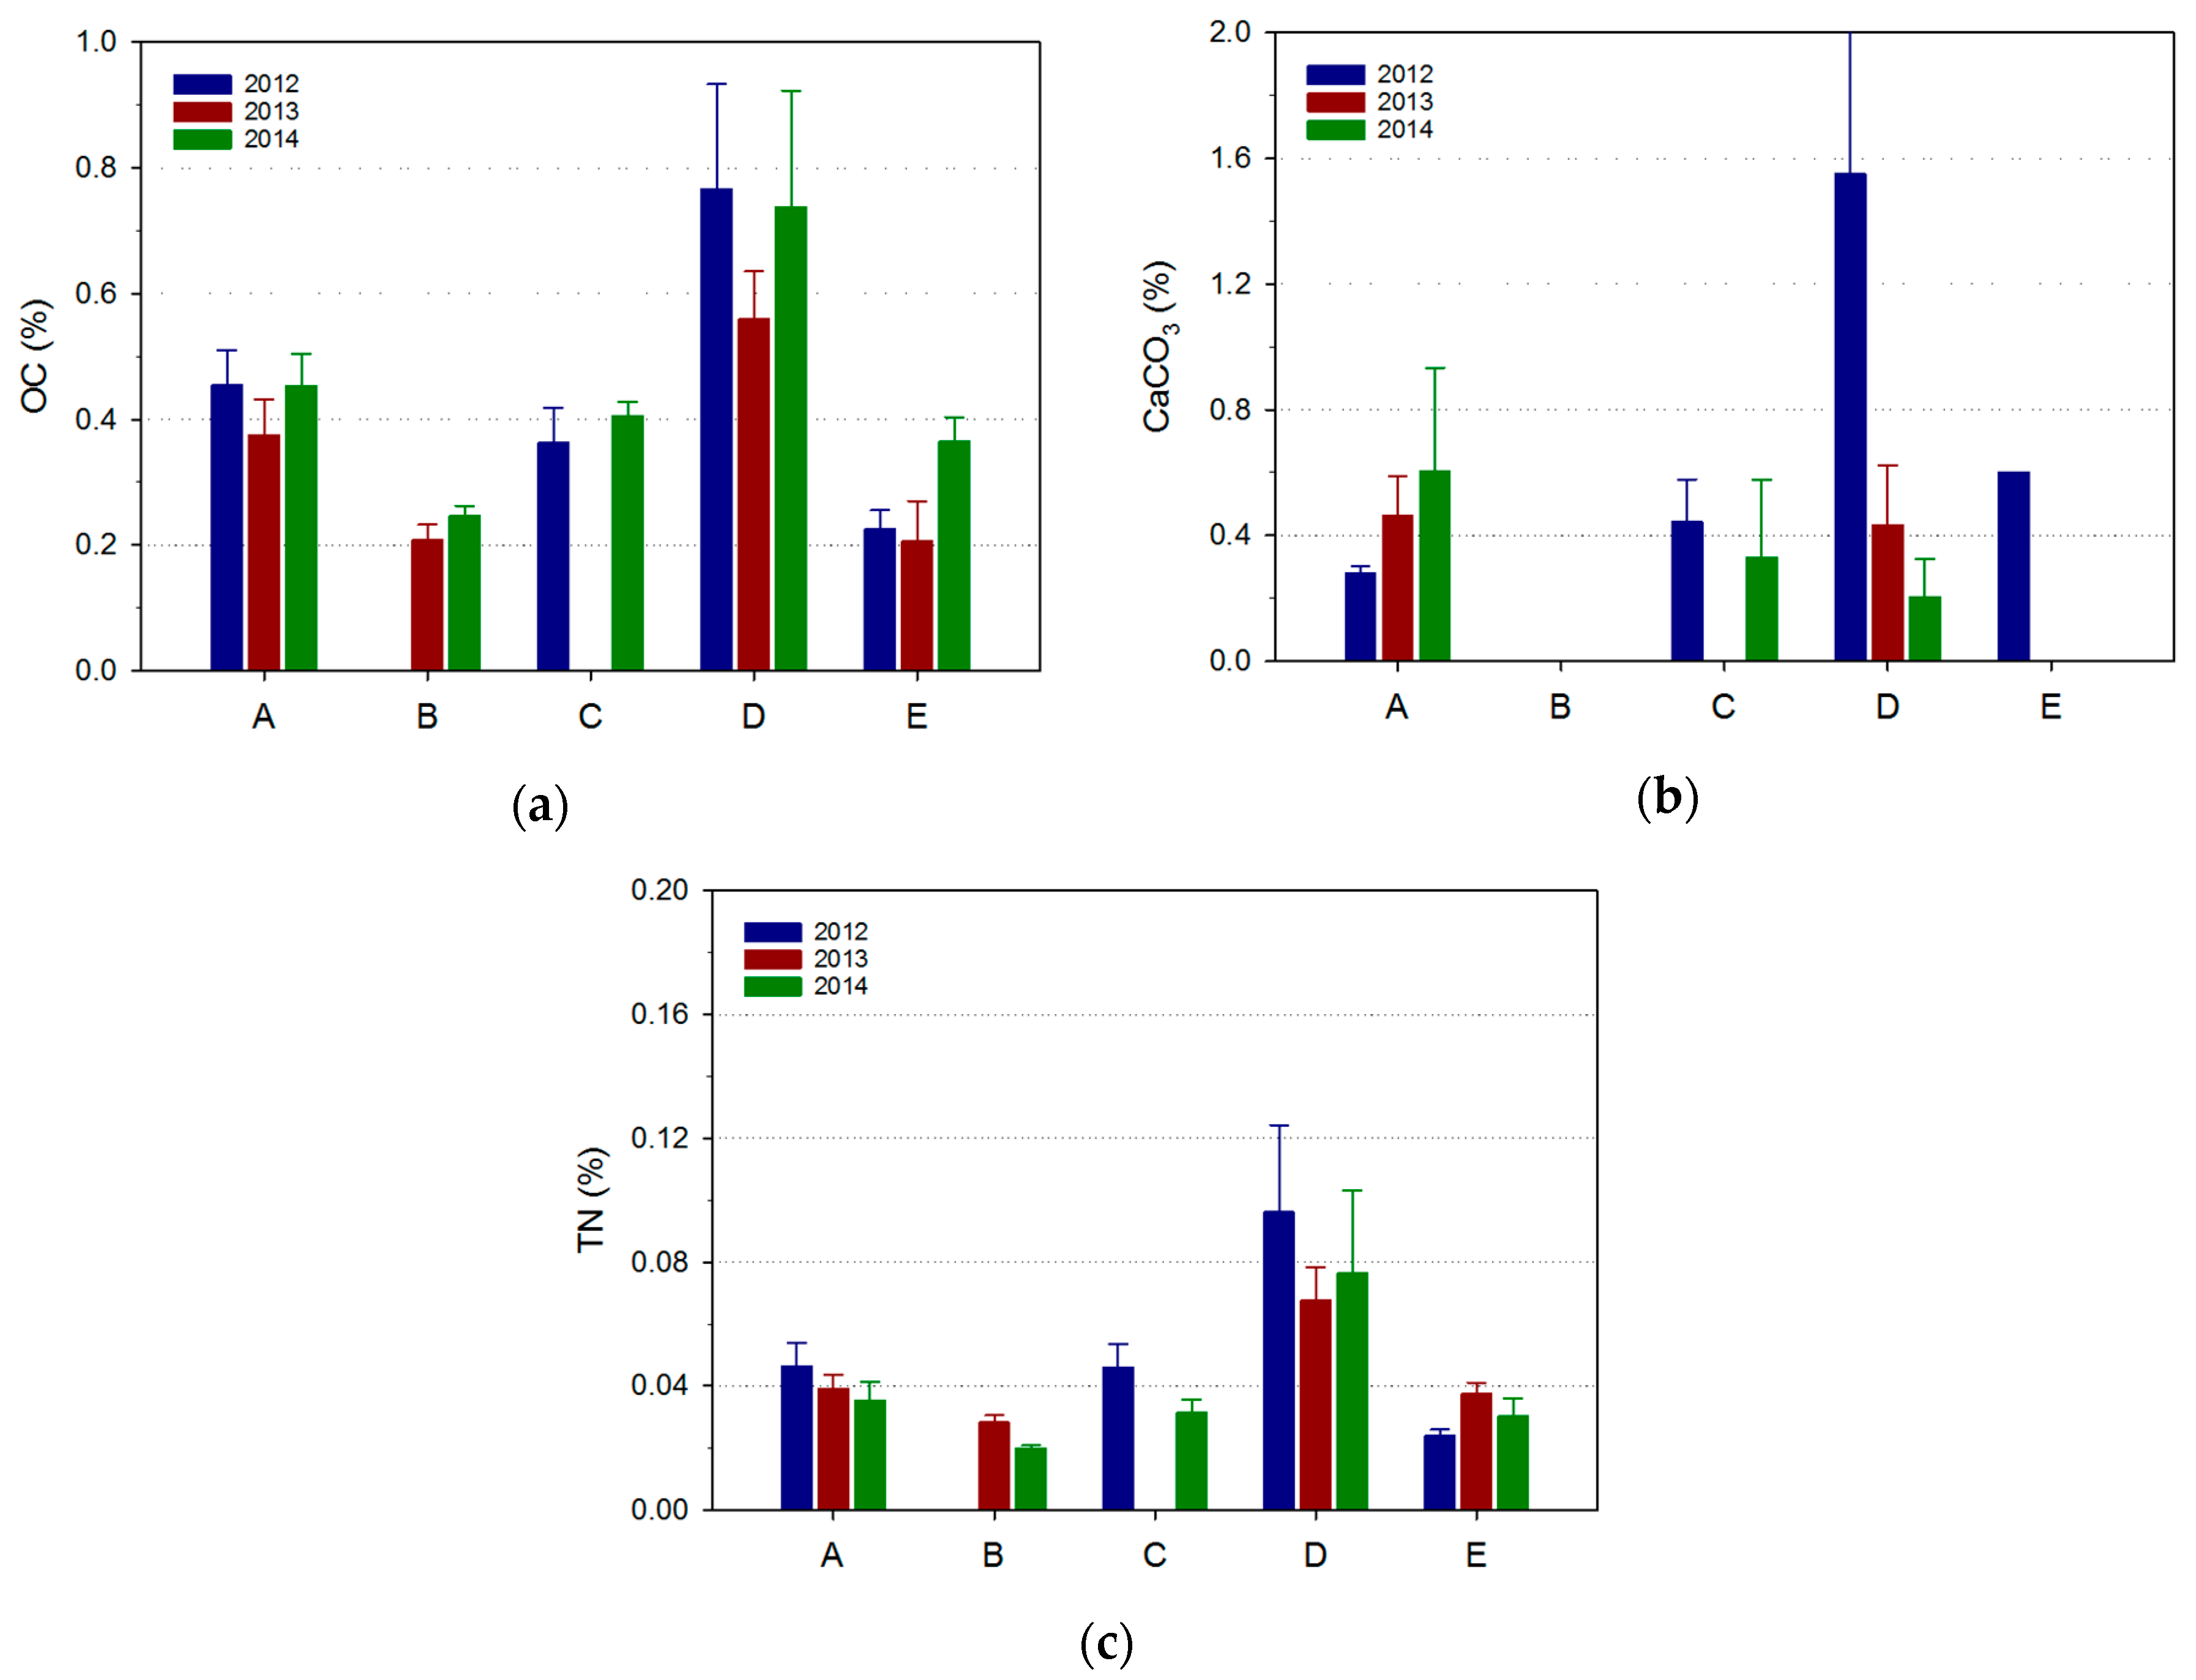
3.2. Soil Characteristics

All five recharge basins at the SAT site had variable soil characteristics overlying the alluvial aquifer, with preliminary studies [19] showing the top 0.2 m layer of soil largely consisted of a mix of brown silt and clay, with profiles to 2 m depths showing a mix of loamy sand to sandy clay loam. The predominantly sandy profile was reached at depths below 2 m, though there were lenses of sand dispersed around the 1–1.2 m depths as well as more clay/loam dominated lenses of soil. From the soil texture assessment, using the ‘ribboning technique’ [24], it has been observed that in the upper 50 cm profile, loamy sand dominates in Basin A with a more sandy loam prevalent in Basin E, which also dominates the deeper profile to 1.2 m depth. In Basin A, a greater spread of clay lenses through the profile was shown, especially from the 50 cm depth. These differences in texture through each of the basins impacted infiltration rates and hence volumes of water able to be recharged.
The average bulk density of the basin surface (to 10 cm depth) were also measured for each basin 1.82 ± 0.08 (Basin A), 1.81 ± 0.04 (Basin C), 1.71 ± 0.06 (Basin D) and 1.6 ± 0.11 g/cm3 (Basin E), which further supports the variability shown in the texture determination. Basin B operation was limited during the study period due to severe surface compaction as a result of excessive grading of its surface during construction and the flow valve malfunctioned in 2013 ceasing any flow for 4 months, so it was not included in the bulk density analysis. Nuclear density tensiometer tests revealed that Basin B exhibited a density ratio above 85% in the 0–150 mm interval, whilst the ratios remained consistently below 85% throughout the profile of the newer basins (D,E), where lighter machinery had been used during construction [15]. Ploughing and seeding of grass were not successful in remediating the compaction in Basin B; the infiltration rate improved after approximately 50% of the basin floor material was turned over to a depth of 700 mm in 2013.
Comparing the average total carbon and nitrogen present in the soil surface (2 cm depth) of each of the basins over a three year period 2012–2014, shows that Basins A, C and D had carbon present in organic and inorganic forms, whereas calcium carbonate was not present in Basins B and E (Figure 4). Bouwer et al. [27] has noted that precipitation of calcium carbonate on the SAT basin surface was induced by algae photosynthesis. The presence of algae in the recharge water can contribute to clogging when trapped on the basin surface. Carbon dioxide can also be adsorbed from the recharge water resulting in a rise in pH and super-saturation with respect to carbonate minerals which can induce precipitation of CaCO3 to further cement the ‘clogging layer’ [27]. Recharge water with high pH (>8) typically has a calcite saturation index >1. The presence of CaCO3 decreased significantly in Basin D over time, whereas Basins A and C remained relatively constant. The higher carbon and nitrogen levels present in Basins A, C and D also reflect the longer periods of recharge they have been exposed to prior to the expansion of the basins in 2011. There has been a minimal increase over time of organic carbon and nitrogen in basins A and E, with no increase in organic carbon measured in basins B, C and D, which indicates the ‘schmutzdecke’ is not developing rapidly on the basin surface and is being appropriately managed by the length of drying and wetting periods.

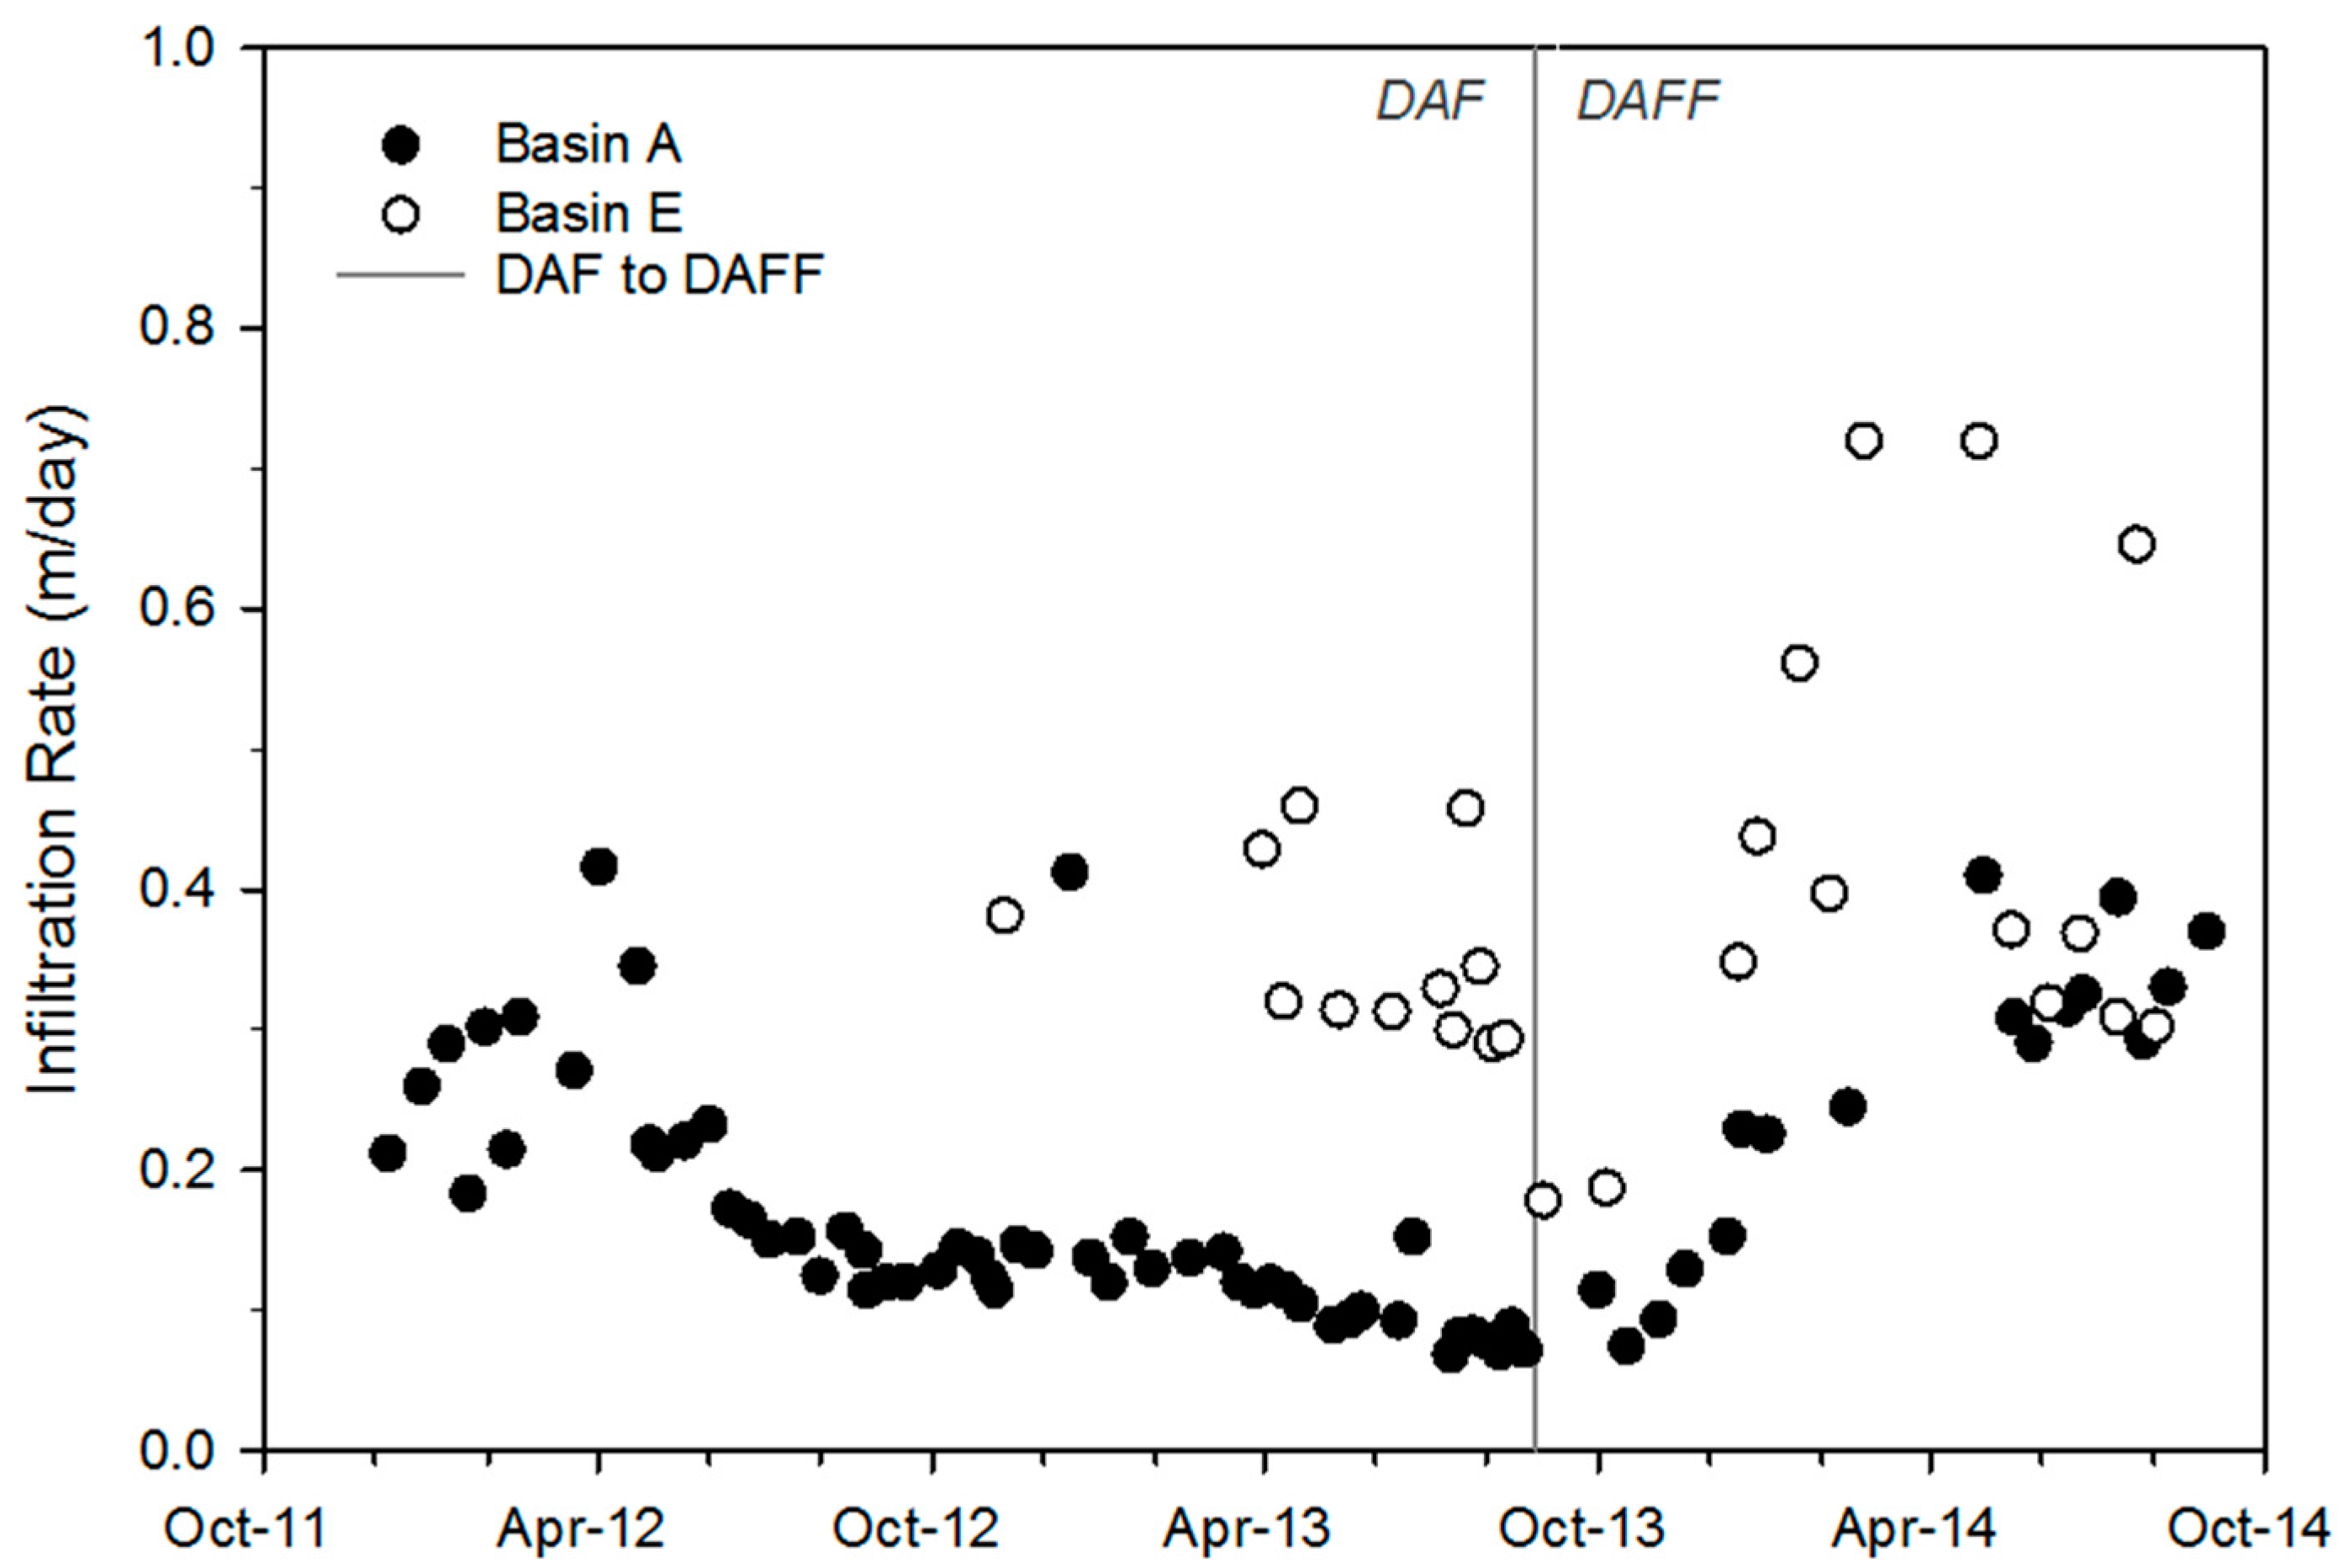
3.3. Hydraulic Performance

Over the six years of operation, 2008–2014, a total of 2.6 Mm3 has been delivered to the basins, with average infiltration rates in the uncompacted SAT basins, ranging from 0.14 to 1 m/day (Table 2). While this performance is sufficient to meet the initial license limit for recharge of 0.6 Mm3/year, it is feasible that the volume of wastewater recycled via the SAT basins could be increased. Based on the average infiltration rate in each basin with DAFF treatment prior to recharge (0.2 to 1 m/day, Table 2), suggests the basins have the potential to recharge over 3.6 × 10³/day (1.3 Mm3/year) if each basin is ‘wet’ for 20% of the year.
To assess the hydraulic performance of each of the five current recharge basins, which were completed in November 2011, a comparison can be made using wastewater derived from the two different water treatments, initially DAF (November 2011–August 2013) and then later DAFF (September 2013–August 2014). As discussed in Section 3.1 the implementation of filtration as an additional pre-treatment step improved the quality of recharge water to the SAT basins. This resulted in at least a 40% improvement in average infiltration rate in each of the five recharge basins, with basins A and C increasing from 0.14 to 0.17 m/day to 0.25 m/day with DAFF water and Basins E and D increasing from 0.5 to up to a 1 m/day, as shown in Table 2. The lowest infiltration rate in Basin B or 0.05 m/day was caused by compaction; this and a valve malfunction meant Basin B had minimal water delivered during the first year of operation as an expanded basin.
Comparing the infiltration rates of Basin A and E over time (Figure 5), during DAF recharge, Basin A showed an observable decline from approximately 0.3 m/day in early 2012 to less than 0.1 m/day by September 2013, whereas Basin E exhibited a higher infiltration rate consistently above 0.3 m/day. However with the upgrade to DAFF water in September 2013, infiltration rates in Basin A improved to 0.3 m/day in September 2014. At the start of DAFF recharge Basin E showed an initial drop in infiltration to 0.2 m/day in response to delivery of stagnant water from the pipeline during the treatment plant upgrade. Following this Basin E infiltration rates continued to improve to 0.3–0.7 m/day.
Groundwater levels adjacent to the SAT basins (RN17947) showed only a minor increase until the current, expanded configuration of recharge basins was employed. Since this time, groundwater levels have risen by approximately 4 m to 14 m below ground level. Groundwater levels have increased by 3 m in RN17942 and RN17999, 200 m and 500 m down-gradient respectively.
Infiltration rates for Basins D and E were typically three times higher than in the original smaller basins (A, B and C) regardless of recharge water pre-treatment, DAF or DAFF. In comparison Basins A and C both showed an improvement in infiltration rate with the improved recharge water quality; however, there was also an increase in average days drying between infiltration events over this period, which may have contributed. As discussed in Section 3.2, there was also considerable heterogeneity in soil properties in the upper 1.5 m evident among basins, which impacted infiltration rates. Basin A with a greater presence of clay lenses in the profile than Basin E which was predominantly sandy loam. So, while there were improvements in infiltration rates for all basins with improved water quality, the texture contrast between the A/C basins and the D/E basins shows how the infiltration rates are different between the pairs of basins. This heterogeneity between the basins, could not be resolved with the resources available. The final basin configuration had already covered the allocated area available for the SAT site and removal of further surficial layers by mechanical means would further risk the chance of compaction of the basin surface. However, removal of clay lenses in surficial layers could be considered during any future rehabilitation of the basin surface.
The drying period in the basins is important in breaking up the ‘schmutzdecke’ clogging layer that develops on the floor of the basin through repeated infiltration events. Basins A and C both showed significant development of this layer on the surface of the basin. Length of drying time required is also influenced by the seasons, with analysis of individual infiltration events throughout the year informing a recommendation that a minimum of 5 to 10 days in the summer and 20 days in the winter is required to maintain infiltration rates and allow the ‘schmutzdecke’ layer to break up. Breton [9] recommended that the preferred strategy for determining a suitable interval of drying would be to use the basin surface condition to inform operation of recharge to the basins.

4. Conclusions

Improvements in recharge water quality were achieved by sand filtration and UV disinfection, prior to recharge. An upgrade to treatment, from Dissolved Air Flotation (DAF) to include a filtration step (DAFF) improved the average infiltration rate per basin by 40% to 100%, with the greatest increases occurring in basins with the highest initial infiltration rates. This also coincided with an operational regime of increased drying periods between ‘fills’ for basins A and C. Despite the influence of operational practices such as pre-treatment and the duration of wet and dry conditions, the underlying soil characteristics remained significant influences on basin performance as they cannot be changed. Removal of less permeable sediment in the surficial layers could be considered during future basin surface rehabilitation. Average infiltration rates per basin varied by an order of magnitude from 0.1 to 1 m/day due to heterogeneous soil characteristics. However with improved management of drying times, especially during cooler winter months and the addition of filtration to the DAF plant, infiltration rates improved two fold across all of the basins, allowing the operators to recharge greater volumes to the basins.

Acknowledgments

This research was supported by the Australian Water Recycling Centre of Excellence, CSIRO, Power and Water Corporation, City West Water, Barwon Water and Water Corporation. The authors appreciate the thoughtful comments made by Dennis Gonzalez and Elise Bekele from CSIRO (internal review), the two anonymous journal reviewers and Pieter Stuyfzand, to improve this manuscript.

Author Contributions

Peter J. Dillon conceived and provided scientific oversight of the project; \protect\linebreak Joanne L. Vanderzalm, Karen E. Barry and Konrad Miotlinski conceived, performed and analyzed results of the SAT field investigations; Karen E. Barry was lead author of the paper, with contributions from all co-authors.

Conflicts of Interest

The authors declare no conflict of interest.

Abbreviations

The following abbreviations are used in this manuscript:
AHDAustralian height datum
ANAMMOXAnaerobic Ammonium Oxidation
AZRIArid Zone Research Institute
BDOCBiodegradable dissolved organic carbon
BODbiological oxygen demand
CSIROCommonwealth Scientific and Industrial Research Organisation
DAFdissolved air flotation
DAFFdissolved air flotation and filtration
DOdissolved oxygen
DOCdissolved organic carbon
ECelectrical conductivity
MARmanaged aquifer recharge
NTNorthern Territory
PVCpolyvinyl chloride
PWCPower and Water Corporation
SATSoil Aquifer Treatment
SCADAsupervisory control and data acquisition
TOCtotal organic carbon
TSStotal suspended solids
WRPwater reclamation plant

References

  1. Dillon, P.; Pavelic, P.; Page, D.; Beringen, H.; Ward, J. Managed Aquifer Recharge: An Introduction; Waterlines Report Series No. 13; National Water Commission: Canberra, Australia, 2009.
  2. Fox, P.; Houston, S.; Westerhoff, P.; Drewes, J.E.; Nellor, M.; Yanko, B.; Baird, R.; Rincon, M.; Arnold, R.; Lansey, K.; et al. An Investigation of Soil Aquifer Treatment for Sustainable Water Reuse; AWWA Research Foundation and American Water Works Association: Denver, CO, USA, 2001. [Google Scholar]
  3. Parsons, S.; Dillon, P.; Irvine, E.; Hollard, G.; Kaufman, C. Progress in Managed Aquifer Recharge in Australia; Waterlines Report Series No. 73; National Water Commission: Canberra, Australia, 2012.
  4. Hutchinson, A.; Milczarek, M.; Banerjee, M. Clogging phenomena related to surface water recharge facilities. In Clogging Issues Associated with Managed Aquifer Recharge Methods; Martin, R., Ed.; IAH Commission on Managing Aquifer Recharge: Reading, UK, 2013; pp. 34–49. Available online: https://recharge.iah.org/working-groups/clogging-and-its-management (accessed on 2 March 2017).
  5. Rinck-Pfeiffer, S.; Dillon, P.; Ragusa, S.; Hutson, J.; Fallowfield, H.; de Marsily, G.; Pavelic, P. Reclaimed water for aquifer storage and recovery: A column study of well clogging. In Clogging Issues Associated with Managed Aquifer Recharge Methods; Martin, R., Ed.; IAH Commission on Managing Aquifer Recharge: Reading, UK, 2013; pp. 26–33. Available online: https://recharge.iah.org/working-groups/clogging-and-its-management (accessed on 2 March 2017).
  6. Houston, S.L.; Duryea, P.D.; Hong, R. Infiltration considerations for ground-water recharge with waste effluent. J. Irrig. Drain. Eng. 1999, 125, 264–272. [Google Scholar] [CrossRef]
  7. Escalante, F.; Enrique, A. Practical Criteria in the Design and Maintenance of MAR Facilities in order to minimize clogging impacts obtained from two different operative sites in Spain. In Clogging Issues Associated with Managed Aquifer Recharge Methods; Martin, R., Ed.; IAH Commission on Managing Aquifer Recharge: Reading, UK, 2013; pp. 26–33. Available online: https://recharge.iah.org/working-groups/clogging-and-its-management (accessed on 2 March 2017).
  8. Pavelic, P.; Dillon, P.J.; Barry, K.E.; Vanderzalm, J.L.; Correll, R.L.; Rinck-Pfeiffer, S.M. Water quality effects on clogging rates during reclaimed water ASR in a carbonate aquifer. J. Hydrol. 2007, 334, 1–16. [Google Scholar] [CrossRef]
  9. Breton, M. Alice Springs Soil Aquifer Treatment; Operational Review and Hydraulic Performance. Master’s Thesis, University of Technology, Sydney, Australia, 2009. [Google Scholar]
  10. Racz, A.J.; Fisher, A.T.; Schmidt, C.M.; Lockwood, B.S.; Los Huertos, M. Spatial and Temporal Infiltration Dynamics during Managed aquifer Recharge; Ground Water 50, No. 4; National Ground Water Association: Malden, MA, USA, 2012; pp. 562–570. [Google Scholar]
  11. Grischek, T.; Schubert, J.; Jasperse, J.L.; Stowe, S.M.; Collins, M.R. What is the appropriate site for RBF? In Proceedings of the 6th International Symposium on Managed Aquifer Recharge, Phoenix, AZ, USA, 29 October–2 November 2007.
  12. Peyton, D. Modified recharge basin floors to control sediment and maximize infiltration efficiency. In Management of Aquifer Recharge for Sustainability, Proceedings of the 4th International Symposium on Managed Aquifer Recharge, Adelaide, South Australia, 22–26 September 2002; Dillon, P., Ed.; August Aimé Balkema: Lisse, The Netherlands, 2002. [Google Scholar]
  13. Vanderzalm, J.L.; Dillon, P.J.; Tapsuwan, S.; Pickering, P.; Arnold, N.; Bekele, E.B.; Barry, K.E.; Donn, M.J.; McFarlane, D. Economics and Experiences of Managed Aquifer Recharge (MAR) with Recycled Water in Australia; Australian Water Recycling Centre of Excellence: Brisbane, QLD Australia, 2015. [Google Scholar]
  14. Barry, K.; Vanderzalm, J.; Bekele, E.; Donn, M.; Miotlinski, K.; Dillon, P. Assessing infiltration rates and clogging impacts during recycled water managed aquifer recharge (MAR) in Floreat (WA) and Alice Springs (NT), Australia. In Proceedings of the 9th International Symposium on Managed Aquifer Recharge, Mexico City, Mexico, 20–24 June 2016.
  15. Bekele, E.B.; Donn, M.J.; Barry, K.E.; Vanderzalm, J.L.; Kaksonen, A.H.; Puzon, G.J.; Wylie, J.; Miotlinski, K.; Cahill, K.; Walsh, T.; et al. Managed Aquifer Recharge and Recycling Options (MARRO): Understanding Clogging Processes and Water Quality Impacts; Australian Water Recycling Centre of Excellence: Brisbane, QLD, Australia, 2015. [Google Scholar]
  16. Knapton, A.; Jolly, P.; Pavelic, P.; Pavelic, P.; Dillon, P.; Barry, K.; Mucha, M.; Gates, W. Feasibility of a Pilot 600 ML/yr Soil Aquifer Treatment Plant at the Arid Zone Research Institute; Department of Infrastructure Planning and Environment Technical Report 29/2004; Northern Territory Government: Palmerston, NT, Australia, 2004.
  17. Quinlan, T.; Woolley, D.R. Geology and Hydrology, Alice Springs Town and Inner Farm Basins, Northern Territory; Bulletin 89; Department of Natural Development, Bureau of Mineral Resources, Geology and Geophysics: Canberra, ACT, Australia, 1969.
  18. Berry, K. Monitoring Development Alice Springs Commonage; WRD910002; NT Government, Power and Water Authority, Water Resources Branch: Darwin, NT, Australia, 1991.
  19. Miotliński, K.; Barry, K.; Dillon, P.; Breton, M. Alice Springs Soil Aquifer Treatment Project—Hydrological and Water Quality Monitoring 2008–2009 Report; Water for a Healthy Country Flagship Report; Commonwealth Scientific Industrial Research Organisation (CSIRO): Canberra, ACT, Australia, 2010. [Google Scholar]
  20. Wischusen, J.D.H. Alice Springs Soil Aquifer Treatment Scheme: Construction and Sampling of Monitoring Bores 2006; NT-NRETA Water Resources Branch Report 26/2007A; Northern Territory Government, Department of Natural Resources, Environment and the Arts: Alice Springs, NT, Australia, 2007.
  21. Pavelic, P.; Dillon, P.J.; Mucha, M.; Nakai, T.; Barry, K.E.; Bestland, R. Laboratory assessment of factors affecting soil clogging of soil aquifer treatment systems. Water Res. 2011, 45, 3153–3163. [Google Scholar] [CrossRef] [PubMed]
  22. Abel, C.D.T.; Sharma, S.; Lamolo, Y.N.; Maeng, S.K.; Kennedy, M.D.; Amy, G.L. Attenuation of Bulk Organic Matter, Nutrients (N and P), and Pathogen indicators During Soil Passage: Effect of Temperature and Redox Conditions in Simulated Soil Aquifer Treatment (SAT). Water Air Soil Pollut. 2012, 223, 5205–5220. [Google Scholar] [CrossRef]
  23. Gates, W.; Janik, L.; Pavelic, P.; Dillon, P.; Barry, K. Characterisation of the Physical and Geochemical Properties and Infrared Spectra of Five Soil Cores at the AZRI Site near Alice Springs, Northern Territory; CSIRO Water for a Healthy Country Flagship Report; Commonwealth Scientific Industrial Research Organisation (CSIRO): Canberra, ACT, Australia, 2009. [Google Scholar]
  24. McDonald, R.C.; Isbell, R.F.; Speight, J.G.; Walker, J.; Hopkins, M.S. Australian Soil and Land Survey Handbook; Commonwealth Scientific Industrial Research Organisation (CSIRO): Canberra, ACT, Australia, 1990. [Google Scholar]
  25. Pérez-Paricio, A. Integrated Modelling of Clogging Processes in Artificial Groundwater Recharge. Ph.D. Thesis, Technical University of Catalonia (UPC), Barcelona, Spain, 2000. [Google Scholar]
  26. Unpublished Data—to Be Published in CSIRO Data Access Portal. Available online: http://hdl.handle.net/102.100.100/25155 (accessed on 28 February 2017).
  27. Bouwer, H.; Rice, R.C.; Lance, J.C.; Gilbert, R.G. Rapid-infiltration research at Flushing Meadows Project, Arizona. Water Pollut. Control Fed. 1980, 52, 2457–2470. [Google Scholar]
Figure 1. Location of soil aquifer treatment (SAT) study site, in the outer basin [15].
Water 09 00179 g001
Figure 2. Cross-section of lithology along palaeochannel, after Wischusen 2007 [20]; arrow indicates direction of groundwater flow.
Water 09 00179 g002
Figure 3. Outline of five current SAT basins, location of soil sampling and near basin monitoring wells (bore) used throughout the study [15].
Water 09 00179 g003
Figure 4. Average percent: (a) organic carbon (OC); (b) calcium carbonate (CaCO3); and (c) total nitrogen (TN) presence in the five SAT basins in 2012, 2013 and 2014 (error bars represent the variability between samples from each basin) [26].
Water 09 00179 g004
Figure 5. Infiltration rates (m/day) in Basins A and E during DAF and DAFF recharge over time.
Water 09 00179 g005
Table 1. Water quality data (mean and standard deviation) for ambient groundwater (GW), recharge water (DAF, DAFF) and groundwater (GW) adjacent to the soil aquifer treatment scheme [26].
All Units mg/L unless SpecifiedAmbient GW (n = 8)DAF a (n = 23)DAFF b (n = 12)GW Adjacent to SAT Basins (n = 22) c
pH (-)7.4 ± 0.27.8 ± 0.17.7 ± 0.37.4 ± 0.15
Alkalinity-374 ± 30275 ± 51302 ± 16
EC (µS/cm)2400 ± 7001846 ± 1571728 ± 1431940 ± 403
TSS-9 ± 3<5-
Cl399 ± 139271 ± 40265 ± 28304 ± 95
SO4508 ± 30150 ± 40168 ± 68248 ± 140
Total-N2.8 ± 2.116 ± 59.2 ± 49.3 ± 5.3
Nitrate-N2.6 ± 2.01.1 ± 0.91.8 ± 1.29.4 ± 3.6
Ammonium-N0.02 ± 0.0112 ± 5.94.9 ± 4.8<1
Phosphate-P0.05 ± 0.051.1 ± 0.50.4 ± 0.20.26 ± 0.27
Soluble-P0.03 ± 0.030.8 ± 0.60.2 ± 0.20.04 ± 0.01
BOD-10 ± 121.1 ± 0.7-
DOC1.6 ± 0.59.4 ± 1.78.3 ± 1.61.9 ± 0.5
Notes: a November 2011–August 2013; b September 2013–August 2014; c Bore RN17947.
Table 2. Summary of infiltration rate, drying/wetting times for each of the five basins for DAF and DAFF treated recharge water [26].
BasinABCDE
DAFn5724 a463016
Infiltration rate (m/day)0.17 ± 0.100.05 ± 0.060.14 ± 0.050.50 ± 0.200.55 ± 0.46
Drying Time (day)7 ± 317 ± 158 ± 512 ± 812 ± 8
Wetting Time (day)4 ± 17 ± 44 ± 12 ± 12 ± 1
DAFFn1716141519
Infiltration rate (m/day)0.25 ± 0.100.20 ± 0.030.25 ± 0.101.0 ± 0.40.75 ± 0.52
Drying Time (day)10 ± 210 ± 810 ± 610 ± 511 ± 6
Wetting Time (day)3 ± 22 ± 13 ± 13 ± 13 ± 1
Notes: a Basin affected by compaction during construction; 50% of floor material turned over to depth of 700 mm (2013).

