Next Issue
Volume 5, June
Previous Issue
Volume 4, December


Climate, Volume 5, Issue 1 (March 2017) – 24 articles

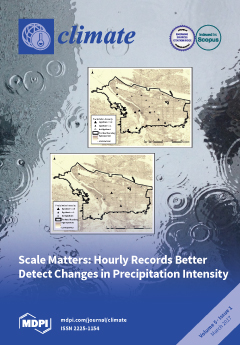
Cover Story (view full-size image): We investigated temporal resolution and its effect on trend detection in precipitation records in Portland, OR, USA. Daily and hourly precipitation intensity were examined using Kendall’s tau for the period of 1999–2015. The Simple Daily Intensity Index (SDII) measures intensity at both scales. Results indicate the superiority of hourly data for trend detection when compared with daily. Hourly data provided more statistically significant trends. Increasing trends were concentrated in spring at both scales, which appeared to be associated with increased precipitation volume. View the paper
  • Issues are regarded as officially published after their release is announced to the table of contents alert mailing list.
  • You may sign up for e-mail alerts to receive table of contents of newly released issues.
  • PDF is the official format for papers published in both, html and pdf forms. To view the papers in pdf format, click on the "PDF Full-text" link, and use the free Adobe Reader to open them.
Order results
Result details
Section
Select all
Export citation of selected articles as:
1109 KiB  
Article
Future Climate of Colombo Downscaled with SDSM-Neural Network
by Singay Dorji, Srikantha Herath and Binaya Kumar Mishra
Climate 2017, 5(1), 24; https://doi.org/10.3390/cli5010024 - 22 Mar 2017
Cited by 16 | Viewed by 6409
Abstract
The Global Climate Model (GCM) run at a coarse spatial resolution cannot be directly used for climate impact studies. Downscaling is required to extract the sub-grid and local scale information. This paper investigates if the artificial neural network (ANN) is better than the [...] Read more.
The Global Climate Model (GCM) run at a coarse spatial resolution cannot be directly used for climate impact studies. Downscaling is required to extract the sub-grid and local scale information. This paper investigates if the artificial neural network (ANN) is better than the widely-used regression-based statistical downscaling model (SDSM) for downscaling climate for a site in Colombo, Sri Lanka. Based on seasonal and annual model biases and the root mean squared error (RMSE), the ANN performed better than the SDSM for precipitation. This paper proposes a novel methodology for improving climate predictions by combining SDSM with neural networks. This method will allow a user to apply SDSM with a neural network model for higher skills in downscaling. The study uses the Canadian Earth System Model (CanESM2) of the IPCC Fifth Assessment Report, reanalysis from the National Center for Environmental Prediction (NCEP), and the Asian Precipitation Highly Resolved Observational Data Integration towards Evaluation of Water Resources (APHRODITE) project data as the observation. SDSM and the focused time-delayed neural network (TDNN) models are used for the downscaling. The projected annual increase for Representative Concentration Pathway (RCP) is 8.5; the average temperature is 2.83 °C (SDSM) and 3.03 °C (TDNN), and rainfall is 33% (SDSM) and 63% (TDNN) for 2080’s. Full article
Show Figures

Figure 1

276 KiB  
Review
A Short Critical History on the Development of Meteorology and Climatology
by Gustavo Zen de Figueiredo Neves, Nuria Pérez Gallardo and Francisco Arthur da Silva Vecchia
Climate 2017, 5(1), 23; https://doi.org/10.3390/cli5010023 - 09 Mar 2017
Cited by 6 | Viewed by 5958
Abstract
The present study presents a brief discussion regarding the evolution of meteorology from the sixteenth to the twenty-first century, throughout antiquitiy, Aristotle’s legacy, and contemporaneity. Part of the text is dedicated to illustrating the emergence of Brazilian climatology and a new paradigm, postulating [...] Read more.
The present study presents a brief discussion regarding the evolution of meteorology from the sixteenth to the twenty-first century, throughout antiquitiy, Aristotle’s legacy, and contemporaneity. Part of the text is dedicated to illustrating the emergence of Brazilian climatology and a new paradigm, postulating physical geography and the French School of Climatology and Meteorology. Full article
(This article belongs to the Special Issue Studies and Perspectives of Climatology in Brazil)
3372 KiB  
Article
Spatial and Temporal Responses of Soil Erosion to Climate Change Impacts in a Transnational Watershed in Southeast Asia
by Pham Quy Giang, Le Thi Giang and Kosuke Toshiki
Climate 2017, 5(1), 22; https://doi.org/10.3390/cli5010022 - 06 Mar 2017
Cited by 18 | Viewed by 7983
Abstract
It has been widely predicted that Southeast Asia is among the regions facing the most severe climate change impacts. Despite this forecast, little research has been published on the potential impacts of climate change on soil erosion in this region. This study focused [...] Read more.
It has been widely predicted that Southeast Asia is among the regions facing the most severe climate change impacts. Despite this forecast, little research has been published on the potential impacts of climate change on soil erosion in this region. This study focused on the impact of climate change on spatial and temporal patterns of soil erosion in the Laos–Vietnam transnational Upper Ca River Watershed. The Soil and Water Assessment Tool (SWAT) coupled with downscaled global climate models (GCMs) was employed for simulation. Soil erosion in the watershed was mostly found as “hill-slope erosion”, which occurred seriously in the upstream area where topography is dominated by numerous steep hills with sparse vegetation cover. However, under the impact of climate change, it is very likely that soil erosion rate in the downstream area will increase at a higher rate than in its upstream area due to a greater increase in precipitation. Seasonally, soil erosion is predicted to increase significantly in the warmer and wetter climate of the wet season, when higher erosive power of an increased amount and intensity of rainfall is accompanied by higher sediment transport capacity. The results of this study provide useful information for decision makers to plan where and when soil conservation practice should be focused. Full article
Show Figures

Figure 1

2009 KiB  
Article
Linkage between Water Level Dynamics and Climate Variability: The Case of Lake Hawassa Hydrology and ENSO Phenomena
by Mulugeta Dadi Belete, Bernd Diekkrüger and Jackson Roehrig
Climate 2017, 5(1), 21; https://doi.org/10.3390/cli5010021 - 06 Mar 2017
Cited by 19 | Viewed by 8056
Abstract
Lake Hawassa is a topographically closed lake in the Central Main Ethiopian Rift Valley. The water level of this lake has been reported to dramatically rise without falling back to the original level. The cause of this rise is not yet sufficiently investigated [...] Read more.
Lake Hawassa is a topographically closed lake in the Central Main Ethiopian Rift Valley. The water level of this lake has been reported to dramatically rise without falling back to the original level. The cause of this rise is not yet sufficiently investigated and subjected to this study. This study argues that the general variability in the lake level and its resultant rise has significant linkage to the temperature variability at the Pacific Ocean. The linkage between water level dynamics and climate variability was analyzed through the application of diverse statistical techniques. It comprises the Mann-Kendall trend analysis to test monotonic variations over time; sequential regime shift index (RSI) to detect significant shifts in the mean values of time-series records of lake level; and coherence analysis to investigate the linear relationship between ENSO index and records of local hydrology. Despite the multiple rises and falls, the results of the trend analysis revealed that the lake level experienced a significant resultant upward trend with Mann-Kendall τ values of 0.558, 0.629, and 0.545 (at α = 0.05 and p < 0.01%) for monthly maximum, average and minimum values respectively. The sequential regime shift evidenced that most of the significant shifts coincide with the occurrences of ENSO events. Generally, the lake level tends to be high during El Niño and low during La Niña episodes. The typical examples are the coincidence of extreme historical maximum lake level to the strongest El Niño event of the century that occurred in 1997/98 and the lowest lake level record in the year 1975 with a strong La Niña year. The coincidence of climate regime shift in the Pacific Ocean in 1976/77 with an equivalent regime shift in the lake level is an additional confirmation for the possible climate-hydrology linkage. The likely involvement of anthropogenic factors (at least in modifying the effect of climate) is justified by the interplay between the non-trending rainfall and potential evapotranspiration and trending streamflow. The coherence analysis between 492 pairs of monthly step datasets of 3.4ENSO index and lake level changes is also found to have a significant linear relationship over frequencies ranging from 0.13 to 0.14 cycles/month or 1.56 to 1.68 cycles/year. This corresponds to a dominant average periodicity (coincident cycle) of about 7.4 months which is thought to be related to the time span of the two rainy season in the locality. Full article
Show Figures

Figure 1

1781 KiB  
Article
Assessing Climate Driven Malaria Variability in Ghana Using a Regional Scale Dynamical Model
by Ernest O. Asare and Leonard K. Amekudzi
Climate 2017, 5(1), 20; https://doi.org/10.3390/cli5010020 - 05 Mar 2017
Cited by 14 | Viewed by 6972
Abstract
Malaria is a major public health challenge in Ghana and adversely affects the productivity and economy of the country. Although malaria is climate driven, there are limited studies linking climate variability and disease transmission across the various agro-ecological zones in Ghana. We used [...] Read more.
Malaria is a major public health challenge in Ghana and adversely affects the productivity and economy of the country. Although malaria is climate driven, there are limited studies linking climate variability and disease transmission across the various agro-ecological zones in Ghana. We used the VECTRI (vector-borne disease community model of the International Centre for Theoretical Physics, Trieste) model with a new surface hydrology scheme to investigate the spatio-temporal variability in malaria transmission patterns over the four agro-ecological zones in Ghana. The model is driven using temperature and rainfall datasets obtained from the GMet (Ghana Meteorological Agency) synoptic stations between 1981 and 2010. In addition, the potential of the VECTRI model to simulate seasonal pattern of local scale malaria incidence is assessed. The model results reveal that the simulated malaria transmission follows rainfall peaks with a two-month time lag. Furthermore, malaria transmission ranges from eight to twelve months, with minimum transmission occurring between February and April. The results further reveal that the intra- and inter-agro-ecological variability in terms of intensity and duration of malaria transmission are predominantly controlled by rainfall. The VECTRI simulated EIR (Entomological Inoculation Rate) tends to agree with values obtained from field surveys across the country. Furthermore, despite being a regional model, VECTRI demonstrates useful skill in reproducing monthly variations in reported malaria cases from Emena hospital (a peri urban town located within Kumasi metropolis). Although further refinements in this surface hydrology scheme may improve VECTRI performance, VECTRI still possesses the potential to provide useful information for malaria control in the tropics. Full article
Show Figures

Figure 1

3231 KiB  
Article
Assessing River Low-Flow Uncertainties Related to Hydrological Model Calibration and Structure under Climate Change Conditions
by Mélanie Trudel, Pierre-Louis Doucet-Généreux and Robert Leconte
Climate 2017, 5(1), 19; https://doi.org/10.3390/cli5010019 - 03 Mar 2017
Cited by 18 | Viewed by 4660
Abstract
Low-flow is the flow of water in a river during prolonged dry weather. This paper investigated the uncertainty originating from hydrological model calibration and structure in low-flow simulations under climate change conditions. Two hydrological models of contrasting complexity, GR4J and SWAT, were applied [...] Read more.
Low-flow is the flow of water in a river during prolonged dry weather. This paper investigated the uncertainty originating from hydrological model calibration and structure in low-flow simulations under climate change conditions. Two hydrological models of contrasting complexity, GR4J and SWAT, were applied to four sub-watersheds of the Yamaska River, Canada. The two models were calibrated using seven different objective functions including the Nash-Sutcliffe coefficient (NSEQ) and six other objective functions more related to low flows. The uncertainty in the model parameters was evaluated using a PARAmeter SOLutions procedure (PARASOL). Twelve climate projections from different combinations of General Circulation Models (GCMs) and Regional Circulation Models (RCMs) were used to simulate low-flow indices in a reference (1970–2000) and future (2040–2070) horizon. Results indicate that the NSEQ objective function does not properly represent low-flow indices for either model. The NSE objective function applied to the log of the flows shows the lowest total variance for all sub-watersheds. In addition, these hydrological models should be used with care for low-flow studies, since they both show some inconsistent results. The uncertainty is higher for SWAT than for GR4J. With GR4J, the uncertainties in the simulations for the 7Q2 index (the 7-day low-flow value with a 2-year return period) are lower for the future period than for the reference period. This can be explained by the analysis of hydrological processes. In the future horizon, a significant worsening of low-flow conditions was projected. Full article
Show Figures

Figure 1

4102 KiB  
Article
Long Term Spatiotemporal Variability in Rainfall Trends over the State of Jharkhand, India
by Shonam Sharma and Prasoon Kumar Singh
Climate 2017, 5(1), 18; https://doi.org/10.3390/cli5010018 - 02 Mar 2017
Cited by 28 | Viewed by 9643
Abstract
The current study was conducted to examine the impact of climate change on rainfall in Jharkhand state of India. It deals with the analysis of the historical spatiotemporal variability of rainfall on the annual, seasonal and monthly scale in 18 districts of the [...] Read more.
The current study was conducted to examine the impact of climate change on rainfall in Jharkhand state of India. It deals with the analysis of the historical spatiotemporal variability of rainfall on the annual, seasonal and monthly scale in 18 districts of the state Jharkhand over a period of 102 years (1901–2002). Mann-Kendall trend test and Sen’s slope method were applied to detect trends and the magnitude of change over the time period of 102 years (1901–2002). Mann Whitney Pettit’s method and Cumulative deviations test were applied for detection of shift point in the series. The results obtained year 1951 to be the most probable shift point in annual rainfall. The trend analysis along with the percent change for the data series before (1901–1951) and after the shift point (1952–2002) was also done. A significant downward rainfall trend was found in annual, monsoon and winter rainfall over the period of 102 years. The maximum decrease was found for the Godda (19.77%) and minimum at Purbi Singhbum station (1.95%). Trend analysis before shift point, i.e., during 1901–1951 showed an upward trend in annual rainfall and after shift point (1952–2002) a downward trend. The trend analysis for entire Jharkhand demonstrated a significant downward trend in annual and monsoon rainfall with a decrease of 14.11% and 15.65% respectively. A downward trend in seasonal rainfall will have a more pronounced effect on agricultural activities in the area as it may affect the growth phase of the kharif crops (May–October) in the region. Full article
Show Figures

Figure 1

1116 KiB  
Article
The Influence of the Antarctic Oscillation (AAO) on Cold Waves and Occurrence of Frosts in the State of Santa Catarina, Brazil
by Maikon Passos A. Alves, Rafael Brito Silveira, Rosandro Boligon Minuzzi and Alberto Elvino Franke
Climate 2017, 5(1), 17; https://doi.org/10.3390/cli5010017 - 02 Mar 2017
Cited by 5 | Viewed by 6026
Abstract
This paper examines the relationship between the Antarctic Oscillation (AAO), cold waves and occurrence of frosts in the state of Santa Catarina, Brazil, during the winter quarter. Research on this topic can assist different spheres of society, such as public health and agriculture, [...] Read more.
This paper examines the relationship between the Antarctic Oscillation (AAO), cold waves and occurrence of frosts in the state of Santa Catarina, Brazil, during the winter quarter. Research on this topic can assist different spheres of society, such as public health and agriculture, since cold waves can influence and/or aggravate health problems and frosts can inflict economic losses especially in the agricultural sector. For the purpose of this paper, cold wave is considered as the event in which the daily average surface air temperature was at least two standard deviations below the average value of the series on the day and for two consecutive days or more. The data on the average air temperature and frost occurrences are provided by the Company of Agricultural Research and Rural Extension of Santa Catarina/Center for Environmental Information and Hydrometeorology (EPAGRI/CIRAM). The AAO was subjected to statistical analysis using significance tests for the averages (Student’s t-test) and variances (F-test) with a significance level of α = 5%. The results show that cold waves are unevenly distributed in the agroecological zones of Santa Catarina. It is found that the AAO is associated with the occurrence of frosts (in the agroecological zones represented by the municipalities of Itajaí and São José) in the state of Santa Catarina. Full article
(This article belongs to the Special Issue Studies and Perspectives of Climatology in Brazil)
Show Figures

Figure 1

1743 KiB  
Article
Long-Term Climate Trends and Extreme Events in Northern Fennoscandia (1914–2013)
by Sonja Kivinen, Sirpa Rasmus, Kirsti Jylhä and Mikko Laapas
Climate 2017, 5(1), 16; https://doi.org/10.3390/cli5010016 - 26 Feb 2017
Cited by 52 | Viewed by 9318
Abstract
We studied climate trends and the occurrence of rare and extreme temperature and precipitation events in northern Fennoscandia in 1914–2013. Weather data were derived from nine observation stations located in Finland, Norway, Sweden and Russia. The results showed that spring and autumn temperatures [...] Read more.
We studied climate trends and the occurrence of rare and extreme temperature and precipitation events in northern Fennoscandia in 1914–2013. Weather data were derived from nine observation stations located in Finland, Norway, Sweden and Russia. The results showed that spring and autumn temperatures and to a lesser extent summer temperatures increased significantly in the study region, the observed changes being the greatest for daily minimum temperatures. The number of frost days declined both in spring and autumn. Rarely cold winter, spring, summer and autumn seasons had a low occurrence and rarely warm spring and autumn seasons a high occurrence during the last 20-year interval (1994–2013), compared to the other 20-year intervals. That period was also characterized by a low number of days with extremely low temperature in all seasons (4–9% of all extremely cold days) and a high number of April and October days with extremely high temperature (36–42% of all extremely warm days). A tendency of exceptionally high daily precipitation sums to grow even higher towards the end of the study period was also observed. To summarize, the results indicate a shortening of the cold season in northern Fennoscandia. Furthermore, the results suggest significant declines in extremely cold climate events in all seasons and increases in extremely warm climate events particularly in spring and autumn seasons. Full article
(This article belongs to the Special Issue Climate Extremes, the Past and the Future)
Show Figures

Figure 1

5669 KiB  
Article
Dust Climatology of the NASA Dryden Flight Research Center (DFRC) in Lancaster, California, USA
by Ashok K. Pokharel and Michael L. Kaplan
Climate 2017, 5(1), 15; https://doi.org/10.3390/cli5010015 - 25 Feb 2017
Cited by 8 | Viewed by 6045
Abstract
Abstract: A 15-year (1997–2011) climatology of dust events at the NASA DFRC in Lancaster, California, USA, was performed to evaluate how the extratropical systems were associated with dust storms over this region. For this study, we collected meteorological data for Edwards Air Force [...] Read more.
Abstract: A 15-year (1997–2011) climatology of dust events at the NASA DFRC in Lancaster, California, USA, was performed to evaluate how the extratropical systems were associated with dust storms over this region. For this study, we collected meteorological data for Edwards Air Force Base (EAFB) in Lancaster, California, which is very close to NASA DFRC, from wunderground.com, National Centers for Environmental Prediction (NCEP)/North American Regional Reanalysis (NARR), NCEP/Hydro-meteorological Prediction Center/National Weather Service (NWS), and Unisys analyses. We find that the dust events were associated with the development of a deep convective boundary layer, turbulence kinetic energy (TKE) ≥3 J/kg, a deep unstable lapse rate layer, a wind speed above the frictional threshold wind speed necessary to ablate dust from the surface (≥7.3 m/s), a presence of a cold trough above the deep planetary boundary layer (PBL), a strong cyclonic jet, an influx of vertical sensible heat from the surrounding area, and a low volumetric soil moisture fraction <0.3. The annual mean number of dust events, their mean duration, and the unit duration per number of event for each visibility range, when binned as <11.2 km, <8 km, <4.8 km, <1.6 km, and <1 km were calculated. The visibility range values were positively correlated with the annual mean number of dust events, duration of dust events, and the ratio of duration of dust events. The percentage of the dust events by season shows that most of the dust events occurred in autumn (44.7%), followed by spring (38.3%), and equally in summer and winter with these seasons each accounting for 8.5% of events. This study also shows that the summer had the highest percentage (10%) of the lowest visibility condition (<1 km) followed by autumn (2%). Neither of the other two seasons—winter and spring—experienced such a low visibility condition during the entire dust events over 15 years. Winter had the highest visibility (<11.2 km) percentage, which was 67% followed by spring (55%). Wind speed increasing to a value within the range of 3.6–11 m/s was typically associated with the dust events. Full article
(This article belongs to the Special Issue Impact of Mineral Dust on Air Quality, Hydrological Cycle and Climate)
Show Figures

Figure 1

2300 KiB  
Article
Assessment of Urban Heat Islands in Small- and Mid-Sized Cities in Brazil
by Renata Dos Santos Cardoso, Larissa Piffer Dorigon, Danielle Cardozo Frasca Teixeira and Margarete Cristiane de Costa Trindade Amorim
Climate 2017, 5(1), 14; https://doi.org/10.3390/cli5010014 - 25 Feb 2017
Cited by 26 | Viewed by 5909
Abstract
Urban heat islands (UHIs) in large cities and different climatic regions have been thoroughly studied; however, their effects are becoming a common concern in smaller cities as well. We assessed UHIs in three tropical cities, analyzing how synoptic conditions, urban morphology, and land [...] Read more.
Urban heat islands (UHIs) in large cities and different climatic regions have been thoroughly studied; however, their effects are becoming a common concern in smaller cities as well. We assessed UHIs in three tropical cities, analyzing how synoptic conditions, urban morphology, and land cover affect the heat island magnitude. Data gathering involved mobile surveys across Paranavaí (Paraná), Rancharia (São Paulo), and Presidente Prudente (São Paulo), Brazil, during summer evenings (December 2013–January 2014). Temperature data collected over five days in each city point to heat islands with magnitudes up to 6 °C, under calm synoptic conditions, whereas summer average UHI magnitudes peak at 3.7 °C. In addition, UHI magnitudes were higher in areas with closely spaced buildings and few or no trees and building materials that are not appropriate for the region’s climate and thermal comfort. Full article
(This article belongs to the Special Issue Studies and Perspectives of Climatology in Brazil)
Show Figures

Figure 1

1666 KiB  
Article
Reliability and Robustness Analysis of the Masinga Dam under Uncertainty
by Hayden Postle-Floyd and Tohid Erfani
Climate 2017, 5(1), 12; https://doi.org/10.3390/cli5010012 - 21 Feb 2017
Cited by 2 | Viewed by 6990
Abstract
Kenya’s water abstraction must meet the projected growth in municipal and irrigation demand by the end of 2030 in order to achieve the country’s industrial and economic development plan. The Masinga dam, on the Tana River, is the key to meeting this goal [...] Read more.
Kenya’s water abstraction must meet the projected growth in municipal and irrigation demand by the end of 2030 in order to achieve the country’s industrial and economic development plan. The Masinga dam, on the Tana River, is the key to meeting this goal to satisfy the growing demands whilst also continuing to provide hydroelectric power generation. This study quantitatively assesses the reliability and robustness of the Masinga dam system under uncertain future supply and demand using probabilistic climate and population projections, and examines how long-term planning may improve the longevity of the dam. River flow and demand projections are used alongside each other as inputs to the dam system simulation model linked to an optimisation engine to maximise water availability. Water availability after demand satisfaction is assessed for future years, and the projected reliability of the system is calculated for selected years. The analysis shows that maximising power generation on a short-term year-by-year basis achieves 80%, 50% and 1% reliability by 2020, 2025 and 2030 onwards, respectively. Longer term optimal planning, however, has increased system reliability to up to 95% in 2020, 80% in 2025, and more than 40% in 2030 onwards. In addition, increasing the capacity of the reservoir by around 25% can significantly improve the robustness of the system for all future time periods. This study provides a platform for analysing the implication of different planning and management of Masinga dam and suggests that careful consideration should be given to account for growing municipal needs and irrigation schemes in both the immediate and the associated Tana River basin. Full article
Show Figures

Figure 1

7487 KiB  
Article
Urban Land Use Land Cover Changes and Their Effect on Land Surface Temperature: Case Study Using Dohuk City in the Kurdistan Region of Iraq
by Gaylan Rasul Faqe Ibrahim
Climate 2017, 5(1), 13; https://doi.org/10.3390/cli5010013 - 20 Feb 2017
Cited by 131 | Viewed by 11371
Abstract
The growth of urban areas has a significant impact on land use by replacing areas of vegetation with residential and commercial areas and their related infrastructure; this escalates the land surface temperature (LST). Rapid urban growth has occurred in Duhok City due to [...] Read more.
The growth of urban areas has a significant impact on land use by replacing areas of vegetation with residential and commercial areas and their related infrastructure; this escalates the land surface temperature (LST). Rapid urban growth has occurred in Duhok City due to enhanced political and economic growth during the period of this study. The objective is to investigate the effect of land use changes on LST; this study depends on data from three Landsat images (two Landsat 5-TM and Landsat OLI_TIRS-8) from 1990, 2000 and 2016. Supervised classification was used to compute land use/cover categories, and to generate the land surface temperature (LST) maps the Mono-window algorithm was used. Images were also used to create the normalized difference vegetation index (NDVI), normalized difference built-up index (NDBI), normalized difference bareness index (NDBAI) and normalized difference water index (NDWI) maps. Linear regression analysis was used to generate relationships between LST with NDVI, NDBI, NDBAI and NDWI. The study outcome proves that the changes in land use/cover have a significant role in the escalation of land surface temperatures. The highest temperatures are associated with barren land and built-up areas, ranging from 47°C, 50°C, 56°C while lower temperatures are related to water bodies and forests, ranging from 25°C, 26°C, 29°C respectively, in 1990, 2000 and 2016. This study also proves that NDVI and NDWI correlate negatively with low temperatures while NDBI and NDBAI correlate positively with high temperatures. Full article
Show Figures

Figure 1

2988 KiB  
Article
Climatic Variability and Land Use Change in Kamala Watershed, Sindhuli District, Nepal
by Muna Neupane and Subodh Dhakal
Climate 2017, 5(1), 11; https://doi.org/10.3390/cli5010011 - 18 Feb 2017
Cited by 6 | Viewed by 8987
Abstract
This study focuses on the land use change and climatic variability assessment around Kamala watershed, Sindhuli district, Nepal. The study area covers two municipalities and eight Village Development Committees (VDCs). In this paper, land use change and the climatic variability are examined. The [...] Read more.
This study focuses on the land use change and climatic variability assessment around Kamala watershed, Sindhuli district, Nepal. The study area covers two municipalities and eight Village Development Committees (VDCs). In this paper, land use change and the climatic variability are examined. The study was focused on analyzing the changes in land use area within the period of 1995 to 2014 and how the climatic data have evolved in different meteorological stations around the watershed. The topographic maps, Google Earth images and ArcGIS 10.1 for four successive years, 1995, 2005, 2010, and 2014 were used to prepare the land use map. The trend analysis of temperature and precipitation data was conducted using Mann Kendall trend analysis and Sen’s slope method using R (3.1.2 version) software. It was found that from 1995 to 2014, the forest area, river terrace, pond, and landslide area decreased while the cropland, settlement, and orchard area increased. The temperature and precipitation trend analysis shows variability in annual, maximum, and seasonal rainfall at different stations. The maximum and minimum temperature increased in all the respective stations, but the changes are statistically insignificant. The Sen’s slope for annual rainfall at ten different stations varied between −38.9 to 4.8 mm per year. Land use change and climatic variability have been analyzed; however, further study is required to establish any relation between climatic variability and land use change. Full article
(This article belongs to the Special Issue Dynamics of Land-Use/Cover Change under a Changing Climate)
Show Figures

Figure 1

2083 KiB  
Article
Precipitation Intensity Trend Detection using Hourly and Daily Observations in Portland, Oregon
by Alexis Cooley and Heejun Chang
Climate 2017, 5(1), 10; https://doi.org/10.3390/cli5010010 - 18 Feb 2017
Cited by 21 | Viewed by 6334
Abstract
The intensity of precipitation is expected to increase in response to climate change, but the regions where this may occur are unclear. The lack of certainty from climate models warrants an examination of trends in observational records. However, the temporal resolution of records [...] Read more.
The intensity of precipitation is expected to increase in response to climate change, but the regions where this may occur are unclear. The lack of certainty from climate models warrants an examination of trends in observational records. However, the temporal resolution of records may affect the success of trend detection. Daily observations are often used, but may be too coarse to detect changes. Sub-daily records may improve detection, but their value is not yet quantified. Using daily and hourly records from 24 rain gages in Portland, Oregon (OR), trends in precipitation intensity and volume are examined for the period of 1999–2015. Daily intensity is measured using the Simple Daily Intensity Index, and this method is adapted to measure hourly scale intensity. Kendall’s tau, a non-parametric correlation coefficient, is used for monotonic trend detection. Field significance and tests for spatial autocorrelation using Moran’s Index are used to determine the significance of group hypothesis tests. Results indicate that the hourly data is superior in trend detection when compared with daily data; more trends are detected with hourly scale data at both the 5% and 10% significance levels. Hourly records showed a significant increase in 6 of 12 months, while daily records showed a significant increase in 4 of 12 months at the 10% significance level. At both scales increasing trends were concentrated in spring and summer months, while no winter trends were detected. Volume was shown to be increasing in most months experiencing increased intensity, and is a probable driver of the intensity trends observed. Full article
(This article belongs to the Special Issue Impact of Climate Change on Water Resources)
Show Figures

Figure 1

14969 KiB  
Article
A Global ETCCDI-Based Precipitation Climatology from Satellite and Rain Gauge Measurements
by Felix Dietzsch, Axel Andersson, Markus Ziese, Marc Schröder, Kristin Raykova, Kirstin Schamm and Andreas Becker
Climate 2017, 5(1), 9; https://doi.org/10.3390/cli5010009 - 16 Feb 2017
Cited by 15 | Viewed by 7378
Abstract
Precipitation is still one of the most complex climate variables to observe, to understand, and to handle within climate monitoring and climate analysis as well as to simulate in numerical weather prediction and climate models. Especially over ocean, less is known about precipitation [...] Read more.
Precipitation is still one of the most complex climate variables to observe, to understand, and to handle within climate monitoring and climate analysis as well as to simulate in numerical weather prediction and climate models. Especially over ocean, less is known about precipitation than over land due to the sparsity of in situ observations. Here, we introduce and discuss a global Expert Team on Climate Change and Indices (ETCCDI)-based precipitation climatology. The basis for computation of this climatology is the global precipitation dataset Daily Precipitation Analysis for Climate Prediction (DAPACLIP) which combines in situ observation data over land and satellite-based remote sensing data over ocean in daily temporal resolution, namely data from the Global Precipitation Climatology Centre (GPCC) and the Hamburg Ocean Atmosphere Parameters and Fluxes from Satellite Data (HOAPS) dataset. The DAPACLIP dataset spans the period 1988–2008 and thus the global ETCCDI-based precipitation climatology covers 21 years in total. Regional aspects of the climatology are also discussed with focus on Europe and the monsoon region of south-east Asia. To our knowledge, this is the first presentation and discussion of an ETCCDI-based precipitation climatology on a global scale. Full article
Show Figures

Graphical abstract

2086 KiB  
Article
Watershed Response to Climate Change and Fire-Burns in the Upper Umatilla River Basin, USA
by Kimberly Yazzie and Heejun Chang
Climate 2017, 5(1), 7; https://doi.org/10.3390/cli5010007 - 16 Feb 2017
Cited by 6 | Viewed by 5778
Abstract
This study analyzed watershed response to climate change and forest fire impacts in the upper Umatilla River Basin (URB), Oregon, using the precipitation runoff modeling system. Ten global climate models using Coupled Intercomparison Project Phase 5 experiments with Representative Concentration Pathways (RCP) 4.5 [...] Read more.
This study analyzed watershed response to climate change and forest fire impacts in the upper Umatilla River Basin (URB), Oregon, using the precipitation runoff modeling system. Ten global climate models using Coupled Intercomparison Project Phase 5 experiments with Representative Concentration Pathways (RCP) 4.5 and 8.5 were used to simulate the effects of climate and fire-burns on runoff behavior throughout the 21st century. We observed the center timing (CT) of flow, seasonal flows, snow water equivalent (SWE) and basin recharge. In the upper URB, hydrologic regime shifts from a snow-rain-dominated to rain-dominated basin. Ensemble mean CT occurs 27 days earlier in RCP 4.5 and 33 days earlier in RCP 8.5, in comparison to historic conditions (1980s) by the end of the 21st century. After forest cover reduction in the 2080s, CT occurs 35 days earlier in RCP 4.5 and 29 days earlier in RCP 8.5. The difference in mean CT after fire-burns may be due to projected changes in the individual climate model. Winter flow is projected to decline after forest cover reduction in the 2080s by 85% and 72% in RCP 4.5 and RCP 8.5, in comparison to 98% change in ensemble mean winter flows in the 2080s before forest cover reduction. The ratio of ensemble mean snow water equivalent to precipitation substantially decreases by 81% and 91% in the 2050s and 2080s before forest cover reduction and a decrease of 90% in RCP 4.5 and 99% in RCP 8.5 in the 2080s after fire-burns. Mean basin recharge is 10% and 14% lower in the 2080s before fire-burns and after fire-burns, and it decreases by 13% in RCP 4.5 and decreases 22% in RCP 8.5 in the 2080s in comparison to historical conditions. Mixed results for recharge after forest cover reduction suggest that an increase may be due to the size of burned areas, decreased canopy interception and less evaporation occurring at the watershed surface, increasing the potential for infiltration. The effects of fire on the watershed system are strongly indicated by a significant increase in winter seasonal flows and a slight reduction in summer flows. Findings from this study may improve adaptive management of water resources, flood control and the effects of fire on a watershed system. Full article
(This article belongs to the Special Issue Impact of Climate Change on Water Resources)
Show Figures

Figure 1

1870 KiB  
Article
Improving Hydro-Climatic Projections with Bias-Correction in Sahelian Niger Basin, West Africa
by Ganiyu Titilope Oyerinde, Fabien C. C. Hountondji, Agnide E. Lawin, Ayo J. Odofin, Abel Afouda and Bernd Diekkrüger
Climate 2017, 5(1), 8; https://doi.org/10.3390/cli5010008 - 15 Feb 2017
Cited by 15 | Viewed by 5508
Abstract
Climate simulations in West Africa have been attributed with large uncertainties. Global climate projections are not consistent with changes in observations at the regional or local level of the Niger basin, making management of hydrological projects in the basin uncertain. This study evaluates [...] Read more.
Climate simulations in West Africa have been attributed with large uncertainties. Global climate projections are not consistent with changes in observations at the regional or local level of the Niger basin, making management of hydrological projects in the basin uncertain. This study evaluates the potential of using the quantile mapping bias correction to improve the Coupled Model Intercomparison Project (CMIP5) outputs for use in hydrological impact studies. Rainfall and temperature projections from 8 CMIP5 Global Climate Models (GCM) were bias corrected using the quantile mapping approach. Impacts of climate change was evaluated with bias corrected rainfall, temperature and potential evapotranspiration (PET). The IHACRES hydrological model was adapted to the Niger basin and used to simulate impacts of climate change on discharge under present and future conditions. Bias correction with quantile mapping significantly improved the accuracy of rainfall and temperature simulations compared to observations. The mean of six efficiency coefficients used for monthly rainfall comparisons of 8 GCMs to the observed ranged from 0.69 to 0.91 and 0.84 to 0.96 before and after bias correction, respectively. The range of the standard deviations of the efficiency coefficients among the 8 GCMs rainfall data were significantly reduced from 0.05–0.14 (before bias correction) to 0.01–0.03 (after bias correction). Increasing annual rainfall, temperature, PET and river discharge were projected for most of the GCMs used in this study under the RCP4.5 and RCP8.5 scenarios. These results will help improving projections and contribute to the development of sustainable climate change adaptation strategies. Full article
(This article belongs to the Special Issue Climate Impacts and Resilience in the Developing World)
Show Figures

Figure 1

673 KiB  
Article
Social Learning and the Mitigation of Transport CO2 Emissions
by Maha Al Sabbagh
Climate 2017, 5(1), 6; https://doi.org/10.3390/cli5010006 - 27 Jan 2017
Cited by 3 | Viewed by 4099
Abstract
Social learning, a key factor in fostering behavioural change and improving decision making, is considered necessary for achieving substantial CO2 emission reductions. However, no empirical evidence exists on how it contributes to mitigation of transport CO2 emissions, or the extent of its influence [...] Read more.
Social learning, a key factor in fostering behavioural change and improving decision making, is considered necessary for achieving substantial CO2 emission reductions. However, no empirical evidence exists on how it contributes to mitigation of transport CO2 emissions, or the extent of its influence on decision making. This paper presents evidence addressing these knowledge gaps. Social learning-oriented workshops were conducted to gather the views and preferences of participants from the general public in Bahrain on selected transport CO2 mitigation measures. Social preferences were inputted into a deliberative decision-making model and then compared to a previously prepared participative model. An analysis of the results revealed that social learning could contribute to changes in views, preferences and acceptance regarding mitigation measures, and these changes were statistically significant at an alpha level of 0.1. Thus, while social learning evidently plays an important role in the decision-making process, the impacts of using other participatory techniques should also be explored. Full article
Show Figures

Figure 1

1737 KiB  
Article
Hydroclimatic Characteristics of the 2012–2015 California Drought from an Operational Perspective
by Minxue He, Mitchel Russo and Michael Anderson
Climate 2017, 5(1), 5; https://doi.org/10.3390/cli5010005 - 21 Jan 2017
Cited by 22 | Viewed by 6499
Abstract
California experienced an extraordinary drought from 2012–2015 (which continues into 2016). This study, from an operational perspective, reviewed the development of this drought in a hydroclimatic framework and examined its characteristics at different temporal and spatial scales. Observed and reconstructed operational hydrologic indices [...] Read more.
California experienced an extraordinary drought from 2012–2015 (which continues into 2016). This study, from an operational perspective, reviewed the development of this drought in a hydroclimatic framework and examined its characteristics at different temporal and spatial scales. Observed and reconstructed operational hydrologic indices and variables widely used in water resources planning and management at statewide and (hydrologic) regional scales were employed for this purpose. Parsimonious metrics typically applied in drought assessment and management practices including the drought monitor category, percent of average, and rank were utilized to facilitate the analysis. The results indicated that the drought was characterized by record low snowpack (statewide four-year accumulated deficit: 280%-of-average), exceptionally low April-July runoff (220%-of-average deficit), and significantly below average reservoir storage (93%-of-average deficit). During the period from 2012–2015, in general, water year 2015 stood out as the driest single year; 2014–2015 was the driest two-year period; and 2013–2015 tended to be the driest three-year period. Contrary to prior studies stating that the 2012–2015 drought was unprecedented, this study illustrated that based on eight out of 28 variables, the 2012–2015 drought was not without precedent in the record period. Spatially, on average, the South Coast Region, the Central Coast Region, the Tulare Region, and the San Joaquin Region generally had the most severe drought conditions. Overall, these findings are highly meaningful for water managers in terms of making better informed adaptive management plans. Full article
(This article belongs to the Special Issue Climate Extremes, the Past and the Future)
Show Figures

Figure 1

2343 KiB  
Article
Rising Precipitation Extremes across Nepal
by Ramchandra Karki, Shabeh ul Hasson, Udo Schickhoff, Thomas Scholten and Jürgen Böhner
Climate 2017, 5(1), 4; https://doi.org/10.3390/cli5010004 - 13 Jan 2017
Cited by 142 | Viewed by 19938
Abstract
As a mountainous country, Nepal is most susceptible to precipitation extremes and related hazards, including severe floods, landslides and droughts that cause huge losses of life and property, impact the Himalayan environment, and hinder the socioeconomic development of the country. Given that the [...] Read more.
As a mountainous country, Nepal is most susceptible to precipitation extremes and related hazards, including severe floods, landslides and droughts that cause huge losses of life and property, impact the Himalayan environment, and hinder the socioeconomic development of the country. Given that the countrywide assessment of such extremes is still lacking, we present a comprehensive picture of prevailing precipitation extremes observed across Nepal. First, we present the spatial distribution of daily extreme precipitation indices as defined by the Expert Team on Climate Change Detection, Monitoring and Indices (ETCCDMI) from 210 stations over the period of 1981–2010. Then, we analyze the temporal changes in the computed extremes from 76 stations, featuring long-term continuous records for the period of 1970–2012, by applying a non-parametric Mann−Kendall test to identify the existence of a trend and Sen’s slope method to calculate the true magnitude of this trend. Further, the local trends in precipitation extremes have been tested for their field significance over the distinct physio-geographical regions of Nepal, such as the lowlands, middle mountains and hills and high mountains in the west (WL, WM and WH, respectively), and likewise, in central (CL, CM and CH) and eastern (EL, EM and EH) Nepal. Our results suggest that the spatial patterns of high-intensity precipitation extremes are quite different to that of annual or monsoonal precipitation. Lowlands (Terai and Siwaliks) that feature relatively low precipitation and less wet days (rainy days) are exposed to high-intensity precipitation extremes. Our trend analysis suggests that the pre-monsoonal precipitation is significantly increasing over the lowlands and CH, while monsoonal precipitation is increasing in WM and CH and decreasing in CM, CL and EL. On the other hand, post-monsoonal precipitation is significantly decreasing across all of Nepal while winter precipitation is decreasing only over the WM region. Both high-intensity precipitation extremes and annual precipitation trends feature east−west contrast, suggesting significant increase over the WM and CH region but decrease over the EM and CM regions. Further, a significant positive trend in the number of consecutive dry days but significant negative trend in the number of wet (rainy) days are observed over the whole of Nepal, implying the prolongation of the dry spell across the country. Overall, the intensification of different precipitation indices over distinct parts of the country indicates region-specific risks of floods, landslides and droughts. The presented findings, in combination with population and environmental pressures, can support in devising the adequate region-specific adaptation strategies for different sectors and in improving the livelihood of the rural communities in Nepal. Full article
(This article belongs to the Special Issue Climate Extremes, the Past and the Future)
Show Figures

Figure 1

148 KiB  
Editorial
Acknowledgement to Reviewers of Climate in 2016
by Climate Editorial Office
Climate 2017, 5(1), 3; https://doi.org/10.3390/cli5010003 - 11 Jan 2017
Cited by 20 | Viewed by 2752
Abstract
The editors of Climate would like to express their sincere gratitude to the following reviewers for assessing manuscripts in 2016.[...] Full article
27827 KiB  
Article
Performance Assessment of Multi-Source Weighted-Ensemble Precipitation (MSWEP) Product over India
by Akhilesh S. Nair and J. Indu
Climate 2017, 5(1), 2; https://doi.org/10.3390/cli5010002 - 11 Jan 2017
Cited by 46 | Viewed by 7362
Abstract
Error characterization is vital for the advancement of precipitation algorithms, the evaluation of numerical model outputs, and their integration in various hydro-meteorological applications. The Tropical Rainfall Measuring Mission (TRMM) Multi-satellite Precipitation Analysis (TMPA) has been a benchmark for successive Global Precipitation Measurement (GPM) [...] Read more.
Error characterization is vital for the advancement of precipitation algorithms, the evaluation of numerical model outputs, and their integration in various hydro-meteorological applications. The Tropical Rainfall Measuring Mission (TRMM) Multi-satellite Precipitation Analysis (TMPA) has been a benchmark for successive Global Precipitation Measurement (GPM) based products. This has given way to the evolution of many multi-satellite precipitation products. This study evaluates the performance of the newly released multi-satellite Multi-Source Weighted-Ensemble Precipitation (MSWEP) product, whose temporal variability was determined based on several data products including TMPA 3B42 RT. The evaluation was conducted over India with respect to the IMD-gauge-based rainfall for pre-monsoon, monsoon, and post monsoon seasons at daily scale for a 35-year (1979–2013) period. The rainfall climatology is examined over India and over four geographical extents within India known to be subject to uniform rainfall. The performance evaluation of rainfall time series was carried out. In addition to this, the performance of the product over different rainfall classes was evaluated along with the contribution of each class to the total rainfall. Further, seasonal evaluation of the MSWEP products was based on the categorical and volumetric indices from the contingency table. Upon evaluation it was observed that the MSWEP products show large errors in detecting the higher quantiles of rainfall (>75th and > 95th quantiles). The MSWEP precipitation product available at a 0.25° × 0.25° spatial resolution and daily temporal resolution matched well with the daily IMD rainfall over India. Overall results suggest that a suitable region and season-dependent bias correction is essential before its integration in hydrological applications. While the MSWEP was observed to perform well for daily rainfall, it suffered from poor detection capabilities for higher quantiles, making it unsuitable for the study of extremes. Full article
Show Figures

Graphical abstract

2525 KiB  
Article
Evaluation of TRMM 3B42 V7 Rainfall Product over the Oum Er Rbia Watershed in Morocco
by Hamza Ouatiki, Abdelghani Boudhar, Yves Tramblay, Lionel Jarlan, Tarik Benabdelouhab, Lahoucine Hanich, M. Rachid El Meslouhi and Abdelghani Chehbouni
Climate 2017, 5(1), 1; https://doi.org/10.3390/cli5010001 - 04 Jan 2017
Cited by 64 | Viewed by 8395
Abstract
In arid and semi-arid areas, rainfall is often characterized by a strong spatial and temporal variability. These environmental factors, combined with the sparsity of the measurement networks in developing countries, constitute real constraints for water resources management. In recent years, several spatial rainfall [...] Read more.
In arid and semi-arid areas, rainfall is often characterized by a strong spatial and temporal variability. These environmental factors, combined with the sparsity of the measurement networks in developing countries, constitute real constraints for water resources management. In recent years, several spatial rainfall measurement sources have become available, such as TRMM data (Tropical Rainfall Measurement Mission). In this study, the TRMM 3B42 Version 7 product was evaluated using rain gauges measurements from 19 stations in the Oum-Er-Bia (OER) basin located in the center of Morocco. The relevance of the TRMM product was tested by direct comparison with observations at different time scales (daily, monthly, and annual) between 1998 and 2010. Results show that the satellite product provides poor estimations of rainfall at the daily time scale giving an average Pearson correlation coefficient (r) of 0.2 and average Root Mean Square Error (RMSE) of 10 mm. However, the accuracy of TRMM rainfall is improved when temporally averaged to monthly time scale (r of 0.8 and RMSE of 28 mm) or annual time scale (r of 0.71 and RMSE of 157 mm). Moreover, improved correlation with observed data was obtained for data spatially averaged at the watershed scale. Therefore, at the monthly and annual time scales, TRMM data can be a useful source of rainfall data for water resources monitoring and management in ungauged basins in semi-arid regions. Full article
Show Figures

Figure 1

Previous Issue
Next Issue
Back to TopTop