Article

An Organizational Model of a Food Production Chain: A Case Study in the Poultry Sector in Foggia (Italy)

by
Giulio Mario Cappelletti
1,*,
Filomena Chiara
1,
Carlo Russo
1,
Pietro Russo
2,
Antonio Giovanni D’Emilio
3,
Anna Costagliola
4 and
Giovanna Liguori
3
1
Department of Economics, Management and Territory, University of Foggia, 71121 Foggia, Italy
2
Independent Researcher, 20127 Milan, Italy
3
Territorial Pharmaceutical Service, Local Health Authority (ASL) Foggia, 71121 Foggia, Italy
4
Department of Veterinary Medicine and Animal Production, University of Naples Federico II, 80137 Naples, Italy
*
Author to whom correspondence should be addressed.
Sustainability 2025, 17(7), 2984; https://doi.org/10.3390/su17072984
Submission received: 5 February 2025 / Revised: 10 March 2025 / Accepted: 14 March 2025 / Published: 27 March 2025

Abstract

:
The purpose of this study was to analyze the poultry chain in southern Italy to describe the characteristics of farms and their locations and to propose an optimized organizational model with a broader approach that considers not only economic and environmental factors, but also ethical ones, including animal welfare protection, particularly in the poultry food safety chain. To obtain these results, the geolocations of poultry facilities, identifying possible verticalizations in the supply chain, were used. Data were collected in the province of Foggia (Italy) and organized in a dataset in collaboration with the Prevention Department of the Local Health Authority. A geo-imputation procedure and centroid calculation allowed us to formulate an optimizing hypothesis regarding the geolocation of upstream and downstream facilities in the process of chicken breeding by identifying a possible verticalization in the supply chain. Our results highlight the importance of broadening the concept of industrial symbiosis in the management of poultry farming, not only from an environmental perspective, but also from a social perspective. In particular, concerning ethical aspects, protecting animal welfare today is an essential goal of the sector to ensure high quality and yield of poultry meat. The results represent the first step towards proposing an optimized organizational model that takes ethical and social aspects into consideration. The paper is intended to highlight how, in the poultry sector, an organizational scheme can also reconcile other aspects, such as safeguarding the welfare conditions of animals on farms and during transport to improve food safety.

1. Introduction

Poultry meat is one of the main sources of meat consumed worldwide.
Global chicken meat production reached approximately 103 million tonnes in 2024, compared to approximately 87 million tonnes in 2015. Average production for the period 2015–2024 was approximately 97 million tonnes per year [1,2].
Consumers are attracted to poultry due to its lower prices, product consistency and adaptability, and higher protein/lower fat content. Consumption of poultry meat is projected to increase globally. The long-term shift in meat consumption toward poultry continues to strengthen, with an expected increase of 16% by 2031 with 31 billion heads of poultry livestock.
The top three poultry meat-producing countries are, in order, the USA, China, and Brazil, which together make up approximately 44% of global production. In 2031, this consumption per capita is expected to stabilize at around 35.6 kg/year and poultry meat is projected to constitute 47% of the protein consumed from meat sources.
The poultry sector, from breeding to animal feed, has developed by extending its business to the subsequent stages of the supply chain to respond effectively to the demands of large-scale distribution. This has made it possible to effectively develop qualifying elements of the sector, such as the protection of food safety, animal welfare, and biosecurity, and spread them, on a large scale, to the entire supply chain, becoming the flagship of Made in Italy agri-food, especially due to the strong integration of its phases, from hatcheries to breeding, from withdrawal to processing, and including distribution and logistics.
This system is characterized by strong vertical integration and complete self-sufficiency, capable of producing more than it consumes with a self-supply rate of approximately 108% in 2020 (105% Italian consumption of chicken and 118% of turkey meat). This means that the poultry sector could be considered a model of global excellence, with the capacity to provide food for more than national needs [3,4,5,6].
Between 2009 and 2020, per capita poultry consumption in Italy increased from 18.6 kg to 21.6 kg. In 2022, Italy ranked as the fifth-largest poultry producer in Europe, and chicken and turkey have become the primary protein source for 54% of Italians [7]. The number of poultry farms in Italy grew from 7990 in 2016 to 9308 in 2020, particularly in the Veneto region. During this period, apparent per capita consumption of poultry increased from 20.5 kg to 21.7 kg, representing 7.7% of the consumption of animal-based proteins [8].
The poultry supply chain is multifaceted, involving stages such as feed production, chick rearing, slaughter, distribution, and waste management. Coordination among various stakeholders, including agricultural companies, breeding firms, and waste management entities, is essential to optimize production processes, reduce costs, and ensure sustainability. Localizing poultry production and processing facilities can reduce transportation costs and environmental impacts, including the carbon footprint [9,10]. Various studies have focused on optimizing poultry supply chains by exploring different models, management styles, and technological innovations [7,11,12,13,14,15,16,17,18,19,20,21,22,23,24]. Collectively, these studies highlight the significance of vertical integration, regulatory responses to environmental challenges, the integration of artificial intelligence, and sustainability efforts in optimizing poultry supply chains. Animal welfare is also a significant consideration, particularly during transport, where birds face stressors that can negatively impact meat quality and animal health [25,26,27]. Figure 1 illustrates the poultry supply chain, highlighting the interactions among various stakeholders involved in the production and distribution process.
The present study examines the poultry supply chain in southern Italy, focusing on Foggia, and explores the potential for vertical integration. Considering the above aspects, the purpose of this study is to analyze the poultry chain in southern Italy and describe the characteristics of the farms and their locations, as a new perspective that not only considers the efficiency of business processes but also safeguards animal welfare conditions to improve food safety. Data were collected and organized into a dataset of 132 records of broiler chicken farms located in the province of Foggia (Italy). The following three types of poultry breeding systems were analyzed: conventional, organic, and Campese. Campese poultry breeding is a form of free-range farming where chickens have outdoor access and shelter for comfort, with stocking densities of 12 birds per square meter indoors and 1 bird per square meter outdoors [28]. It emphasizes distinct physical traits and a vertically integrated production system, ensuring quality and freshness [28]. Organic poultry breeding prioritizes animal welfare, environmental sustainability, and natural feed, with stricter regulations and lower stocking densities. Conventional breeding focuses on efficiency, using high-density housing and commercial feed, raising concerns about animal welfare and environmental impact due to intensive farming practices and higher stocking densities [29,30].
Data were collected from surveys submitted to farmers in collaboration with the Department of Prevention of the Local Health Authority. The following three types of poultry breeding systems were analyzed: conventional, organic, and Campese. Campese poultry breeding is a form of free-range farming where chickens have outdoor access and shelter for comfort, with stocking densities of 12 birds per square meter indoors and 1 bird per square meter outdoors [28]. It emphasizes distinct physical traits and a vertically integrated production system ensuring quality and freshness [28]. Organic poultry breeding prioritizes animal welfare, environmental sustainability, and natural feed, with stricter regulations and lower stocking densities. Conventional breeding focuses on efficiency, using high-density housing and commercial feed, raising concerns about animal welfare and environmental impact due to intensive farming practices and higher stocking densities [29,30].
The study also was conducted to analyze the optimizing hypothesis of the geolocation of possible verticalization in the supply chain. Currently, only farmers’ plants are installed, but the hope is that upstream phases (e.g., hatchery and feed mill) and downstream phases could be carried out in the same geographical context. This issue plays a very important role not only from an economic perspective (cost optimization) but also from environmental (less impact) and social (animal welfare) perspectives [31,32,33,34]. The latter is a crucial aspect that consumers and other stakeholders consider primary [23]. Indeed, many people promote legislation to consider the mental and physical well-being of animals. At the same time, recent studies have shown that fear and distress, especially during transport to the slaughterhouse, incur losses before slaughter and influence the quality of poultry meat [35,36,37,38]. This analysis represents the first step of an in-depth investigation of all sustainability aspects in a modern poultry chain by adopting a life cycle approach [38,39,40,41].
This research emphasizes the need to enhance profitability, operational efficiency, traceability, and waste valorization, while prioritizing environmental and social responsibility within the industry. It proposes an optimized organizational model that integrates ethical considerations, such as animal welfare, food safety, and environmental sustainability. Using a life cycle approach, the study aims to offer valuable insights for local farmers and policymakers to foster a more sustainable poultry industry.

2. Material and Method

2.1. Dataset

A questionnaire was used to investigate the poultry chain in the Foggia province. The study was conducted using the data provided by all the companies located in the province of Foggia with the support of the managers of the Foggia local health authority and of the staff of the Prevention Department of the Local Health Authority, through which the answers to the questionnaires were received from farmers who have an agistment contract with the companies Aia, Amadori, Fileni, and Masserie di Puglia. All data collected refers to May 2021. After the first section, which involved the collection of chronological and geographical data, the survey was arranged based on the phases of the breeding cycle.
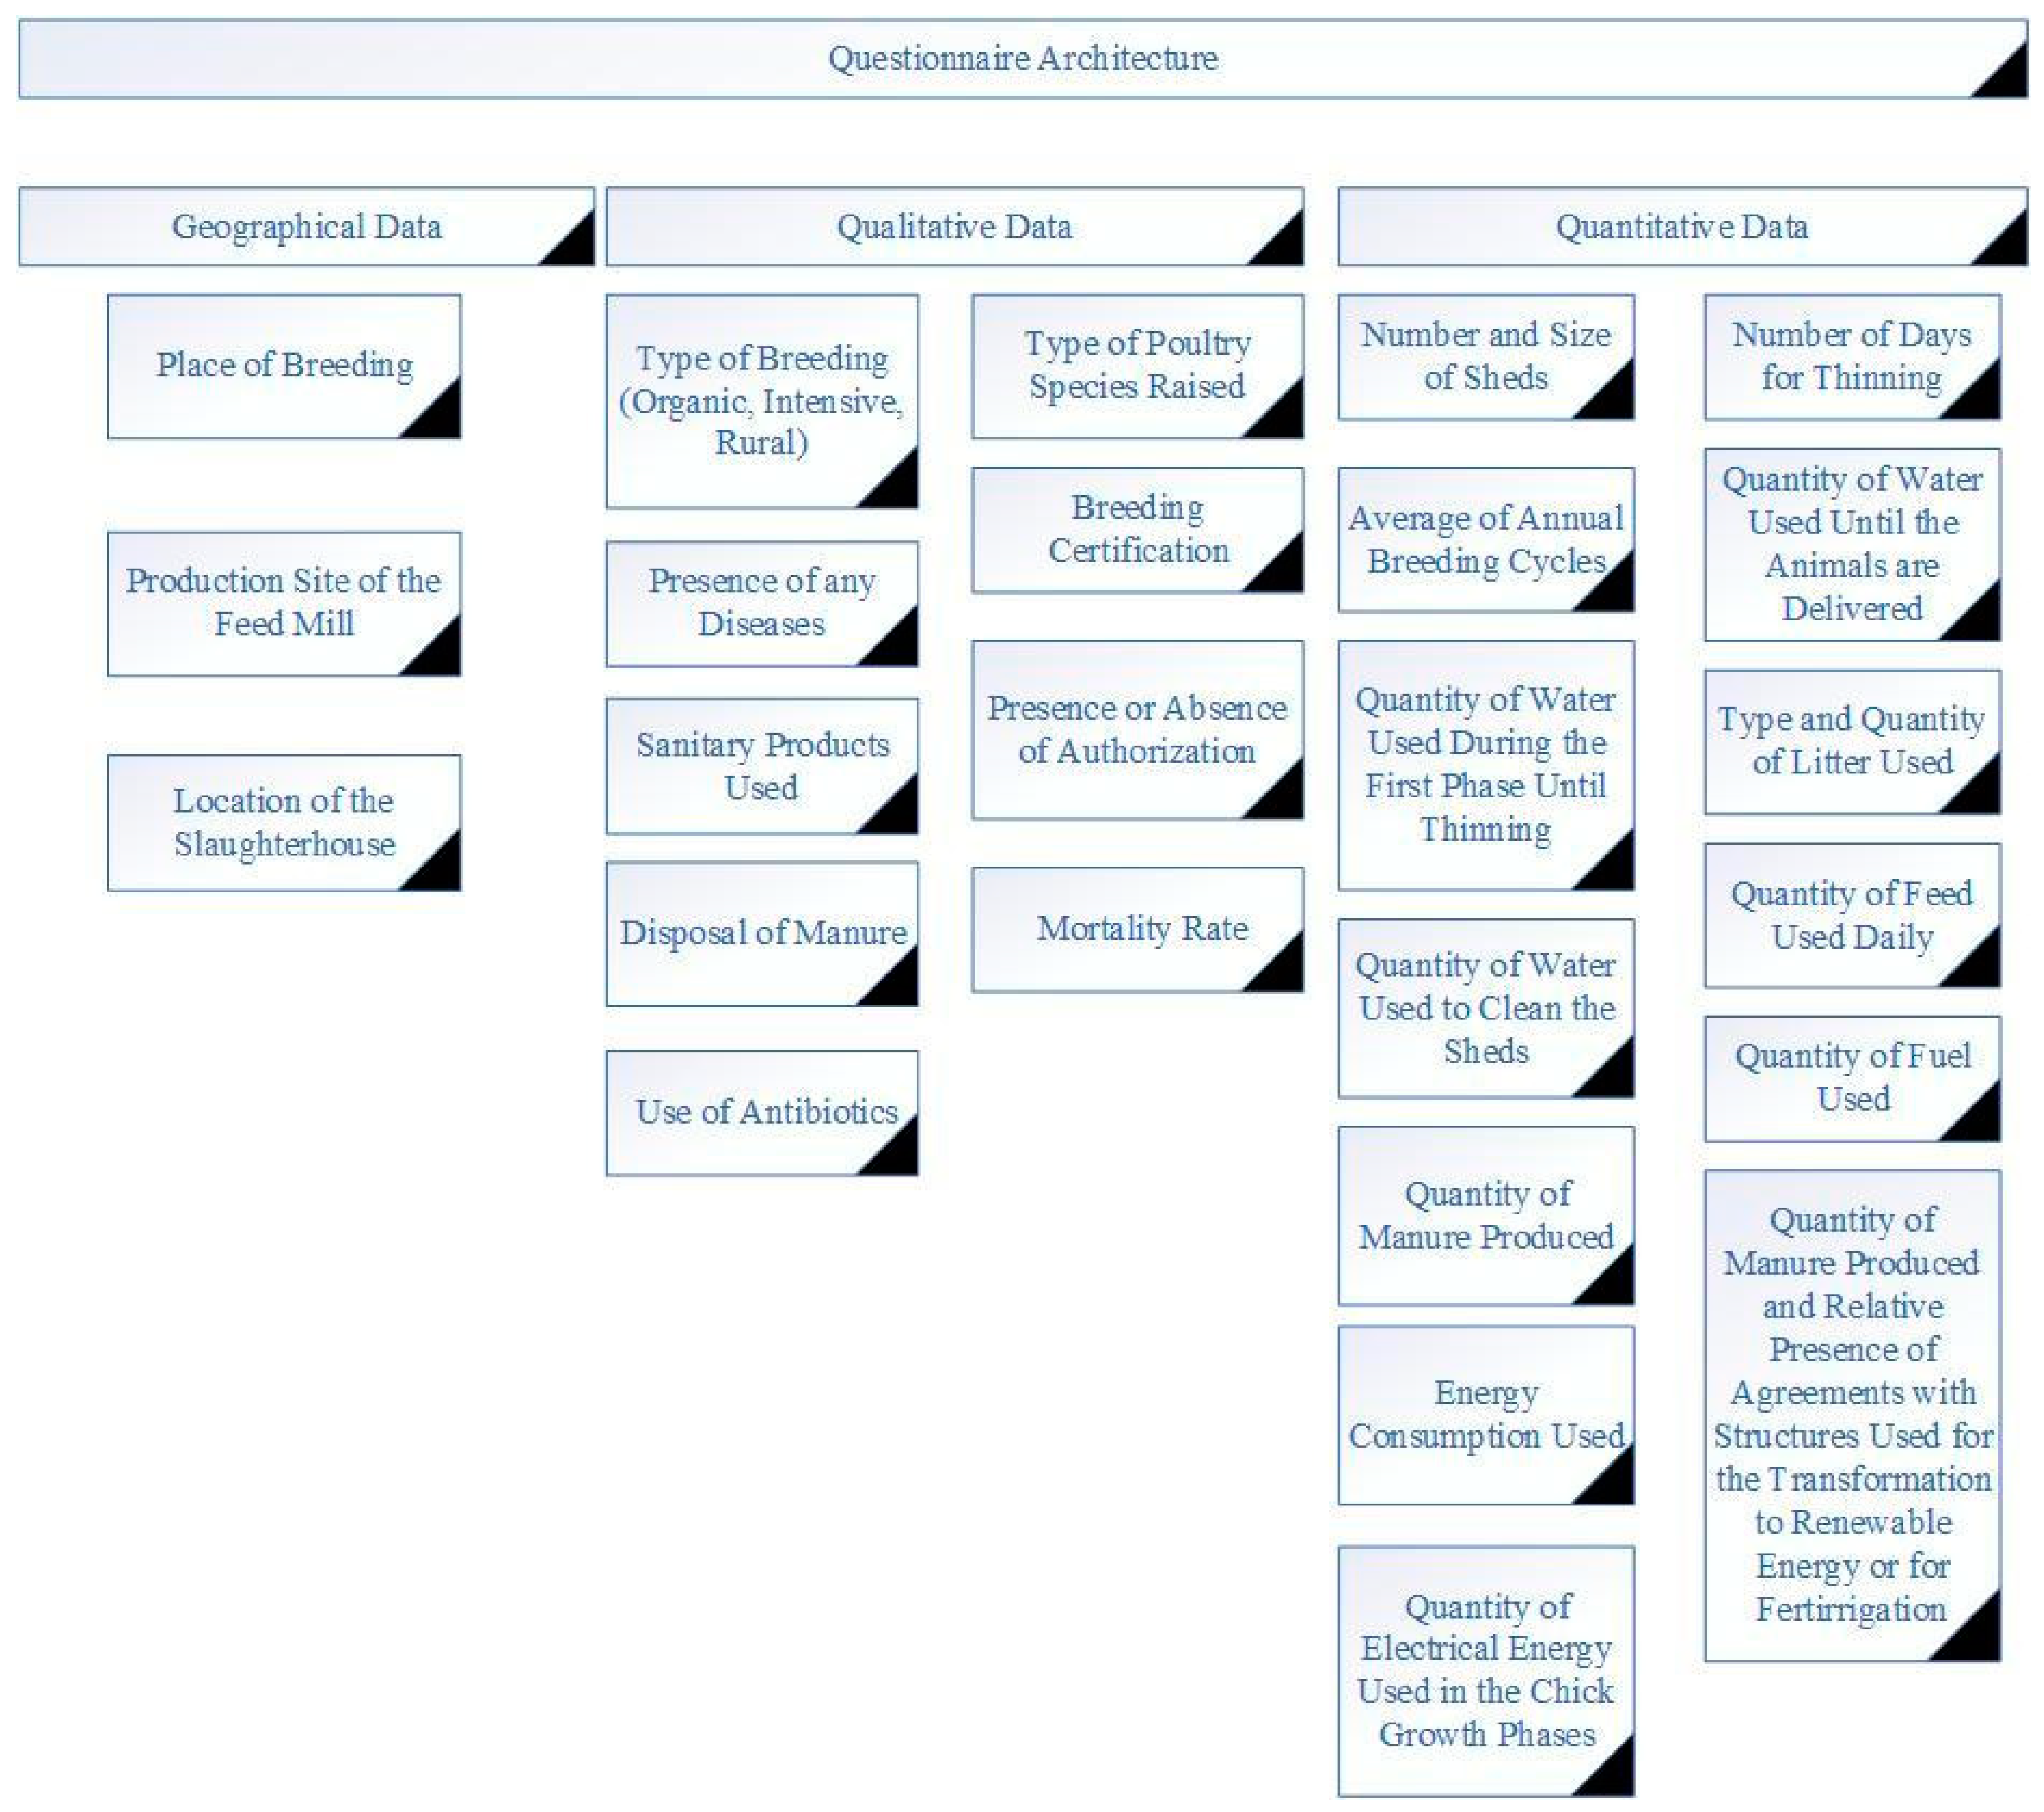
The questionnaire considered the aspects indicated in Figure 2.
It is composed of open and multiple-choice questions for collecting relevant information for the analysis of poultry supply chain management. According to Figure 2, we can distinguish the requirements of geographical information, quantitative and qualitative data. Figure 3 shows the flowchart of the data processing.
The dataset comprises 132 rows and 66 columns. A cleaning procedure was needed to obtain useful information, fix typos, and normalize string values [42,43].
After this operation, the number of columns was increased to 76 because, in some records, some information was extracted and inserted into a separate column. Therefore, it was easier to process them separately.
For example, from the “Location of farm” column (Sant’Agata di Puglia (FG) C/da S. Maria d’olivola, Lat. 41.105900, Long. 15.340389), city (SANT’AGATA DI PUGLIA), district (S. MARIA D’OLIVOLA), province (FG), latitude (41.1059), and longitude (15.340389) were extracted and separately processed.

2.2. Geo-Imputation Procedure: Centroid and k-Means Calculation

The goal of geo-imputation is to identify hypothetical geographic areas closer to the farms, reducing the distances between the farms and the facilities. This is particularly crucial in light of animal welfare considerations.
For geo-imputation, the centroid was calculated as the mean of the coordinates [44].
Given a set, S , of n points in R 2 , S = x 1 , y 1 , x 2 , y 2 , , x n , y n
Their centroid is given as
x _ , y _ = 1 n i = 0 n x i , 1 n i = 0 n y i
For the k-means calculation, the algorithm groups the data by separating the samples into n groups of equal variances, minimizing a criterion known as the within-cluster sum of squares (WCSS). This algorithm requires the number of clusters to be specified [44,45,46,47,48].
The k-means algorithm divides a set of n samples into k disjoint clusters, C , each described by the mean μ i of the samples in the cluster. These means are commonly called cluster “centroids” [49,50].
Given a set, S , of n points in R 2 ,
S = x 1 , x 2 , , x n
k-means clustering is intended to partition n observations into k n sets C = C 1 , C 2 , , C k to minimize the WCSS:
a r g m i n C = i = 1 k x C i x μ i 2
where μ i is the mean of the points in C i .
The algorithm consists of three steps. The first step is to select the initial centroids. After initialization, k-means consists of looping between two other steps. In the first step, each sample is assigned to its nearest centroid. The second step involves creating new centroids by taking the mean value of all samples assigned to each previous centroid. The difference between the old and new centroids is computed, and the algorithm repeats these last two steps until this value is less than the threshold. In other words, it repeats until the centroids do not significantly move.
For calculation of the informatic procedures, we used the scikit-learn library, a free machine-learning software library in Python v 3.10.
The k-means algorithm was applied using the k-means tool available in scikit-learn [51]. Three clusters were selected.
The k-means algorithm used is the Elkan variation, which uses triangle inequality [52].
The chosen method for initialization is k-means++, which selects the initial cluster centers for k-means clustering in a smart way to speed up convergence. This initializes the centroids as (generally) distant from each other, leading to better results than those of random initialization.
The k-means algorithm was run 10 times with different centroid seeds, and the final results were the best output of these consecutive runs in terms of inertia.
The maximum number of iterations of the k-means algorithm in a single run was 300.
The relative tolerance concerning the Frobenius norm of the difference in the cluster centers of two consecutive iterations to declare convergence was 1 × 10⁻⁴ [53,54,55].
We chose to set a random state to determine the randomness of centroid initialization.
The Google Maps API v3.59 was used to calculate distances (in kilometers and minutes) from the farms to the calculated centroids. Google Maps API considers road conditions, road type, speed limits, and, if available, historical traffic data. In particular, the choice of route and duration are based on the road network and average time-independent traffic conditions (https://developers.google.com/maps/documentation/directions/get-directions#departure_time, accessed on 4 February 2025).

3. Results and Discussion

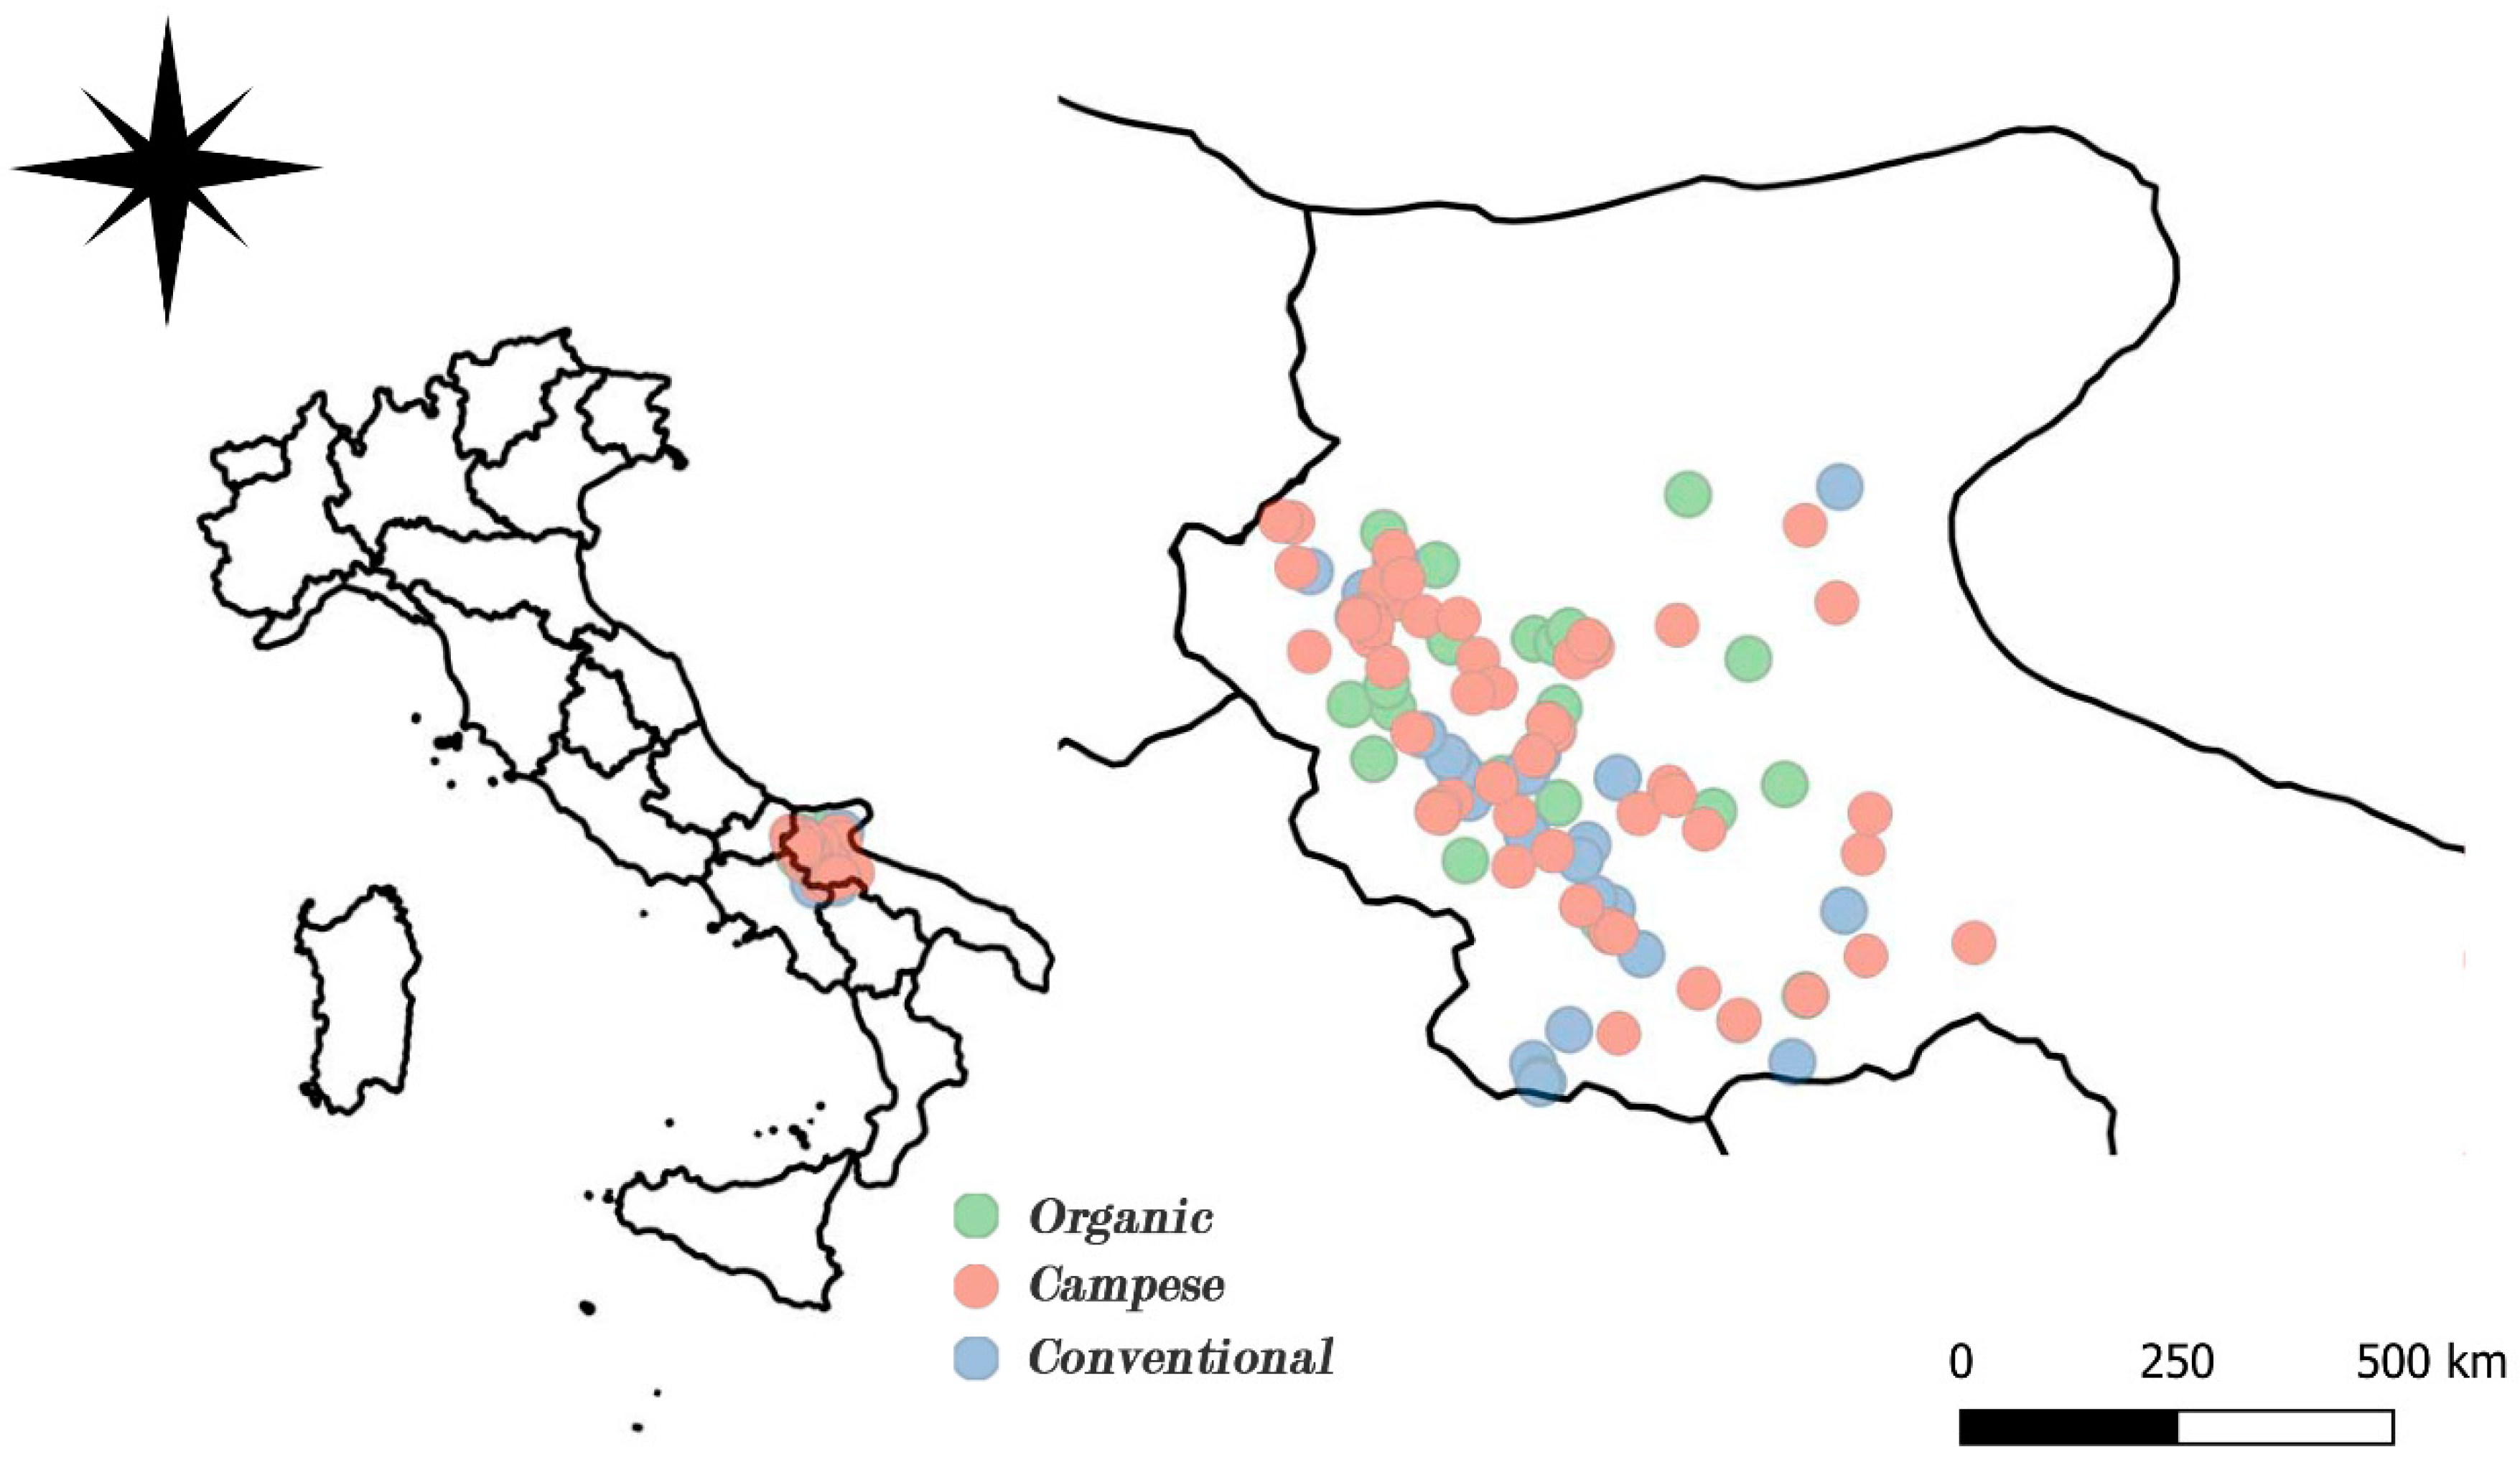
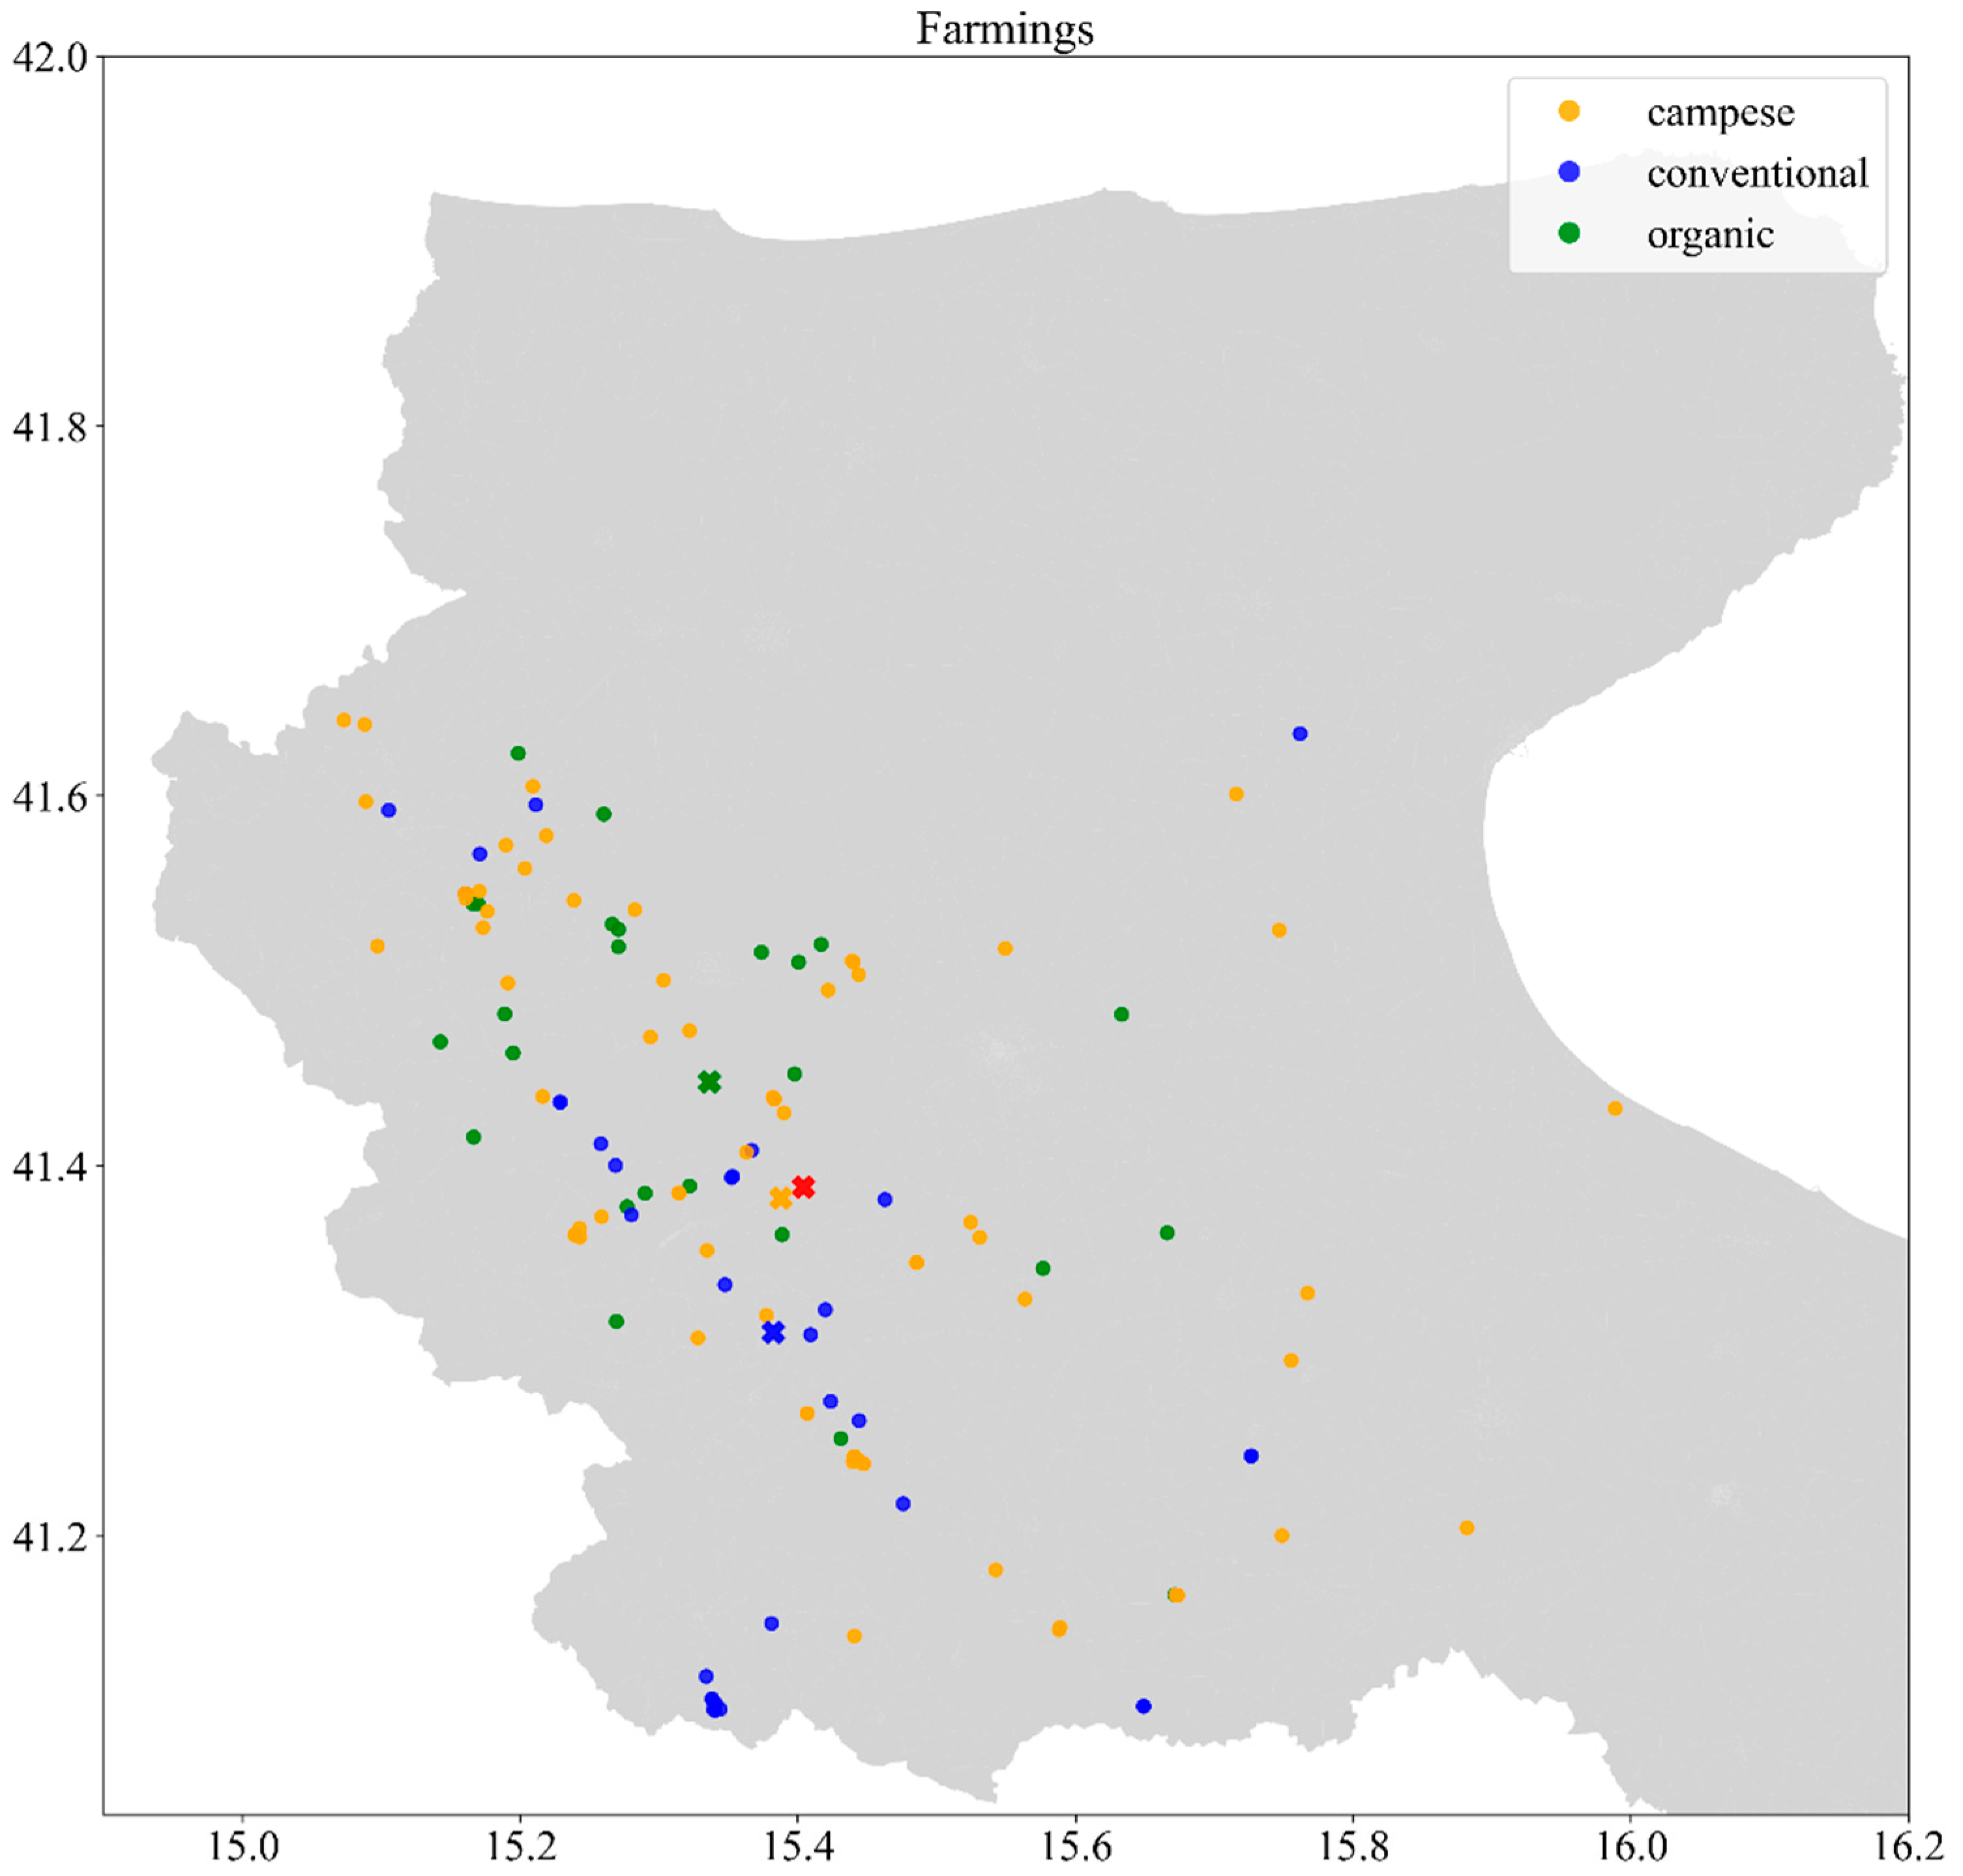
Figure 4 shows the geographical distribution of poultry farms. They are concentrated in the northeast of the Apulian region in southern Italy. This area is particularly suitable for poultry breeding due to its geomorphological conditions (sparsely populated hilly areas) and abundance of water sources compared to the other areas of Apulia. Furthermore, poultry farming is a valid, more profitable alternative to extensive crop farming, which principally involves durum wheat cultivation in this area.
Figure 4 shows the location of the firms by distinguishing the three types of poultry breeding. Although equal spatial distribution occurred, Campese poultry farming is the most widespread, with 73 farms, compared to the 32 conventional farms and 25 organic ones.
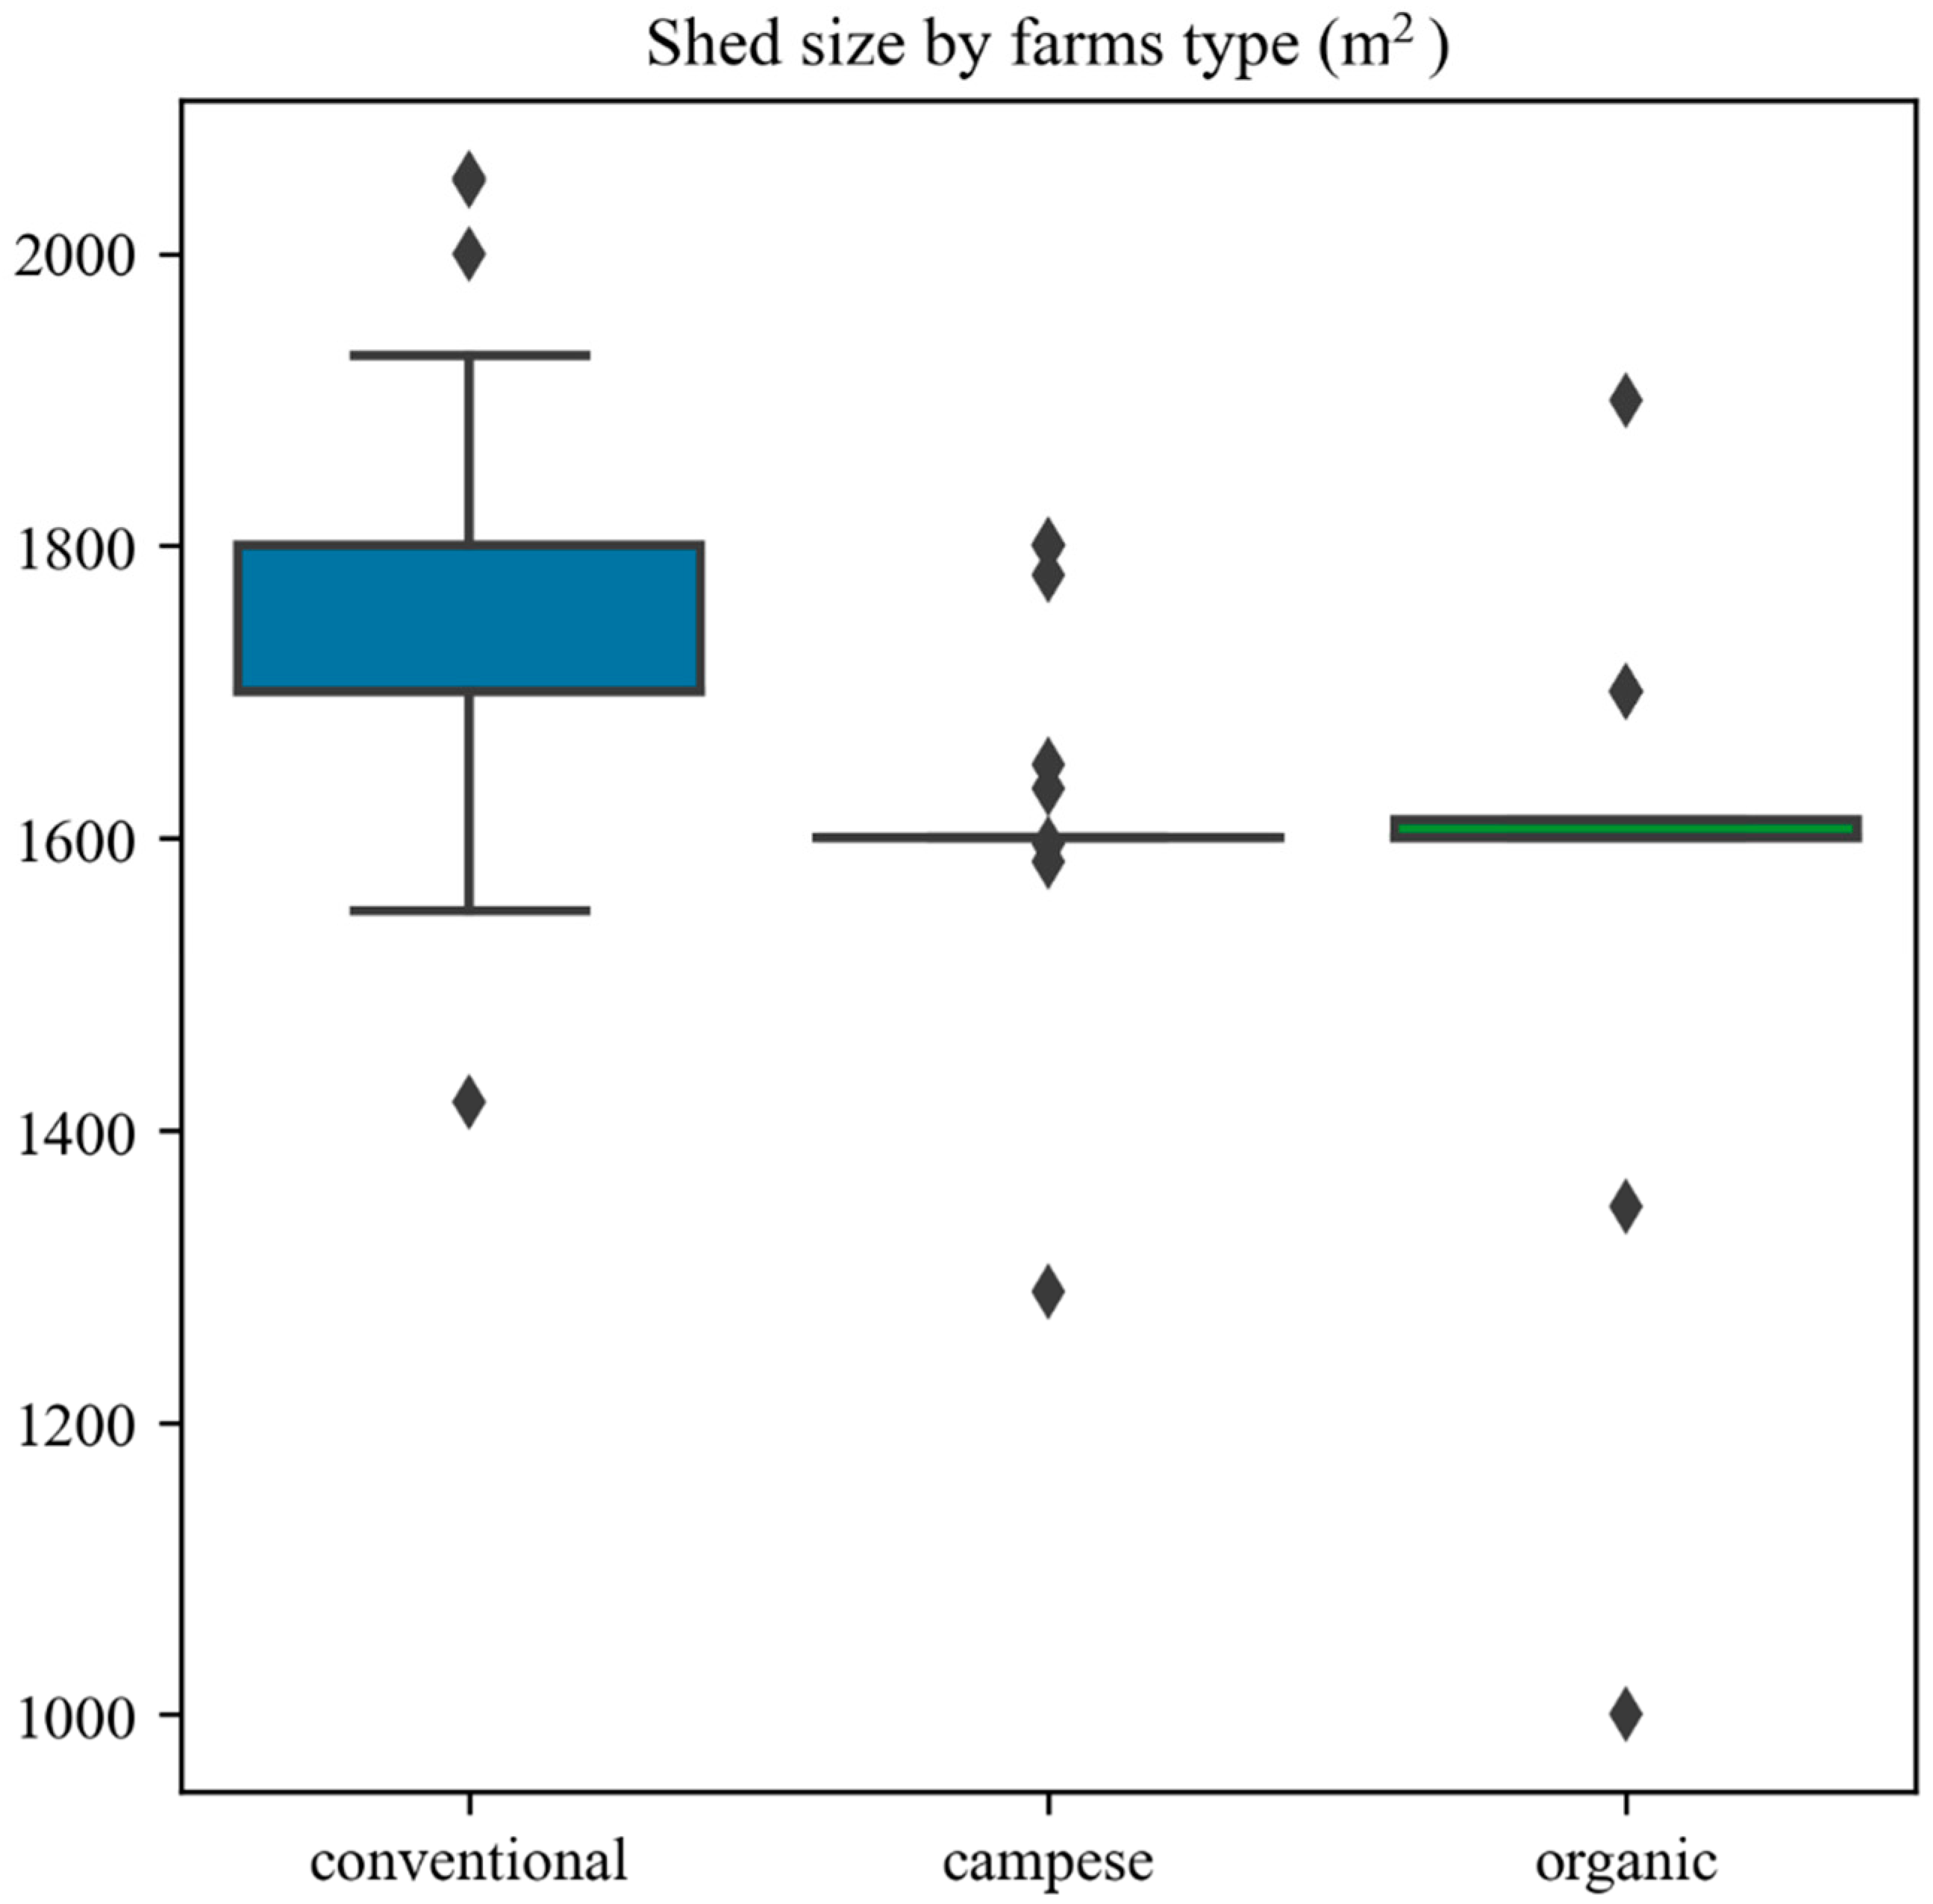
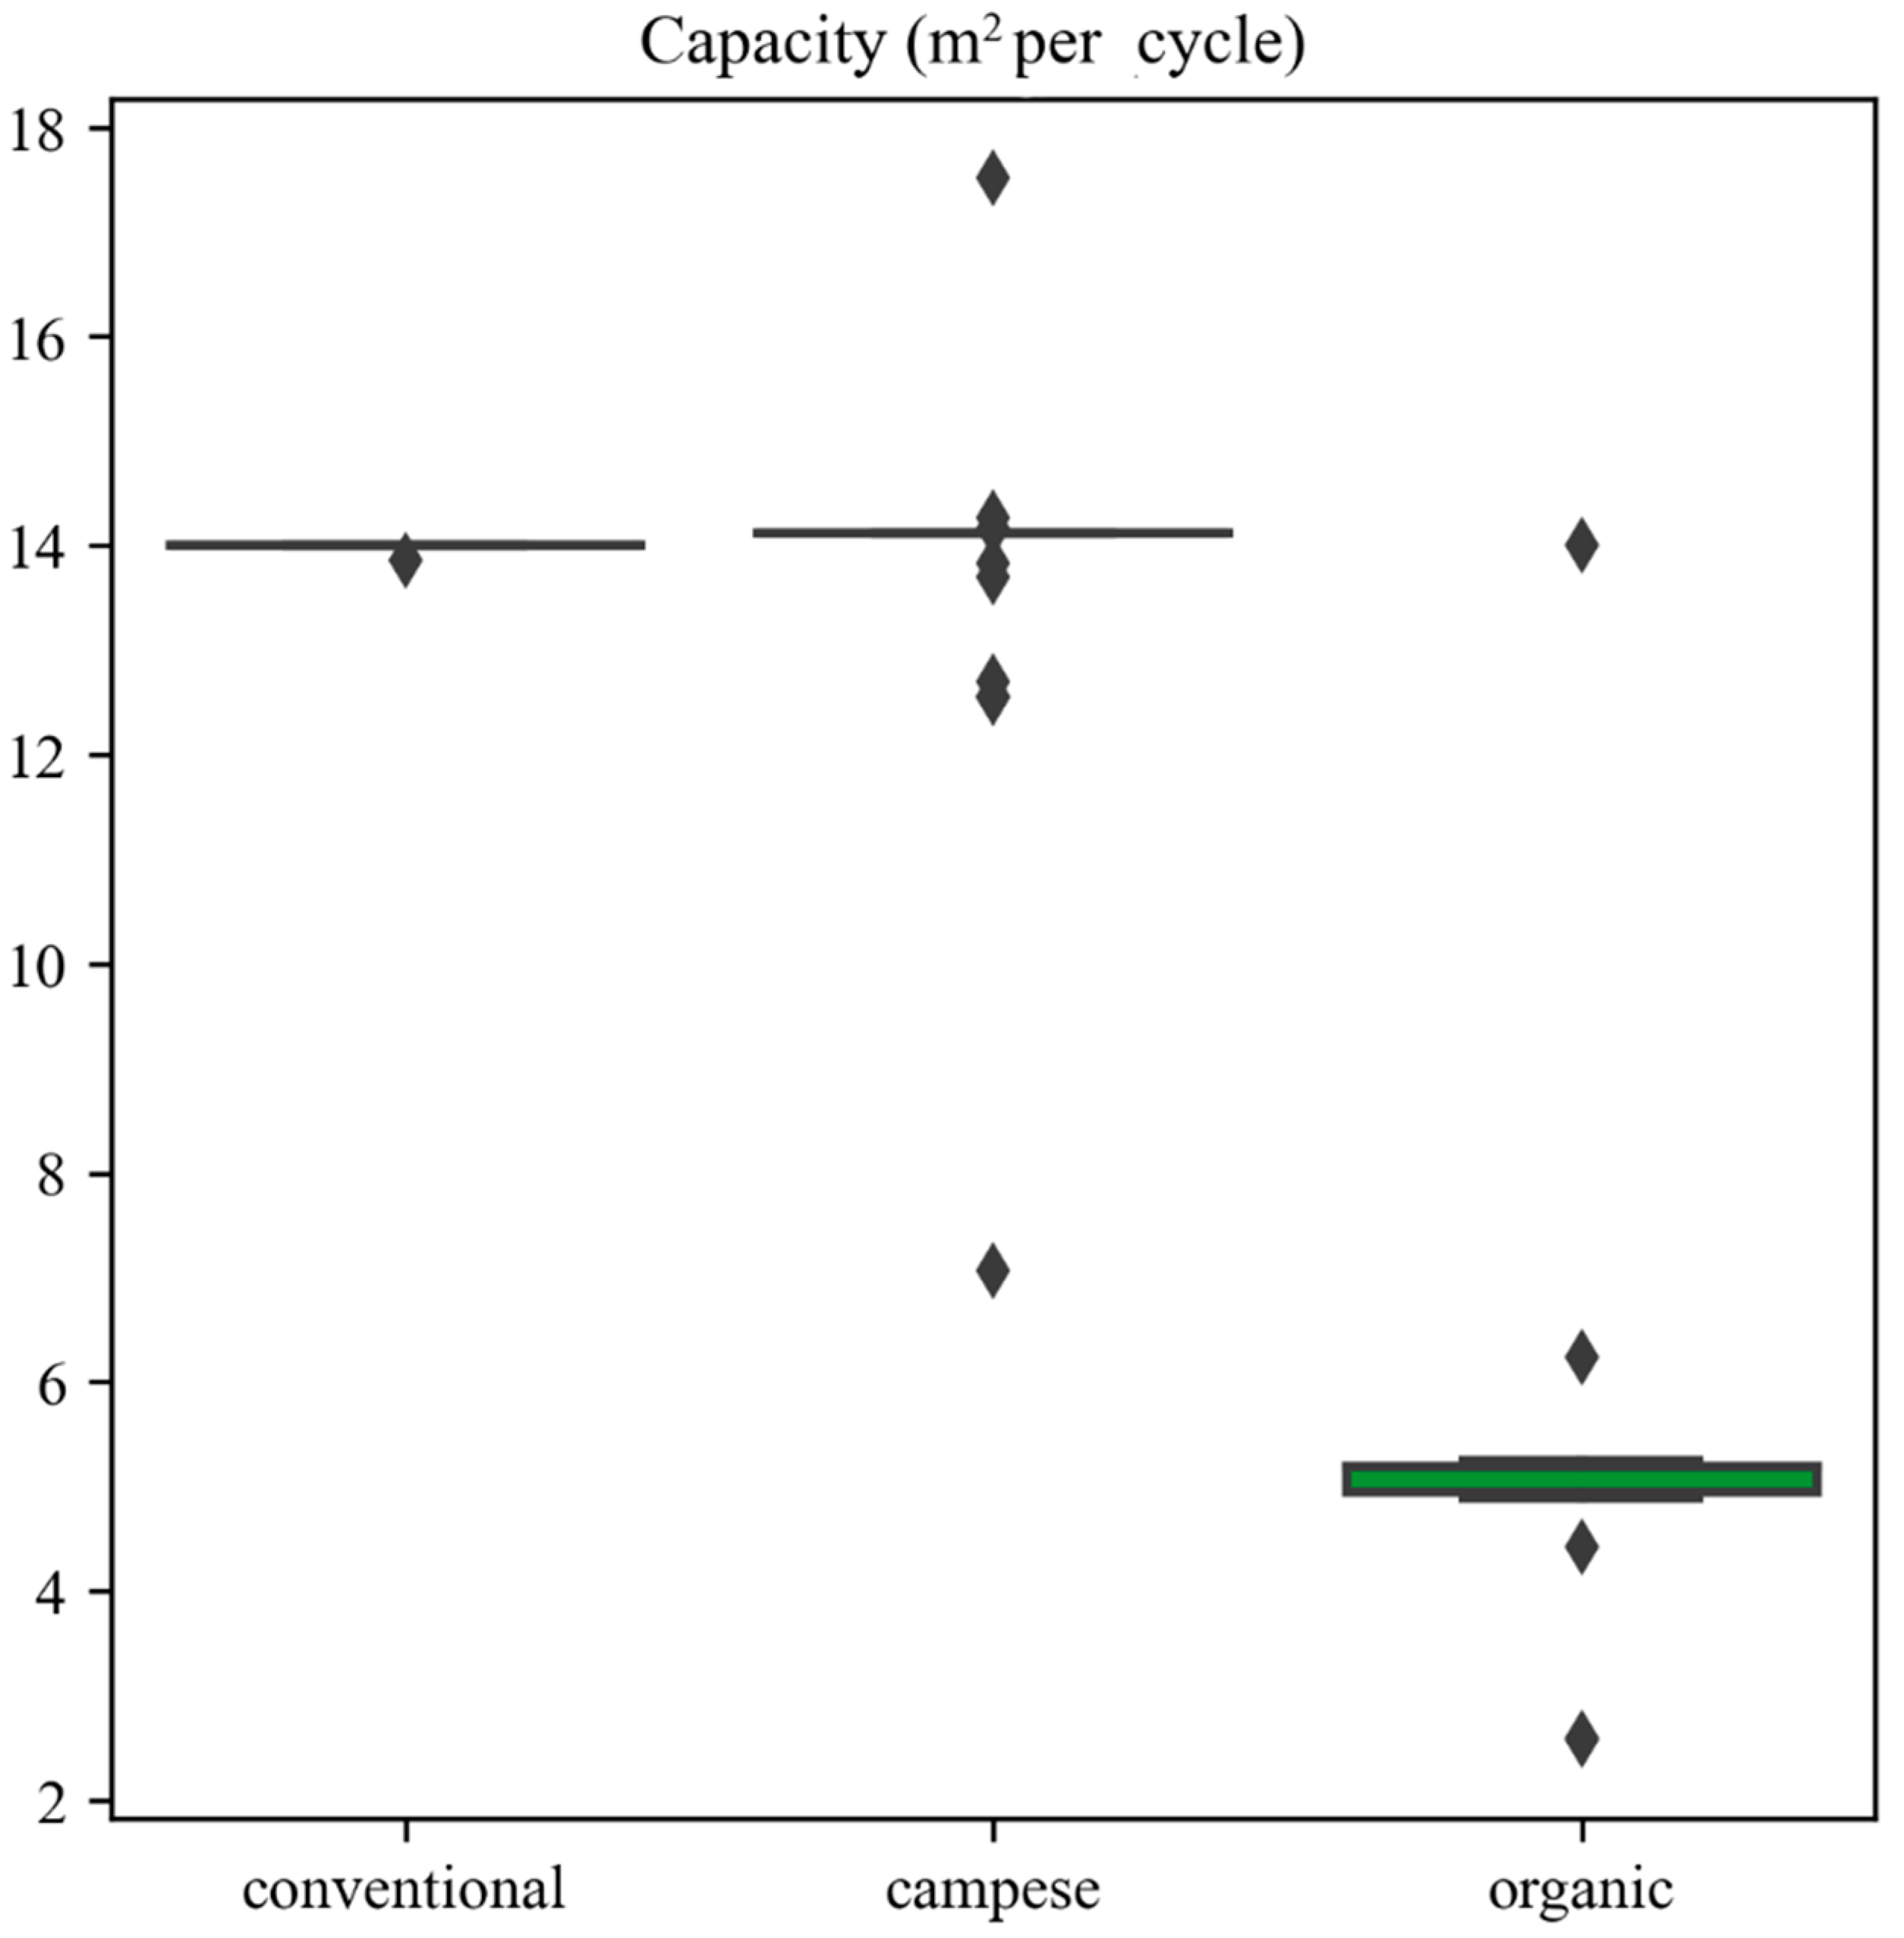
This is probably because the Campese farming system allows for the same number of cycles per year as the conventional farming system (five), but it also allows outdoor breeding (each shed needs two hectares for pasture); as a consequence, sheds are smaller and the cost of realizing them is lower (Figure 5), although the number of chickens per m2 per cycle remains more or less the same (Figure 6). On the other hand, the organic farming system leads to 30% less productivity than the other breeding systems (3.5 cycles per year), and the number of chickens per m2 per cycle is cut in half. It is also true that the Campese brand is a specific philosophy that includes a breeding system that is more compliant with animal welfare and meets consumers’ needs in terms of quality linked to sustainability and the animals’ mental and physical well-being.
For these reasons, the distances between the farms and the incubators, feed mills, and slaughterhouses were investigated. The calculation of distances between farms and other facilities (hatcheries, feed mills, slaughterhouses) is essential for optimizing the efficiency of the poultry supply chain. It helps reduce transportation costs, limits fuel consumption and CO2 emissions, safeguards animal welfare conditions by improving food safety, ensures faster delivery times, and guarantees higher-quality products.
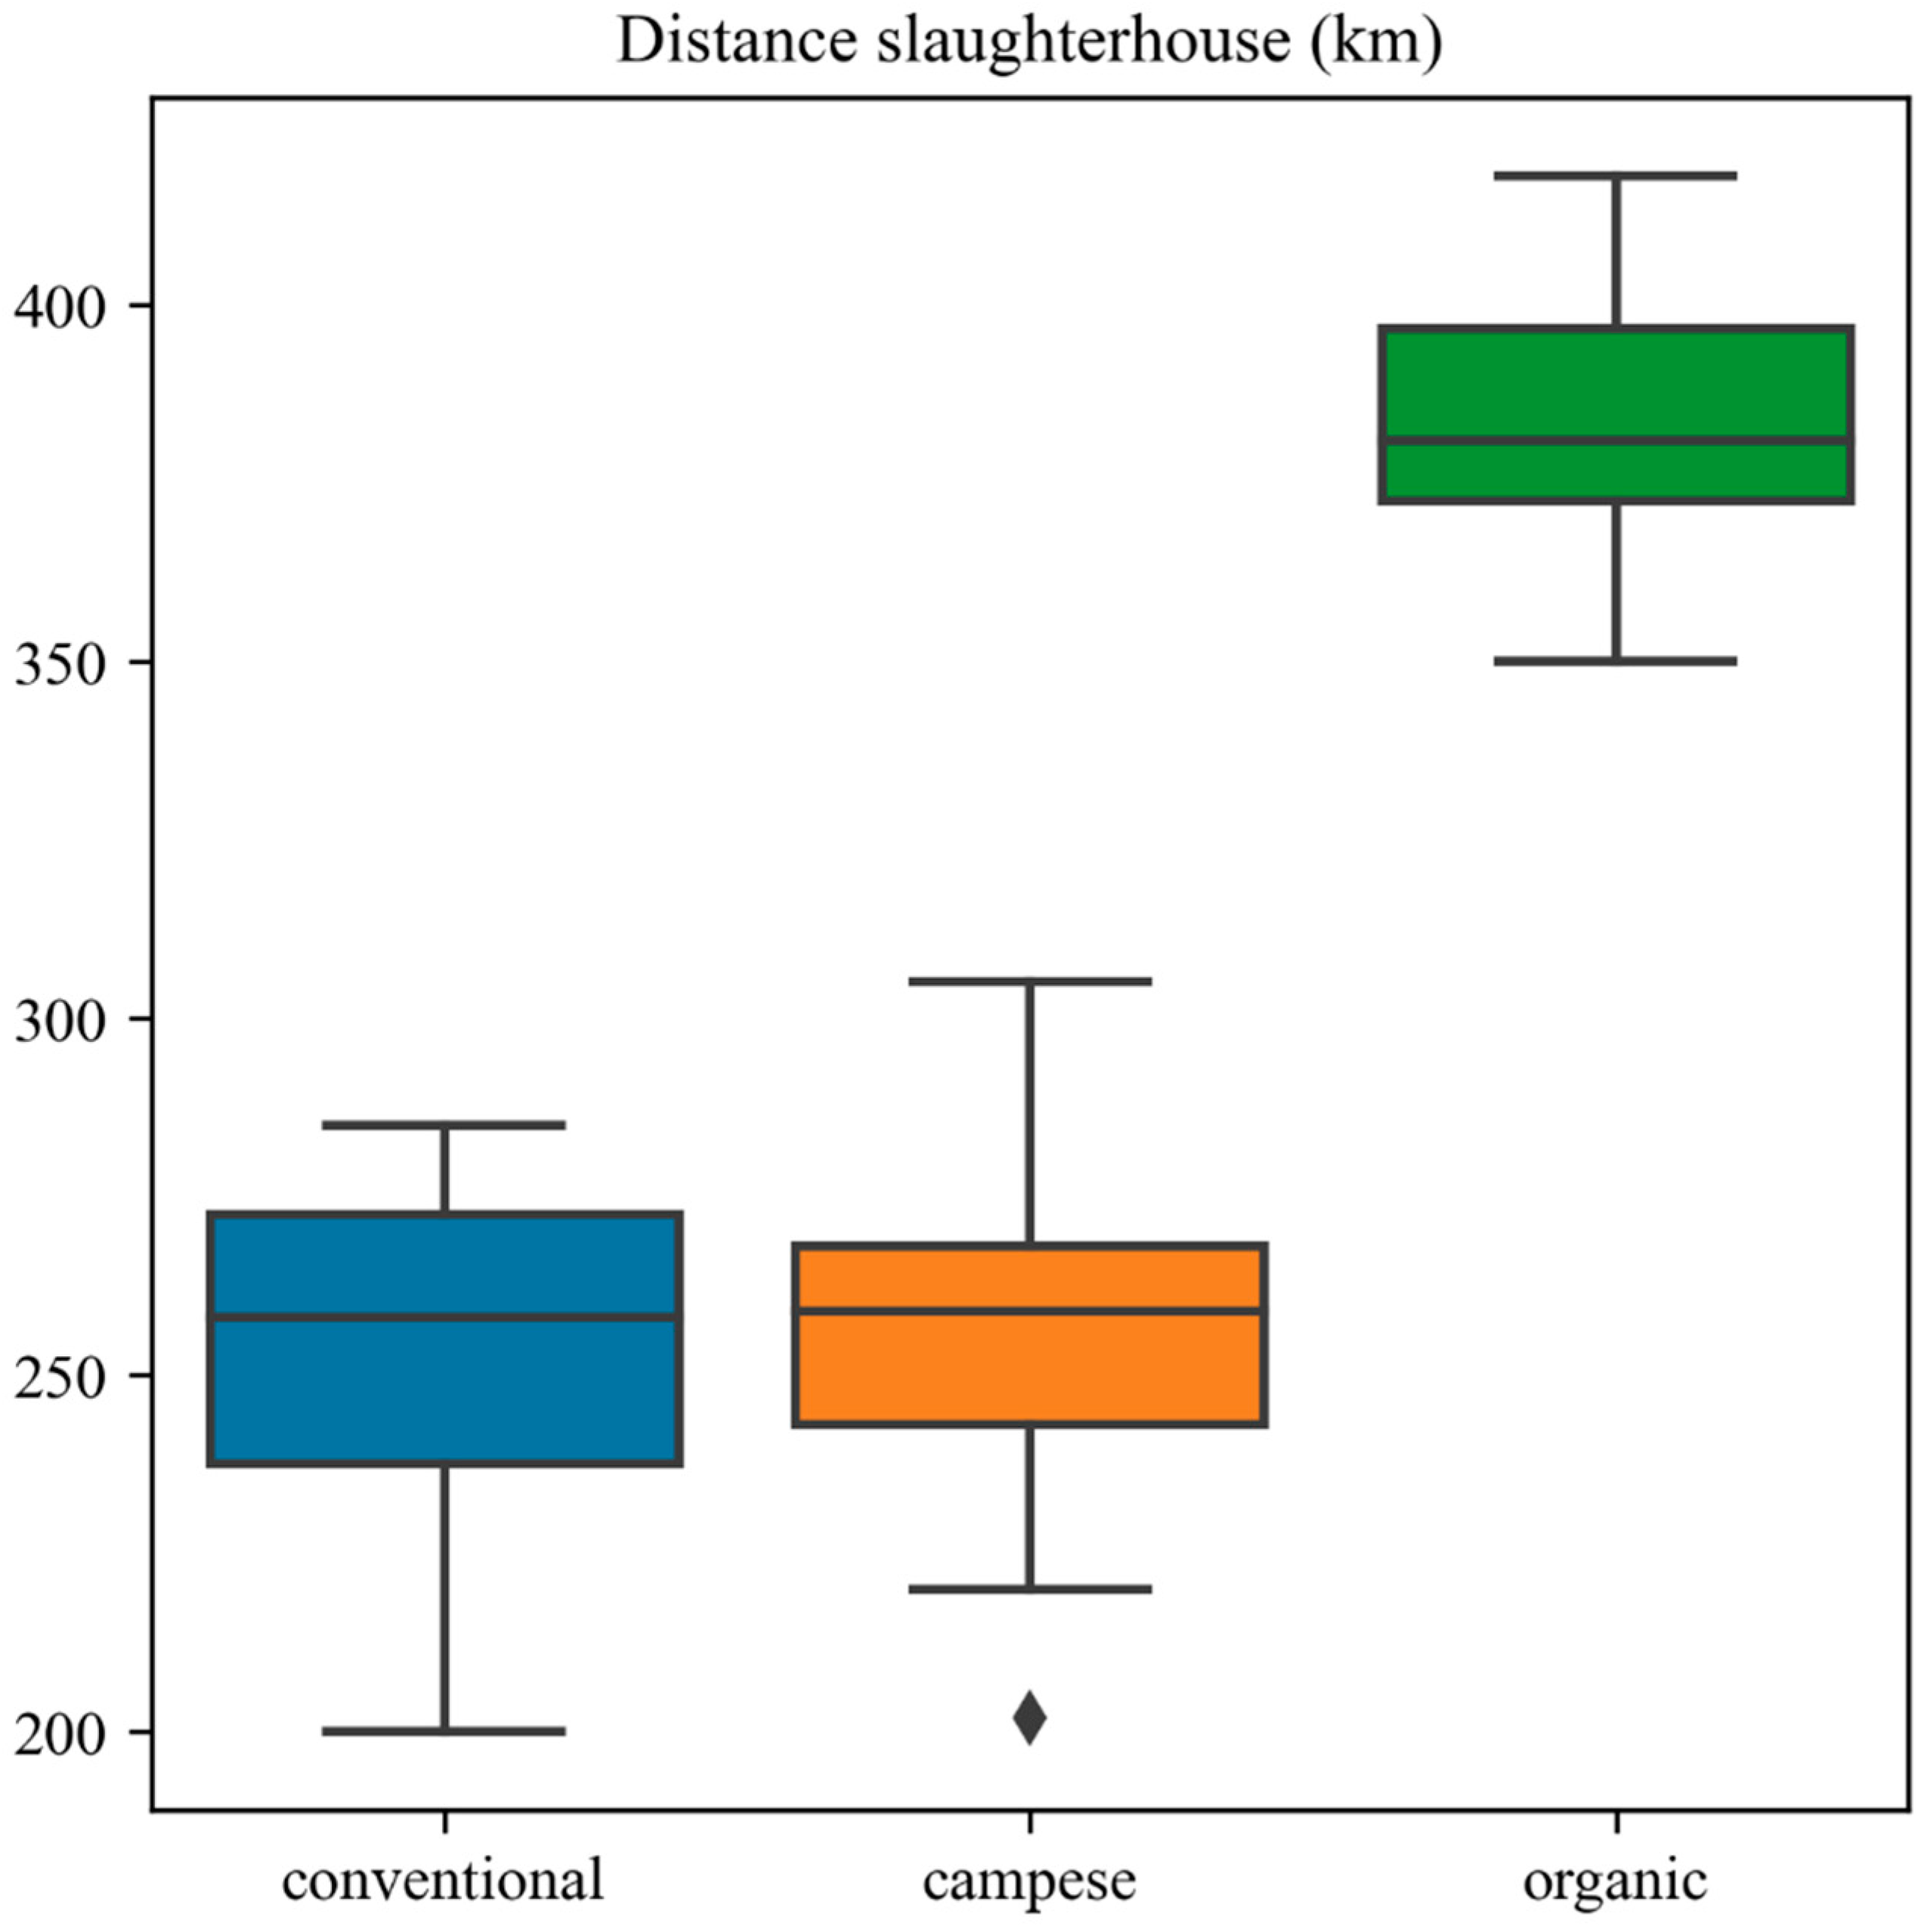
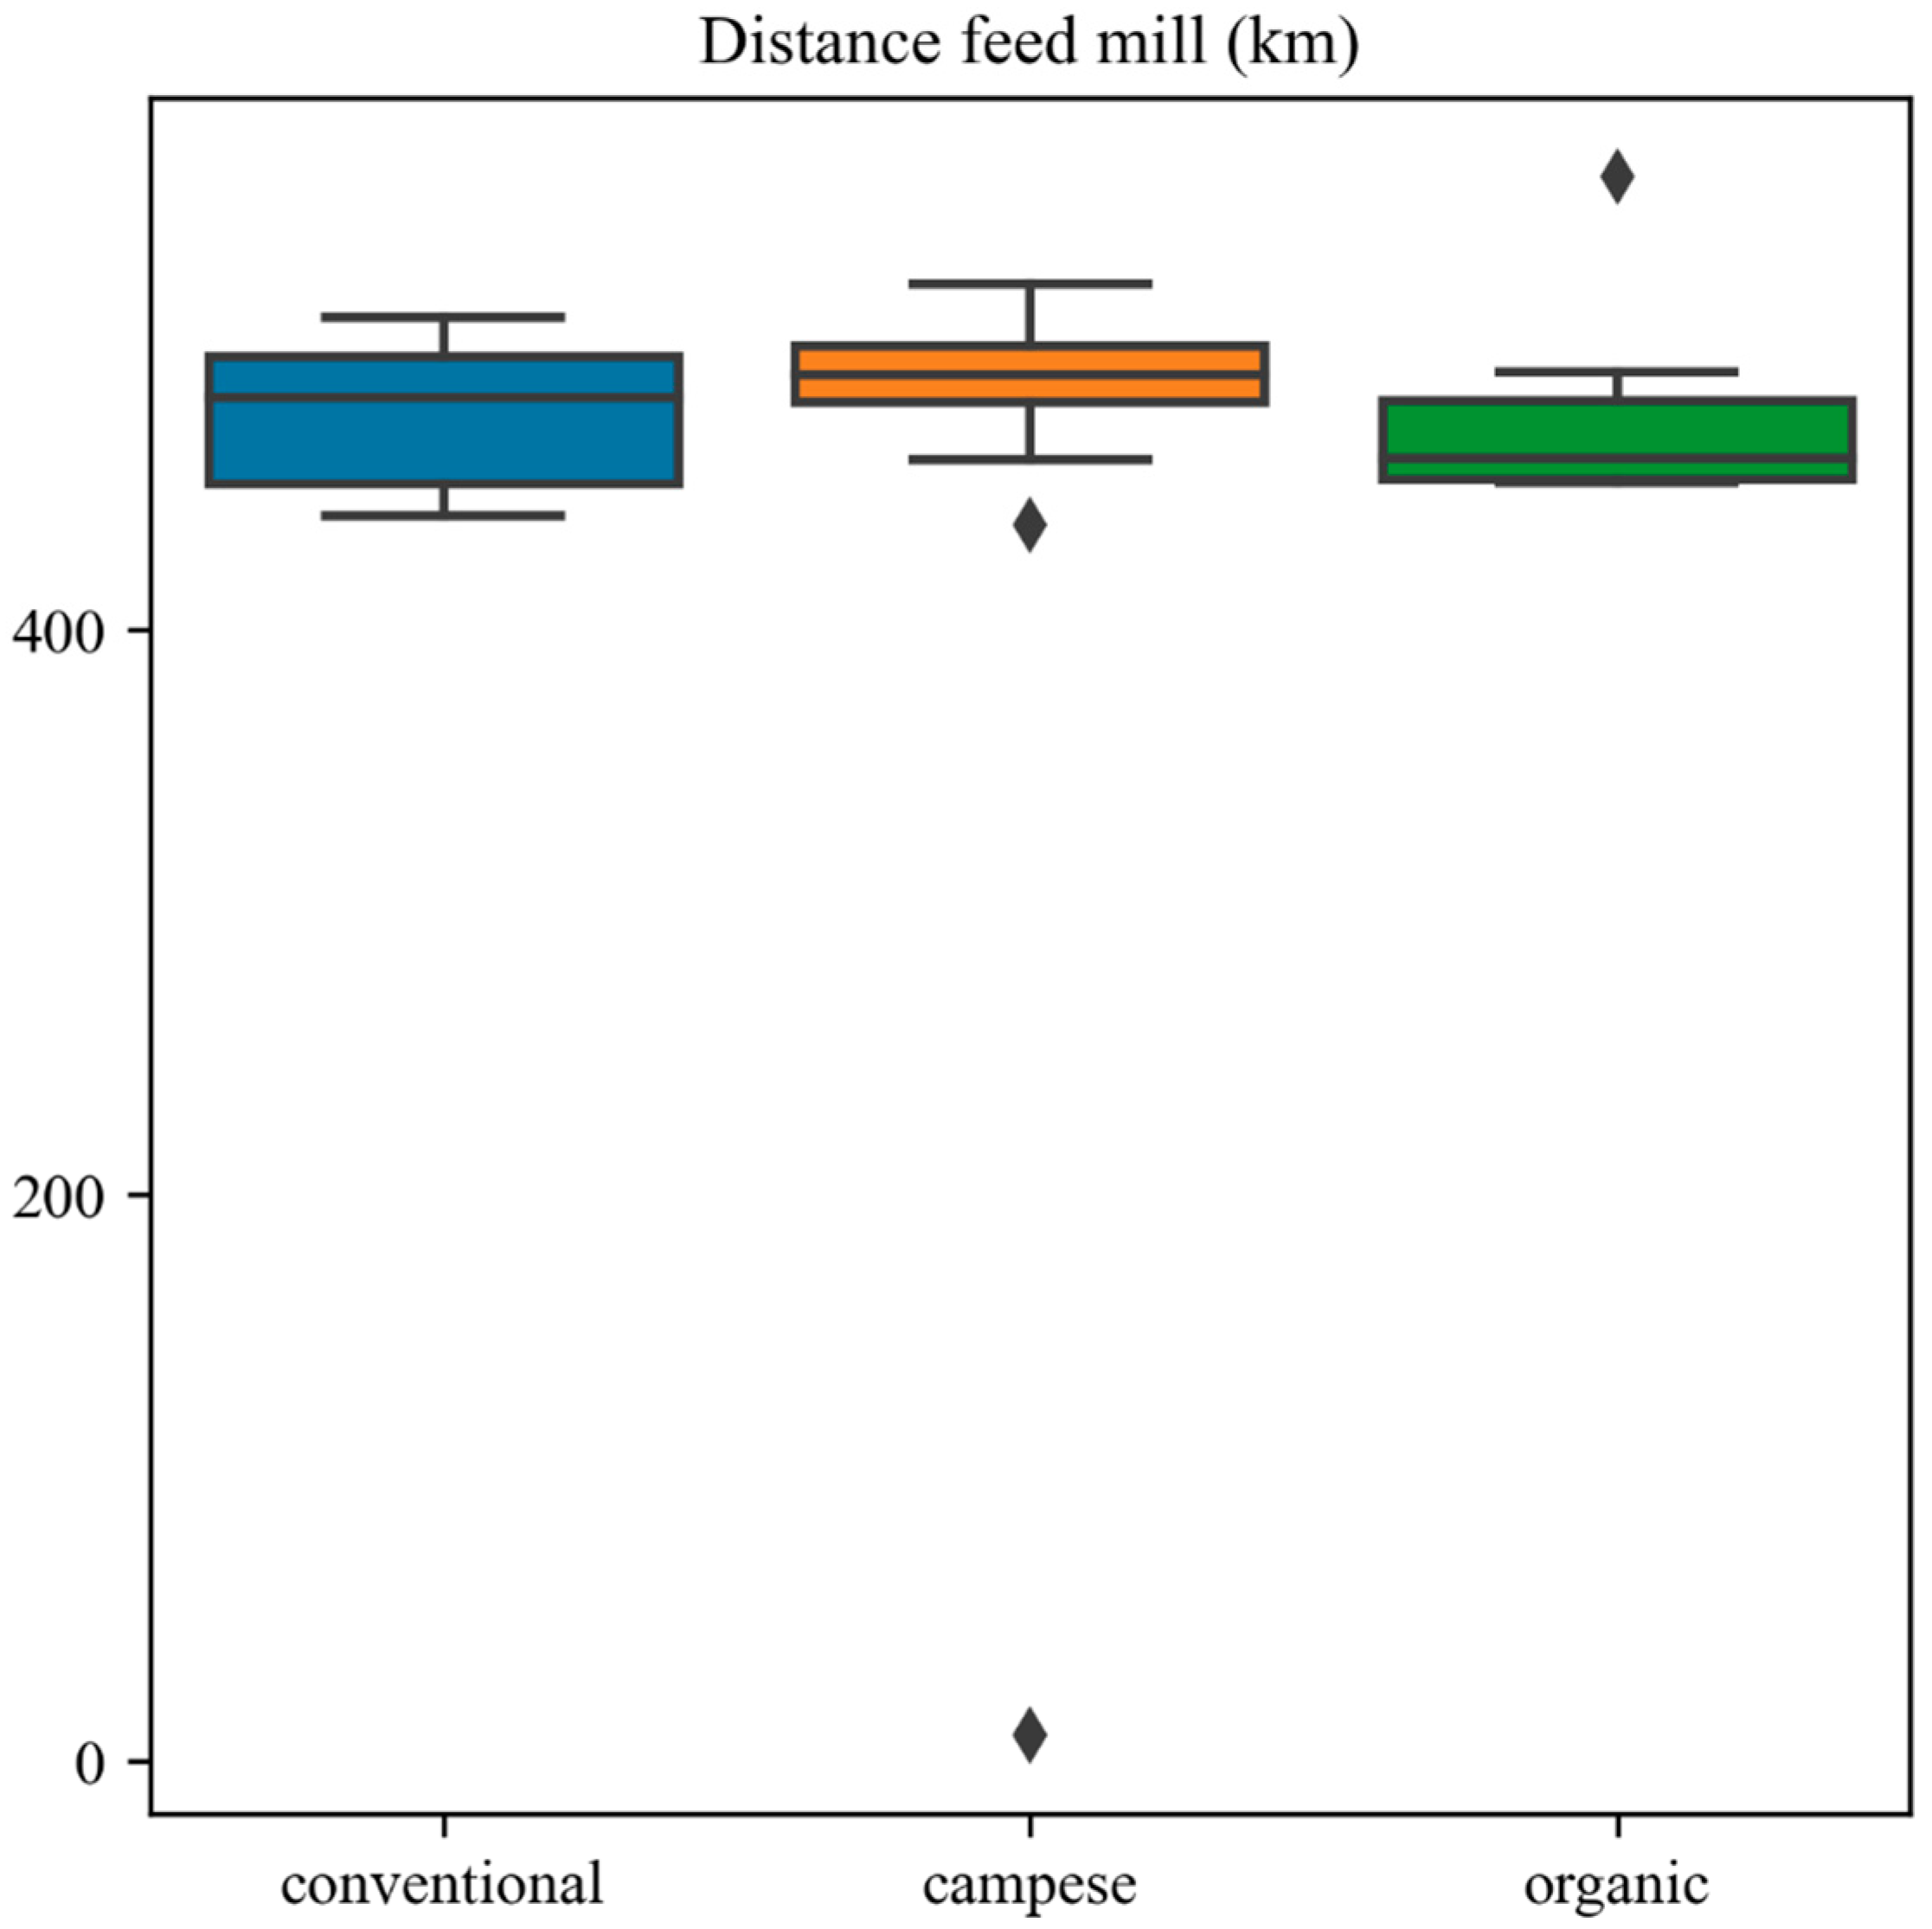
Figure 7 shows that the incubators for conventional and Campese farming systems tend to be located within 200 km, but for organic farming, the average distance is over 500 km. Figure 8 shows that the same distance of approximately 500 km was detected with respect to the feed mill for all three breeding systems. For the slaughterhouse, the same distances as in the incubator situation were detected. Indeed, Figure 9 shows a distance range of almost 250 km for conventional and Campese farms and about 400 km for organic farms.
Starting with the farms’ coordinates, the centroid for each type of farming system was calculated using Equation (1). Figure 10 shows the centroid locations for organic farms (green), Campese farms (orange), conventional farms (blue), and all farms together (red).
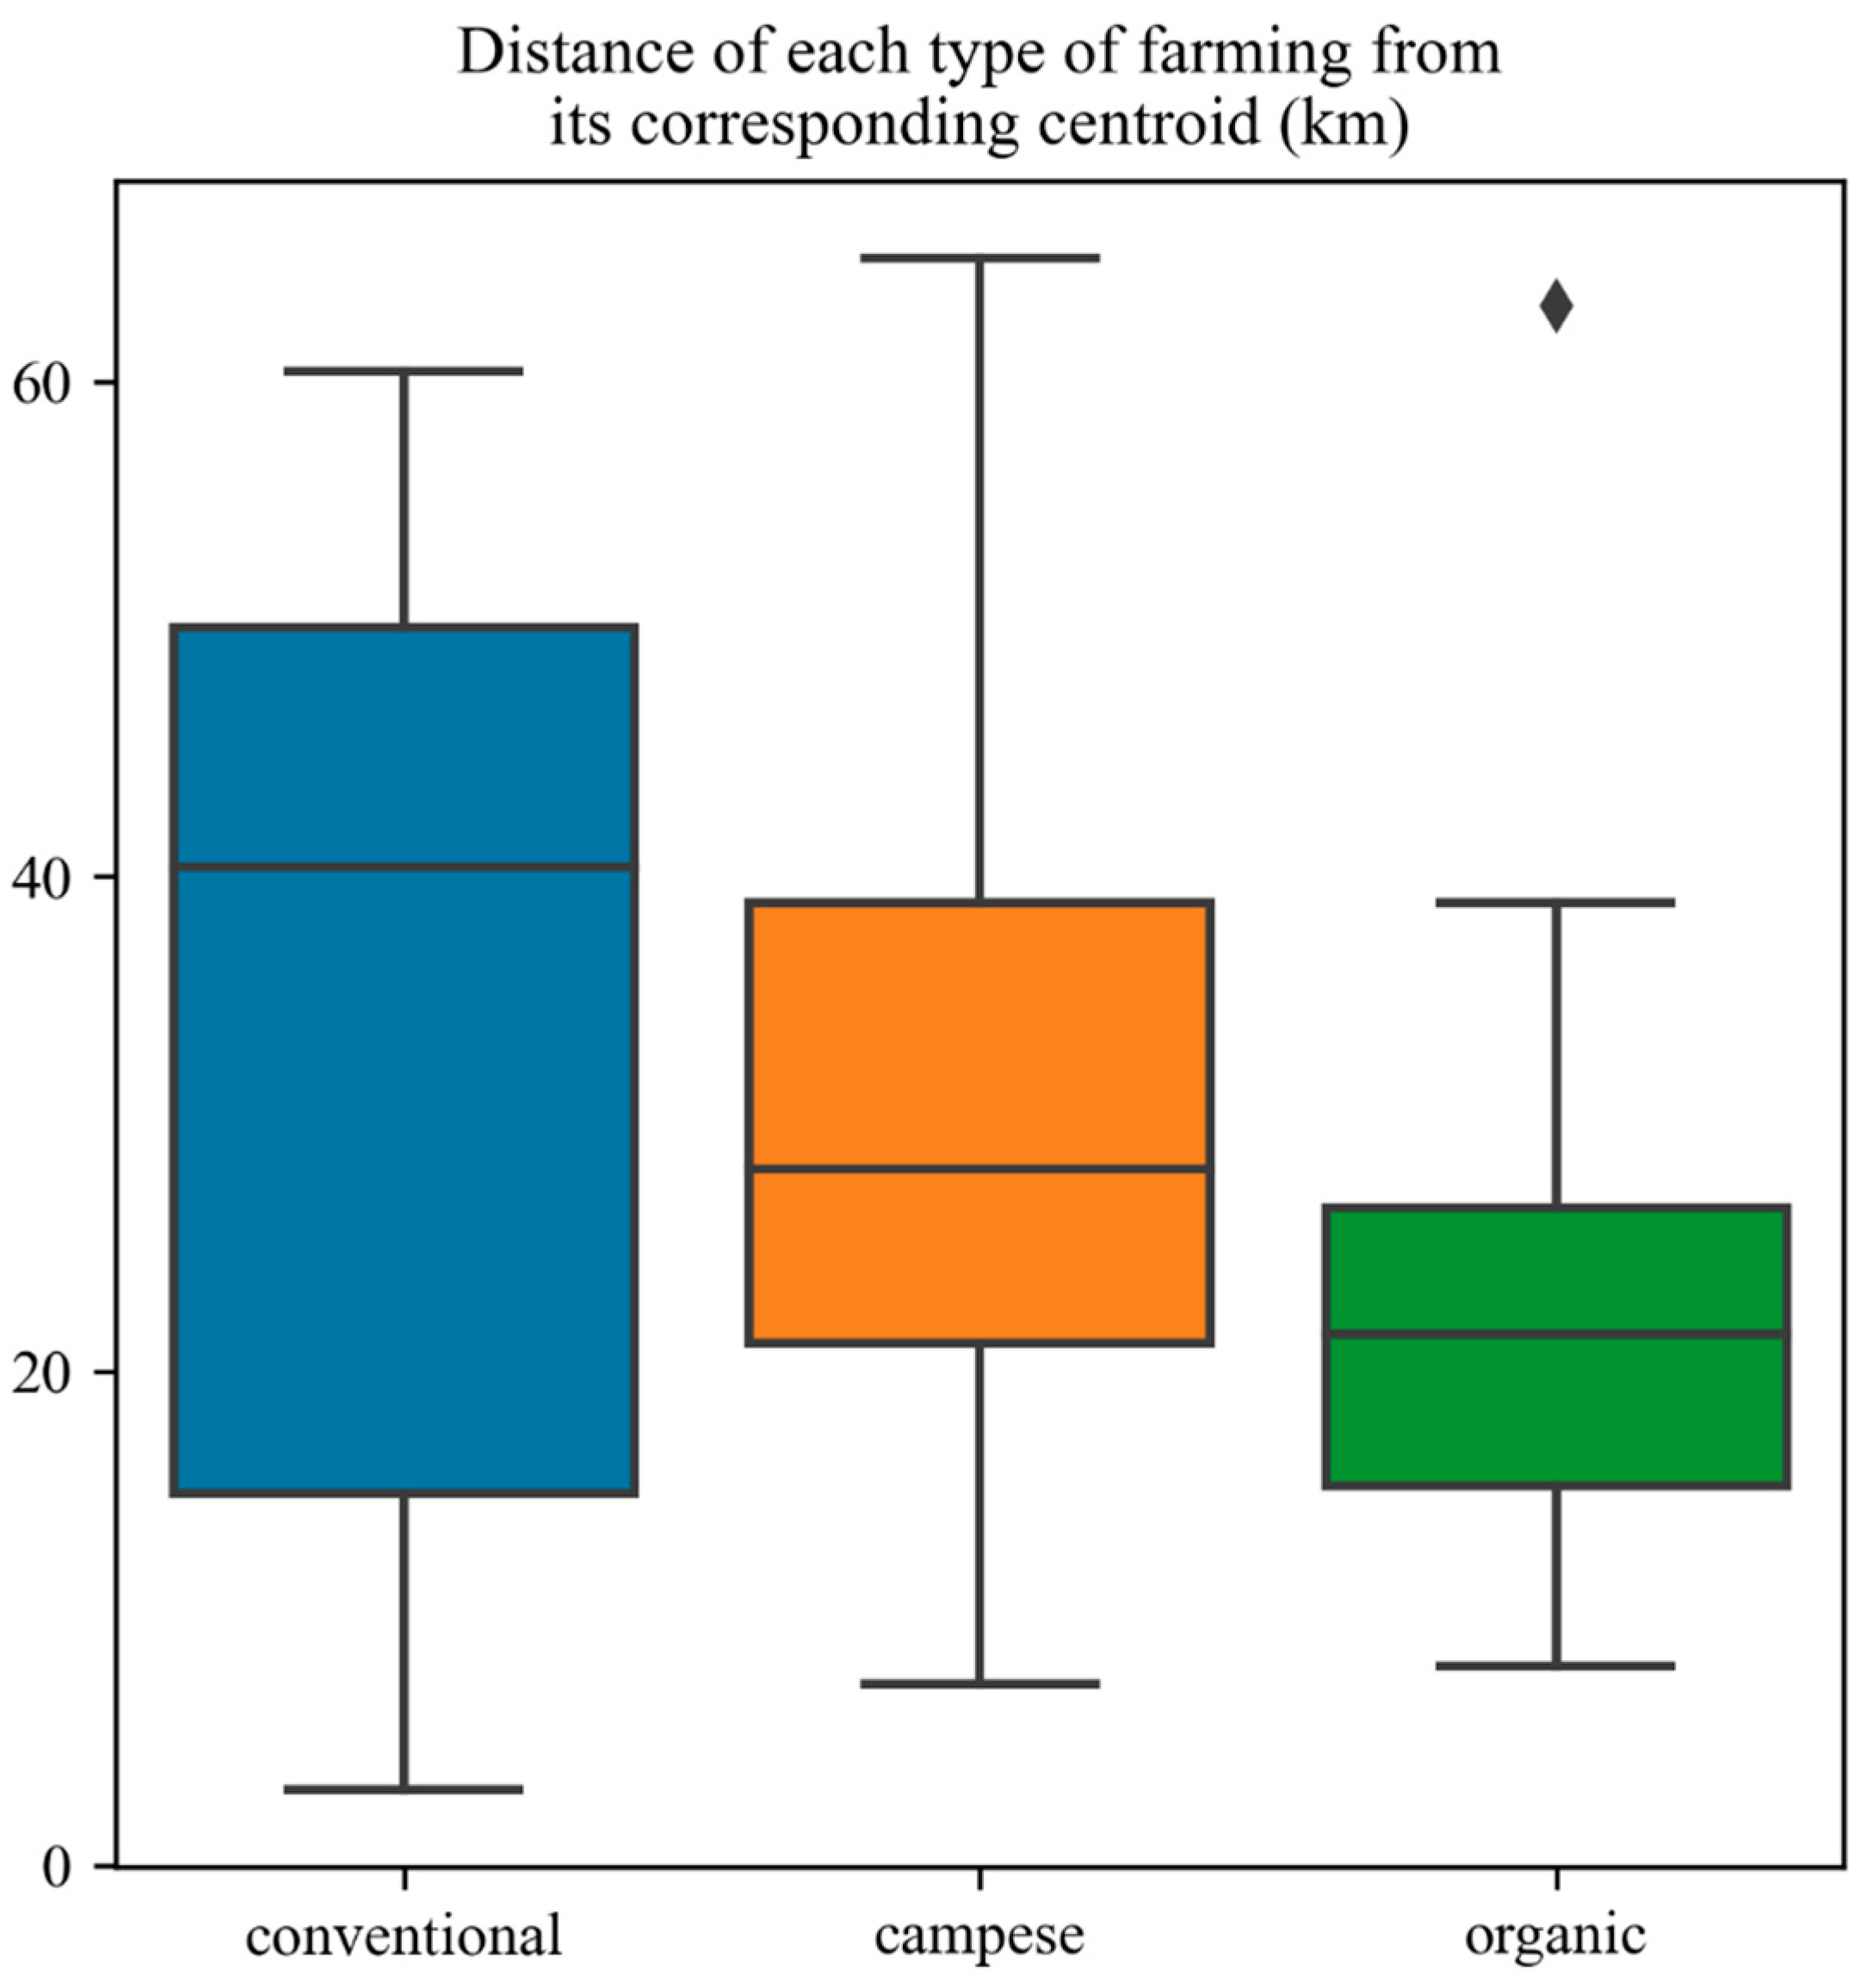
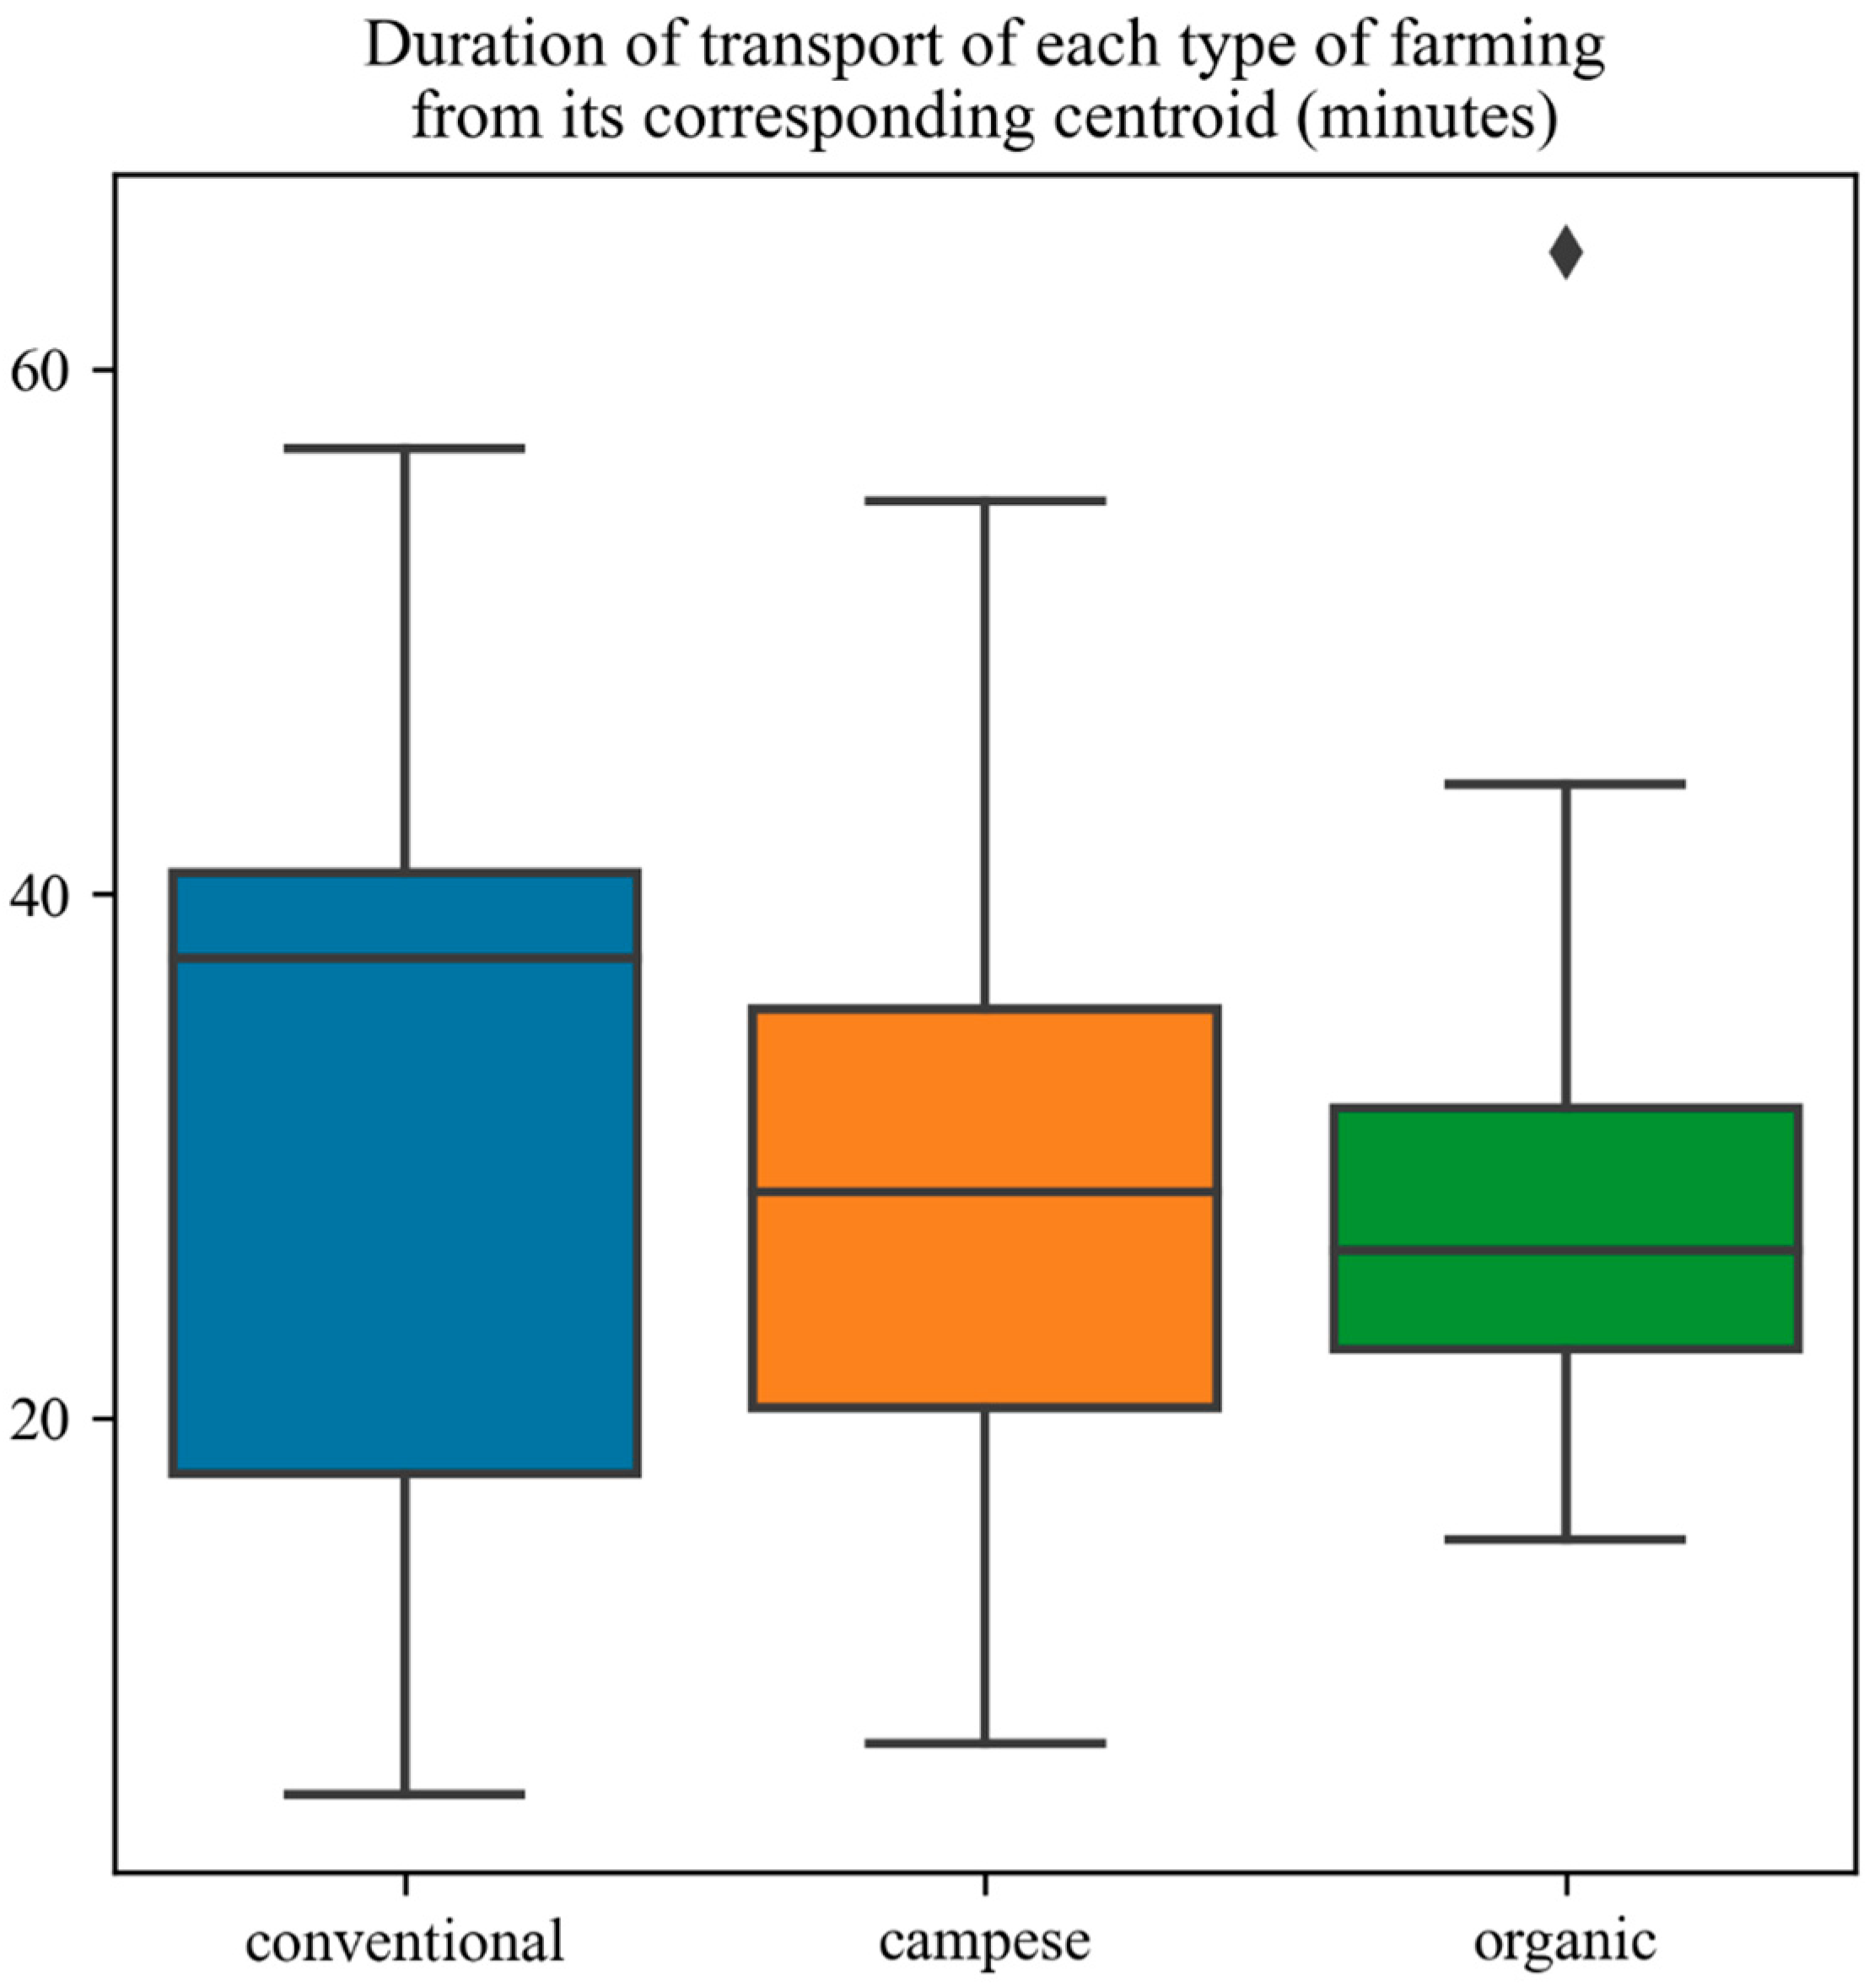
Figure 10 and Figure 11 show the distance between each type of farm and its corresponding centroid by highlighting the results in km and min, respectively. The scenario described in the figures shows great advantages in terms of environmental and economic impact reduction as well as animal stress reduction. It could be the optimum situation in terms of management practices for achieving sustainability in the poultry supply chain.
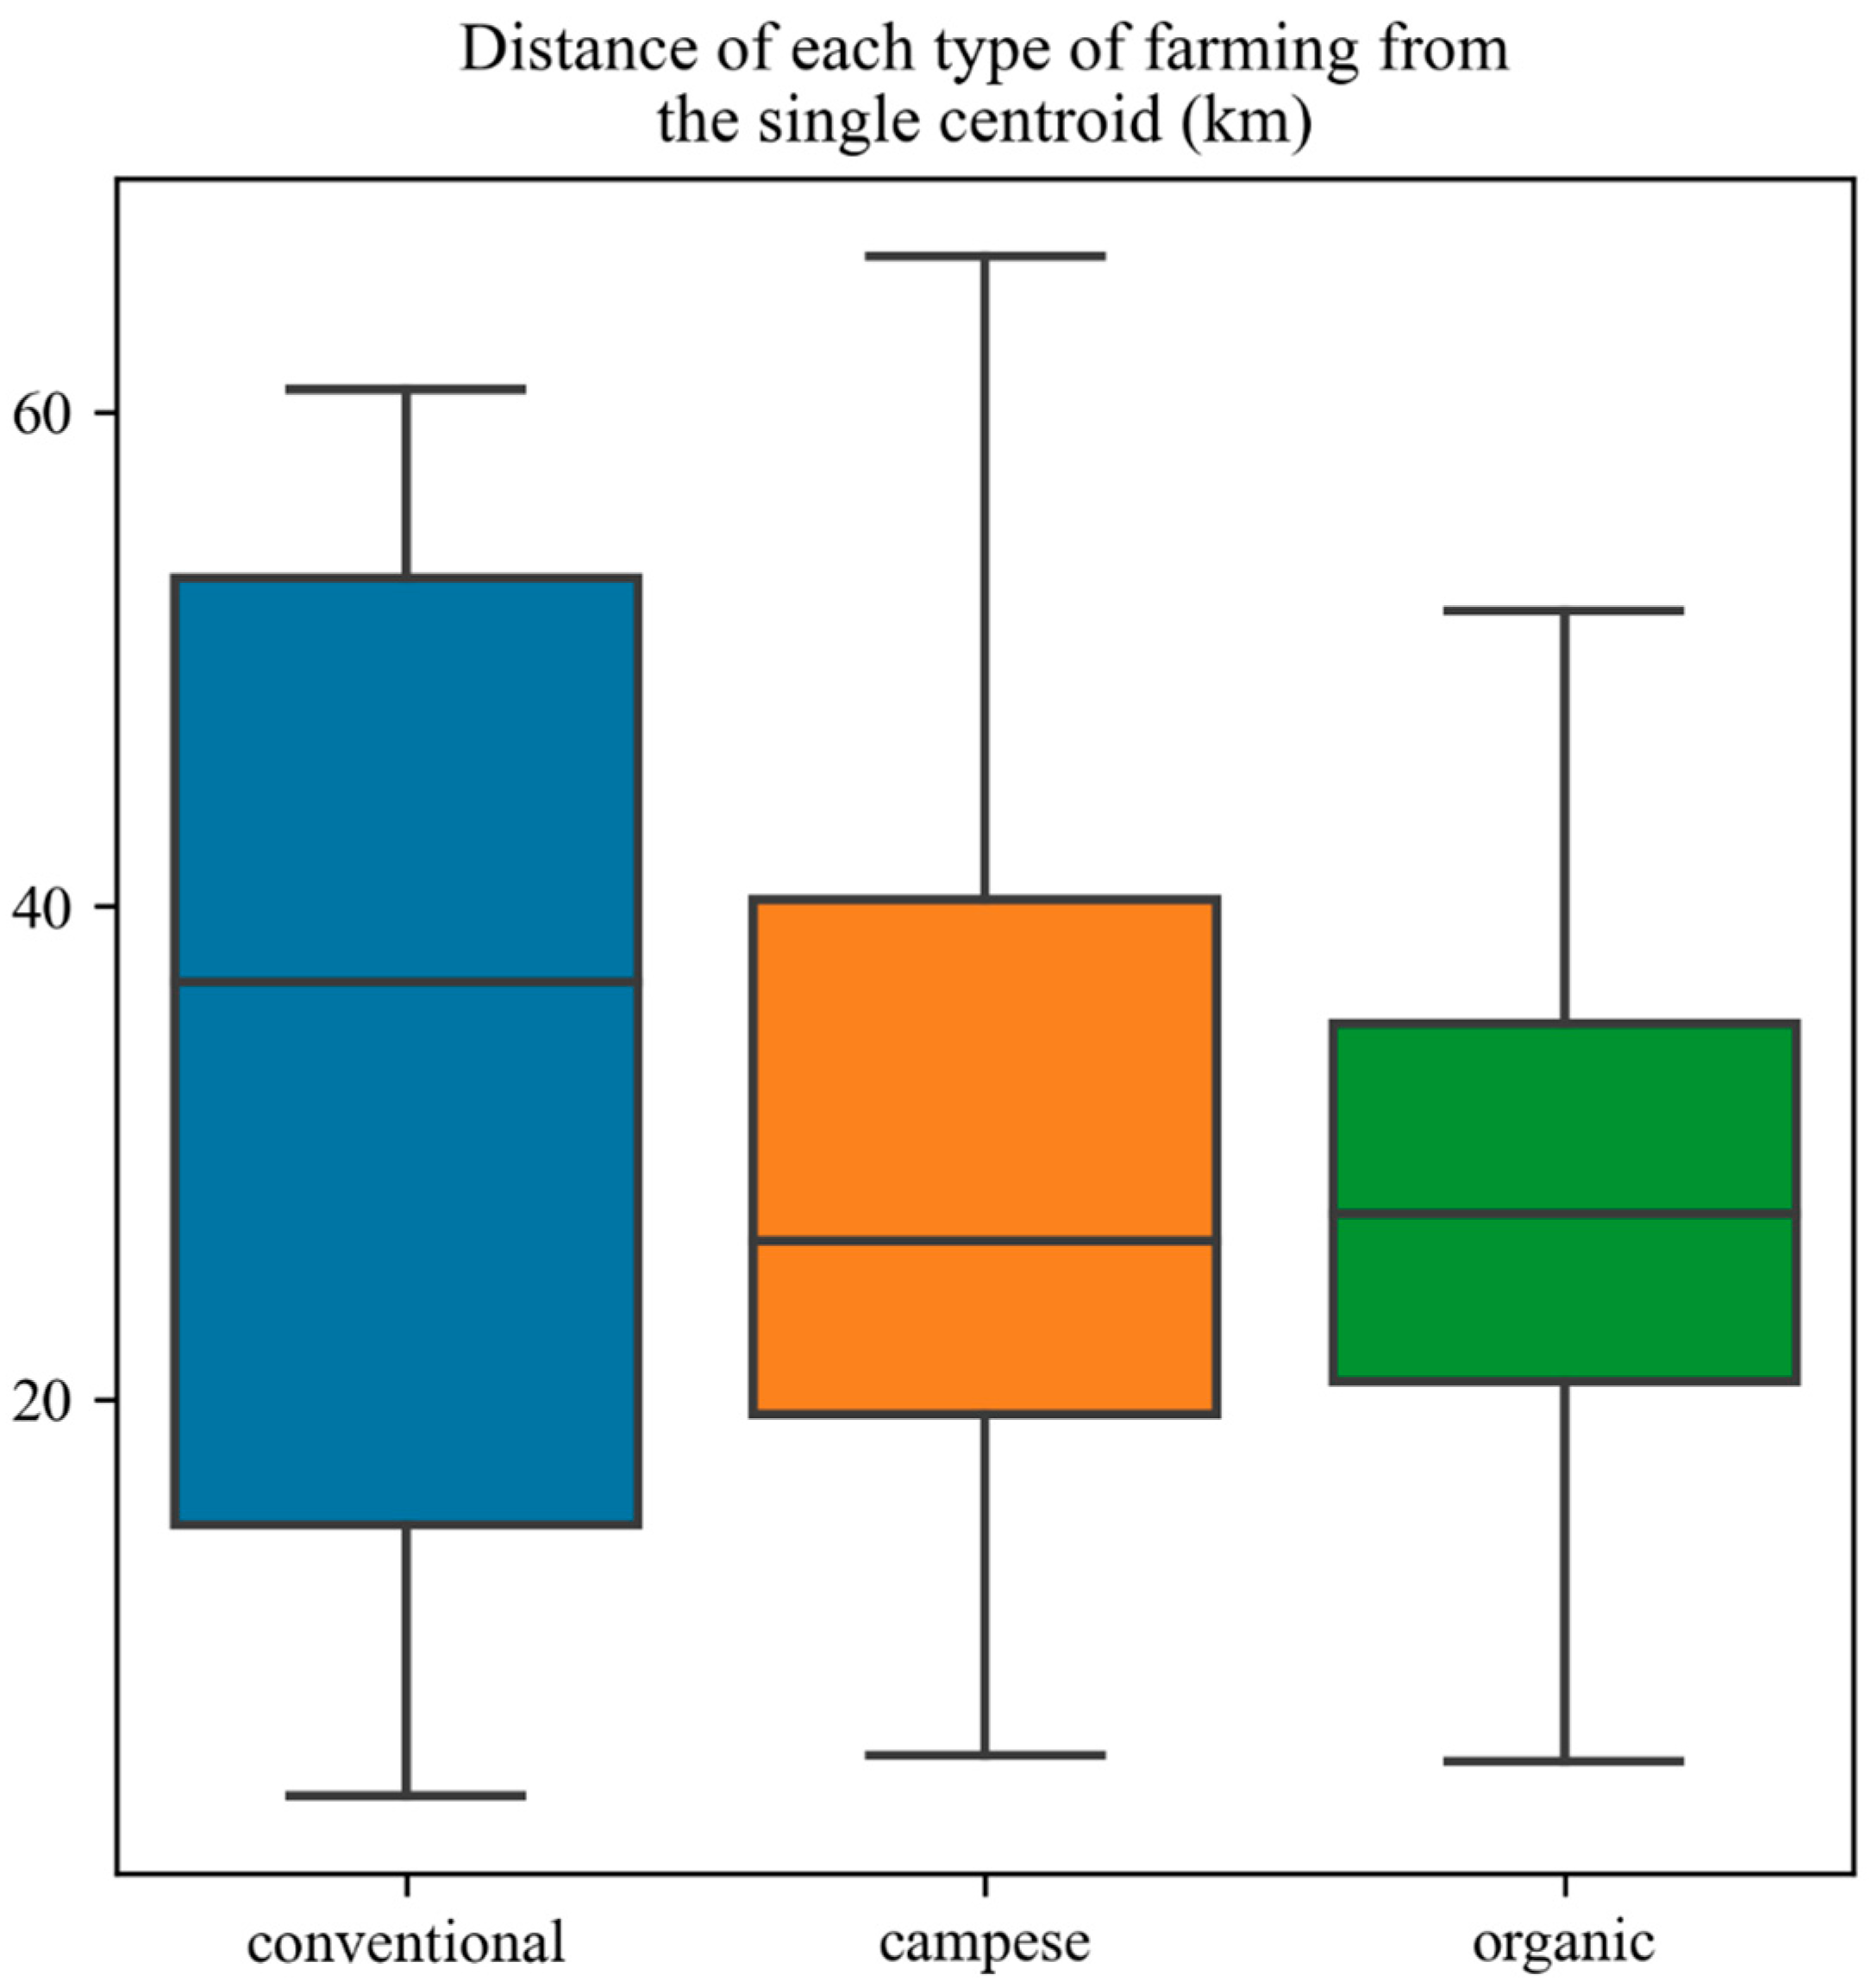
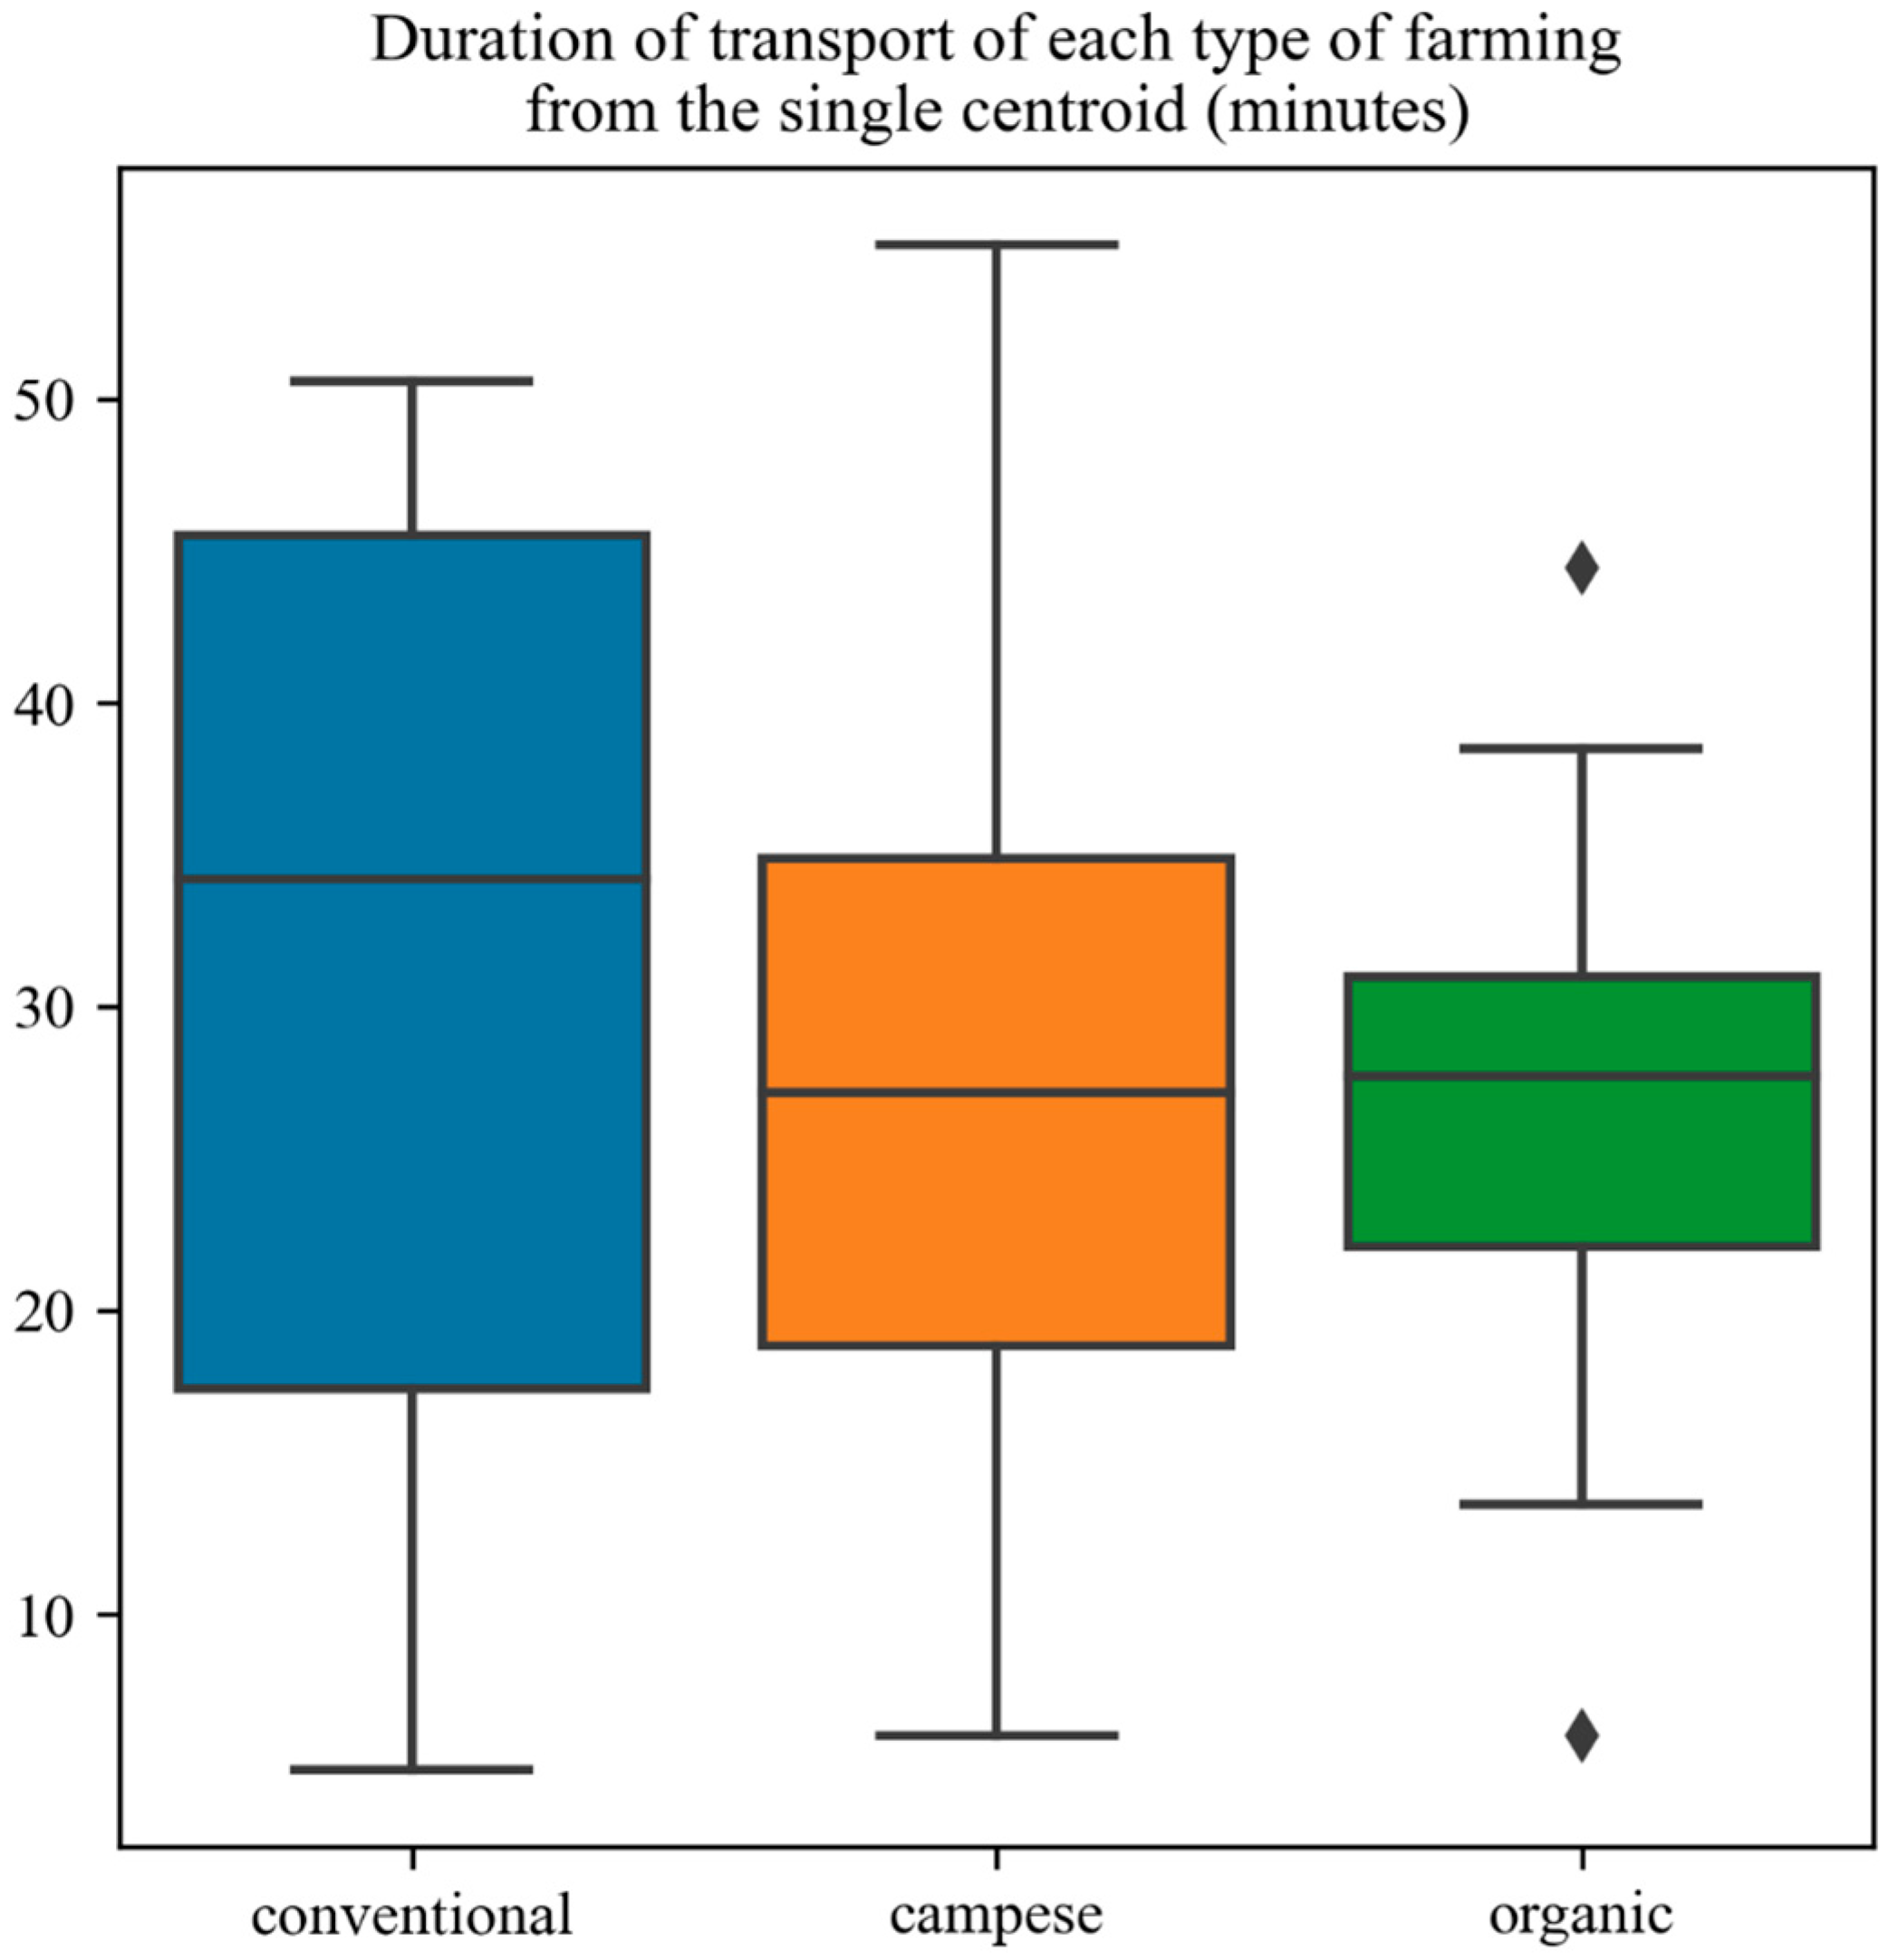
However, having specific facilities, such as incubators, feed mills, and slaughterhouses, for each type of farming system is not realistic and is certainly too expensive, so it could be reasonable to have one site in which a single factory could work with specific and separate production lines. For these reasons, the calculation of a single centroid, based on the overall farm distribution, could help with locating upstream and downstream farming facilities. In Figure 12, the distance in km and duration in minutes were calculated from each farm to the single centroid represented by a cross. Figure 13 and Figure 14 show that no significant differences were revealed with respect to the corresponding centroid, as Figure 10 and Figure 11 show.
At this point, it would be useful to understand how an optimal situation could be highlighted, which may be analyzed by grouping georeferenced data by calculating the k-means using Equation (2).
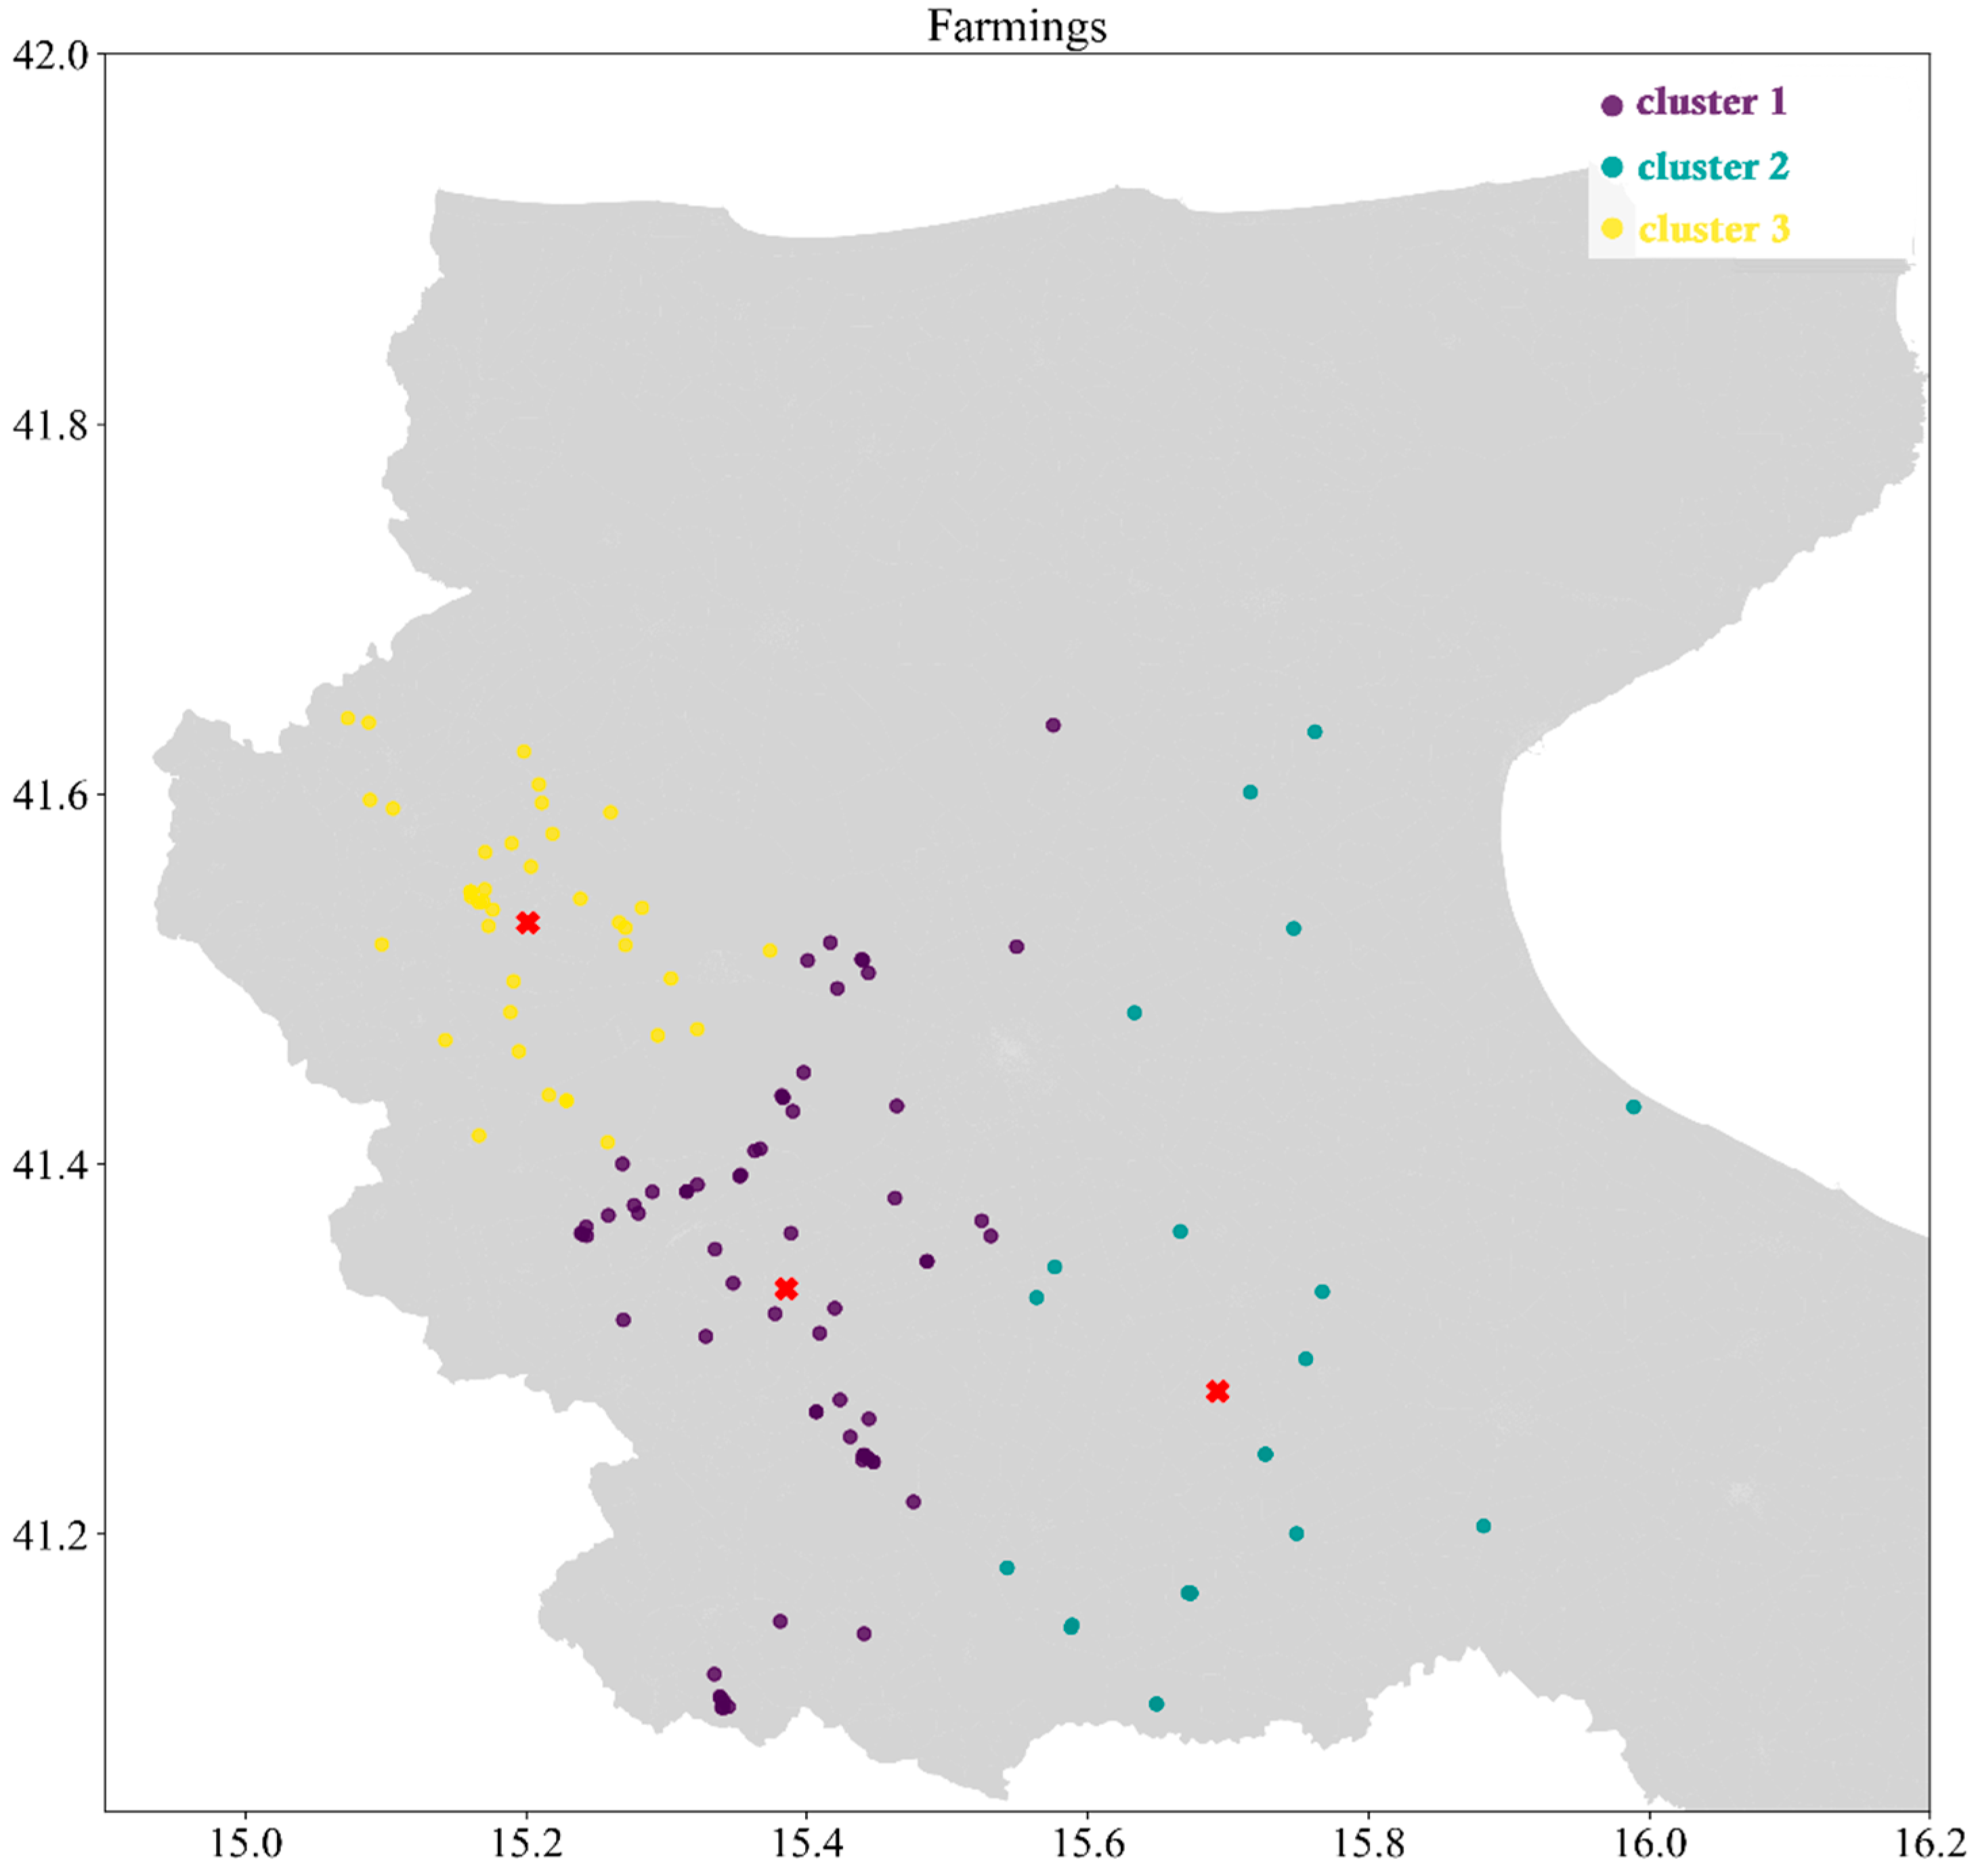
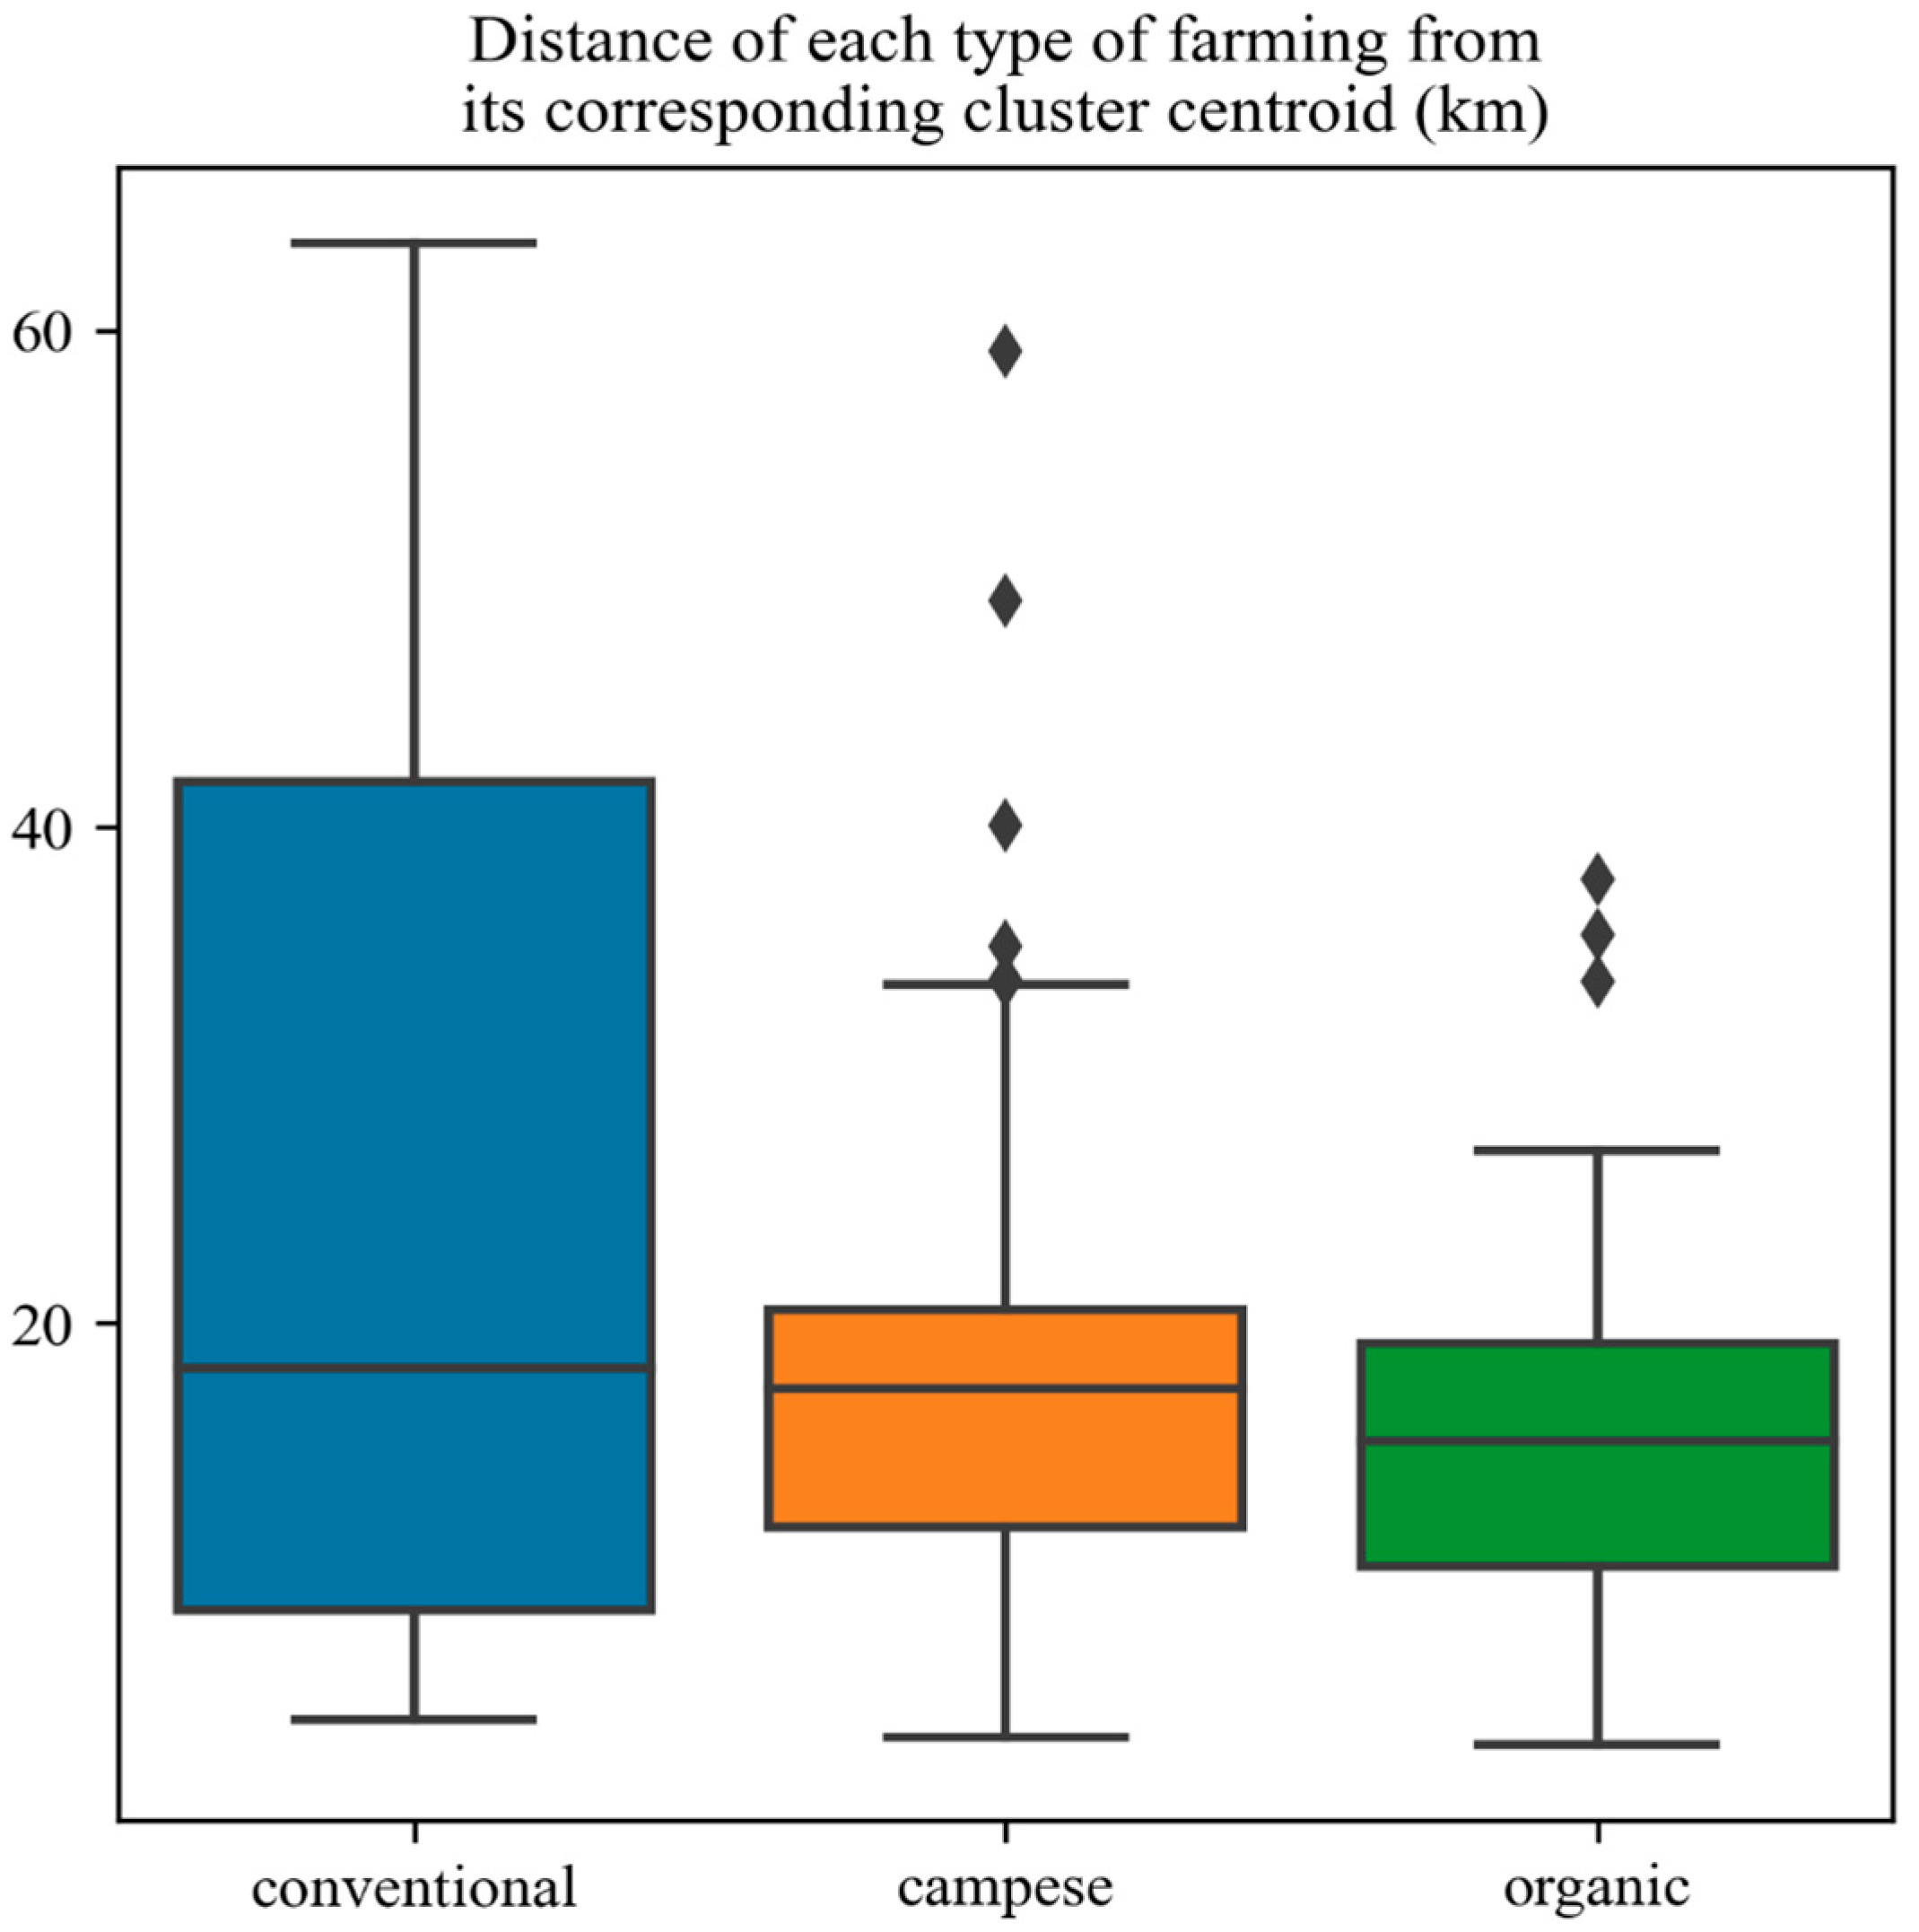
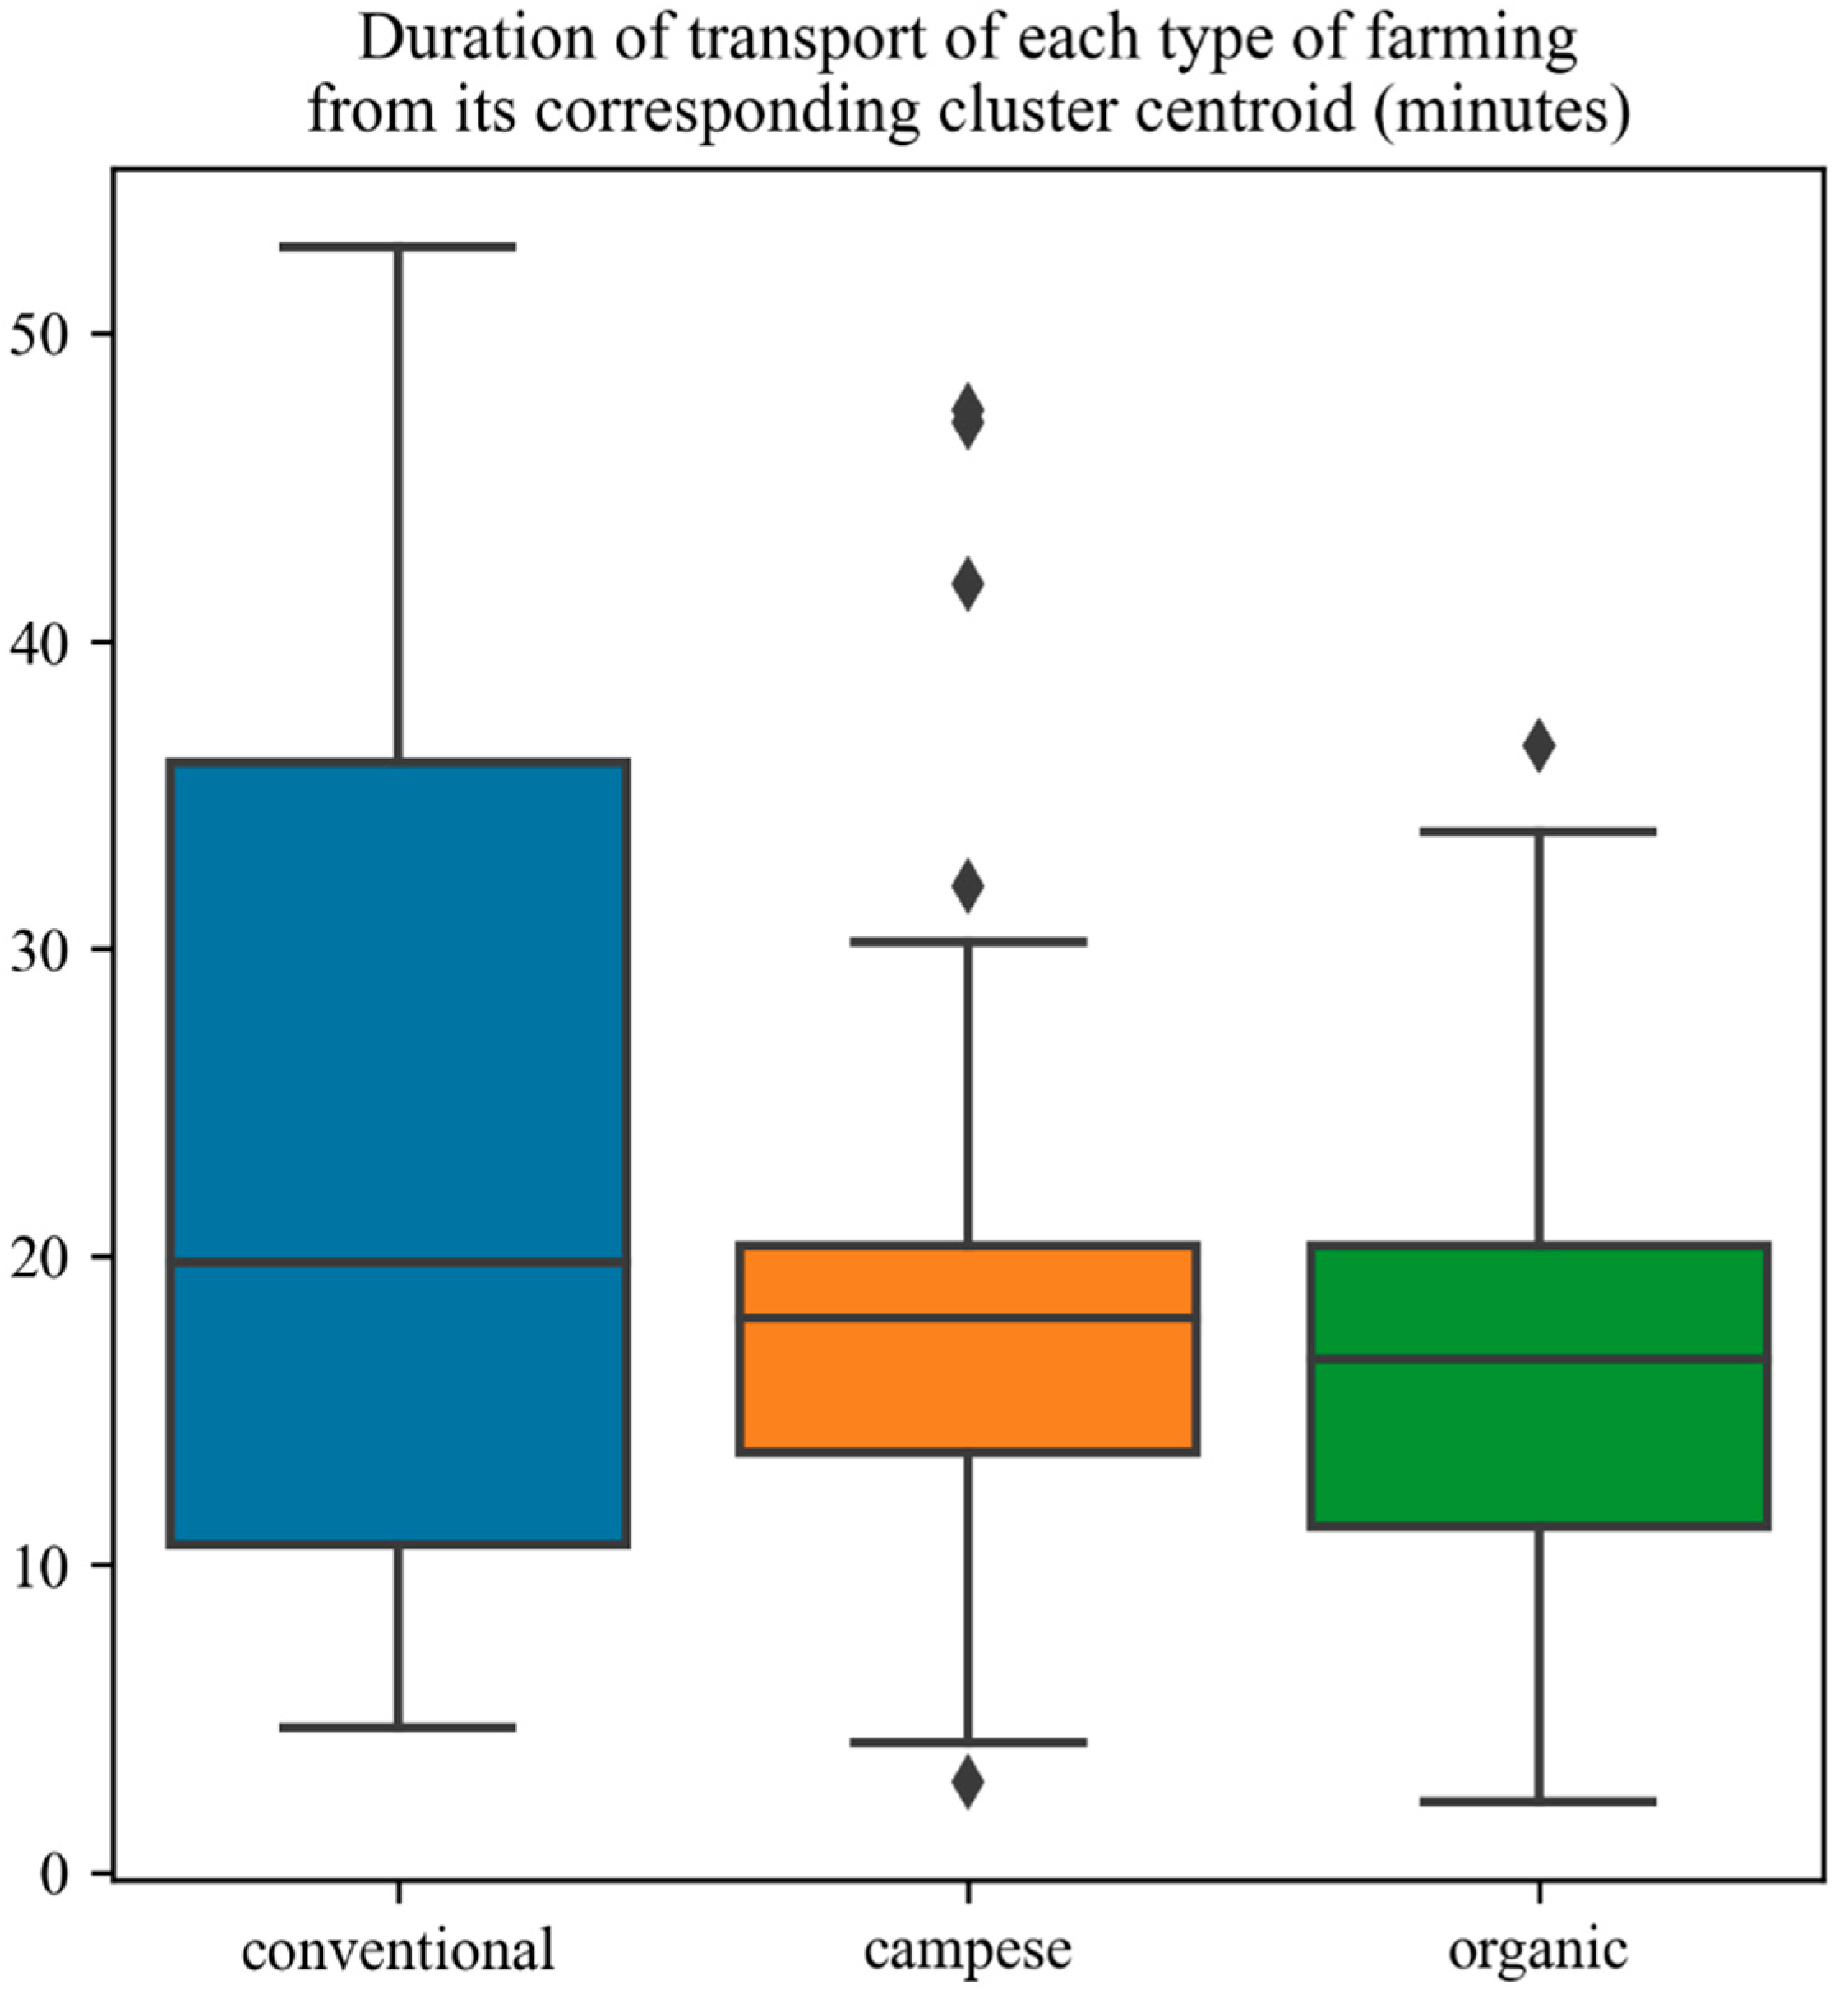
Figure 15 shows the distribution of the three hypothetical clusters grouped to further reduce the distance between groups of farms. Indeed, Figure 16 shows a clear distinction among the three types of farms and the relative distance reduction, especially for Campese and organic farms in the scenario presented earlier. Consequently, distance reduction entails a reduction in minutes, as Figure 17 shows.
The negative effects of transportation included increased mortality and altered meat quality, which can cause reductions in profits and consumer preference. Moreover, studies have demonstrated that the mortality rate of chickens is proportional to the length of the journey [26,56,57].
Among fast-growing broilers, transport stress caused a 0.15% mortality rate in short journeys (<50 km) and 0.86% in long journeys (>300 km) as well as an increase in plasma levels of cortisol and corticosterone in chickens, which was closely related to the duration of transport [58,59]. Globally, the poultry industry has adapted to consumer preferences for animal welfare, quality, and food safety. For this reason, although community legislation aligns with the concern for animal welfare during transport (transport journey should not exceed 8 h), it would be desirable for transport times to be drastically reduced by setting up slaughterhouses closer to poultry farms. Based on the data in the literature, we hypothesized that a reduction in the journey’s length and duration (within 1 h) could significantly reduce eventual production losses and enhance the quality and quantity of poultry meat. Food chain safety is directly linked to animal welfare, given the strong links between animal welfare, animal health, and food-borne diseases [60]. Sources of stress and poor welfare conditions (i.e., a long, stress-inducing journey) can lead to increased susceptibility to transmissible diseases in animals, which can present a risk for consumers (Salmonella, Campylobacter, and E. coli). Sound animal welfare practices not only reduce unnecessary suffering, but also contribute to healthier foods being produced.
Moreover, meat appearance, juiciness, and tenderness are considered crucial sensory attributes that affect consumer preferences and purchasing behavior [61]. However, the problem of inconsistency in meat quality and the high occurrence of defective meat cause huge economic losses and restrict the meat industry’s development. According to a large domestic survey, pale, soft, and exudative (PSE)-like chicken accounted for 23% of the total production in chicken slaughtering plants in China [62]. Pre-slaughter stressors, including transport conditions, seasonal heat, and poor handling procedures, have been documented to seriously affect broilers’ various physiological and metabolic functions, resulting in deterioration of meat quality [63,64,65]. In fact, the acute transport of broilers in high environmental temperatures increased the occurrence of PSE-like chicken meat, probably by accelerating anaerobic glycolysis postmortem, which contributed to faster pH decline and protein denaturation and resulted in decreased water holding capacity and poor meat color [65,66,67].
Another relevant aspect that is often debated is the emergence and spread of antimicrobial resistance (AMR). During transport, animals are subjected to an environment in which factors such as temperature, ventilation, and the mixing of animals from different origins contribute to the dissemination of resistant microorganisms and zoonotic agents [68]. Withdrawal of feed and water prior to or during transport may change environmental conditions in the animals’ digestive tract as substances are digested and absorbed, leading to variations in pH, releasing of stress hormones, and other factors that prompt changes in microbiota composition. These changes in microbial abundance may affect the AMR profile (either positively or negatively). The effect of stress on the microbial population may include an increased exchange of mobile genetic elements within or between bacterial species. This could alter the AMR profile or increase AMR abundance in the microbiota. However, there is a lack of specific data to support this hypothesis. Moreover, animals may turn to eating bedding, which might lead to the uptake of resistant microorganisms from the environment [68,69].
As Park and co-workers [70] suggested, future poultry transport systems could eliminate live-bird transport to minimize stress factors, such as physical discomfort and abnormal social settings, which all contribute to significant stress accumulation. Technological advances, such as artificial intelligence, will ensure labor, economic, and environmental sustainability for a robust poultry broiler and breeder management systems, while enhancing animal welfare and production efficiency.
To further advance the sustainability and efficiency of the poultry supply chain in southern Italy, future research should explore the integration of precision livestock farming (PLF) technologies, the valorization of poultry by-products, and the promotion of consumer education on ethical poultry production practices.
Integrating PLF technologies involves the adoption of electronic tools and methods to monitor and manage poultry health, welfare, and productivity. PLF utilizes sensors, cameras, and other monitoring devices to collect data on various animal welfare indicators, enabling early detection of health issues and optimization of production practices. Implementing PLF has the potential to enhance animal welfare and improve production efficiency. Valorizing poultry by-products presents opportunities to minimize waste and enhance resource efficiency within the poultry industry. By converting spent hens and other by-products into valuable co-products, such as protein-rich meals or bio-based materials, the industry can reduce environmental impacts and create additional revenue streams. This approach aligns with circular economy principles and contributes to sustainable agricultural practices [71].
Promoting consumer education on ethical poultry production practices is essential to align market demand with sustainable and humane production methods. Educating consumers about the benefits of supporting ethically produced poultry products could drive market shifts towards higher animal welfare standards and encourage producers to adopt more sustainable practices. This consumer-driven approach can lead to increased demand for responsibly produced poultry, benefiting both animal welfare and industry sustainability [72,73].
By incorporating these additional research directions—precision livestock farming, valorization of poultry by-products, and consumer education—stakeholders can further enhance the sustainability, efficiency, and ethical standards of the poultry supply chain in southern Italy, aligning with both consumer expectations and industry objectives.

4. Conclusions

Integrating economic efficiency with environmental protection in the poultry supply chain is essential for achieving sustainable development. This study utilized geospatial analysis of poultry chain data from the province of Foggia to propose solutions aimed at reducing animal stress and enhancing vertical integration, thereby improving business efficiency. By minimizing transport distances, the study suggests a model that not only reduces stressors affecting poultry meat quality, but also aligns with consumer preferences for wholesome products produced with attention to animal welfare.
Shortening supply chains offers multiple benefits, including reduced transportation costs and decreased broiler mortality during transit, leading to lower associated costs. These efficiencies contribute to economic gains while also supporting environmental objectives by lowering carbon emissions associated with transportation. Implementing such strategies can enhance consumer demand and awareness, benefiting the entire supply chain. Future analyses should adopt a life cycle approach to evaluating economic, environmental, and social aspects of sustainability. This methodology aligns with circular economy principles and the sustainable development goals outlined in Agenda 2030. Sustainability assessments can assist policymakers in understanding regional carrying capacities, formulating public policies to ensure a stable supply of poultry meat, and mitigating negative environmental impacts, such as by recovering waste for energy production.
Additionally, safeguarding animal welfare on farms and during transport is crucial for improving food safety. Advancing the sustainability and efficiency of the poultry supply chain in southern Italy requires integrating precision livestock farming technologies, valorizing poultry by-products, and promoting consumer education on ethical production practices. These strategies aim to enhance animal welfare, reduce waste, and align production with the growing consumer demand for responsibly produced poultry.

Author Contributions

Methodology, G.M.C., C.R. and P.R.; Validation, A.C.; Investigation, A.G.D.; Data curation, F.C., P.R. and A.G.D.; Writing—original draft, C.R. and G.L.; Writing—review & editing, G.M.C., C.R. and G.L.; Visualization, F.C. and G.L.; Supervision, G.M.C. and A.C. All authors have read and agreed to the published version of the manuscript.

Funding

This study was funded by the European Union-NextGenerationEU, Mission 4, Component 2, in the framework of the GRINS—Growing Resilient, INclusive and Sustainable project (GRINS PE00000018-(GRINS PE00000018–CUP D73C24000370006). The views and opinions expressed are solely those of the authors and do not necessarily reflect those of the European Union, nor can the European Union be held responsible for them.

Institutional Review Board Statement

Not applicable.

Informed Consent Statement

Not applicable.

Data Availability Statement

The data presented in this study are available on request from the corresponding author.

Conflicts of Interest

The authors declare no conflict of interest.

References

  1. OECD. OECD-FAO Agricultural Outlook 2022–2031. 2022. Available online: https://www.oecd.org/en/publications/oecd-fao-agricultural-outlook-2022-2031_f1b0b29c-en.html (accessed on 4 February 2025).
  2. FAO. Faostat. 2025. Available online: https://fao.org/faostat/en/#data (accessed on 4 February 2025).
  3. Unaitalia. Annual Report 2021. 2021. Available online: https://www.unaitalia.com/ (accessed on 4 February 2025). (In Italian).
  4. FAO (Food and Agriculture Organization) Gateway to Poultry Production and Products. Available online: https://www.fao.org/poultry-production-products/production/ru/ (accessed on 19 March 2023).
  5. Gulati, A.; Ganguly, K.; Wardhan, H. (Eds.) Agricultural Value Chains in India; Springer: Berlin/Heidelberg, Germany, 2022; ISBN 2198-0020 (electronic). Available online: https://link.springer.com/book/10.1007/978-981-33-4268-2 (accessed on 4 February 2025)ISSN 2198-0020.
  6. Khaleda, S. The poultry value chain and sustainable development of poultry microenterprises that utilize homestead lands: A case study in Gazipur, Bangladesh. In Land Use Policy; Elsevier: Amsterdam, The Netherlands, 2013; Volume 30, pp. 642–651. Available online: https://www.sciencedirect.com/science/article/abs/pii/S0264837712000968?via%3Dihub (accessed on 4 February 2025)ISSN 0264-8377.
  7. Le Hoa Vo, T.; Thiel, D. Economic simulation of a poultry supply chain facing a sanitary crisis. Br. Food J. 2011, 113, 1011–1030. [Google Scholar] [CrossRef]
  8. Sutherland, M.; Dowlong, S.; Shaw, R.; Hickey, J.; Fraser, D.; Cameron, C.; Sutherland, I. Stress-Induced Immunomodulation in Low and High Reactive Sheep. Animals 2019, 9, 104. [Google Scholar] [CrossRef]
  9. ISMEA. Poultry Chain. 2021. Available online: https://www.ismeamercati.it/flex/cm/pages/ServeBLOB.php/L/IT/IDPagina/3517#MenuV (accessed on 4 February 2025). (In Italian).
  10. Mendes, C.M.I.; Demattê Filho, L.C.; Gameiro, A.H. Incorporating sustainability in the food supply chain: The development of a private standard of Nature Farming poultry production in Brazil. Res. Glob. 2024, 8, 100185. [Google Scholar] [CrossRef]
  11. Ahi, P.; Searcy, C. A comparative literature analysis of definitions for green and sustainable supply chain management. J. Clean. Prod. 2013, 52, 329–341. [Google Scholar] [CrossRef]
  12. Balasaheb Phalke, B.; Londhe, V.; Arudkar, A. A Poultry Farm Management System. Int. J. Res. Eng. Sci. Manag. 2020, 3, 41–43. Available online: https://journal.ijresm.com/index.php/ijresm/article/view/15 (accessed on 4 February 2025).
  13. Elson, H.A. Poultry management systems—Looking to the future. World’s Poult. Sci. J. 1988, 44, 103–111. [Google Scholar] [CrossRef]
  14. Khadem, M.; Shamsuzzoha, A.; Piya, S. Optimization Modeling of a Poultry Industry Supply Chain Network. Int. J. Sup. Chain. Mgt. 2017, 6, 27–32. Available online: http://excelingtech.co.uk/ (accessed on 4 February 2025).
  15. Nallusamy, S.; Rekha, R.S.; Balakannan, K.; Chakraborty, P.S.; Majumdar, G. A Proposed Agile Based Supply Chain Model for Poultry Based Products in India. Int. J. Poult. Sci. 2015, 14, 57–62. [Google Scholar] [CrossRef]
  16. Saiful Islam, M.; Khatun, R.; Ahmed, S.; Amirul Hasan, M.; Saiful Islam, M.; MAshab Uddin, A.S.; Showkat Mahmud, M. Value Chain Analysis of Processed Poultry Products (Egg and Meat) in Some Selected Areas of Bangladesh. Am. J. Rural. Dev. 2016, 4, 65–70. [Google Scholar]
  17. Schiavo, G.; Vinícius, M.; Rocha, S.; Dias, V.; Vaccaro GL, R.; Korzenowski, A.L. A model to manage the influence of quality on the poultry supply chain. In Proceedings of the 2015 Industrial and Systems Engineering Research Conference, Nashville, TN, USA, 21–23 October 2015; p. 1985. [Google Scholar]
  18. Jufiardi, J.W.; Pinagara, F.A. Analysis of supply chain management in ABC poultry using system dynamics approach. In IOP Conference Series: Materials Science and Engineering, Proceedings of the International Conference on Operations Research, Manado, Indonesia, 20–21 September 2018; Purpose-Led Publishing: College Park, MD, USA, 2018; Volume 567. [Google Scholar] [CrossRef]
  19. Gulati, A.; Ganguly, K.; Wardhan, H. India Studies in Business and Economics. In Agricultural Value Chains in India; Springer: Berlin/Heidelberg, Germany, 2022; Available online: https://link.springer.com/bookseries/11234 (accessed on 4 February 2025).
  20. Esnaola-Gonzalez, I. Semantic Technologies Towards Accountable Artificial Intelligence: A Poultry Chain Management Use Case. In Artificial Intelligence XXXVII; Bramer, M., Ellis, R., Eds.; Springer International Publishing: Berlin/Heidelberg, Germany, 2020; pp. 215–226. [Google Scholar]
  21. Valdokhina, S.; Vedenkina, I.; Roiter, L. Traceability as a management tool for processing poultry products. In IOP Conference Series: Earth and Environmental Science, Proceedings of the International Scientific and Practical Conference on Agrarian Economy in the Era of Globalization and Integration, Moscow, Russia, 24–25 October 2018; IOP Publishing: Bristol, UK, 2019; Volume 274. [Google Scholar] [CrossRef]
  22. Esnaola-Gonzalez, I.; Gómez-Omella, M.; Ferreiro, S.; Fernandez, I.; Lázaro, I.; García, E. An IoT platform towards the enhancement of poultry production chains. Sensors 2020, 20, 1549. [Google Scholar] [CrossRef]
  23. Grandin, T. Chapter 1—Principles for Commercial Supply Chain Managers of Livestock and Poultry. In Sustainable Meat Production and Processing; Galanakis, C.M., Ed.; Academic Press: Cambridge, MA, USA, 2019; pp. 1–15. [Google Scholar] [CrossRef]
  24. Shamsuddoha, M.; Quaddus, M.; Klass, D. Sustainable poultry production process to mitigate socio-economic challenge. Humanomics 2015, 31, 242–259. [Google Scholar]
  25. Pohlmann, C.R.; Scavarda, A.J.; Alves, M.B.; Korzenowski, A.L. The role of the focal company in sustainable development goals: A Brazilian food poultry supply chain case study. J. Clean. Prod. 2020, 245, 118798. [Google Scholar] [CrossRef]
  26. Barbut, S. Live bird handling. In The Science of Poultry and Meat Processing; Barbut, S., Ed.; University of Guelph: Guelph, ON, Canada, 2015; Chapter 4. [Google Scholar]
  27. Jayaprakash, G.; Sathiyabarathi, M.; Arokia Robert, M.; Tamilmani, T. Transportation stress in broiler chickens. Int. J. Sci. Environ. Technol. 2016, 5, 806–809. [Google Scholar]
  28. El-Lethey, H.; Huber-Eicher, B.; Jungi, T.W. Exploration of stress-induced immunosuppression in chickens reveals both stress-resistant and stress-susceptible antigen responses. Vet. Immunol. Immunopathol. 2003, 95, 91–101. [Google Scholar] [CrossRef] [PubMed]
  29. Amadori. Il Campese Poultry Farming Practices. 2021. Available online: https://www.amadori.it/prodotti/il-campese (accessed on 4 February 2025).
  30. FAO. The State of Food and Agriculture 2020: Moving Forward with Sustainable Poultry Production; Food and Agriculture Organization of the United Nations: Rome, Italy, 2020. [Google Scholar]
  31. Beia, S.I.; Tăpăloagă, D.; Șonea, C.; Gheorghe-Irimia, R.A.; Roșu, P.M.; Al Dulaimi MK, H.; Tăpăloagă, P.R. Organic vs. conventional: A comparative review of health-related welfare issues and their economic impact on poultry production. In Scientific Papers Series Management, Economic Engineering in Agriculture and Rural Development; University of Agronomic Sciences and Veterinary Medicine of Bucharest: Bucharest, Romani, 2024; Volume 24, ISSN 2284-7995, E-ISSN 2285-3952. [Google Scholar]
  32. Burkholder, K.M.; Thompson, K.L.; Einstein, M.E.; Applegate, T.J.; Patterson, J.A. Influence of stressors on normal intestinal microbiota, intestinal morphology, and susceptibility to Salmonella enteritidis colonization in broilers. Poul. Sci. 2008, 87, 1734–1741. [Google Scholar]
  33. Lyte, J.M.; Martinez, D.A.; Robinson, K.; Donoghue, A.M.; Daniels, K.M.; Lyte, M. A neurochemical biogeography of the broiler chicken intestinal tract. Poult. Sci. 2022, 101, 01671. [Google Scholar]
  34. Pullinger, G.D.; van Diemen, P.M.; Carnell, S.C.; Davies, H.; Lyte, M.; Stevens, M.P. 6-hydroxydopamine-mediated release of norepinephrine increases faecal excretion of Salmonella enterica serovar Typhimurium in pigs. Vet. Res. 2010, 41, 68. [Google Scholar] [CrossRef]
  35. Korver, D.L. Review: Current challenges in poultry nutrition, health, and welfare. Animal 2023, 2, 100755. [Google Scholar] [CrossRef]
  36. Berghout, J.; Roland, W.; Vollebregt, M.; Koene, M.; de Jong, I. Towards a safe and sustainable poultry production chain. Wagening. Livest. Res. 2018, 1126, 542165. [Google Scholar]
  37. Leinonen, I.; Kyriazakis, I. How can we improve the environmental sustainability of poultry production? Proc. Nutr. Soc. 2016, 75, 265–273. [Google Scholar] [CrossRef]
  38. Vaarst, M.; Steenfeldt, S.; Horsted, K. Sustainable development perspectives of poultry production. World’s Poult. Sci. J. 2015, 71, 609–620. [Google Scholar] [CrossRef]
  39. Bozzo, G.; Barrasso, R.; Ferorelli, D.; Gassi, V.; Russo, R.; Celentano, F.E. Animal Welfare Policies and Human Rights in the Context of Slaughter Procedures. Agriculture 2021, 11, 442. [Google Scholar] [CrossRef]
  40. van Huika, M.M.; Kling-Eveillardb, F.; Prutzerc, M.; Bocka, B.B.; Dockès, A.C. Attitudes of cattle, pig and poultry farmers in France, the Netherlands and Sweden towards Animal Welfare. In Proceedings of the ESRS Congress 2007, Wageningen, The Netherlands, 20–24 August 2007. [Google Scholar]
  41. Bonaudo, T.; Coutinho, C.A.; Poccard Chapuis, R.; Lescoat, P.; Lossouarn, J.; Tourrand, J.F. Poultry industry and the sustainable development of territories: What links? What conditions? In Proceedings of the CIRAD, Montpellier, France, 28–30 June 2010. [Google Scholar]
  42. Costantini, M.; Ferrante, V.; Guarino, M.; Bacenetti, J. Environmental sustainability assessment of poultry productions through life cycle approaches: A critical review. Trends Food Sci. Technol. 2021, 110, 201–212. [Google Scholar]
  43. Géron, A. Hands-On Machine Learning with Scikit-Learn, Keras, and TensorFlow, 2nd ed.; O’Reilly Media, Inc.: Sebastopol, CA, USA, 2019. [Google Scholar]
  44. Raschka, S.; Mirjalili, V. Python Machine Learning, 3rd ed.; Packt: Birmingham, UK, 2019. [Google Scholar]
  45. Hair, J.F.; Black, W.C.; Babin, B.J.; Anderson, R.E. Multivariate Data Analysis, 7th ed.; Pearson Education Limited: Harlow, UK, 2014. [Google Scholar]
  46. Arthur, D.; Vassilvitskii, S. k-means++: The advantages of careful seeding. In Proceedings of the Eighteenth Annual ACM-SIAM Symposium on Discrete Algorithms, New Orleans, LA, USA, 7–9 January 2007; Society for Industrial and Applied Mathematics: Philadelphia, PA, USA, 2007. [Google Scholar]
  47. Henry, K.A.; Boscoe, F.P. Estimating the accuracy of geographical imputation. Int. J. Health Geogr. 2008, 7, 3. [Google Scholar] [CrossRef] [PubMed]
  48. Na, S.; Xumin, L.; Yong, G. Research on k-means Clustering Algorithm: An Improved k-means Clustering Algorithm. In Proceedings of the 2010 Third International Symposium on Intelligent Information Technology and Security Informatics, Ji’an, China, 2–4 April 2010. [Google Scholar]
  49. Sinaga, K.P.; Yang, M. Unsupervised K-Means Clustering Algorithm. IEEE Access 2020, 8, 80716–80727. [Google Scholar] [CrossRef]
  50. Hu, H.; Liu, J.; Zhang, X.; Fang, M. An Effective and Adaptable K-means Algorithm for Big Data Cluster Analysis. Pattern Recognit. 2023, 139, 109404. [Google Scholar] [CrossRef]
  51. Likasa, A.; Vlassisb, N.; Verbeek, J. The global k-means clustering algorithm. Pattern Recognit. 2003, 36, 451–461. [Google Scholar]
  52. Pedregosa, F.; Varoquaux, G.; Gramfort, A.; Michel, V.; Thirion, B.; Grisel, O.; Blondel, M.; Prettenhofer, P.; Weiss, R.; Dubourg, V.; et al. Scikit-learn: Machine Learning in Python. J. Mach. Learn. Res. 2011, 12, 2825–2830. [Google Scholar]
  53. Elkan, C. Using the Triangle Inequality to Accelerate. In Proceedings of the Proceedings of the Twentieth International Conference on Machine Learning (ICML-2003), Washington, DC, USA, 21–24 August 2003. [Google Scholar]
  54. Böttcher, A.; Wenzel, D. The Frobenius norm and the commutator. Linear Algebra Its Appl. 2008, 429, 1864–1885. [Google Scholar]
  55. Custódio, A.L.; Rocha, H.; Vicente, L.N. Incorporating minimum Frobenius norm models in direct search. Comput. Optim. Appl. 2010, 46, 265–278. [Google Scholar] [CrossRef]
  56. Zou, L. Linear and Multilinear Algebra; Talylor Francis Group: Abingdon, UK, 2012; Volume 60, pp. 27–31. [Google Scholar]
  57. Delabouglise, A.; Nguyen-Vaan-Yen, B.; Le Thanh, N.T.; Xuyen, H.T.A.; Tuyet, P.N.; Lam, H.M.; Boni, M.F. Poultry population dynamics and mortality risks in smallholder farms of the Mekong river delta region. BMC Vet. Res. 2019, 15, 205. [Google Scholar] [PubMed]
  58. Vecerek, V.; Voslarova, E.; Conte, F.; Vecerkova, L.; Bedanova, I. Negative Trends in Transport-related Mortality Rates in Broiler Chickens. Asian-Australas J. Anim. Sci. 2016, 29, 1796–1804. [Google Scholar] [PubMed]
  59. Gou, Z.; Abouelezz, K.F.M.; Fan, Q.; Li, L.; Lin, X.; Wang, Y.; Cui, X.; Ye, J.; Masoud, M.A.; Jiang, S.; et al. Physiological effects of transport duration on stress biomarkers and meat quality of medium-growing Yellow broiler chickens. Animal 2021, 15, 100079. [Google Scholar]
  60. Vecerek, V.; Grbalova, S.; Voslarova, E.; Janackova, B.; Malena, M. Effects of travel distance and the season of the year on death rates in broilers transported to poultry processing plants. Poult. Sci. 2006, 85, 1881–1884. [Google Scholar]
  61. Fiebig, L.; Smieszek, T.; Saurina, J.; Hattendorf, J.; Zinsstag, J. Contacts between poultry farms, their spatial dimension and their relevance for avian influenza preparedness. Geospat. Health 2009, 4, 79–95. [Google Scholar]
  62. Resurreccion, A. Sensory aspects of consumer choices for meat and meat products. Meat Sci. 2004, 66, 11–20. [Google Scholar] [PubMed]
  63. Zhu, X.; Xu, X.; Min, X.; Zhou, G. Occurrence and characterization of pale, soft, exudative-like broiler muscle commercially produced in China. J. Integr. Agric. 2012, 11, 1384–1390. [Google Scholar]
  64. Schwartzkopf-Genswein, K.; Faucitano, L.; Dadgar, S.; Shand, P.; González, L.; Crowe, T. Road transport of cattle, swine and poultry in North America and its impact on animal welfare, carcass and meat quality: A review. Meat Sci. 2012, 92, 227–243. [Google Scholar]
  65. Xing, T.; Gao, F.; Tume, R.K.; Ghou, G.; Xu, X. Stress effects on meat quality: A mechanistic perspective. Compr. Rev. Food Sci. Food Saf. 2019, 18, 380–401. [Google Scholar]
  66. Xing, T.; Zhao, Z.; Zhao, X.; Zhuang, S.; Xu, X. Phosphoproteome analysis of sarcoplasmic and myofibrillar proteins in stress-induced dysfunctional broiler pectoralis major muscle. Food Chem. 2020, 319, 126531. [Google Scholar] [CrossRef]
  67. Scheffler, T.; Gerrard, D. Mechanisms controlling pork quality development: The biochemistry controlling postmortem energy metabolism. Meat Sci. 2007, 77, 7–16. [Google Scholar] [CrossRef] [PubMed]
  68. Xing, T.; Zhao, X.; Wang, P.; Chen, H.; Xu, X.; Zhou, G. Different oxidative status and expression of calcium channel components in stress-induced dysfunctional chicken muscle. J. Anim. Sci. 2017, 95, 1565–1573. [Google Scholar] [CrossRef] [PubMed]
  69. EFSAPanel on Biological Hazards (BIOHAZ); Koutsoumanis, K.; Allende, A.; Álvarez-Ordóñez, A.; Bolton, D.; Bover-Cid, S.; Chemaly, M.; Davies, R.; De Cesare, A.; Herman, L.; et al. Transmission of antimicrobial resistance (AMR) during animal transport. EFSA J. 2022, 20, e07586. [Google Scholar] [CrossRef]
  70. EFSA BIOHAZ Panel (EFSA Panel on Biological Hazards); Koutsoumanis, K.; Allende, A.; Alvarez-Ordonez, A.; Bolton, D.; Bover-Cid, S.; Chemaly, M.; Davies, R.; De Cesare, A.; Herman, L.; et al. Role played by the environment in the emergence and spread of antimicrobial resistance (AMR) through the food chain. EFSA J. 2021, 19, e06651. [Google Scholar] [CrossRef]
  71. Park, M.; Britton, D.; Daley, W.; McMurray, G.; Navaei, M.; Samoylov, A.; Usher, C.; Xu, J. Artificial intelligence, sensors, robots, and transportation systems drive an innovative future for poultry broiler and breeder management. Anim. Front. 2022, 12, 40–48. [Google Scholar] [CrossRef]
  72. Amicarelli, V.; Geatti, P.; Bux, C. The Circular Economy Potential of Spent Hens’ Co-Products and By-Products in Italy by Material Flow Analysis. Environments 2023, 10, 137. [Google Scholar] [CrossRef]
  73. Cappone, E.E.; Zambotto, V.; Mota-Gutierrez, J.; Soglia, D.; Daniele, G.M.; Cianciabella, M.; Pieronic, A.; Soukand, R.; Penasa, M.; Buccioni, A.; et al. Native Italian poultry products: The factors influencing consumer perceptions. Ital. J. Anim. Sci. 2025, 24, 347–360. [Google Scholar] [CrossRef]
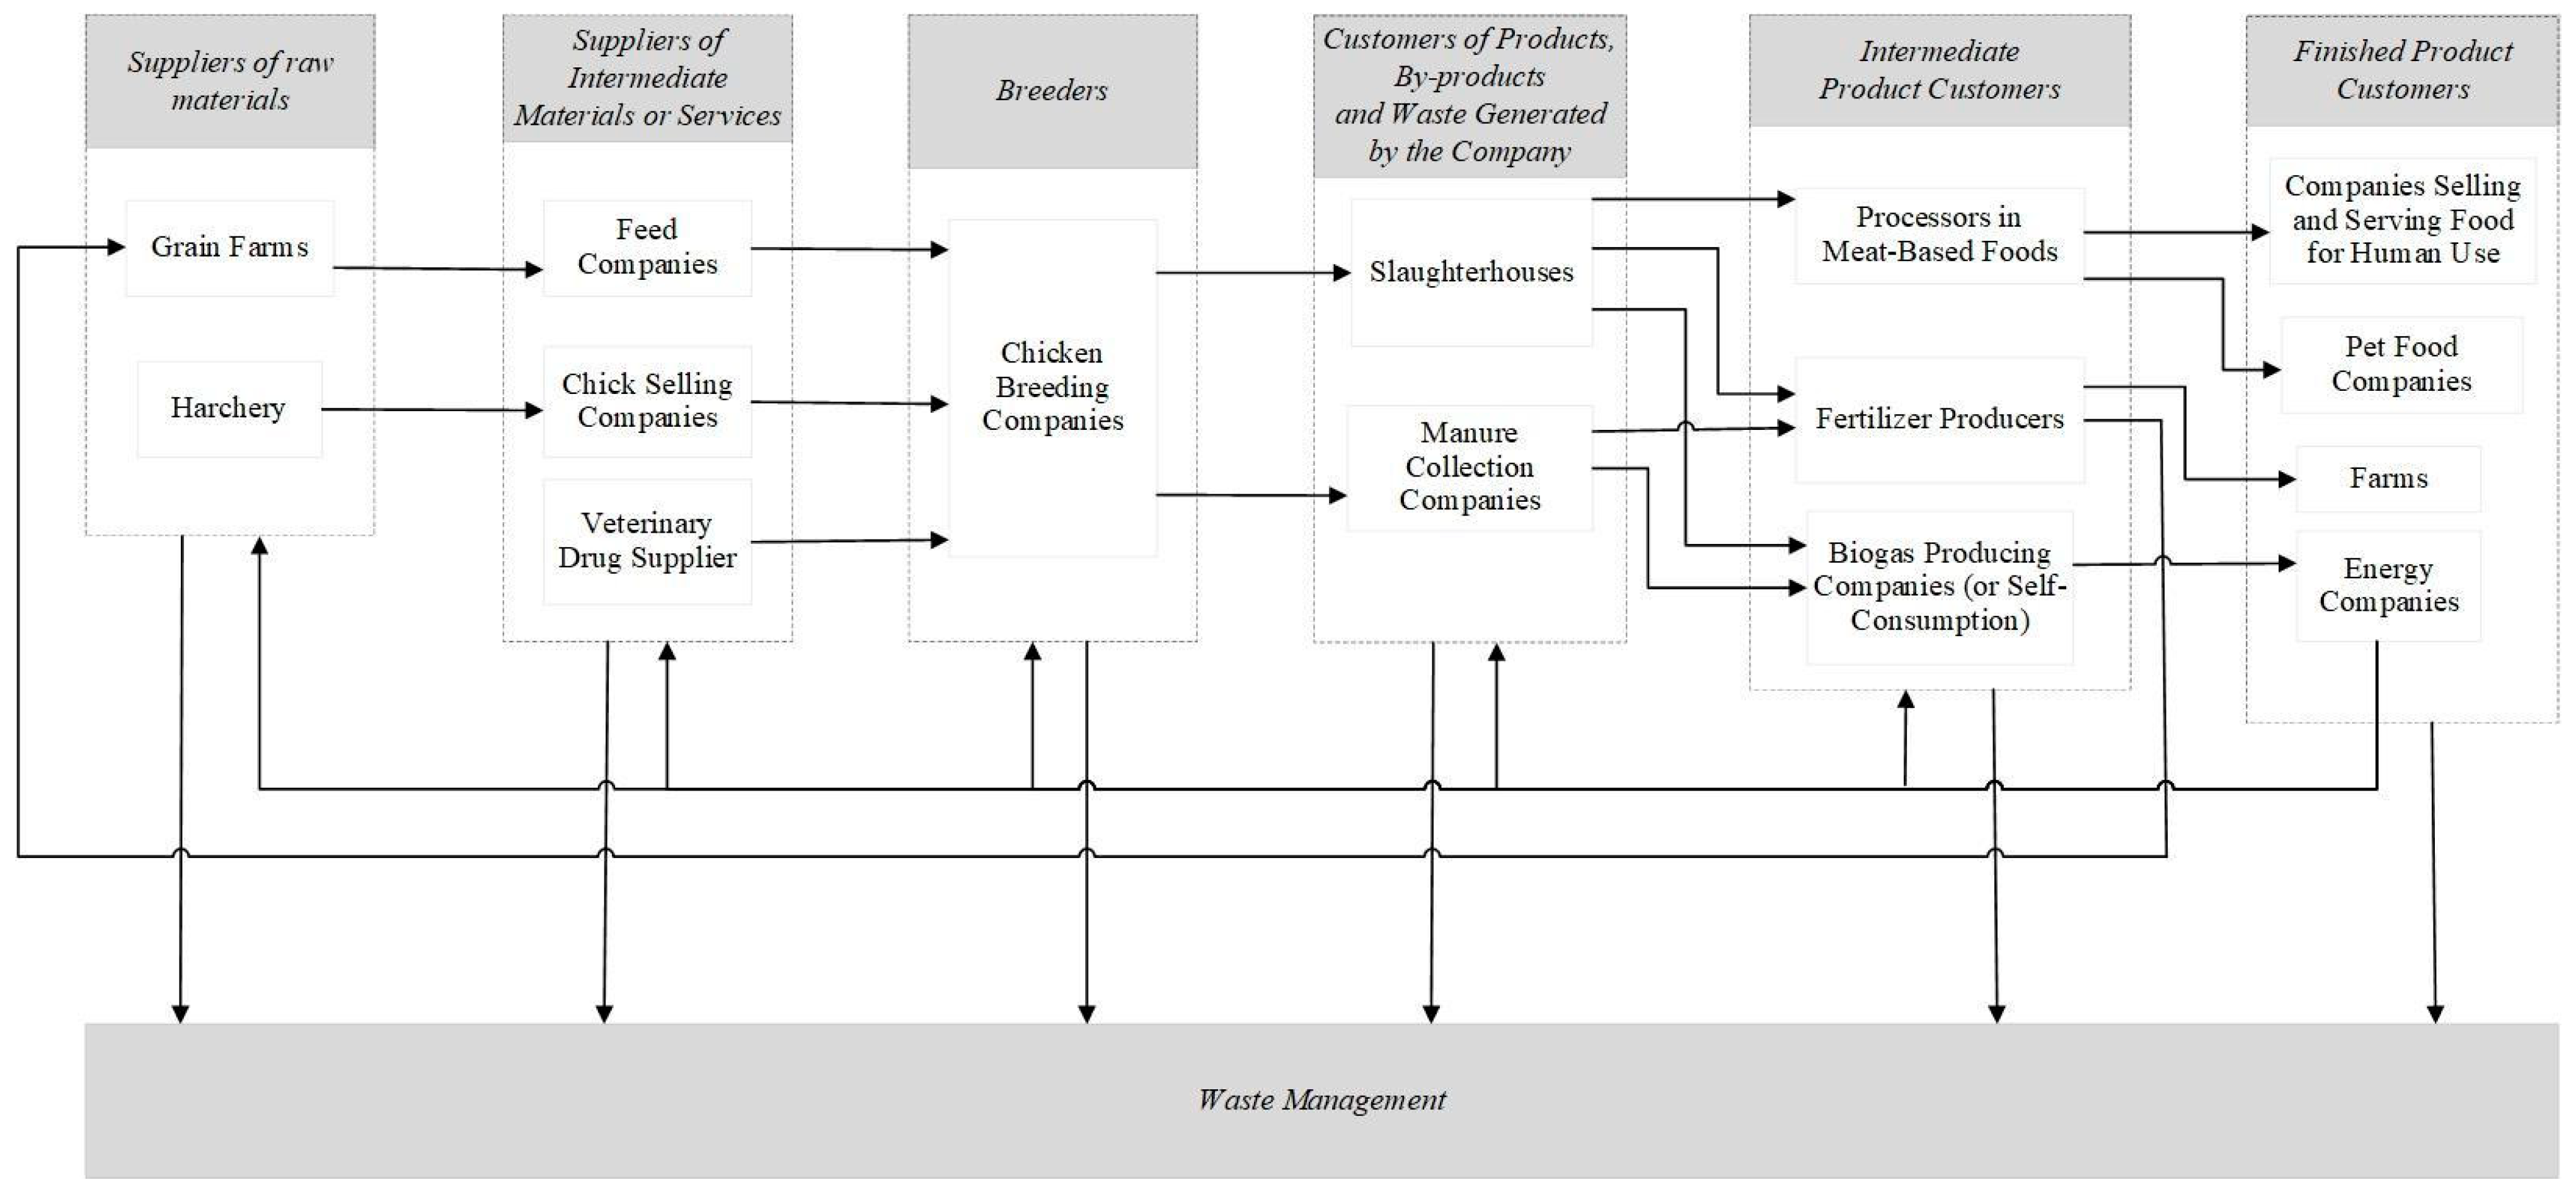
Figure 1. Stakeholders’ interaction and phases of the poultry supply chain.
Sustainability 17 02984 g001
Figure 2. Questionnaire architecture.
Sustainability 17 02984 g002
Figure 3. Flowchart of data processing.
Sustainability 17 02984 g003
Figure 4. Geographical distribution of poultry farms in the province of Foggia.
Sustainability 17 02984 g004
Figure 5. Shed size for each type of farm, measured in square meters.
Sustainability 17 02984 g005
Figure 6. Shed capacity for each type of farm, measured in number of chickens per square meters per farm cycle.
Sustainability 17 02984 g006
Figure 7. Distance to the incubator for each type of farm, measured in kilometers, input data.
Sustainability 17 02984 g007
Figure 8. Distance to the slaughterhouse for each type of farm, measured in kilometers, input data.
Sustainability 17 02984 g008
Figure 9. Centroids, represented by a cross (green for organic farms, orange for Campese farms, blue for conventional farms, and red for all farms).
Sustainability 17 02984 g009
Figure 10. Distance to the feed mill for each type of farm, measured in kilometers, based on input data.
Sustainability 17 02984 g010
Figure 11. Length of the route between each type of farm and the corresponding centroid, measured in kilometers, calculated using Google Maps API.
Sustainability 17 02984 g011
Figure 12. Length of the route between each type of farm and the corresponding centroid, measured in minutes, calculated using Google Maps API.
Sustainability 17 02984 g012
Figure 13. Length of the route between each type of farm and the single centroid, measured in kilometers, calculated using Google Maps API.
Sustainability 17 02984 g013
Figure 14. Length of the route between each type of farm and the corresponding centroid, measured in minutes, calculated using Google Maps API.
Sustainability 17 02984 g014
Figure 15. Centroids calculated using the k-means algorithm, represented by a red cross, considering 3 clusters.
Sustainability 17 02984 g015
Figure 16. Length of the route between each farm and the corresponding cluster centroid, measured in kilometers, calculated with Google Maps API.
Sustainability 17 02984 g016
Figure 17. Length of the route between each farm and the corresponding cluster centroid, measured in minutes, calculated with Google Maps API.
Sustainability 17 02984 g017
Disclaimer/Publisher’s Note: The statements, opinions and data contained in all publications are solely those of the individual author(s) and contributor(s) and not of MDPI and/or the editor(s). MDPI and/or the editor(s) disclaim responsibility for any injury to people or property resulting from any ideas, methods, instructions or products referred to in the content.