
MDANet: A High-Resolution City Change Detection Network Based on Difference and Attention Mechanisms under Multi-Scale Feature Fusion


Abstract
1. Introduction
2. Related Work
- 1.
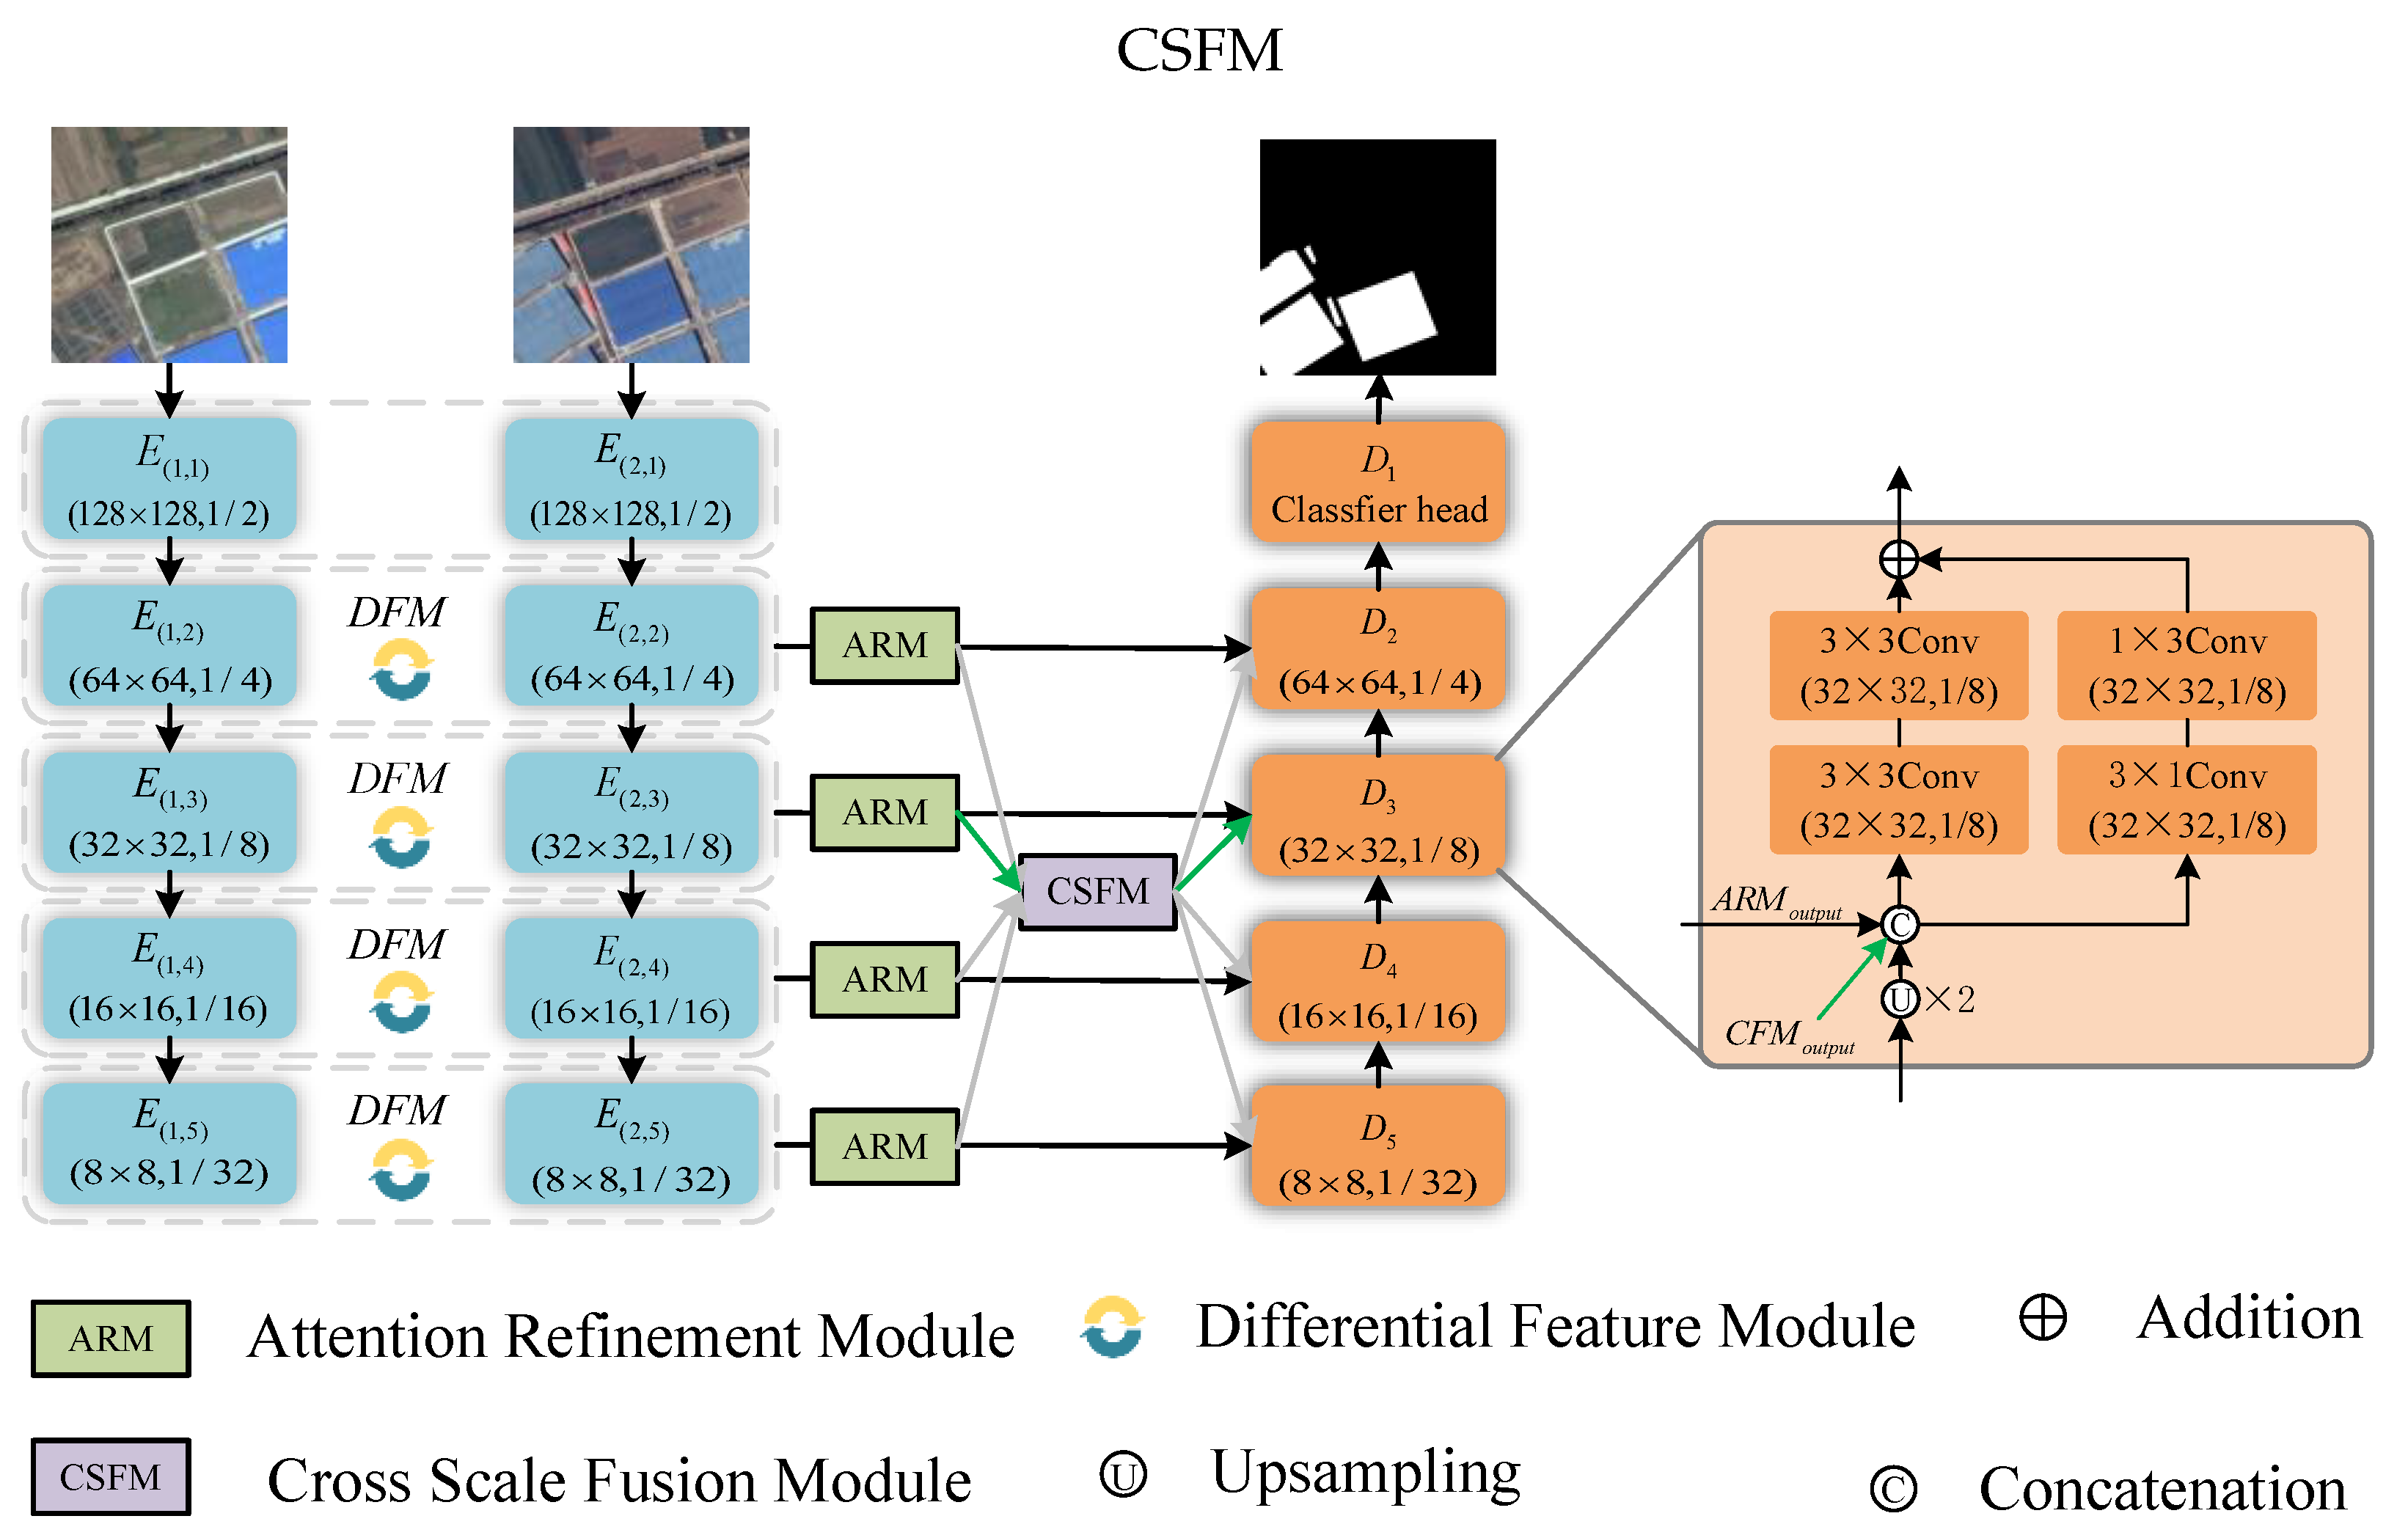
- We suggest a brand-new change detection network, named the multi-scale feature fusion-based high-resolution remote sensing image change detection network (MDANet) based on difference and attention mechanisms. The Siamese network is used to extract features from dual-temporal remote sensing pictures individually during the feature decoding phase. Our suggested auxiliary modules are then used to extract change information from these images. In the feature encoding phase, we utilize a residual structure augmented with stripe convolution to restore the change regions of the original image. Stripe convolution emphasizes edge detail features during the restoration process, significantly enhancing the detection performance.
- 2.
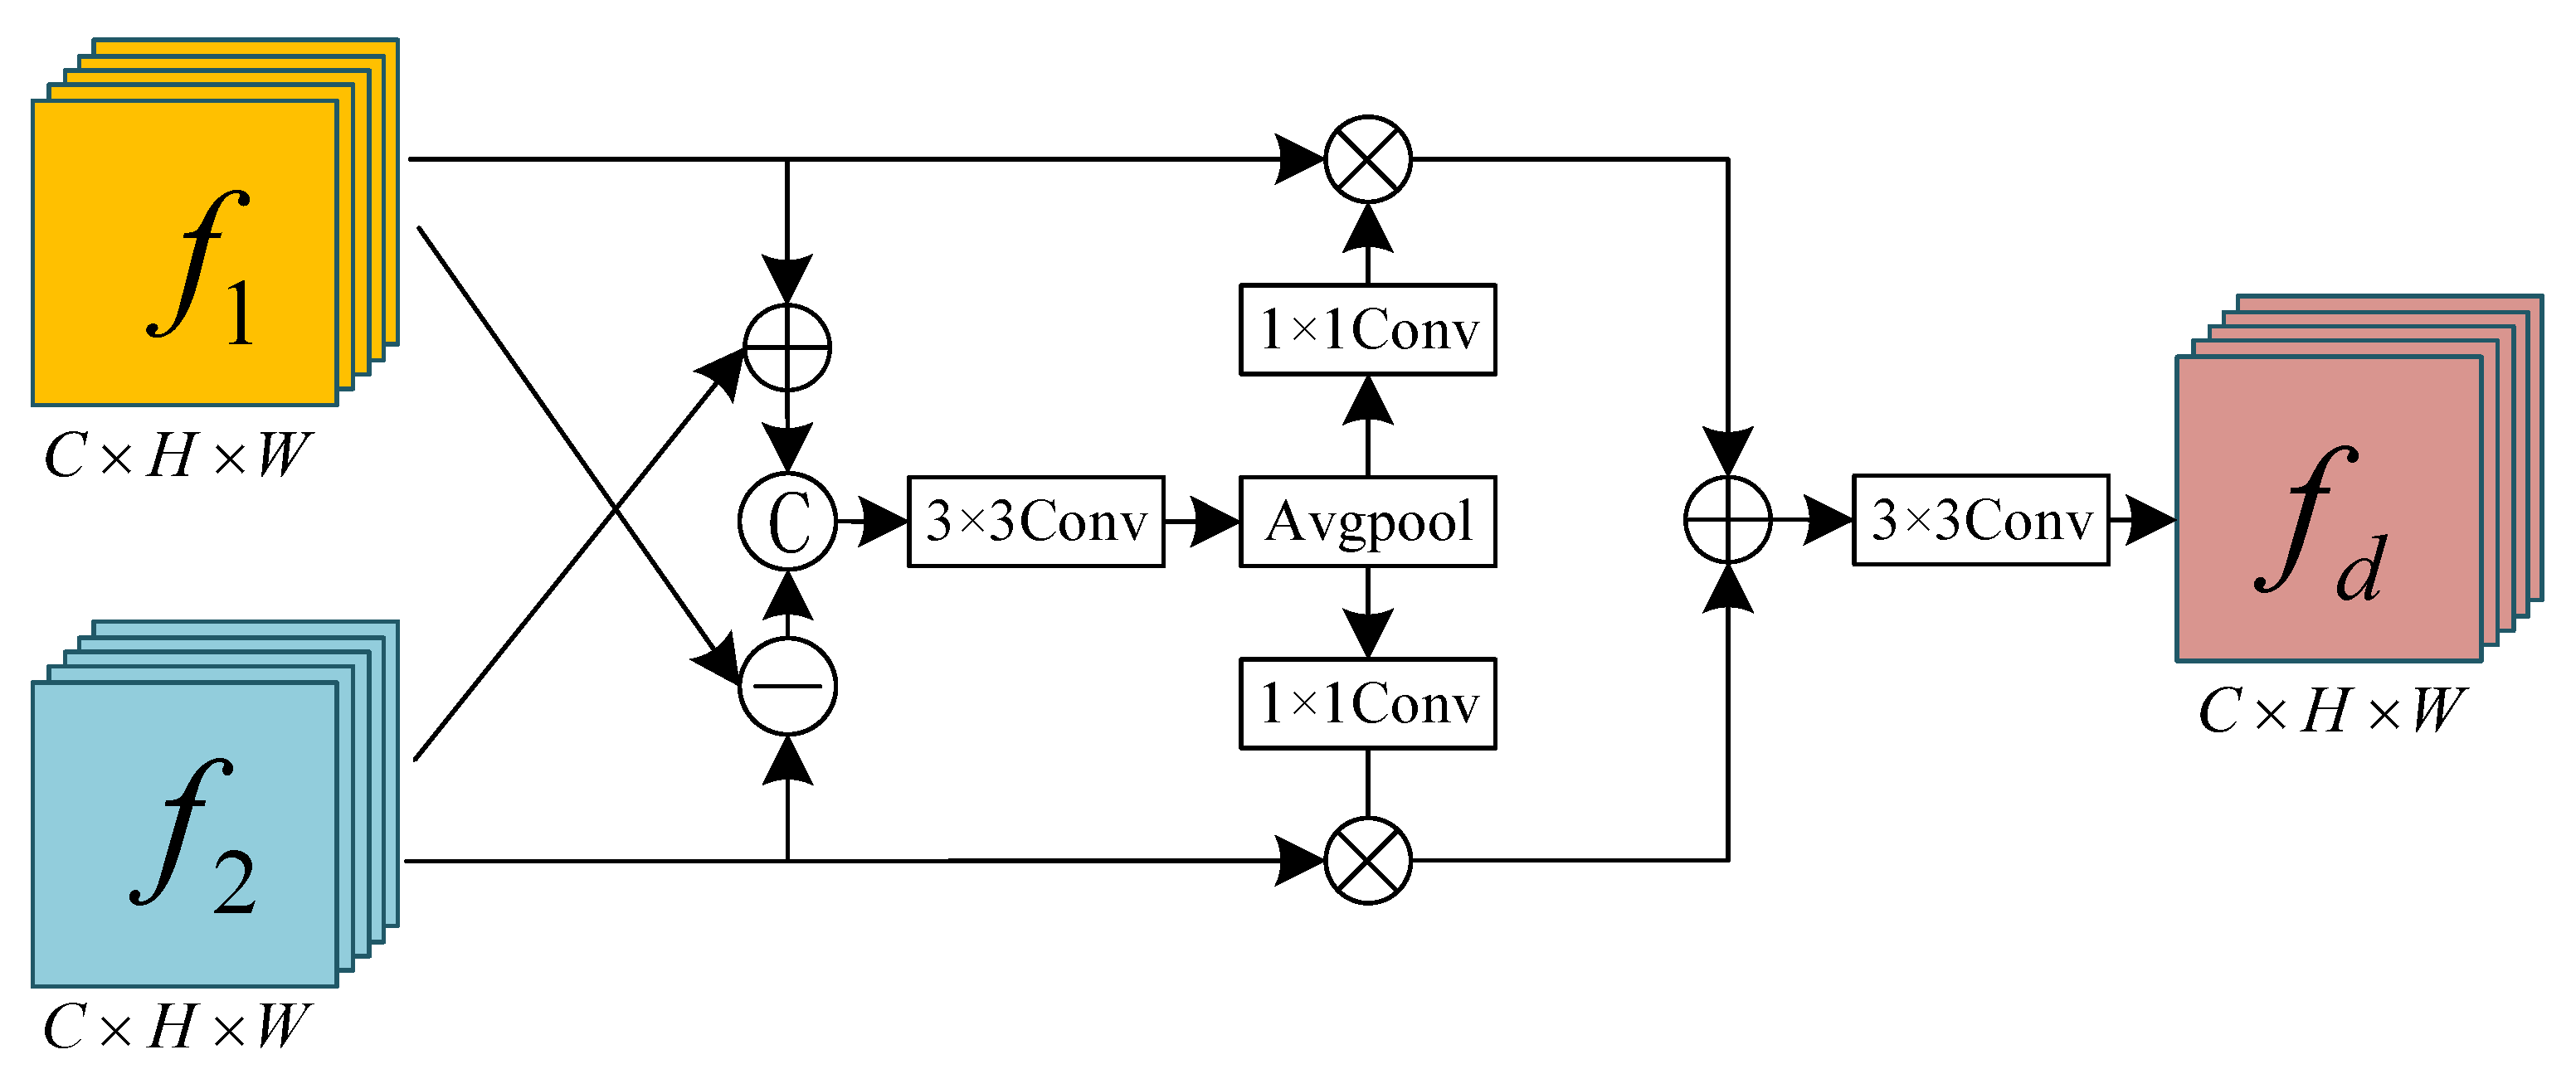
- Additionally, we have innovatively designed three auxiliary modules, namely the Difference Feature Module (DFM), Attention Refinement Module (ARM), and Cross-Scale Fusion Module (CSFM). DFM conducts difference operations on features extracted by the Siamese network to highlight change characteristics. Along with eliminating non-change features and adaptively collecting change information, ARM further refines the extracted difference features in both the spatial and the channel dimensions. CSFM effectively integrates change features from different scales, enhancing the model’s perception and utilization of features from various scales, reducing the model’s dependency on specific information, and improving its generalization ability.
3. Materials and Methods
3.1. Proposed Approach
3.1.1. Network Architecture
3.1.2. Difference Feature Module (DFM)
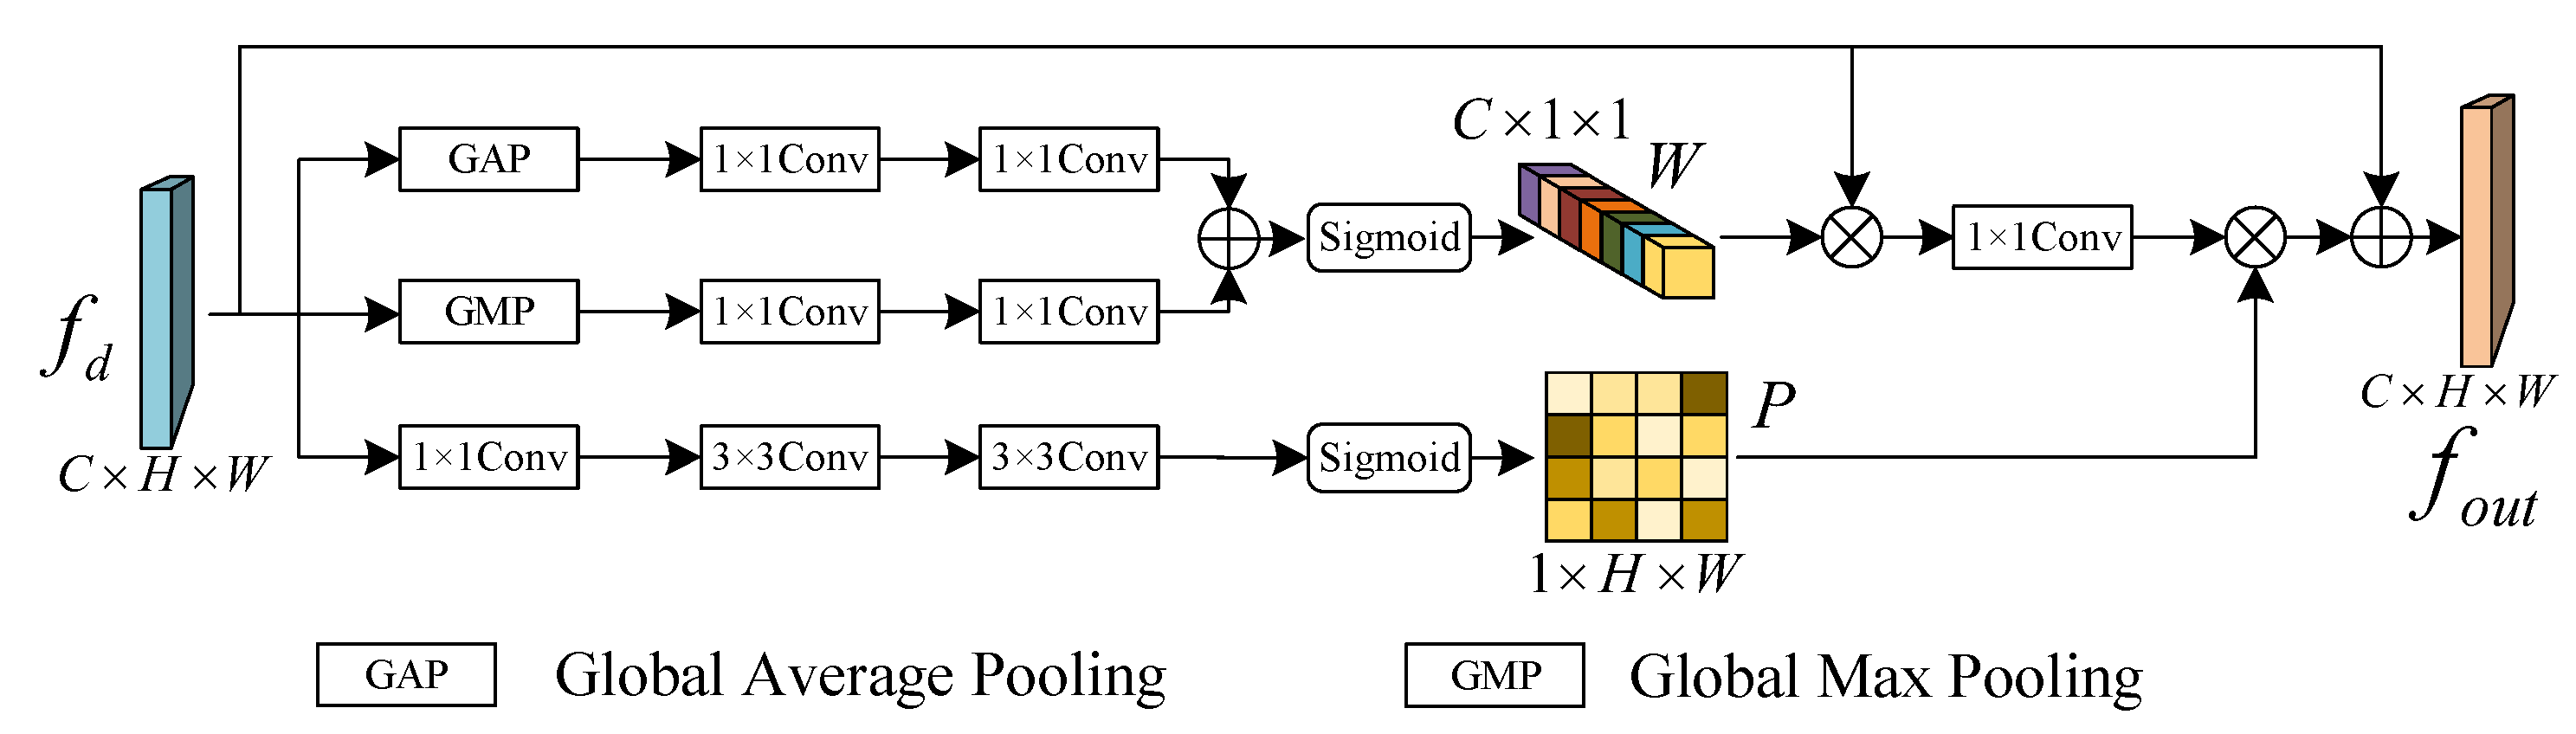
3.1.3. Attention Refinement Module (ARM)
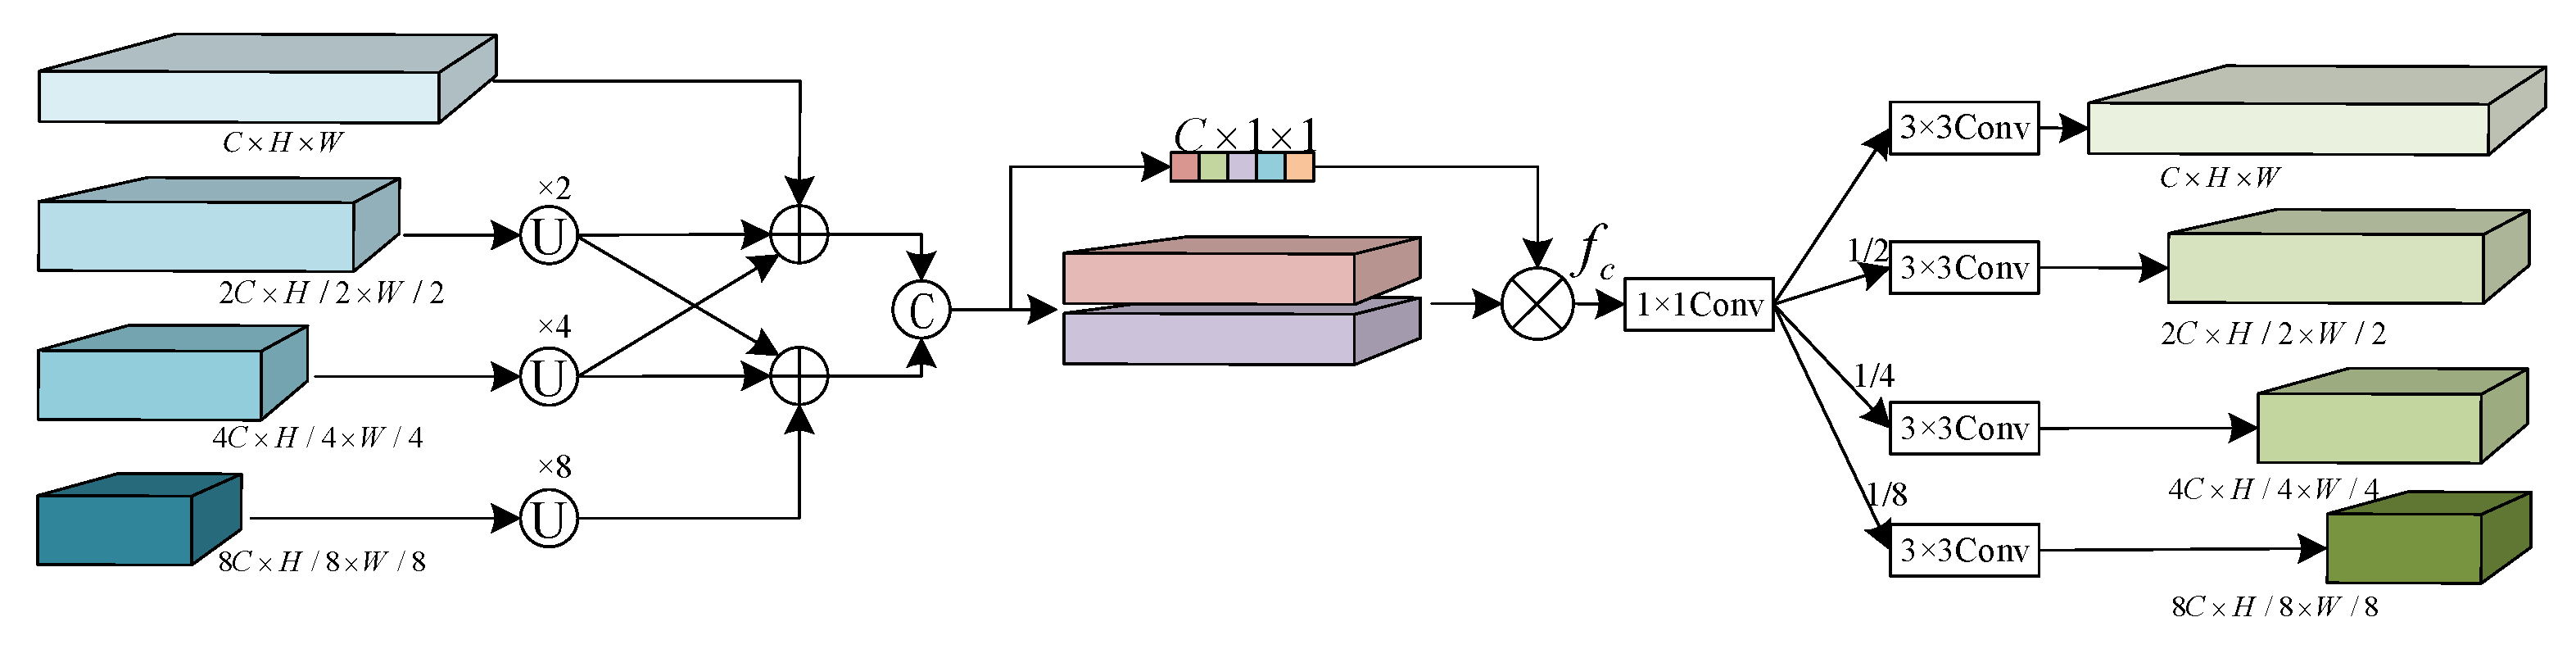
3.1.4. Cross-Scale Fusion Module (CSFM)
3.2. Datasets
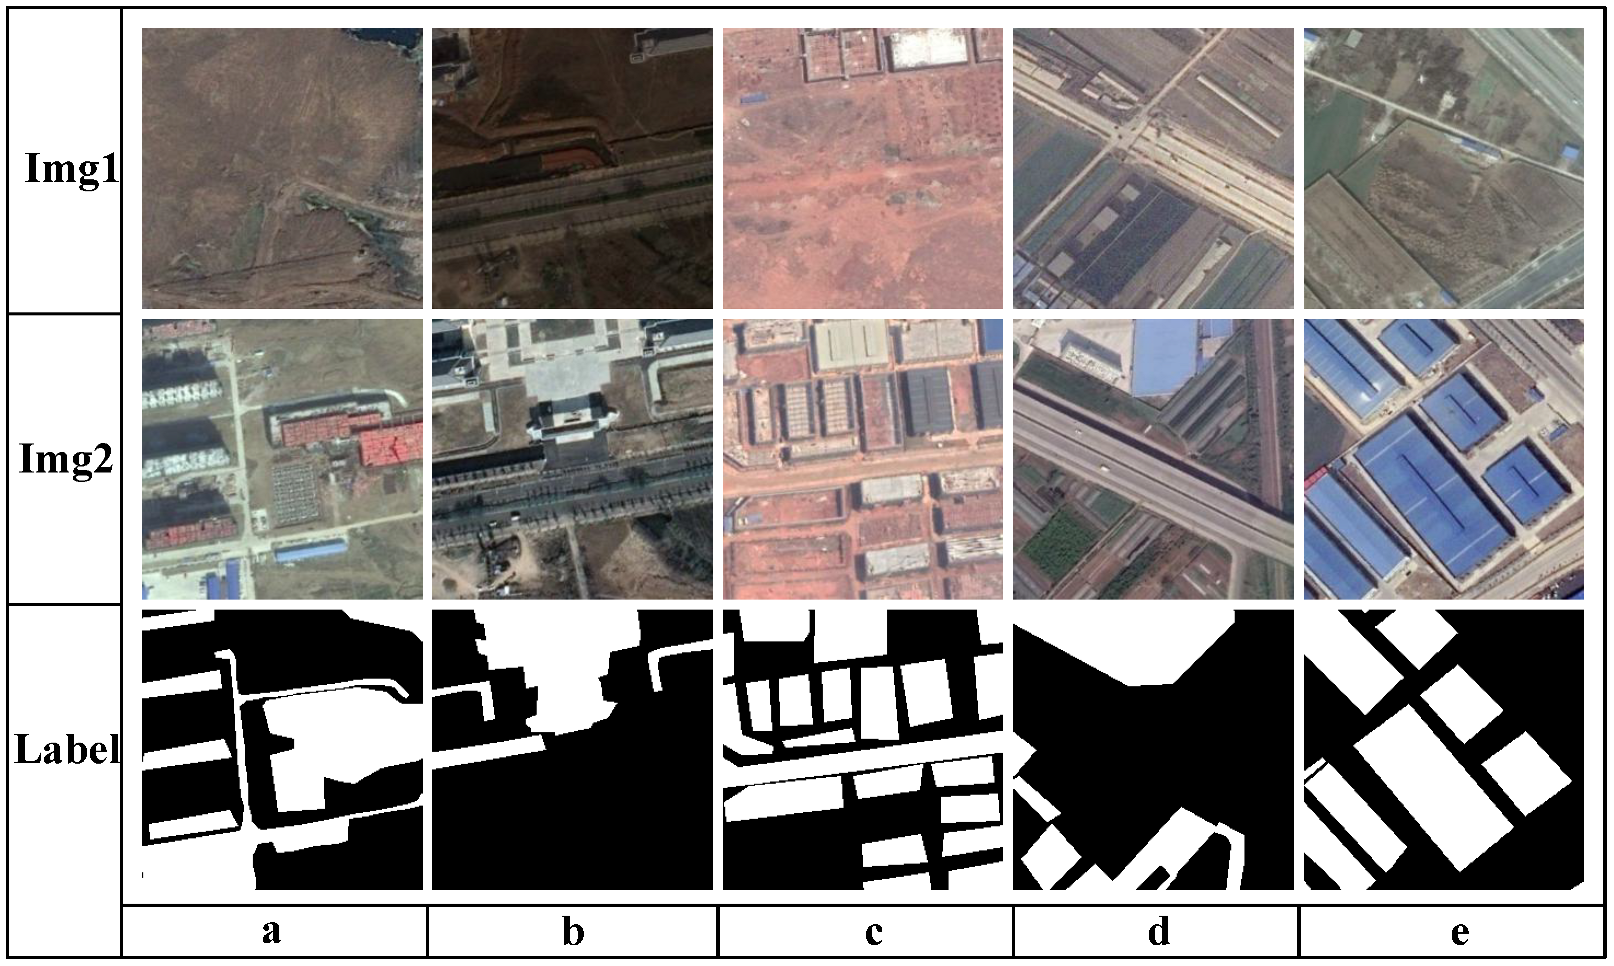
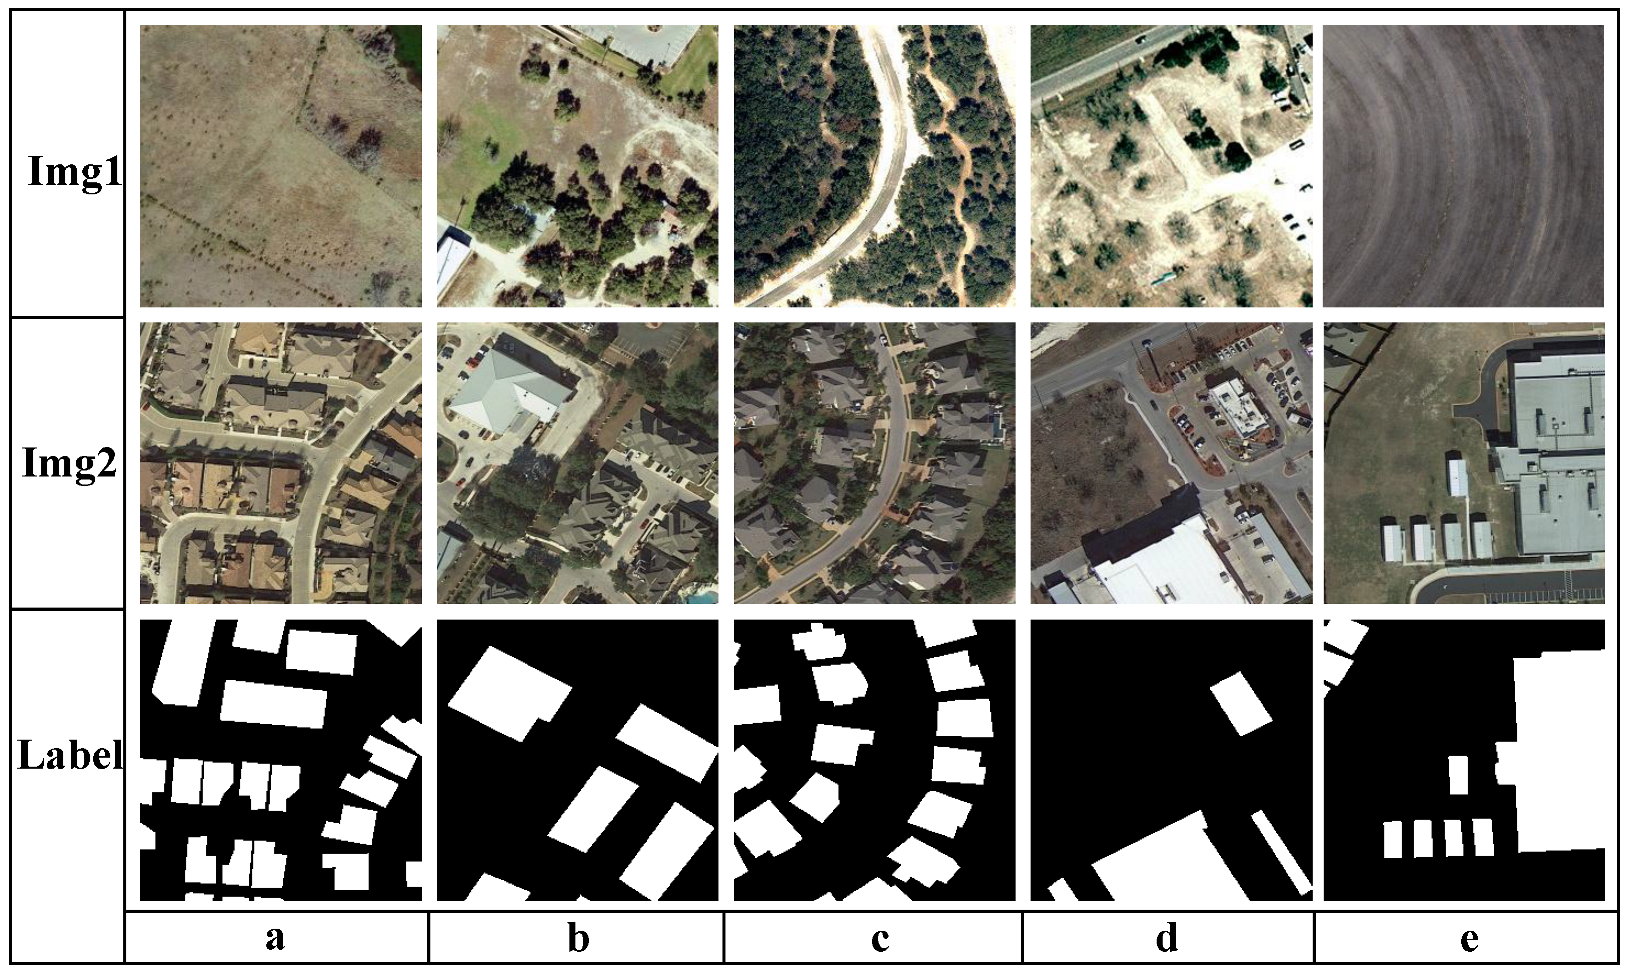
3.2.1. BTCDD
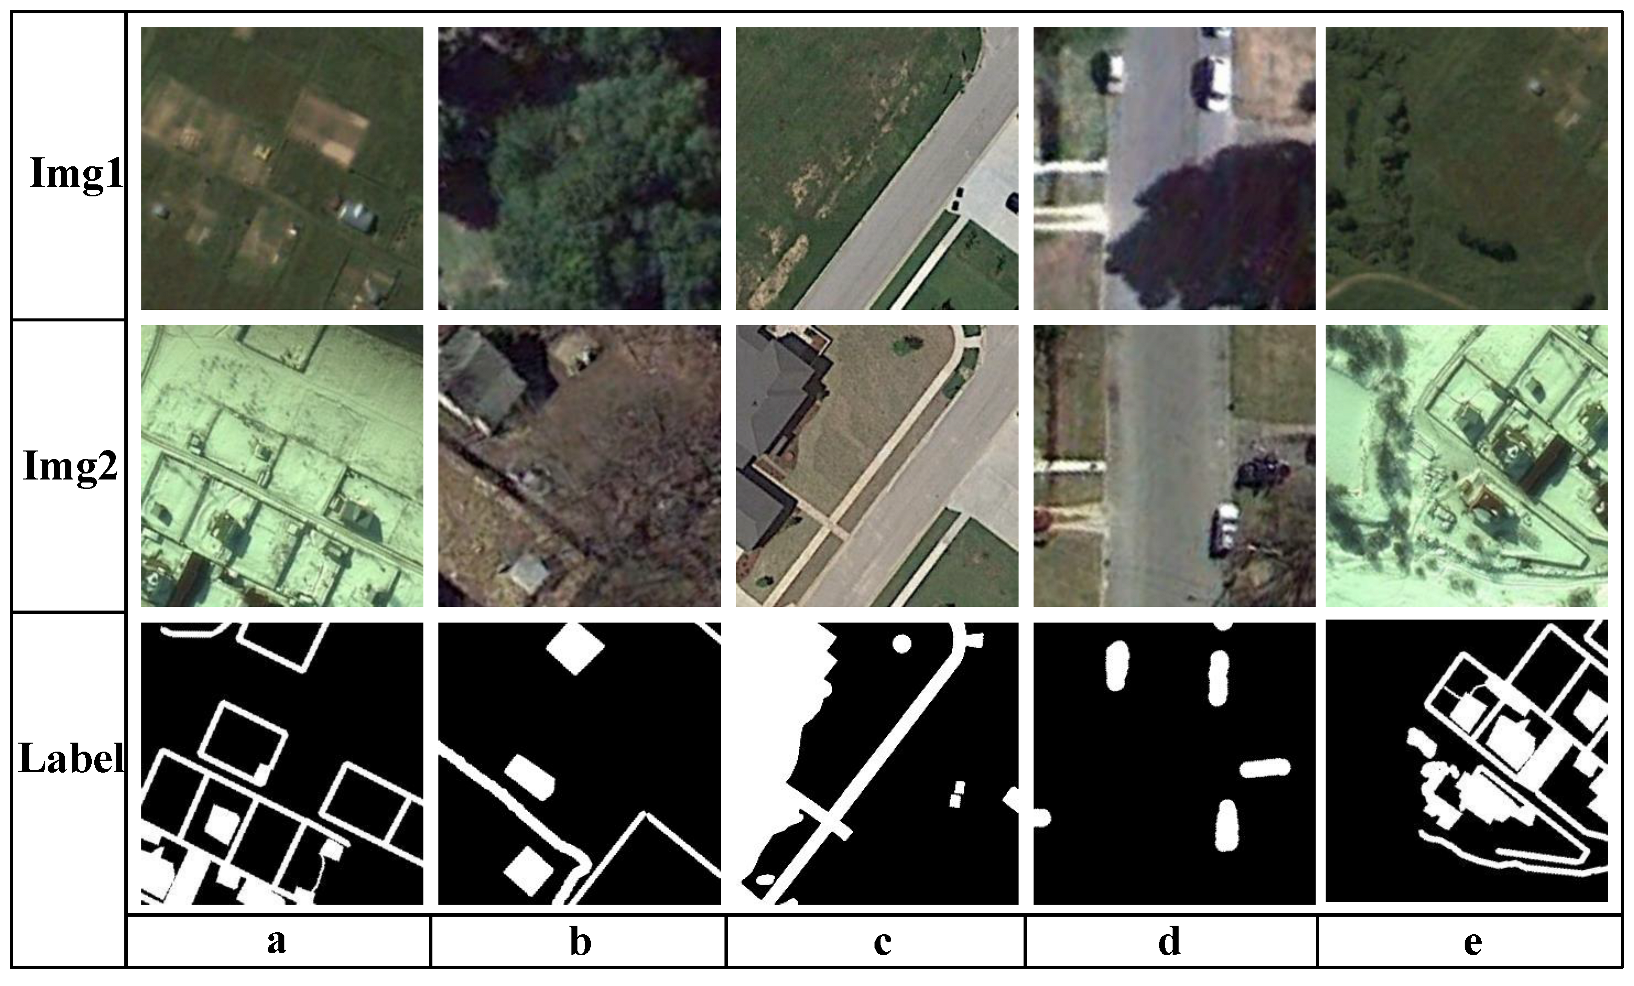
3.2.2. LEVIR-CD
3.2.3. CDD
3.3. Implementation Details
3.3.1. Evaluation Metrics
3.3.2. Experimental Details
4. Results
4.1. Network Structure Selection
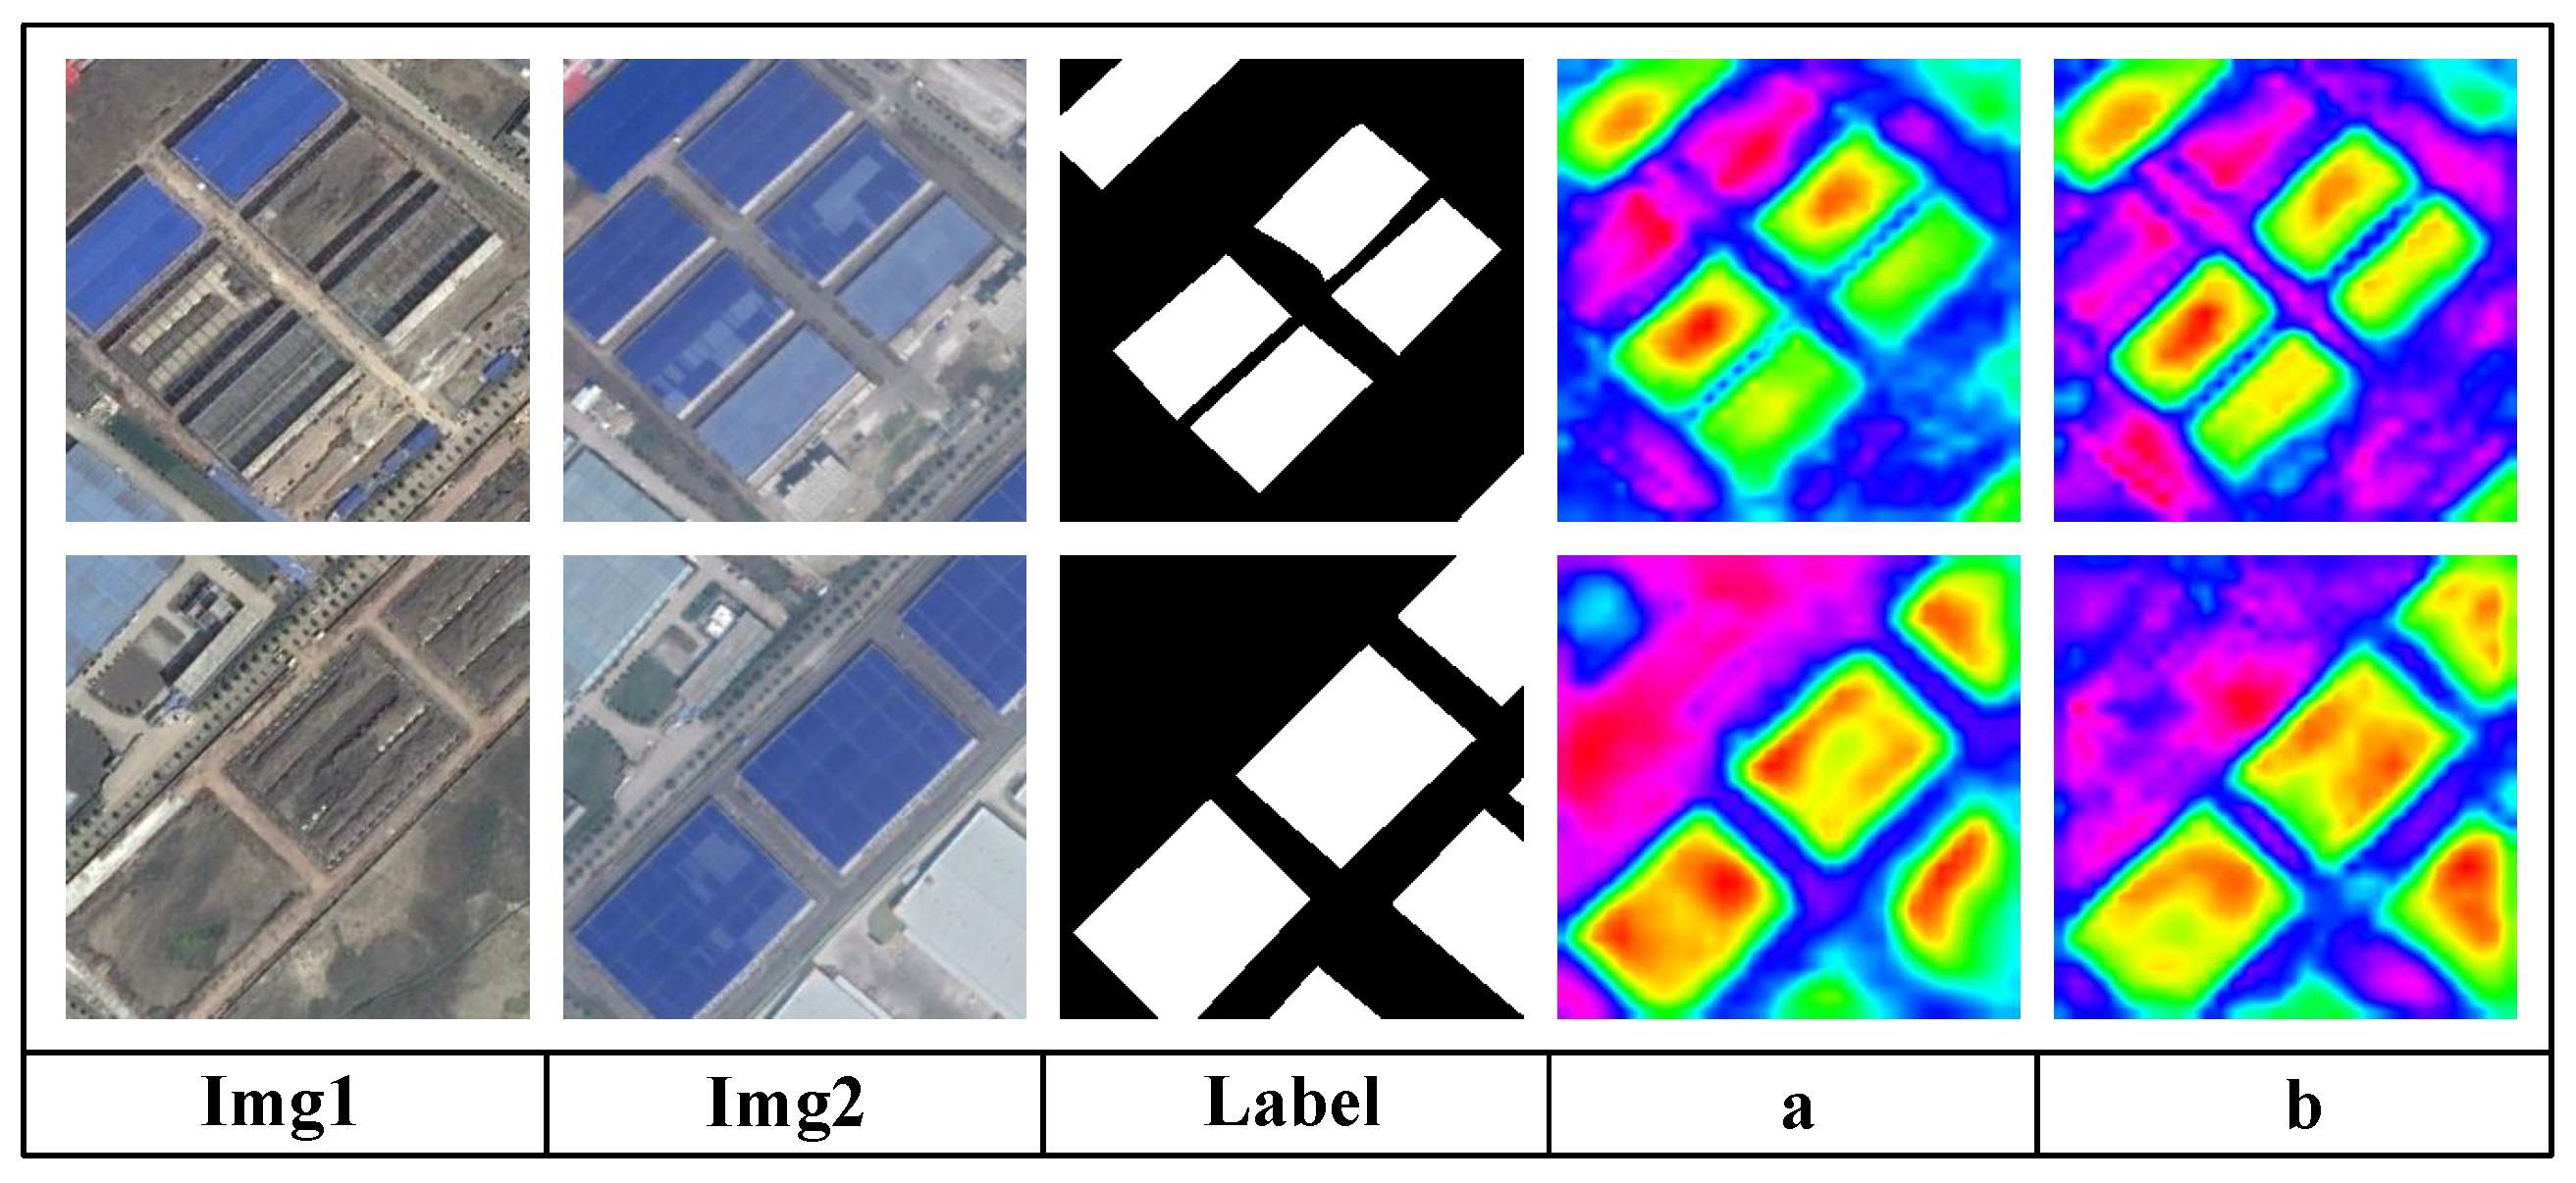
4.2. Ablation Experiments
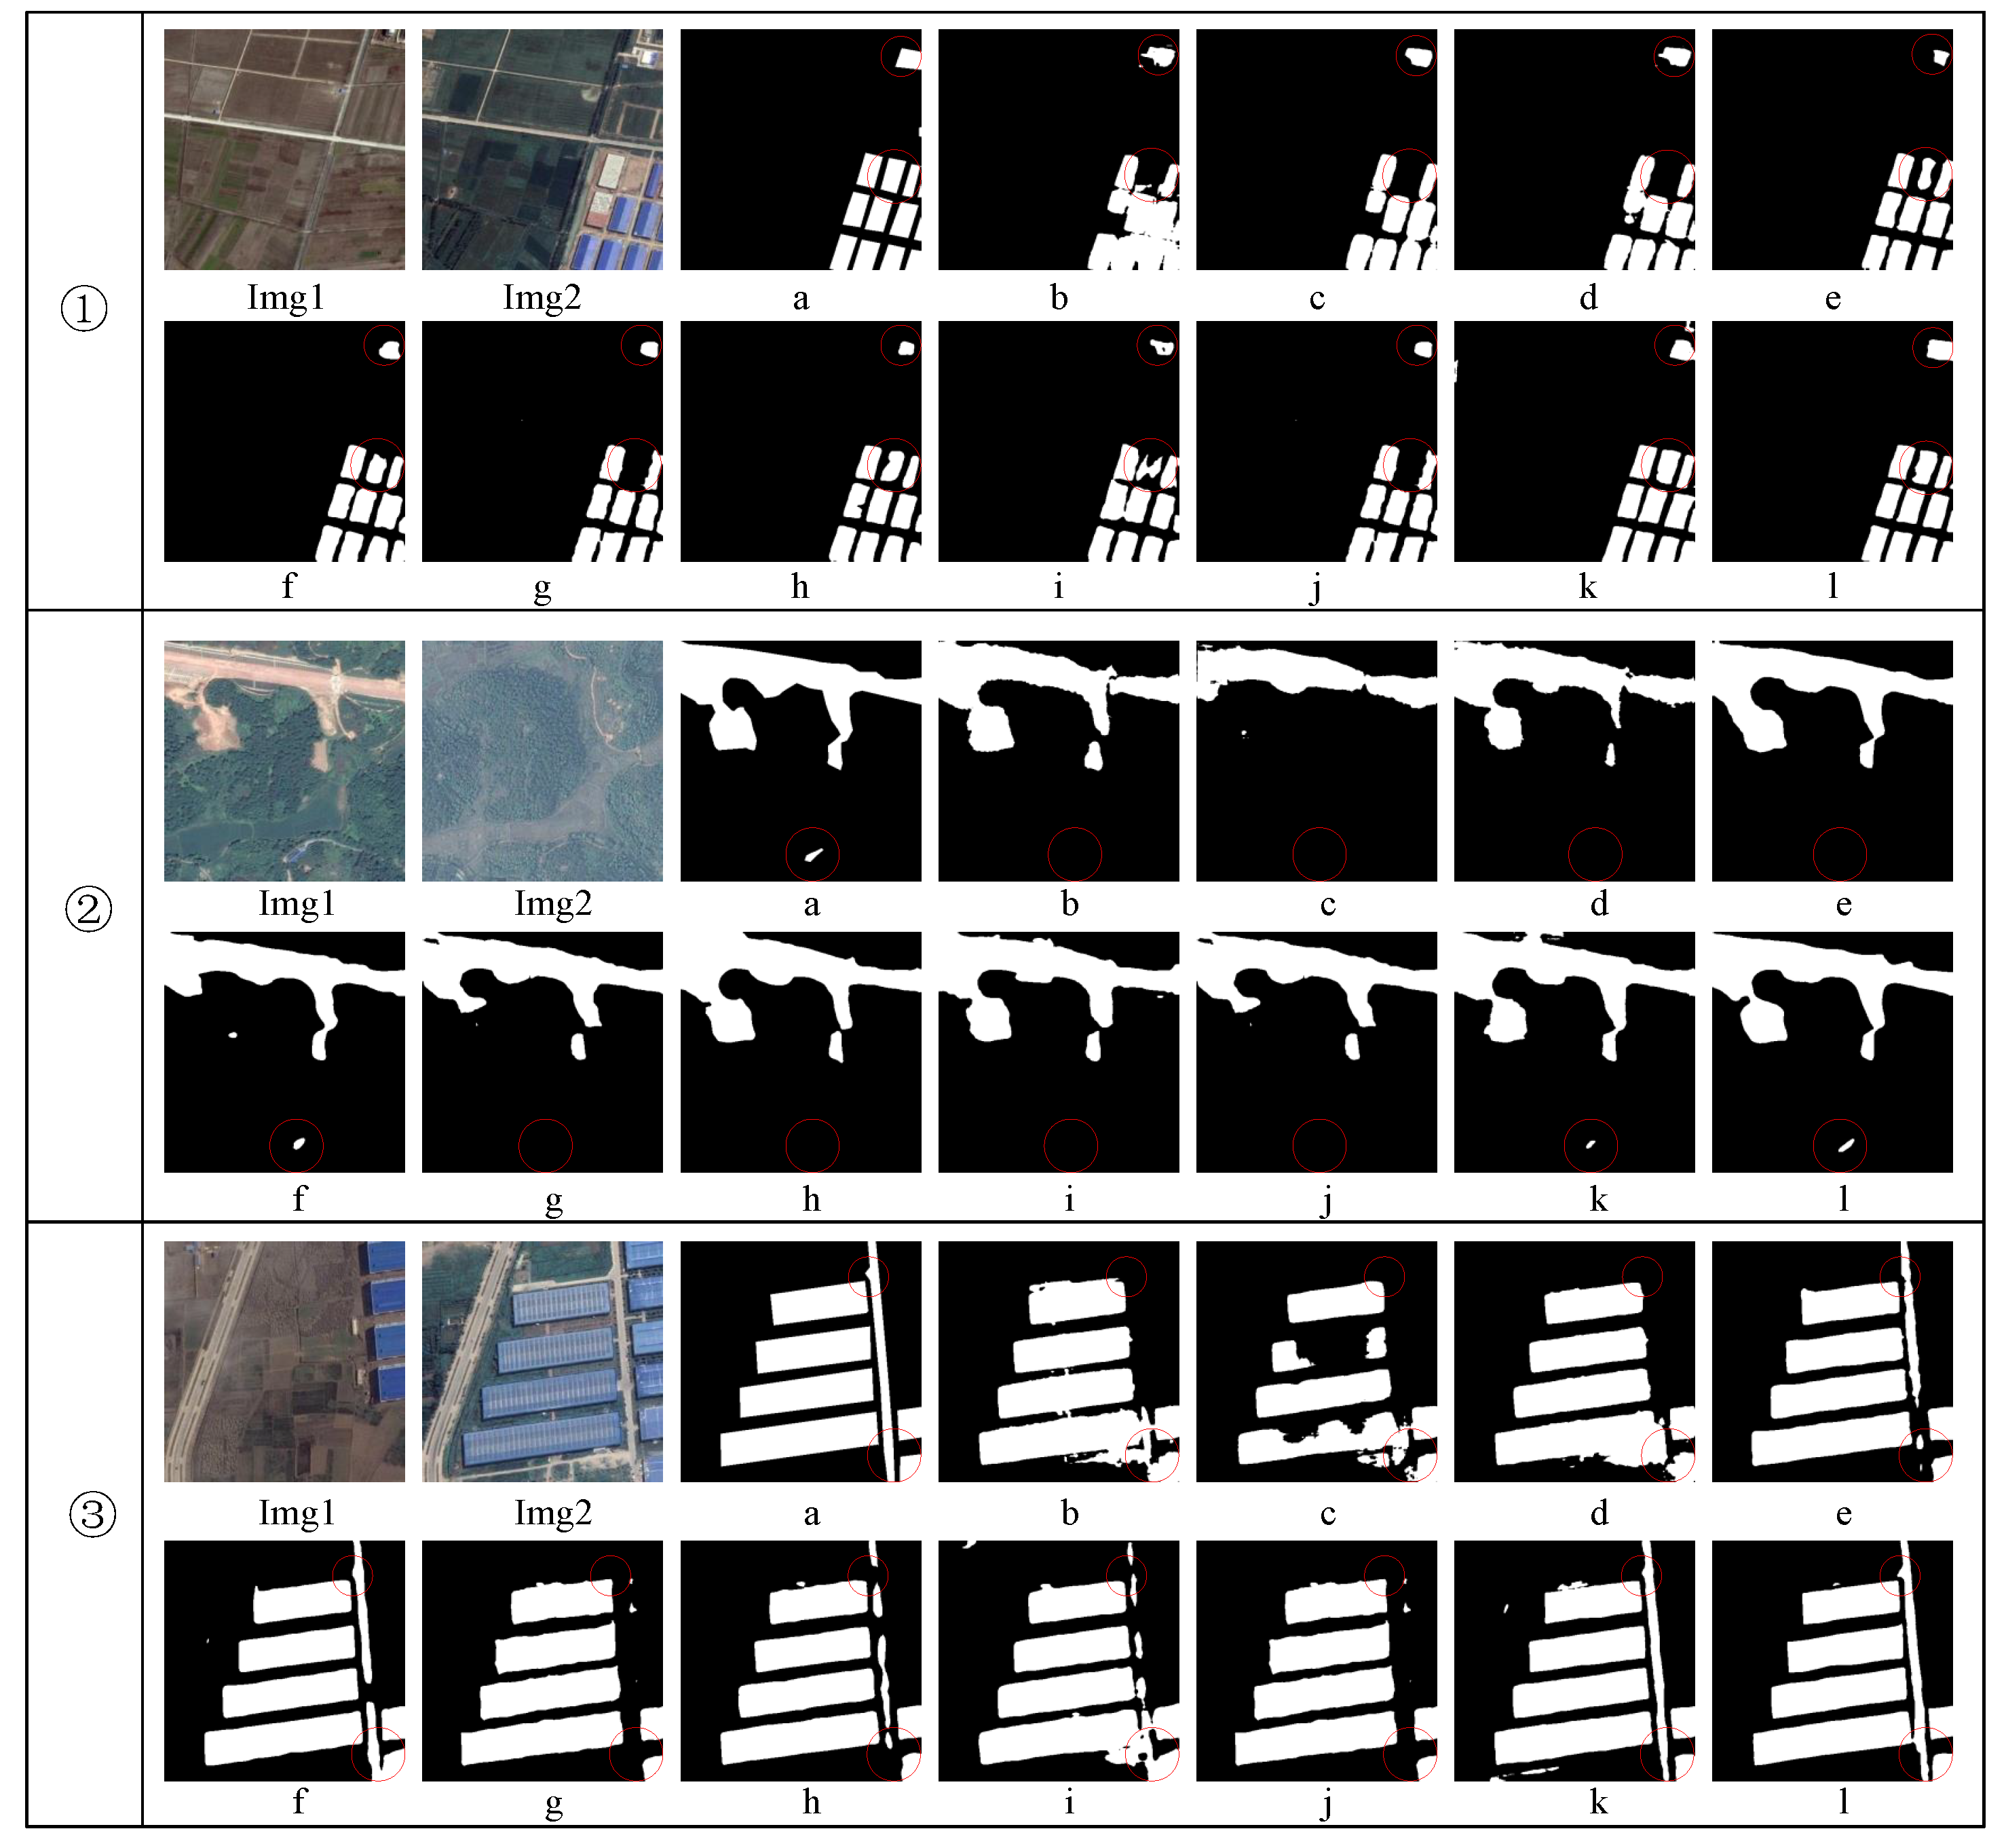
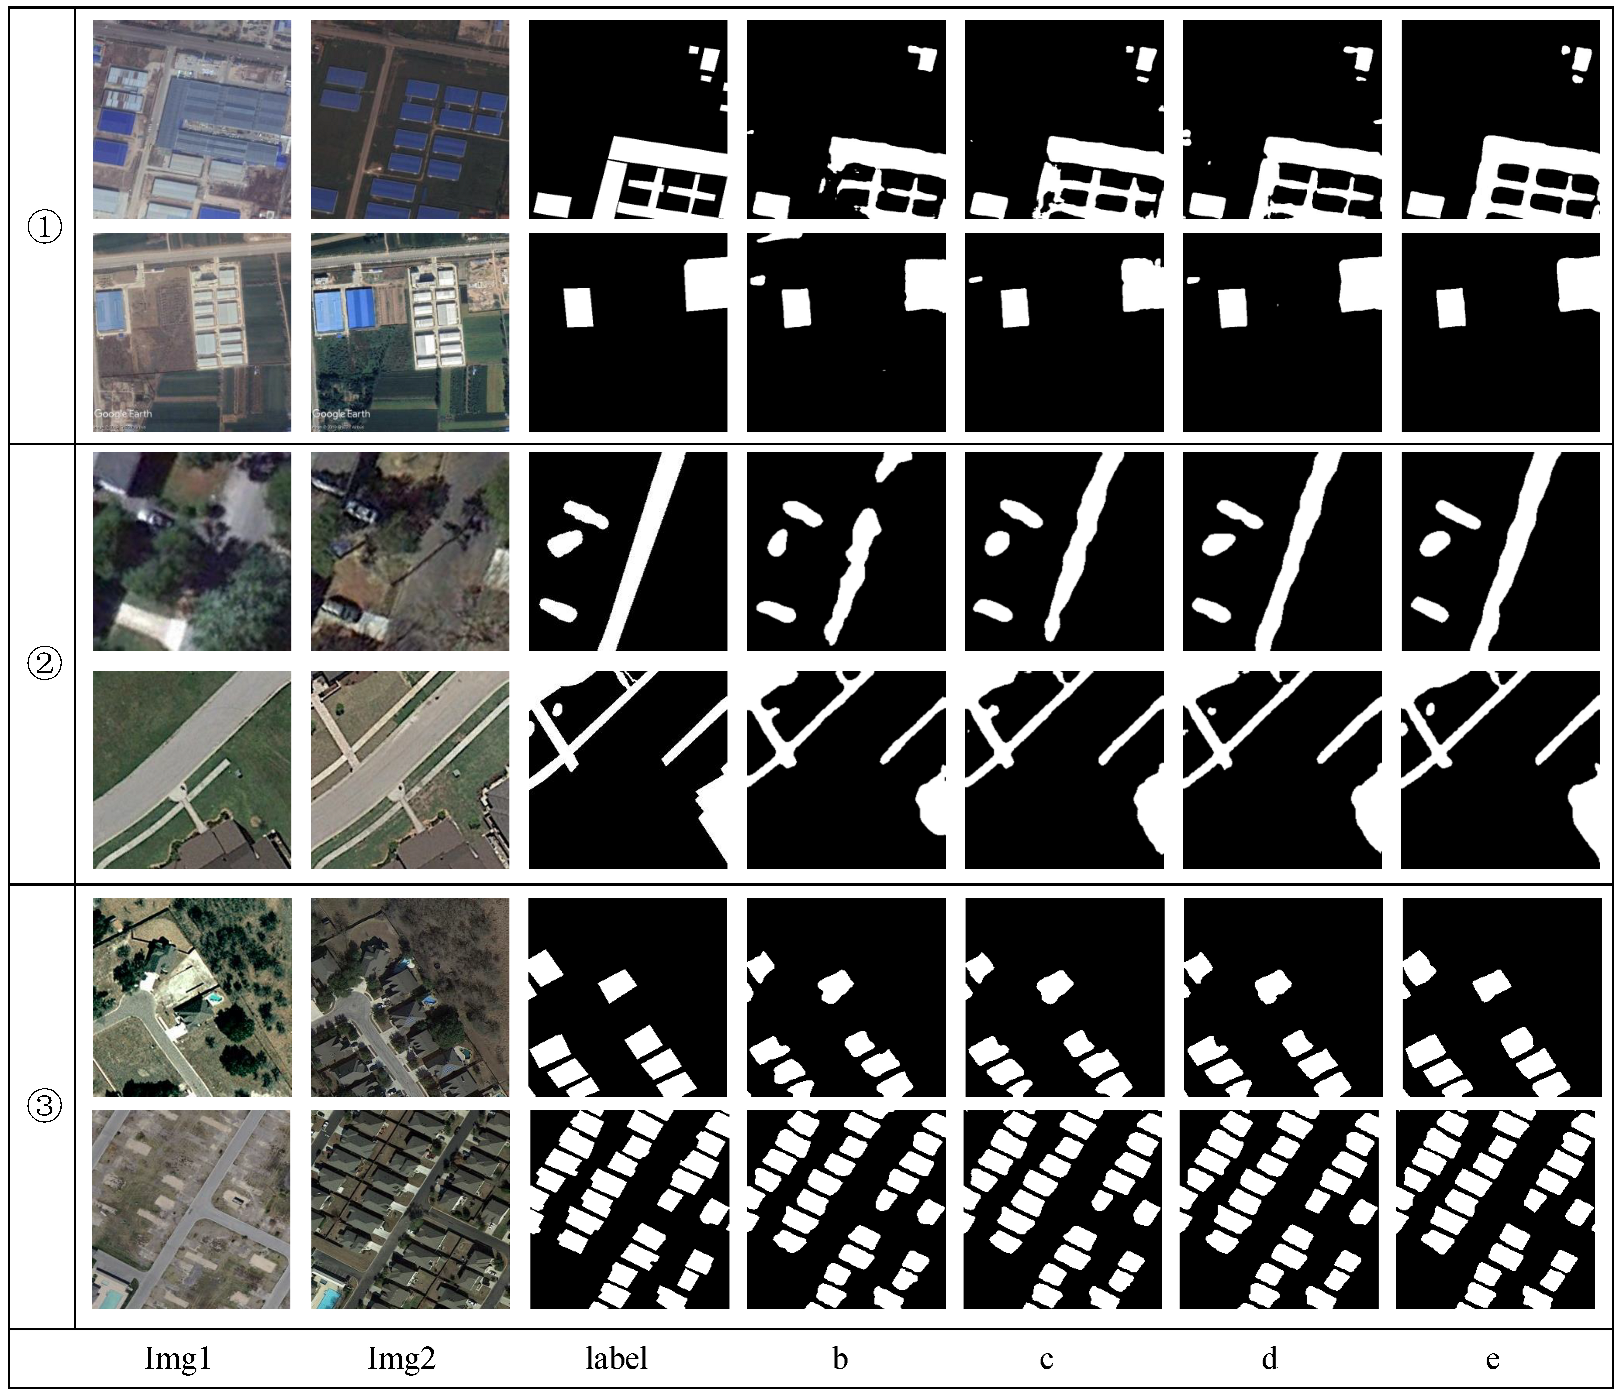
4.3. Comparative Experiments of Different Algorithms on BTCDD
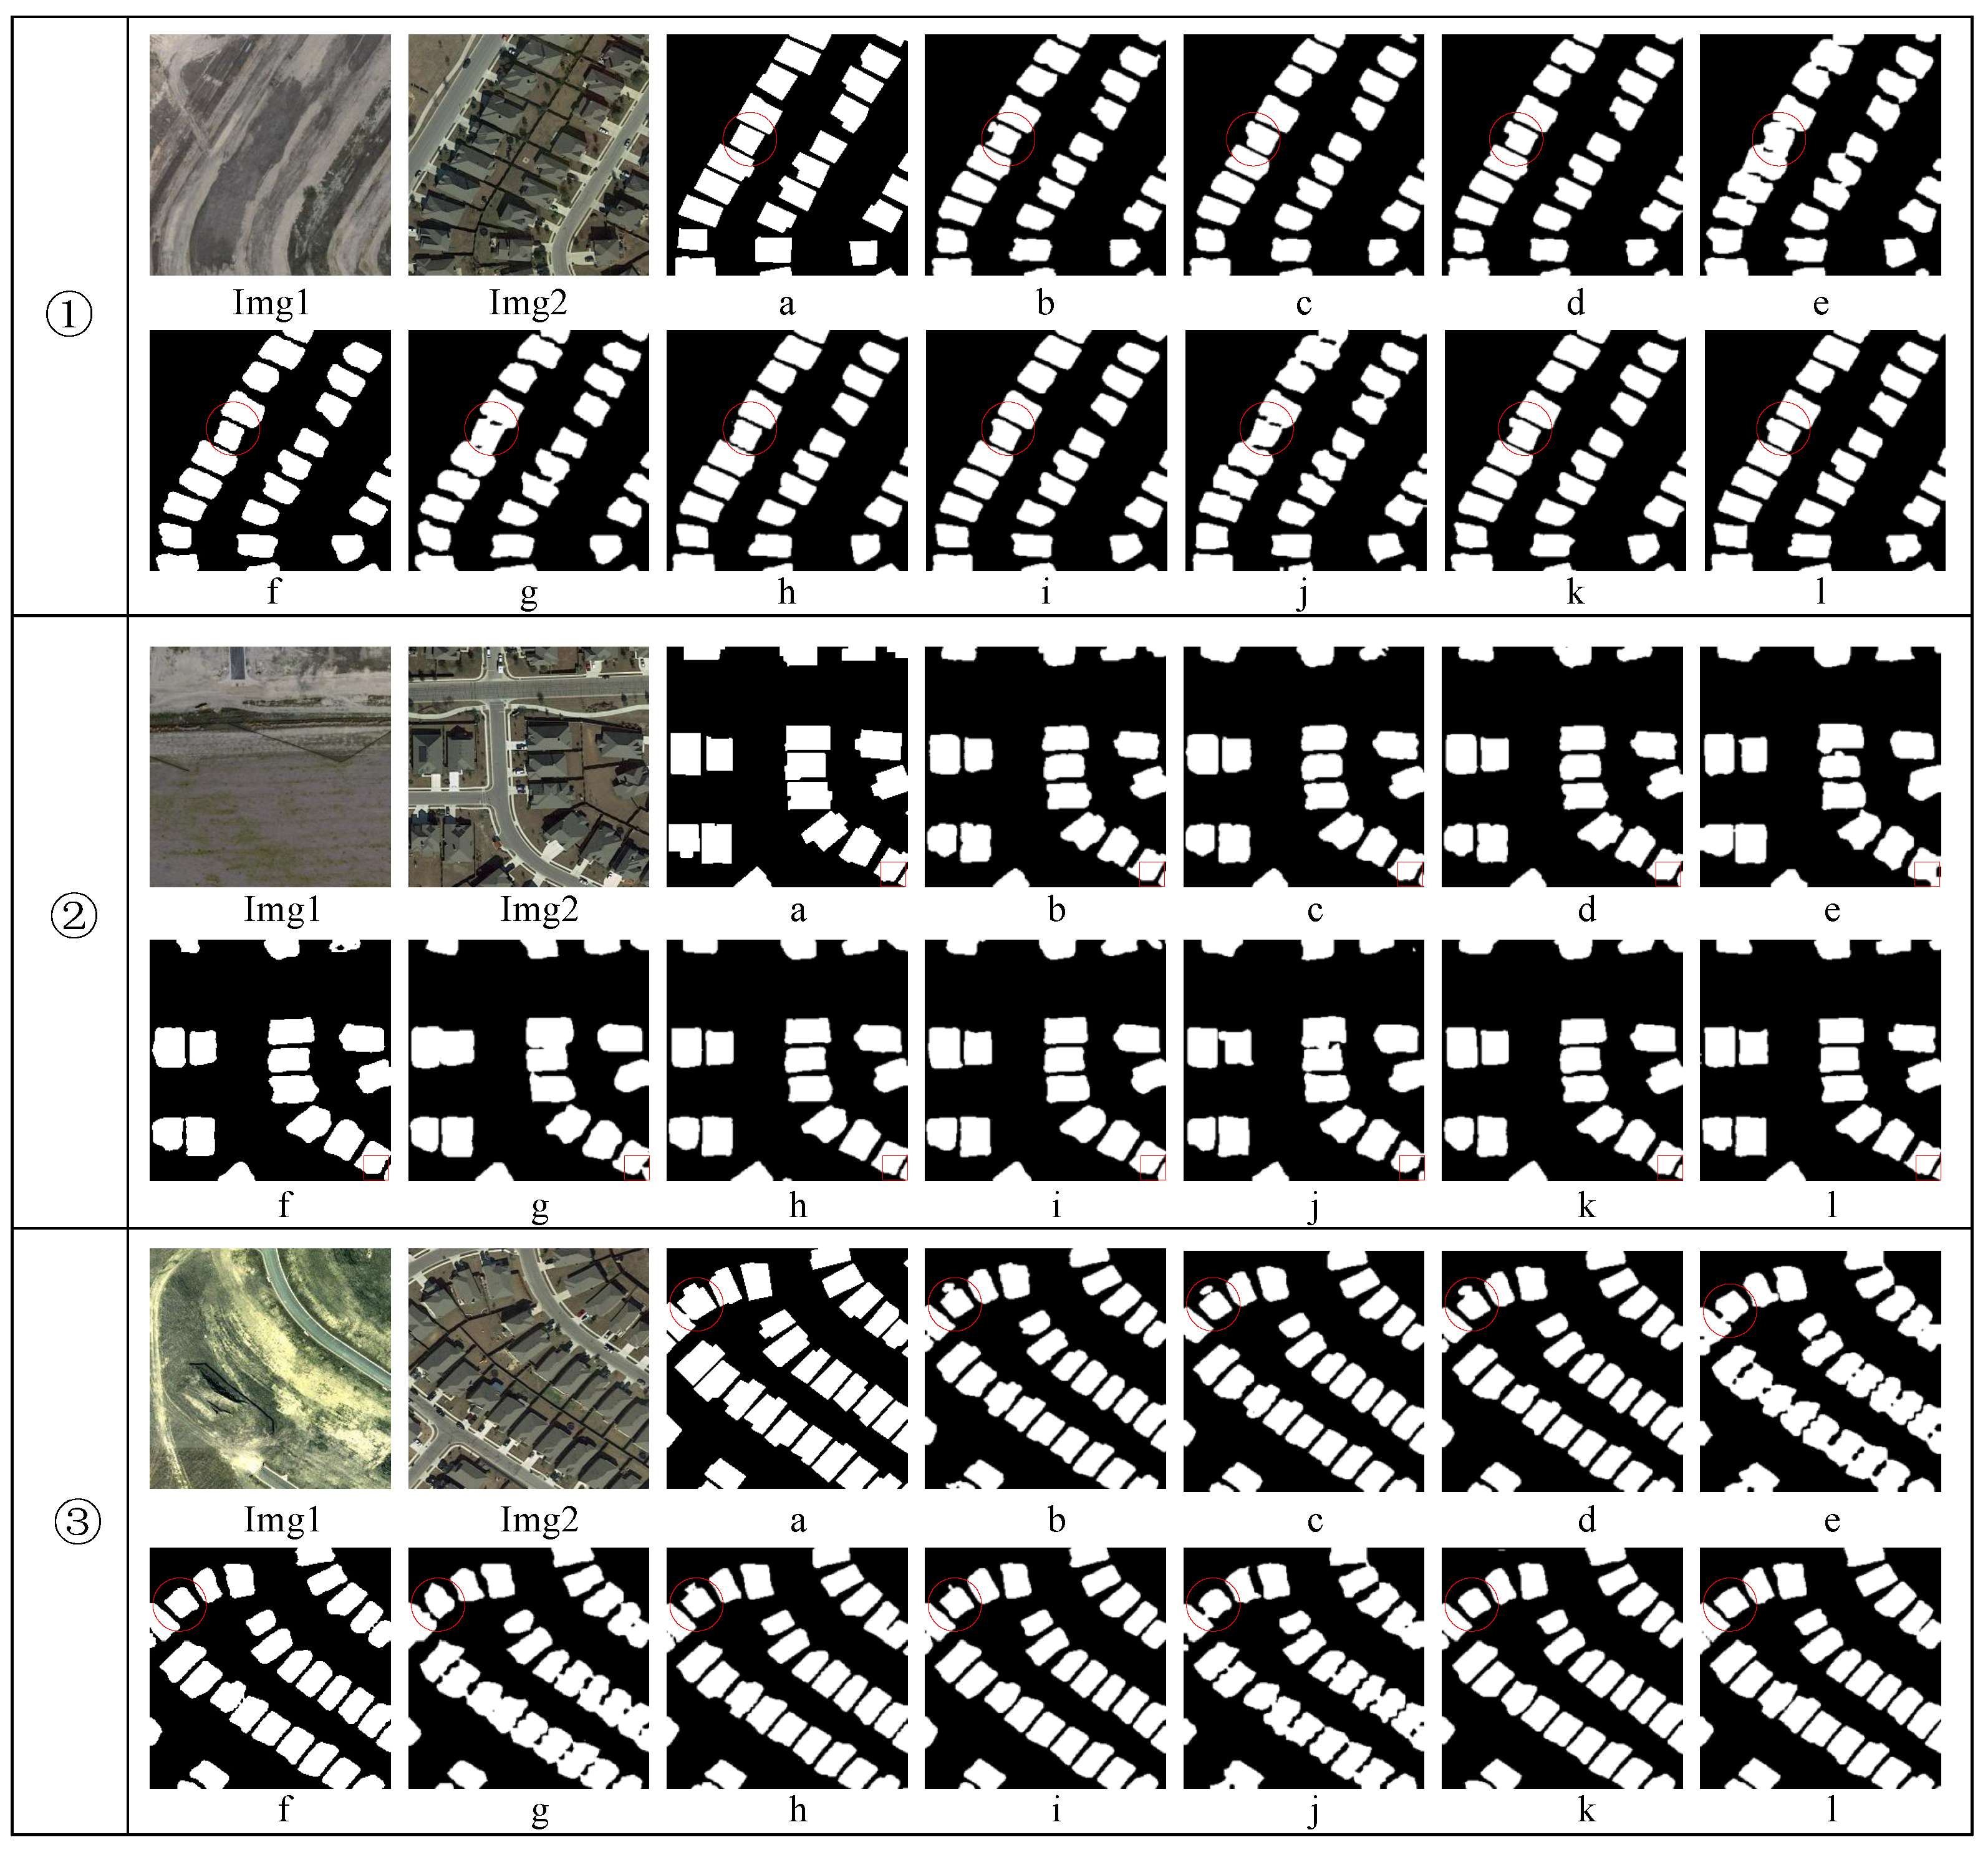
4.4. Generalization Experiments of Different Algorithms on LEVIR-CD
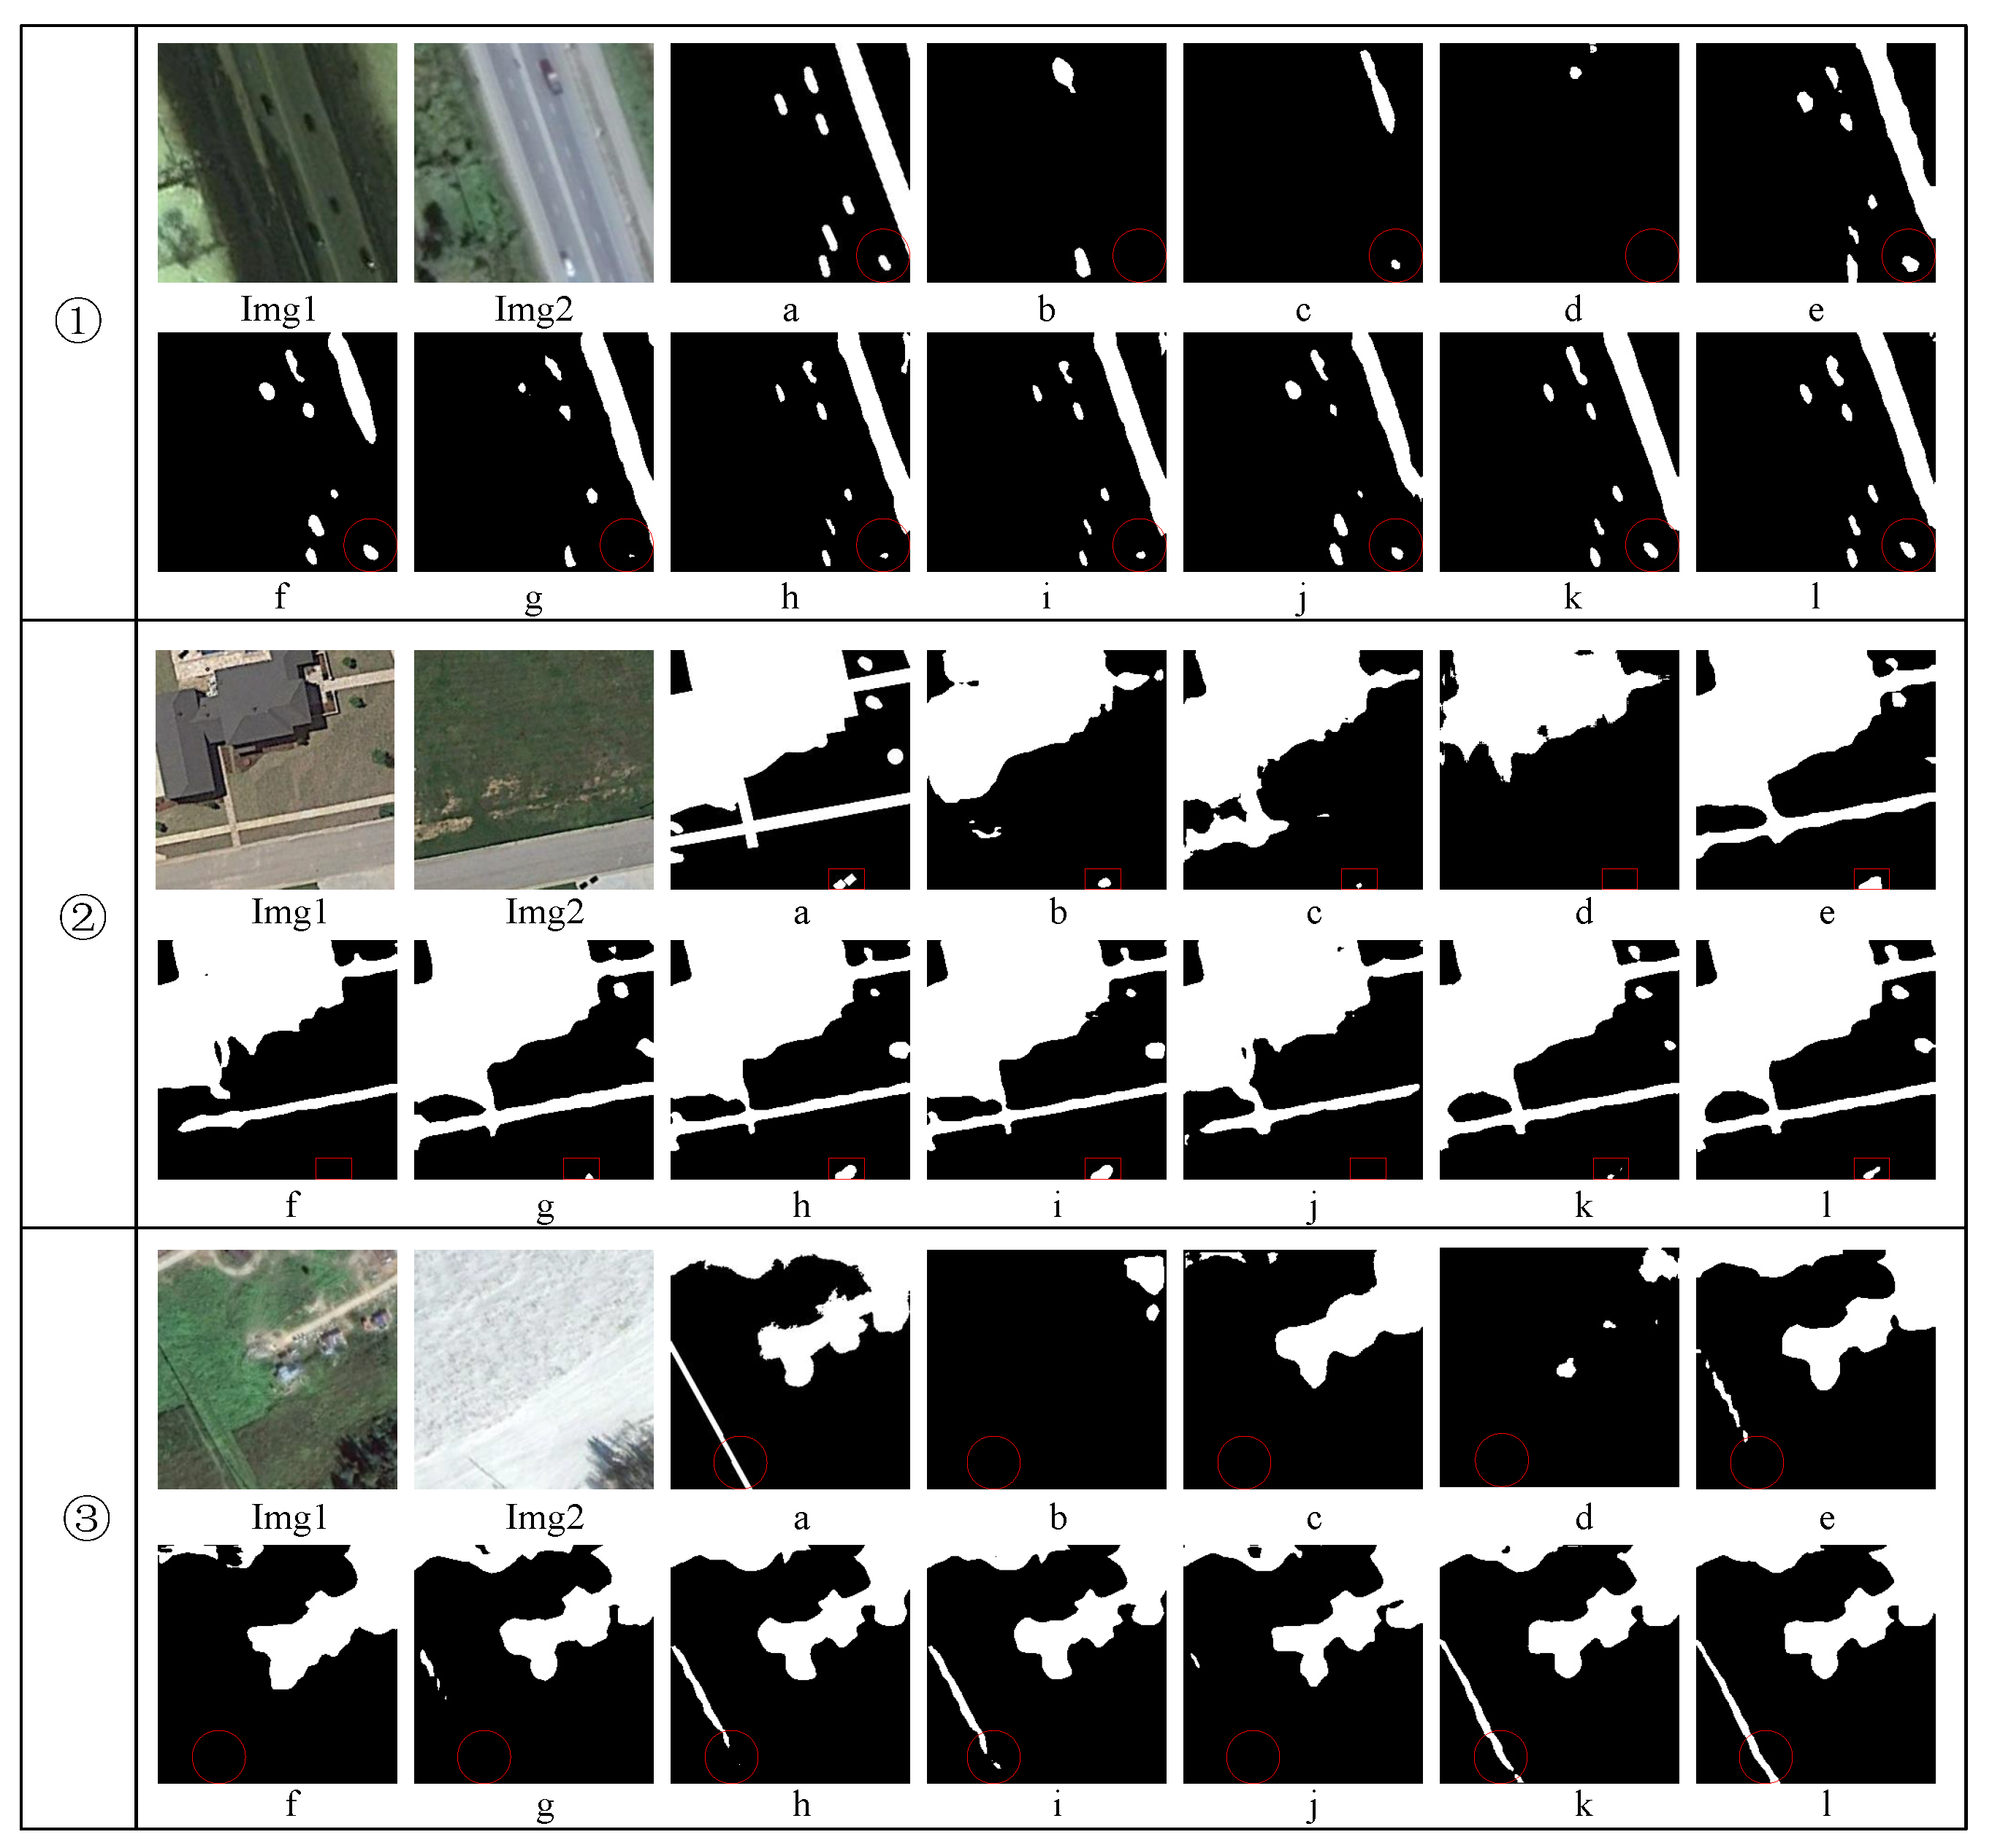
4.5. Generalization Experiments of Different Algorithms on CDD
5. Discussion
6. Conclusions
Author Contributions
Funding
Data Availability Statement
Conflicts of Interest
References
- Bala, G.; Caldeira, K.; Wickett, M.; Phillips, T.; Lobell, D.; Delire, C.; Mirin, A. Combined climate and carbon-cycle effects of large-scale deforestation. Proc. Natl. Acad. Sci. USA 2007, 104, 6550–6555. [Google Scholar] [CrossRef] [PubMed]
- Wang, W.; Liu, H.; Li, Y.; Su, J. Development and management of land reclamation in China. Ocean Coast. Manag. 2014, 102, 415–425. [Google Scholar] [CrossRef]
- Trenberth, K.E. Climate change caused by human activities is happening and it already has major consequences. J. Energy Nat. Resour. Law 2018, 36, 463–481. [Google Scholar] [CrossRef]
- Bruzzone, L.; Bovolo, F. A novel framework for the design of change-detection systems for very-high-resolution remote sensing images. Proc. IEEE 2012, 101, 609–630. [Google Scholar] [CrossRef]
- Li, D.; Yan, S.; Zhao, M.; Chow, T.W. Spatiotemporal tree filtering for enhancing image change detection. IEEE Trans. Image Process. 2020, 29, 8805–8820. [Google Scholar] [CrossRef] [PubMed]
- Radke, R.J.; Andra, S.; Al-Kofahi, O.; Roysam, B. Image change detection algorithms: A systematic survey. IEEE Trans. Image Process. 2005, 14, 294–307. [Google Scholar] [CrossRef]
- Ji, S.; Wei, S.; Lu, M. Fully convolutional networks for multisource building extraction from an open aerial and satellite imagery data set. IEEE Trans. Geosci. Remote Sens. 2018, 57, 574–586. [Google Scholar] [CrossRef]
- Ren, H.; Xia, M.; Weng, L.; Hu, K.; Lin, H. Dual-Attention-Guided Multiscale Feature Aggregation Network for Remote Sensing Image Change Detection. IEEE J. Sel. Top. Appl. Earth Obs. Remote Sens. 2024, 17, 4899–4916. [Google Scholar] [CrossRef]
- Schmitt, A.; Wessel, B.; Roth, A. Curvelet-based change detection on SAR images for natural disaster mapping. Photogramm. Fernerkund. Geoinf. 2010, 2010, 463–474. [Google Scholar] [CrossRef]
- Wang, Z.; Xia, M.; Weng, L.; Hu, K.; Lin, H. Dual Encoder–Decoder Network for Land Cover Segmentation of Remote Sensing Image. IEEE J. Sel. Top. Appl. Earth Obs. Remote Sens. 2024, 17, 2372–2385. [Google Scholar] [CrossRef]
- D’Addabbo, A.; Refice, A.; Pasquariello, G.; Lovergine, F.P.; Capolongo, D.; Manfreda, S. A Bayesian network for flood detection combining SAR imagery and ancillary data. IEEE Trans. Geosci. Remote Sens. 2016, 54, 3612–3625. [Google Scholar] [CrossRef]
- Du, Y.; Teillet, P.M.; Cihlar, J. Radiometric normalization of multitemporal high-resolution satellite images with quality control for land cover change detection. Remote Sens. Environ. 2002, 82, 123–134. [Google Scholar] [CrossRef]
- Nielsen, A.A. The regularized iteratively reweighted MAD method for change detection in multi-and hyperspectral data. IEEE Trans. Image Process. 2007, 16, 463–478. [Google Scholar] [CrossRef] [PubMed]
- Zhang, H.; Gong, M.; Zhang, P.; Su, L.; Shi, J. Feature-level change detection using deep representation and feature change analysis for multispectral imagery. IEEE Geosci. Remote Sens. Lett. 2016, 13, 1666–1670. [Google Scholar] [CrossRef]
- Belgiu, M.; Drăguţ, L. Random forest in remote sensing: A review of applications and future directions. ISPRS J. Photogramm. Remote Sens. 2016, 114, 24–31. [Google Scholar] [CrossRef]
- Meyer, D.; Wien, F. Support vector machines. R News 2001, 1, 23–26. [Google Scholar]
- Volpi, M.; Tuia, D.; Bovolo, F.; Kanevski, M.; Bruzzone, L. Supervised change detection in VHR images using contextual information and support vector machines. Int. J. Appl. Earth Obs. Geoinf. 2013, 20, 77–85. [Google Scholar] [CrossRef]
- Wang, X.; Liu, S.; Du, P.; Liang, H.; Xia, J.; Li, Y. Object-based change detection in urban areas from high spatial resolution images based on multiple features and ensemble learning. Remote Sens. 2018, 10, 276. [Google Scholar] [CrossRef]
- Gong, M.; Cao, Y.; Wu, Q. A neighborhood-based ratio approach for change detection in SAR images. IEEE Geosci. Remote Sens. Lett. 2011, 9, 307–311. [Google Scholar] [CrossRef]
- Liu, H.; Yang, M.; Chen, J.; Hou, J.; Deng, M. Line-constrained shape feature for building change detection in VHR remote sensing imagery. ISPRS Int. J. Geo-Inf. 2018, 7, 410. [Google Scholar] [CrossRef]
- Desclée, B.; Bogaert, P.; Defourny, P. Forest change detection by statistical object-based method. Remote Sens. Environ. 2006, 102, 1–11. [Google Scholar] [CrossRef]
- Liu, J.; Gong, M.; Qin, K.; Zhang, P. A deep convolutional coupling network for change detection based on heterogeneous optical and radar images. IEEE Trans. Neural Netw. Learn. Syst. 2016, 29, 545–559. [Google Scholar] [CrossRef] [PubMed]
- Weismiller, R.; Kristof, S.; Scholz, D.; Anuta, P.; Momin, S. Change detection in coastal zone environments. Photogramm. Eng. Remote Sens. 1977, 43, 1533–1539. [Google Scholar]
- Rignot, E.J.; Van Zyl, J.J. Change detection techniques for ERS-1 SAR data. IEEE Trans. Geosci. Remote Sens. 1993, 31, 896–906. [Google Scholar] [CrossRef]
- Bovolo, F.; Bruzzone, L. A theoretical framework for unsupervised change detection based on change vector analysis in the polar domain. IEEE Trans. Geosci. Remote Sens. 2006, 45, 218–236. [Google Scholar] [CrossRef]
- Chen, Q.; Chen, Y. Multi-feature object-based change detection using self-adaptive weight change vector analysis. Remote Sens. 2016, 8, 549. [Google Scholar] [CrossRef]
- Luppino, L.T.; Bianchi, F.M.; Moser, G.; Anfinsen, S.N. Unsupervised image regression for heterogeneous change detection. arXiv 2019, arXiv:1909.05948. [Google Scholar] [CrossRef]
- Ding, L.; Xia, M.; Lin, H.; Hu, K. Multi-Level Attention Interactive Network for Cloud and Snow Detection Segmentation. Remote Sens. 2024, 16, 112. [Google Scholar] [CrossRef]
- Wei, D.; Hou, D.; Zhou, X.; Chen, J. Change detection using a texture feature space outlier index from mono-temporal remote sensing images and vector data. Remote Sens. 2021, 13, 3857. [Google Scholar] [CrossRef]
- Shafique, A.; Cao, G.; Khan, Z.; Asad, M.; Aslam, M. Deep learning-based change detection in remote sensing images: A review. Remote Sens. 2022, 14, 871. [Google Scholar] [CrossRef]
- Ding, A.; Zhang, Q.; Zhou, X.; Dai, B. Automatic recognition of landslide based on CNN and texture change detection. In Proceedings of the 2016 31st Youth Academic Annual Conference of Chinese Association of Automation (YAC), Wuhan, China, 11–13 November 2016; IEEE: Toulouse, France, 2016; pp. 444–448. [Google Scholar]
- Hou, B.; Wang, Y.; Liu, Q. Change detection based on deep features and low rank. IEEE Geosci. Remote Sens. Lett. 2017, 14, 2418–2422. [Google Scholar] [CrossRef]
- Simonyan, K.; Zisserman, A. Very deep convolutional networks for large-scale image recognition. arXiv 2014, arXiv:1409.1556. [Google Scholar]
- Wang, Q.; Yuan, Z.; Du, Q.; Li, X. GETNET: A general end-to-end 2-D CNN framework for hyperspectral image change detection. IEEE Trans. Geosci. Remote Sens. 2018, 57, 3–13. [Google Scholar] [CrossRef]
- Zhang, W.; Lu, X. The spectral-spatial joint learning for change detection in multispectral imagery. Remote Sens. 2019, 11, 240. [Google Scholar] [CrossRef]
- Chen, H.; Shi, Z. A spatial-temporal attention-based method and a new dataset for remote sensing image change detection. Remote Sens. 2020, 12, 1662. [Google Scholar] [CrossRef]
- Chen, J.; Yuan, Z.; Peng, J.; Chen, L.; Huang, H.; Zhu, J.; Liu, Y.; Li, H. DASNet: Dual attentive fully convolutional Siamese networks for change detection in high-resolution satellite images. IEEE J. Sel. Top. Appl. Earth Obs. Remote Sens. 2020, 14, 1194–1206. [Google Scholar] [CrossRef]
- Chen, H.; Qi, Z.; Shi, Z. Remote sensing image change detection with transformers. IEEE Trans. Geosci. Remote Sens. 2021, 60, 1–14. [Google Scholar] [CrossRef]
- Chen, P.; Zhang, B.; Hong, D.; Chen, Z.; Yang, X.; Li, B. FCCDN: Feature constraint network for VHR image change detection. ISPRS J. Photogramm. Remote Sens. 2022, 187, 101–119. [Google Scholar] [CrossRef]
- Shen, Q.; Huang, J.; Wang, M.; Tao, S.; Yang, R.; Zhang, X. Semantic feature-constrained multitask siamese network for building change detection in high-spatial-resolution remote sensing imagery. ISPRS J. Photogramm. Remote Sens. 2022, 189, 78–94. [Google Scholar] [CrossRef]
- Liao, C.; Hu, H.; Yuan, X.; Li, H.; Liu, C.; Liu, C.; Fu, G.; Ding, Y.; Zhu, Q. BCE-Net: Reliable building footprints change extraction based on historical map and up-to-date images using contrastive learning. ISPRS J. Photogramm. Remote Sens. 2023, 201, 138–152. [Google Scholar] [CrossRef]
- Long, J.; Shelhamer, E.; Darrell, T. Fully convolutional networks for semantic segmentation. In Proceedings of the IEEE Conference on Computer Vision and Pattern Recognition, Boston, MA, USA, 7–12 June 2015; pp. 3431–3440. [Google Scholar]
- Ji, H.; Xia, M.; Zhang, D.; Lin, H. Multi-Supervised Feature Fusion Attention Network for Clouds and Shadows Detection. ISPRS Int. J. Geo-Inf. 2023, 12, 247. [Google Scholar] [CrossRef]
- Alcantarilla, P.F.; Stent, S.; Ros, G.; Arroyo, R.; Gherardi, R. Street-view change detection with deconvolutional networks. Auton. Robot. 2018, 42, 1301–1322. [Google Scholar] [CrossRef]
- Peng, D.; Zhang, Y.; Guan, H. End-to-end change detection for high resolution satellite images using improved UNet++. Remote Sens. 2019, 11, 1382. [Google Scholar] [CrossRef]
- Daudt, R.C.; Le Saux, B.; Boulch, A. Fully convolutional siamese networks for change detection. In Proceedings of the 2018 25th IEEE International Conference on Image Processing (ICIP), Athens, Greece, 7–10 October 2018; IEEE: Toulouse, France, 2018; pp. 4063–4067. [Google Scholar]
- Guo, E.; Fu, X.; Zhu, J.; Deng, M.; Liu, Y.; Zhu, Q.; Li, H. Learning to measure change: Fully convolutional siamese metric networks for scene change detection. arXiv 2018, arXiv:1810.09111. [Google Scholar]
- Hussain, M.; Chen, D.; Cheng, A.; Wei, H.; Stanley, D. Change detection from remotely sensed images: From pixel-based to object-based approaches. ISPRS J. Photogramm. Remote Sens. 2013, 80, 91–106. [Google Scholar] [CrossRef]
- Shi, W.; Zhang, M.; Zhang, R.; Chen, S.; Zhan, Z. Change detection based on artificial intelligence: State-of-the-art and challenges. Remote Sens. 2020, 12, 1688. [Google Scholar] [CrossRef]
- He, K.; Zhang, X.; Ren, S.; Sun, J. Deep residual learning for image recognition. In Proceedings of the IEEE Conference on Computer Vision and Pattern Recognition, Las Vegas, NV, USA, 27–30 June 2016; pp. 770–778. [Google Scholar]
- Hou, Q.; Zhang, L.; Cheng, M.M.; Feng, J. Strip pooling: Rethinking spatial pooling for scene parsing. In Proceedings of the IEEE/CVF Conference on Computer Vision and Pattern Recognition, Seattle, WA, USA, 13–19 June 2020; pp. 4003–4012. [Google Scholar]
- Jiang, S.; Dong, R.; Wang, J.; Xia, M. Credit Card Fraud Detection Based on Unsupervised Attentional Anomaly Detection Network. Systems 2023, 11, 305. [Google Scholar] [CrossRef]
- Song, L.; Xia, M.; Jin, J.; Qian, M.; Zhang, Y. SUACDNet: Attentional change detection network based on siamese U-shaped structure. Int. J. Appl. Earth Obs. Geoinf. 2021, 105, 102597. [Google Scholar] [CrossRef]
- Lebedev, M.; Vizilter, Y.V.; Vygolov, O.; Knyaz, V.A.; Rubis, A.Y. Change detection in remote sensing images using conditional adversarial networks. Int. Arch. Photogramm. Remote Sens. Spat. Inf. Sci. 2018, 42, 565–571. [Google Scholar] [CrossRef]
- Qian, J.; Xia, M.; Zhang, Y.; Liu, J.; Xu, Y. Tcdnet: Trilateral change detection network for google earth image. Remote Sens. 2020, 12, 2669. [Google Scholar] [CrossRef]
- Fang, S.; Li, K.; Shao, J.; Li, Z. SNUNet-CD: A densely connected Siamese network for change detection of VHR images. IEEE Geosci. Remote Sens. Lett. 2021, 19, 1–5. [Google Scholar] [CrossRef]
- Varghese, A.; Gubbi, J.; Ramaswamy, A.; Balamuralidhar, P. ChangeNet: A deep learning architecture for visual change detection. In Proceedings of the European Conference on Computer Vision (ECCV) Workshops, Munich, Germany, 8–14 September 2018. [Google Scholar]
- Li, Z.; Tang, C.; Wang, L.; Zomaya, A.Y. Remote sensing change detection via temporal feature interaction and guided refinement. IEEE Trans. Geosci. Remote Sens. 2022, 60, 1–11. [Google Scholar] [CrossRef]
- Chu, S.; Li, P.; Xia, M. MFGAN: Multi feature guided aggregation network for remote sensing image. Neural Comput. Appl. 2022, 34, 10157–10173. [Google Scholar] [CrossRef]
- Bandara, W.G.C.; Patel, V.M. A transformer-based siamese network for change detection. In Proceedings of the IGARSS 2022–2022 IEEE International Geoscience and Remote Sensing Symposium, Kuala Lumpur, Malaysia, 17–22 July 2022; IEEE: Toulouse, France, 2022; pp. 207–210. [Google Scholar]


| Method | PR (%) | RC (%) | IoU (%) | F1 (%) |
|---|---|---|---|---|
| ResNet18 | 88.63 | 77.15 | 70.19 | 82.46 |
| ResNet34 | 89.57 | 79.52 | 72.79 | 84.25 |
| ResNet50 | 87.95 | 78.11 | 71.07 | 82.70 |
| ResNet101 | 87.66 | 78.98 | 71.09 | 83.12 |
| Method | PR (%) | RC (%) | IoU (%) | F1 (%) |
|---|---|---|---|---|
| Backbone | 86.41 | 77.41 | 69.01 | 81.68 |
| Backbone+DFM | 88.76 | 77.54 | 70.61 | 82.77 |
| Backbone+DFM+ARM | 89.21 | 79.08 | 72.18 | 83.84 |
| Backbone+DFM+ARM+CSFM | 89.57 | 79.52 | 72.79 | 84.25 |
| Method | PR (%) | RC (%) | IoU (%) | F1 (%) | FLOPs (G) | Time (ms) |
|---|---|---|---|---|---|---|
| FC-EF [46] | 77.46 | 43.75 | 38.81 | 55.91 | 5.43 | 7.36 |
| FC-Siam-Diff [46] | 77.63 | 46.26 | 40.82 | 57.97 | 8.97 | 5.06 |
| FC-Siam-Conc [46] | 82.78 | 43.28 | 42.21 | 59.37 | 9.48 | 5.32 |
| TCDNet [55] | 88.64 | 74.37 | 67.91 | 80.89 | 7.96 | 8.51 |
| SNUNet [56] | 84.68 | 78.82 | 68.98 | 81.64 | 96.67 | 8.73 |
| STANet [36] | 86.55 | 77.36 | 69.06 | 81.69 | 53.03 | 19.45 |
| DASNet [37] | 87.59 | 77.22 | 69.61 | 82.08 | 103.54 | 17.62 |
| ChangNet [57] | 88.27 | 76.81 | 69.69 | 82.15 | 40.36 | 15.98 |
| TFI-GR [58] | 88.98 | 76.38 | 69.78 | 82.19 | 17.78 | 12.53 |
| BIT [38] | 87.23 | 78.66 | 70.52 | 82.73 | 98.61 | 8.96 |
| MFGAN [59] | 88.65 | 77.97 | 70.89 | 82.97 | 49.74 | 8.95 |
| ChangeFormer [60] | 87.81 | 79.13 | 71.29 | 83.24 | 78.47 | 9.62 |
| MDANet (our) | 89.57 | 79.52 | 72.79 | 84.25 | 7.42 | 15.21 |
| Method | PR (%) | RC (%) | IoU (%) | F1 (%) |
|---|---|---|---|---|
| FC-EF | 84.12 | 83.82 | 72.37 | 83.97 |
| FC-Siam-Diff | 87.69 | 81.74 | 73.33 | 84.61 |
| FC-Siam-Conc | 88.27 | 84.06 | 75.61 | 86.11 |
| TCDNet | 89.99 | 85.27 | 77.88 | 87.57 |
| SNUNet | 90.67 | 85.52 | 78.61 | 88.02 |
| STANet | 90.82 | 85.97 | 78.95 | 88.23 |
| DASNet | 89.93 | 82.92 | 78.38 | 87.88 |
| ChangNet | 87.81 | 89.12 | 79.31 | 88.46 |
| TFI-GR | 89.59 | 89.15 | 80.78 | 89.37 |
| BIT | 90.94 | 87.29 | 80.31 | 89.08 |
| MFGAN | 88.98 | 89.01 | 80.17 | 88.99 |
| ChangeFormer | 89.57 | 89.73 | 81.24 | 89.65 |
| MDANet (our) | 90.99 | 90.35 | 82.94 | 90.67 |
| Method | PR (%) | RC (%) | IoU (%) | F1 (%) |
|---|---|---|---|---|
| FC-EF | 79.79 | 61.28 | 53.05 | 69.32 |
| FC-Siam-Diff | 74.83 | 70.64 | 57.08 | 72.67 |
| FC-Siam-Conc | 79.49 | 65.05 | 55.70 | 71.55 |
| TCDNet | 84.39 | 89.79 | 77.01 | 87.01 |
| SNUNet | 84.85 | 89.82 | 77.41 | 87.26 |
| STANet | 83.32 | 91.35 | 78.08 | 87.69 |
| DASNet | 83.49 | 91.12 | 77.21 | 87.14 |
| ChangNet | 83.34 | 89.31 | 75.78 | 86.22 |
| TFI-GR | 83.78 | 93.84 | 79.42 | 88.53 |
| BIT | 83.52 | 93.95 | 79.26 | 88.43 |
| MFGAN | 83.36 | 92.26 | 77.91 | 87.58 |
| ChangeFormer | 84.69 | 93.86 | 80.25 | 89.04 |
| MDANet(our) | 85.59 | 94.03 | 81.18 | 89.61 |
Disclaimer/Publisher’s Note: The statements, opinions and data contained in all publications are solely those of the individual author(s) and contributor(s) and not of MDPI and/or the editor(s). MDPI and/or the editor(s) disclaim responsibility for any injury to people or property resulting from any ideas, methods, instructions or products referred to in the content. |
© 2024 by the authors. Licensee MDPI, Basel, Switzerland. This article is an open access article distributed under the terms and conditions of the Creative Commons Attribution (CC BY) license (https://creativecommons.org/licenses/by/4.0/).
Share and Cite
Jiang, S.; Lin, H.; Ren, H.; Hu, Z.; Weng, L.; Xia, M. MDANet: A High-Resolution City Change Detection Network Based on Difference and Attention Mechanisms under Multi-Scale Feature Fusion. Remote Sens. 2024, 16, 1387. https://doi.org/10.3390/rs16081387
Jiang S, Lin H, Ren H, Hu Z, Weng L, Xia M. MDANet: A High-Resolution City Change Detection Network Based on Difference and Attention Mechanisms under Multi-Scale Feature Fusion. Remote Sensing. 2024; 16(8):1387. https://doi.org/10.3390/rs16081387
Chicago/Turabian StyleJiang, Shanshan, Haifeng Lin, Hongjin Ren, Ziwei Hu, Liguo Weng, and Min Xia. 2024. "MDANet: A High-Resolution City Change Detection Network Based on Difference and Attention Mechanisms under Multi-Scale Feature Fusion" Remote Sensing 16, no. 8: 1387. https://doi.org/10.3390/rs16081387
APA StyleJiang, S., Lin, H., Ren, H., Hu, Z., Weng, L., & Xia, M. (2024). MDANet: A High-Resolution City Change Detection Network Based on Difference and Attention Mechanisms under Multi-Scale Feature Fusion. Remote Sensing, 16(8), 1387. https://doi.org/10.3390/rs16081387